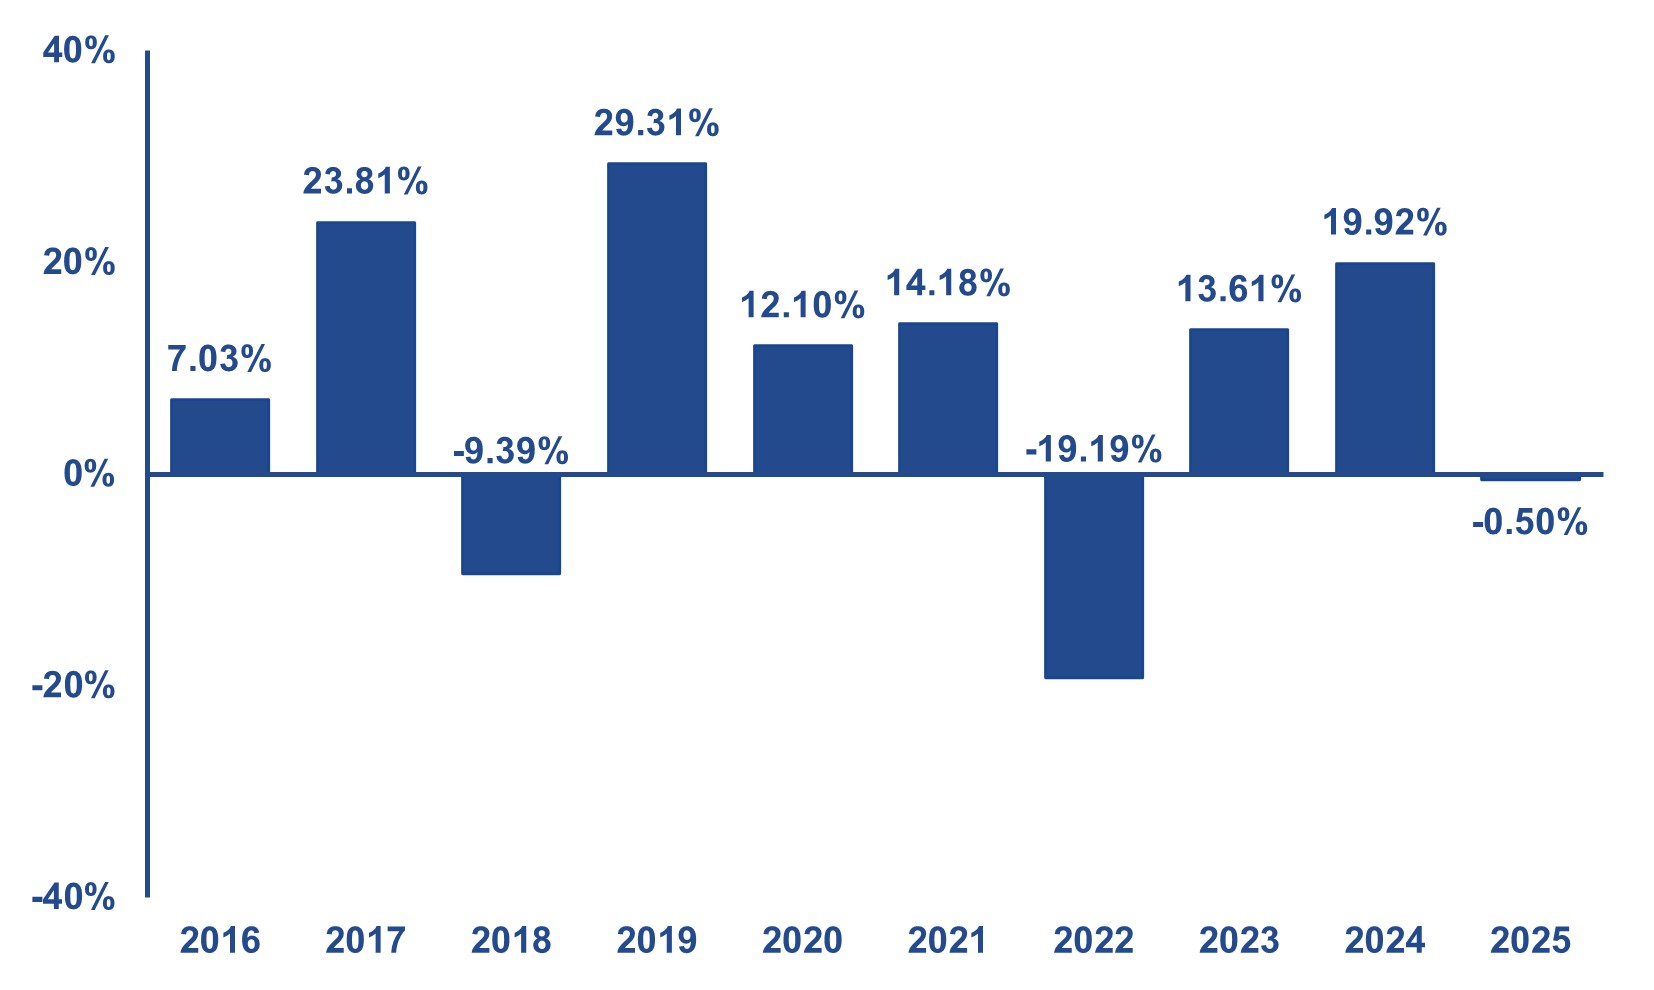
The following information provides some indication of the risks of investing in the American Opportunities Fund by showing how the investment results of the Fund’s Class I shares varied from year to year. Because the Fund’s ETF Class shares had not commenced operations as of the date of this Prospectus, the bar chart shows how the annual total returns for Class I shares have been different in each full year shown. Class I shares are a mutual fund class of shares of the Fund and are not offered in this Prospectus. Class I shares would have substantially similar annual returns to ETF Class shares because the shares are invested in the same portfolio of securities and the annual returns at NAV (assuming ETF Class shares are bought and sold without any premium or discount) would differ only to the extent that Class I shares do not have the same expenses as the ETF Class shares (ETF Class shares have lower total expenses than Class I shares). Performance information for ETF Class shares will be provided after such shares have one full calendar year of performance.
The average annual total return figures compare Class I share performance to the S&P 500 Index—Total Return, a broad-based securities market index that represents the overall applicable market in which the Fund invests, and the Russell 1000 Value Index—Total Return, an additional index that represents the market sectors which Thornburg believes are more representative of the Fund’s investment universe. These indexes are not actively managed and are not available for direct investment. As of March 23, 2026, the Fund no longer compares its returns to the Russell 3000 Index—Total Return or Russell 2500 Index—Total Return because the current indices better reflect the Fund’s current investment universe (as described below).
The performance information shown below is as of the calendar year ended December 31, 2025. Before March 23, 2026, the Fund was managed with a different principal investment strategy under the name “Thornburg Small/Mid Cap Core Fund” and may have achieved different performance results under its current principal investment strategy from the performance shown for periods before that date. Past performance (before and after taxes) is not necessarily an indication of how the Fund will perform in the future. The bar charts and performance tables assume reinvestment of dividends and distributions. Updated performance information may be obtained on the Thornburg website at Thornburg.com or by calling 1-800-847-0200.
| Total Returns |
Quarter ended | |
| Highest Quarterly Results | 18.99% | 6/30/2020 |
| Lowest Quarterly Results | -26.24% | 3/31/2020 |
| CLASS I SHARES | 1 YEAR | 5 YEARS | 10 YEARS |
| Return Before Taxes | -0.50% | 4.58% | 8.09% |
| Return After Taxes on Distributions | -0.50% | 2.91% | 7.09% |
| Return After Taxes on Distributions and Sale of Fund Shares | -0.30% | 3.17% | 6.30% |
| S&P
500 Index—Total Return (reflects no deduction for fees, expenses, or taxes) |
17.88% | 14.42% | 14.82% |
| Russell
1000 Value Index—Total Return (reflects no deduction for fees, expenses, or taxes) |
15.91% | 11.33% | 10.53% |
| Russell
3000 Index-Total Return (reflects no deduction for fees, expenses, or taxes) |
17.15% | 13.15% | 14.29% |
| Russell
2500 Index-Total Return (reflects no deduction for fees, expenses, or taxes) |
11.91% | 7.26% | 10.40% |
After-tax returns are calculated using the highest historical individual federal marginal income tax rates, and do not reflect state or local income taxes. Actual after-tax returns depend on an investor’s own tax situation and may differ from the returns shown, and after-tax returns shown are not relevant to investors who hold their Fund shares through tax-deferred arrangements, such as 401(k) plans or individual retirement accounts. The after-tax returns shown relate only to Class I shares, and after-tax returns for other share classes will vary.
The performance information shown above may include gains attributable to the Fund’s investments in shares of companies through initial public offerings (“IPOs”). There can be no assurance that the Fund will have continued access to profitable IPOs and, as the Fund’s assets grow, the impact of the Fund’s investment in IPOs on the performance of the Fund may decline.
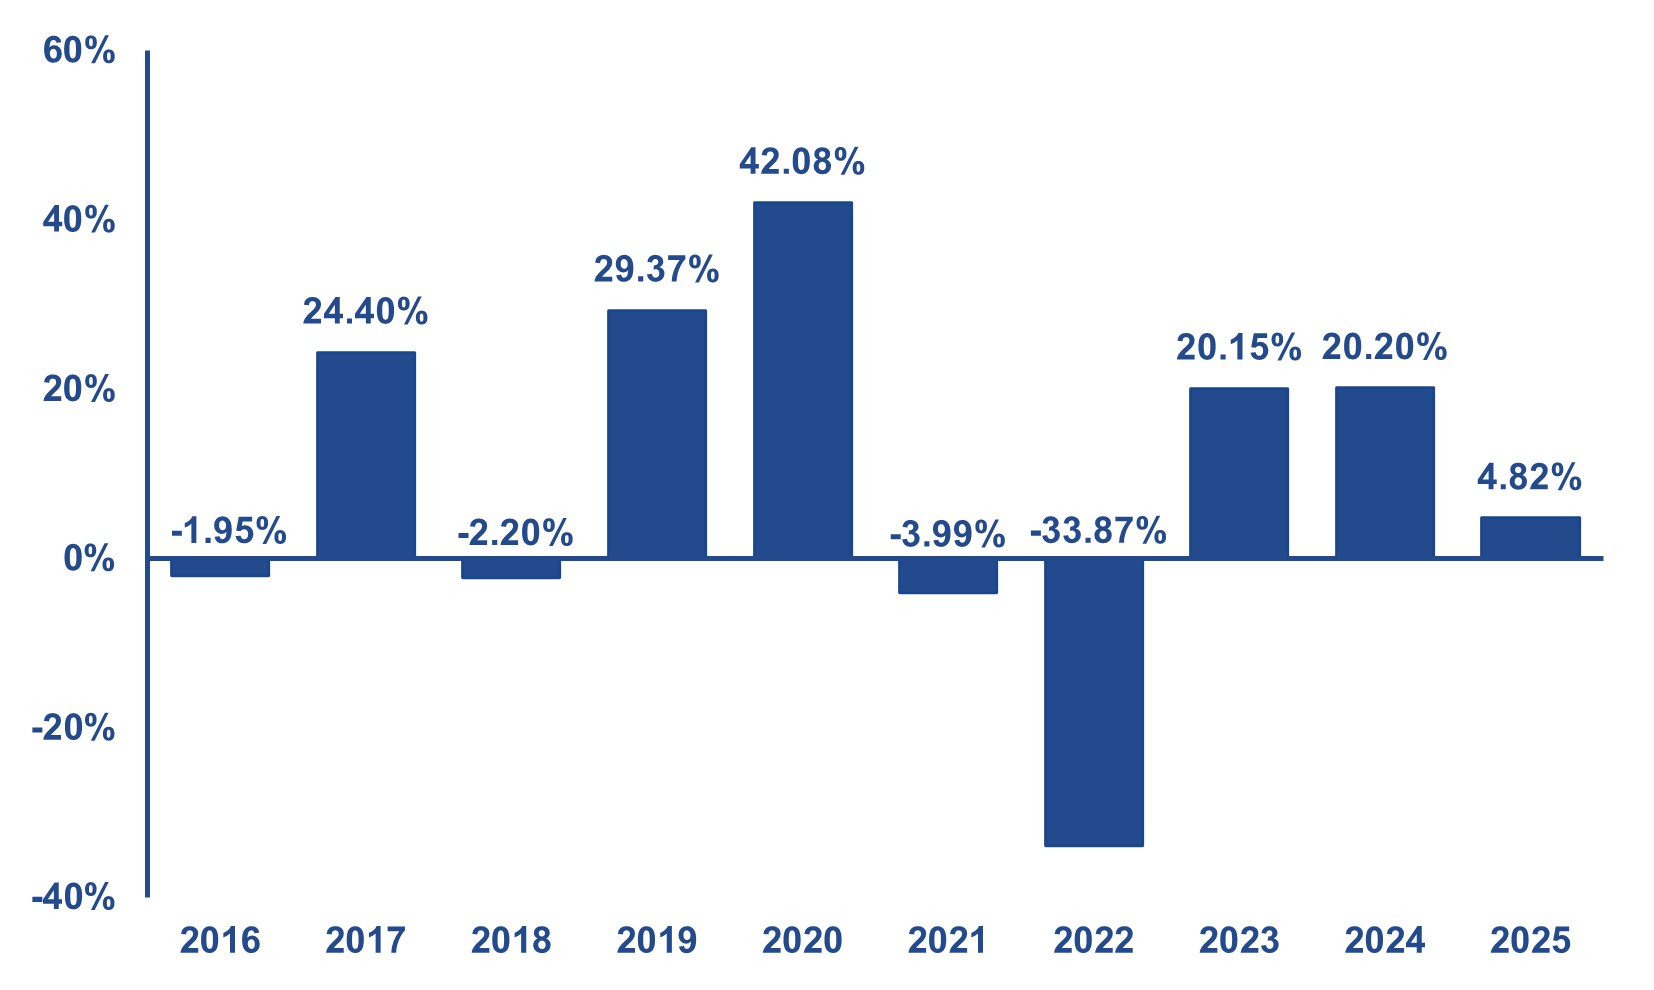
The following information provides some indication of the risks of investing in the Focus Growth Fund by showing how the investment results of the Fund’s Class I shares varied from year to year. Because the Fund’s ETF Class shares had not commenced operations as of the date of this Prospectus, the bar chart shows how the annual total returns for Class I shares have been different in each full year shown. Class I shares are a mutual fund class of shares of the Fund and are not offered in this Prospectus. Class I shares would have substantially similar annual returns to ETF Class shares because the shares are invested in the same portfolio of securities and the annual returns at NAV (assuming ETF Class shares are bought and sold without any premium or discount) would differ only to the extent that Class I shares do not have the same expenses as the ETF Class shares (ETF Class shares have lower total expenses than Class I shares). Performance information for ETF Class shares will be provided after such shares have one full calendar year of performance.
The average annual total return figures compare Class I share performance to the Russell 1000 Index-Total Return, a broad-based securities market index that represents the overall applicable market in which the Fund invests, and the Russell 1000 Growth Index-Total Return, an additional index that represents the market sectors which Thornburg believes are more representative of the Fund’s investment universe. These indexes are not actively managed and are not available for direct investment. As of March 23, 2026, the Fund no longer compares its returns to the Russell 3000 Index—Total Return or Russell 2500 Growth Index—Total Return because the current indices better reflect the Fund’s current investment universe (as described below).
The performance information shown below is as of the calendar year ended December 31, 2025. Before March 23, 2026, the Fund was managed with a different principal investment strategy under the name “Thornburg Small/Mid Cap Growth Fund” and may have achieved different performance results under its current principal investment strategy from the performance shown for periods before that date. Past performance (before and after taxes) is not necessarily an indication of how the Fund will perform in the future. The bar charts and performance tables assume reinvestment of dividends and distributions. Updated performance information may be obtained on the Thornburg website at Thornburg.com or by calling 1-800-847-0200.
| Total Returns |
Quarter ended | |
| Highest Quarterly Results | 31.07% | 6/30/2020 |
| Lowest Quarterly Results | -24.80% | 6/30/2022 |
| CLASS I SHARES | 1 YEAR | 5 YEARS | 10 YEARS |
| Return Before Taxes | 4.82% | -0.79% | 7.74% |
| Return After Taxes on Distributions | 4.82% | -2.30% | 6.54% |
| Return After Taxes on Distributions and Sale of Fund Shares | 2.85% | -0.54% | 6.27% |
| Russell
1000 Index-Total Return (reflects no deduction for fees, expenses, or taxes) |
17.37% | 13.59% | 14.59% |
| Russell
1000 Growth Index-Total Return (reflects no deduction for fees, expenses, or taxes) |
18.56% | 15.32% | 18.13% |
| Russell
3000 Index-Total Return (reflects no deduction for fees, expenses, or taxes) |
17.15% | 13.15% | 14.29% |
| Russell
2500 Growth Index-Total Return (reflects no deduction for fees, expenses, or taxes) |
10.31% | 2.98% | 10.55% |
After-tax returns are calculated using the highest historical individual federal marginal income tax rates, and do not reflect state or local income taxes. Actual after-tax returns depend on an investor’s own tax situation and may differ from the returns shown, and after-tax returns shown are not relevant to investors who hold their Fund shares through tax-deferred arrangements, such as 401(k) plans or individual retirement accounts. The after-tax returns shown relate only to Class I shares, and after-tax returns for other share classes will vary.