Shareholder Report
|
12 Months Ended |
|
Jan. 31, 2026
USD ($)
Holding
|
Jan. 31, 2025 |
| Shareholder Report [Line Items] |
|
|
|
| Document Type |
|
N-CSR
|
|
| Amendment Flag |
|
false
|
|
| Registrant Name |
|
Vanguard
Fixed Income Securities Funds
|
|
| Entity Central Index Key |
|
0000106444
|
|
| Entity Investment Company Type |
|
N-1A
|
|
| Document Period End Date |
|
Jan. 31, 2026
|
|
| Shareholder Report Annual or Semi-Annual |
|
Annual Shareholder Report
|
|
| C000007089 |
|
|
|
| Shareholder Report [Line Items] |
|
|
|
| Fund Name |
|
Short-Term Treasury Fund
|
|
| Class Name |
|
Investor Shares
|
|
| Trading Symbol |
|
VFISX
|
|
| Annual or Semi-Annual Statement [Text Block] |
|
This annual shareholder report contains important information about Vanguard Short-Term Treasury Fund (the "Fund") for the period of February 1, 2025, to January 31, 2026.
|
|
| Additional Information [Text Block] |
|
You can find additional information about the Fund at https://personal1.vanguard.com/ngf-next-gen-form-webapp/fund-literature. You can also request this information by contacting us at 800-662-7447.
|
|
| Material Fund Change Notice [Text Block] |
|
The report describes changes to the Fund that occurred during the reporting period.
|
|
| Additional Information Phone Number |
|
<span style="white-space: nowrap; box-sizing: border-box; color: rgb(0, 0, 0); display: inline; flex-wrap: nowrap; font-size: 10.6667px; font-weight: 400; grid-area: auto; line-height: 16px; margin: 0px; overflow: visible; text-align: left; text-align-last: auto;"> 800-662-7447</span>
|
|
| Additional Information Website |
|
<span style="white-space: nowrap; box-sizing: border-box; color: rgb(0, 0, 0); display: inline; flex-wrap: nowrap; font-size: 10.6667px; font-weight: 400; grid-area: auto; line-height: 16px; margin: 0px; overflow: visible; text-align: left; text-align-last: auto;"><span style="box-sizing: border-box; color: rgb(0, 0, 0); display: inline; flex-wrap: nowrap; font-size: 10.6667px; font-weight: 400; grid-area: auto; line-height: 16px; margin: 0px; overflow: visible; text-align: left; text-align-last: auto; white-space-collapse: collapse;"><span style="text-decoration: underline; box-sizing: border-box; color: rgb(0, 0, 0); display: inline; flex-wrap: nowrap; font-size: 10.6667px; font-weight: 400; grid-area: auto; line-height: 16px; margin: 0px; overflow: visible; text-align: left; text-align-last: auto; white-space-collapse: collapse;">https://personal1.vanguard.com/ngf-next-gen-form-webapp/fund-literature</span></span></span>
|
|
| Expenses [Text Block] |
|
What were the Fund costs for the last year?(based on a hypothetical $10,000 investment) Table SummaryShare Class Name | Costs of a $10,000 investment | Costs paid as a percentage of a $10,000 investment |
|---|
Investor Shares | $21 | 0.20% |
|---|
|
|
| Expenses Paid, Amount |
|
$ 21
|
|
| Expense Ratio, Percent |
|
0.20%
|
|
| Factors Affecting Performance [Text Block] |
|
How did the Fund perform during the reporting period? For the 12 months ended January 31, 2026, the Fund underperformed its benchmark. The first part of the period was marked by volatility in the financial markets amid fears that U.S. tariff announcements might spark trade wars and drag down global growth. Despite these concerns, markets posted solid gains for the 12 months, buoyed by optimism surrounding artificial intelligence, robust corporate earnings, and a more dovish monetary policy. The European Central Bank and the Federal Reserve each cut interest rates three times, while the Bank of England lowered rates four times. U.S. Treasury yields ended the period lower for all but the longest-dated maturities. The yield on the 2-year U.S. Treasury bill fell 0.67 percentage points to end the period at 3.52%, while the yield on the bellwether 10-year U.S. Treasury note declined a more modest 0.30 percentage points to finish at 4.24%. The Fund’s underperformance was driven by its structurally short duration given the fall in short-term interest rates over the period. Curve positioning also detracted.
|
|
| Performance Past Does Not Indicate Future [Text] |
|
Keep in mind that the Fund's past performance does not indicate how the Fund will perform in the future.
|
|
| Line Graph [Table Text Block] |
|
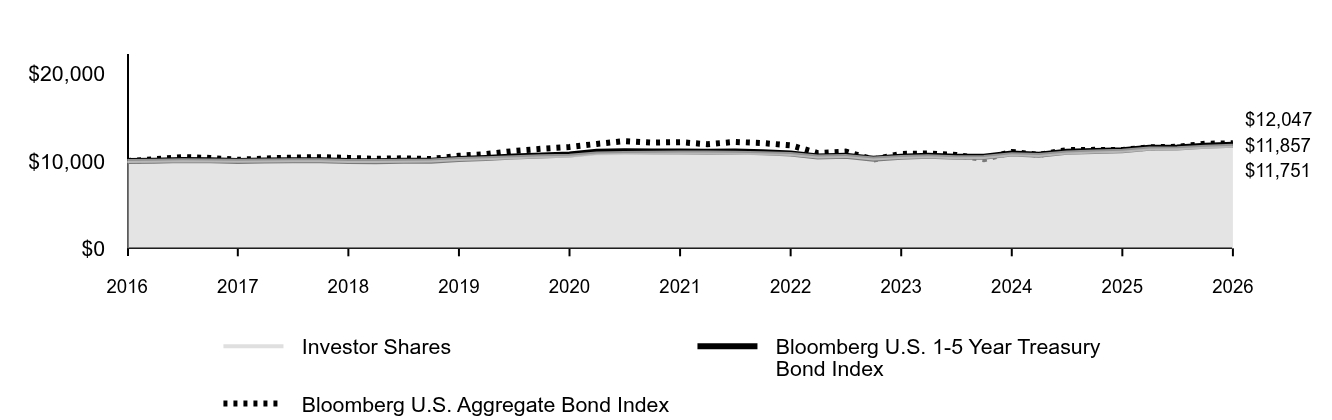 Table Summary | Investor Shares | Bloomberg U.S. 1-5 Year Treasury Bond Index | Bloomberg U.S. Aggregate Bond Index |
|---|
2016 | $10,000 | $10,000 | $10,000 |
|---|
2016 | $10,038 | $10,047 | $10,202 |
|---|
2016 | $10,094 | $10,126 | $10,454 |
|---|
2016 | $10,076 | $10,090 | $10,356 |
|---|
2017 | $10,043 | $10,011 | $10,145 |
|---|
2017 | $10,071 | $10,064 | $10,287 |
|---|
2017 | $10,099 | $10,100 | $10,400 |
|---|
2017 | $10,090 | $10,091 | $10,450 |
|---|
2018 | $10,011 | $10,001 | $10,363 |
|---|
2018 | $10,002 | $9,984 | $10,254 |
|---|
2018 | $10,038 | $10,022 | $10,317 |
|---|
2018 | $10,064 | $10,049 | $10,235 |
|---|
2019 | $10,222 | $10,246 | $10,597 |
|---|
2019 | $10,316 | $10,354 | $10,797 |
|---|
2019 | $10,447 | $10,511 | $11,151 |
|---|
2019 | $10,547 | $10,644 | $11,413 |
|---|
2020 | $10,621 | $10,743 | $11,619 |
|---|
2020 | $10,864 | $11,072 | $11,967 |
|---|
2020 | $10,935 | $11,115 | $12,279 |
|---|
2020 | $10,955 | $11,096 | $12,119 |
|---|
2021 | $10,977 | $11,109 | $12,167 |
|---|
2021 | $10,974 | $11,066 | $11,935 |
|---|
2021 | $10,963 | $11,102 | $12,193 |
|---|
2021 | $10,905 | $11,005 | $12,061 |
|---|
2022 | $10,802 | $10,875 | $11,806 |
|---|
2022 | $10,532 | $10,519 | $10,919 |
|---|
2022 | $10,593 | $10,602 | $11,082 |
|---|
2022 | $10,296 | $10,261 | $10,170 |
|---|
2023 | $10,469 | $10,493 | $10,819 |
|---|
2023 | $10,538 | $10,617 | $10,873 |
|---|
2023 | $10,449 | $10,507 | $10,708 |
|---|
2023 | $10,452 | $10,504 | $10,206 |
|---|
2024 | $10,769 | $10,865 | $11,046 |
|---|
2024 | $10,695 | $10,734 | $10,713 |
|---|
2024 | $10,987 | $11,073 | $11,255 |
|---|
2024 | $11,091 | $11,158 | $11,282 |
|---|
2025 | $11,182 | $11,244 | $11,274 |
|---|
2025 | $11,432 | $11,533 | $11,572 |
|---|
2025 | $11,466 | $11,557 | $11,635 |
|---|
2025 | $11,645 | $11,751 | $11,977 |
|---|
2026 | $11,751 | $11,857 | $12,047 |
|---|
|
|
| Average Annual Return [Table Text Block] |
|
Table Summary | 1 Year | 5 Years | 10 Years |
|---|
Investor Shares | 5.09% | 1.37% | 1.63% |
|---|
Bloomberg U.S. 1-5 Year Treasury Bond Index | 5.44% | 1.31% | 1.72% |
|---|
Bloomberg U.S. Aggregate Bond Index | 6.85% | -0.20% | 1.88% |
|---|
|
|
| No Deduction of Taxes [Text Block] |
|
The graph and returns shown do not reflect taxes that a shareholder would pay on fund distributions or on the sale of fund shares.
|
|
| Material Change Date |
|
|
Jan. 31, 2025
|
| Updated Performance Information Location [Text Block] |
|
Updated performance information is available on our website at vanguard.com/performance or by calling Vanguard toll-free at 800-662-7447.
|
|
| AssetsNet |
|
$ 5,832,000,000
|
|
| Holdings Count | Holding |
|
274
|
|
| Advisory Fees Paid, Amount |
|
$ 693,000
|
|
| InvestmentCompanyPortfolioTurnover |
|
421.00%
|
|
| Additional Fund Statistics [Text Block] |
|
Fund Statistics
(as of January 31, 2026)Table SummaryFund Net Assets (in millions) | $5,832 |
|---|
Number of Portfolio Holdings | 274 |
|---|
Portfolio Turnover Rate | 421% |
|---|
Total Investment Advisory Fees (in thousands) | $693 |
|---|
|
|
| Holdings [Text Block] |
|
Portfolio Composition % of Net Assets
(as of January 31, 2026)Table SummaryAgency Bonds and Notes | 2.7% |
|---|
Asset-Backed/Commercial Mortgage-Backed Securities | 1.6% |
|---|
Conventional Mortgage-Backed Securities | 13.2% |
|---|
Nonconventional Mortgage-Backed Securities | 0.2% |
|---|
U.S. Government Securities | 80.1% |
|---|
Other Assets and Liabilities—NetFootnote Reference | 2.2% |
|---|
This table reflects the Fund's investments, including short-term investments, derivatives and other assets and liabilities. |
|
| Material Fund Change [Text Block] |
|
How has the Fund changed?Effective January 12, 2026, The Vanguard Group, Inc. exercises portfolio management responsibilities for the fund through its wholly-owned subsidiary, Vanguard Capital Management, LLC. This is a summary of certain changes to the Fund since January 31, 2025. For more complete information, you may review the Fund’s next prospectus, which we expect to be available by May 31, 2026, at https://personal1.vanguard.com/ngf-next-gen-form-webapp/fund-literature or upon request at 800-662-7447. |
|
| Material Fund Change Adviser [Text Block] |
|
Effective January 12, 2026, The Vanguard Group, Inc. exercises portfolio management responsibilities for the fund through its wholly-owned subsidiary, Vanguard Capital Management, LLC.
|
|
| Summary of Change Legend [Text Block] |
|
This is a summary of certain changes to the Fund since January 31, 2025. For more complete information, you may review the Fund’s next prospectus, which we expect to be available by May 31, 2026, at https://personal1.vanguard.com/ngf-next-gen-form-webapp/fund-literature or upon request at 800-662-7447.
|
|
| Updated Prospectus Phone Number |
|
800-662-7447
|
|
| Updated Prospectus Web Address |
|
https://personal1.vanguard.com/ngf-next-gen-form-webapp/fund-literature
|
|
| C000007090 |
|
|
|
| Shareholder Report [Line Items] |
|
|
|
| Fund Name |
|
Short-Term Treasury Fund
|
|
| Class Name |
|
Admiral™ Shares
|
|
| Trading Symbol |
|
VFIRX
|
|
| Annual or Semi-Annual Statement [Text Block] |
|
This annual shareholder report contains important information about Vanguard Short-Term Treasury Fund (the "Fund") for the period of February 1, 2025, to January 31, 2026.
|
|
| Additional Information [Text Block] |
|
You can find additional information about the Fund at https://personal1.vanguard.com/ngf-next-gen-form-webapp/fund-literature. You can also request this information by contacting us at 800-662-7447.
|
|
| Material Fund Change Notice [Text Block] |
|
The report describes changes to the Fund that occurred during the reporting period.
|
|
| Additional Information Phone Number |
|
<span style="white-space: nowrap; box-sizing: border-box; color: rgb(0, 0, 0); display: inline; flex-wrap: nowrap; font-size: 10.6667px; font-weight: 400; grid-area: auto; line-height: 16px; margin: 0px; overflow: visible; text-align: left; text-align-last: auto;"> 800-662-7447</span>
|
|
| Additional Information Website |
|
<span style="white-space: nowrap; box-sizing: border-box; color: rgb(0, 0, 0); display: inline; flex-wrap: nowrap; font-size: 10.6667px; font-weight: 400; grid-area: auto; line-height: 16px; margin: 0px; overflow: visible; text-align: left; text-align-last: auto;"><span style="box-sizing: border-box; color: rgb(0, 0, 0); display: inline; flex-wrap: nowrap; font-size: 10.6667px; font-weight: 400; grid-area: auto; line-height: 16px; margin: 0px; overflow: visible; text-align: left; text-align-last: auto; white-space-collapse: collapse;"><span style="text-decoration: underline; box-sizing: border-box; color: rgb(0, 0, 0); display: inline; flex-wrap: nowrap; font-size: 10.6667px; font-weight: 400; grid-area: auto; line-height: 16px; margin: 0px; overflow: visible; text-align: left; text-align-last: auto; white-space-collapse: collapse;">https://personal1.vanguard.com/ngf-next-gen-form-webapp/fund-literature</span></span></span>
|
|
| Expenses [Text Block] |
|
What were the Fund costs for the last year?(based on a hypothetical $10,000 investment) Table SummaryShare Class Name | Costs of a $10,000 investment | Costs paid as a percentage of a $10,000 investment |
|---|
Admiral Shares | $10 | 0.10% |
|---|
|
|
| Expenses Paid, Amount |
|
$ 10
|
|
| Expense Ratio, Percent |
|
0.10%
|
|
| Factors Affecting Performance [Text Block] |
|
How did the Fund perform during the reporting period? For the 12 months ended January 31, 2026, the Fund underperformed its benchmark. The first part of the period was marked by volatility in the financial markets amid fears that U.S. tariff announcements might spark trade wars and drag down global growth. Despite these concerns, markets posted solid gains for the 12 months, buoyed by optimism surrounding artificial intelligence, robust corporate earnings, and a more dovish monetary policy. The European Central Bank and the Federal Reserve each cut interest rates three times, while the Bank of England lowered rates four times. U.S. Treasury yields ended the period lower for all but the longest-dated maturities. The yield on the 2-year U.S. Treasury bill fell 0.67 percentage points to end the period at 3.52%, while the yield on the bellwether 10-year U.S. Treasury note declined a more modest 0.30 percentage points to finish at 4.24%. The Fund’s underperformance was driven by its structurally short duration given the fall in short-term interest rates over the period. Curve positioning also detracted.
|
|
| Performance Past Does Not Indicate Future [Text] |
|
Keep in mind that the Fund's past performance does not indicate how the Fund will perform in the future.
|
|
| Line Graph [Table Text Block] |
|
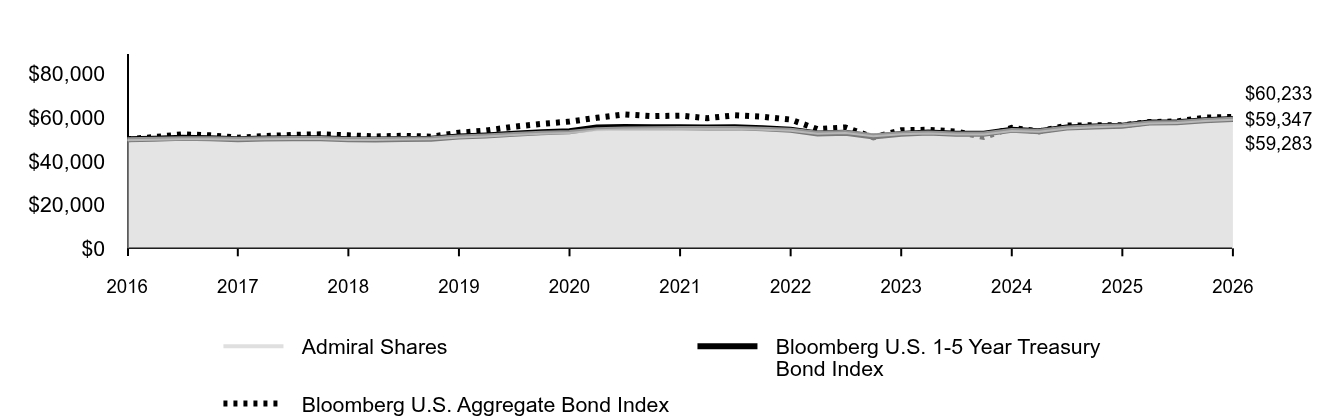 Table Summary | Admiral Shares | Bloomberg U.S. 1-5 Year Treasury Bond Index | Bloomberg U.S. Aggregate Bond Index |
|---|
2016 | $50,000 | $50,000 | $50,000 |
|---|
2016 | $50,203 | $50,235 | $51,012 |
|---|
2016 | $50,493 | $50,632 | $52,270 |
|---|
2016 | $50,416 | $50,448 | $51,781 |
|---|
2017 | $50,264 | $50,054 | $50,726 |
|---|
2017 | $50,420 | $50,322 | $51,434 |
|---|
2017 | $50,571 | $50,502 | $52,001 |
|---|
2017 | $50,536 | $50,455 | $52,248 |
|---|
2018 | $50,156 | $50,005 | $51,816 |
|---|
2018 | $50,120 | $49,919 | $51,270 |
|---|
2018 | $50,314 | $50,112 | $51,585 |
|---|
2018 | $50,459 | $50,247 | $51,175 |
|---|
2019 | $51,264 | $51,228 | $52,983 |
|---|
2019 | $51,750 | $51,770 | $53,983 |
|---|
2019 | $52,417 | $52,555 | $55,753 |
|---|
2019 | $52,935 | $53,222 | $57,065 |
|---|
2020 | $53,319 | $53,713 | $58,093 |
|---|
2020 | $54,551 | $55,358 | $59,835 |
|---|
2020 | $54,922 | $55,575 | $61,396 |
|---|
2020 | $55,035 | $55,481 | $60,596 |
|---|
2021 | $55,162 | $55,543 | $60,835 |
|---|
2021 | $55,156 | $55,328 | $59,676 |
|---|
2021 | $55,119 | $55,510 | $60,965 |
|---|
2021 | $54,838 | $55,023 | $60,306 |
|---|
2022 | $54,336 | $54,376 | $59,030 |
|---|
2022 | $52,989 | $52,594 | $54,596 |
|---|
2022 | $53,312 | $53,011 | $55,408 |
|---|
2022 | $51,828 | $51,304 | $50,848 |
|---|
2023 | $52,713 | $52,465 | $54,095 |
|---|
2023 | $53,074 | $53,085 | $54,363 |
|---|
2023 | $52,636 | $52,535 | $53,542 |
|---|
2023 | $52,665 | $52,519 | $51,029 |
|---|
2024 | $54,280 | $54,323 | $55,230 |
|---|
2024 | $53,917 | $53,668 | $53,565 |
|---|
2024 | $55,405 | $55,366 | $56,273 |
|---|
2024 | $55,940 | $55,788 | $56,411 |
|---|
2025 | $56,417 | $56,222 | $56,372 |
|---|
2025 | $57,692 | $57,665 | $57,861 |
|---|
2025 | $57,874 | $57,784 | $58,176 |
|---|
2025 | $58,796 | $58,757 | $59,886 |
|---|
2026 | $59,347 | $59,283 | $60,233 |
|---|
|
|
| Average Annual Return [Table Text Block] |
|
Table Summary | 1 Year | 5 Years | 10 Years |
|---|
Admiral Shares | 5.19% | 1.47% | 1.73% |
|---|
Bloomberg U.S. 1-5 Year Treasury Bond Index | 5.44% | 1.31% | 1.72% |
|---|
Bloomberg U.S. Aggregate Bond Index | 6.85% | -0.20% | 1.88% |
|---|
|
|
| No Deduction of Taxes [Text Block] |
|
The graph and returns shown do not reflect taxes that a shareholder would pay on fund distributions or on the sale of fund shares.
|
|
| Material Change Date |
|
|
Jan. 31, 2025
|
| Updated Performance Information Location [Text Block] |
|
Updated performance information is available on our website at vanguard.com/performance or by calling Vanguard toll-free at 800-662-7447.
|
|
| AssetsNet |
|
$ 5,832,000,000
|
|
| Holdings Count | Holding |
|
274
|
|
| Advisory Fees Paid, Amount |
|
$ 693,000
|
|
| InvestmentCompanyPortfolioTurnover |
|
421.00%
|
|
| Additional Fund Statistics [Text Block] |
|
Fund Statistics
(as of January 31, 2026)Table SummaryFund Net Assets (in millions) | $5,832 |
|---|
Number of Portfolio Holdings | 274 |
|---|
Portfolio Turnover Rate | 421% |
|---|
Total Investment Advisory Fees (in thousands) | $693 |
|---|
|
|
| Holdings [Text Block] |
|
Portfolio Composition % of Net Assets
(as of January 31, 2026)Table SummaryAgency Bonds and Notes | 2.7% |
|---|
Asset-Backed/Commercial Mortgage-Backed Securities | 1.6% |
|---|
Conventional Mortgage-Backed Securities | 13.2% |
|---|
Nonconventional Mortgage-Backed Securities | 0.2% |
|---|
U.S. Government Securities | 80.1% |
|---|
Other Assets and Liabilities—NetFootnote Reference | 2.2% |
|---|
This table reflects the Fund's investments, including short-term investments, derivatives and other assets and liabilities. |
|
| Material Fund Change [Text Block] |
|
How has the Fund changed?Effective January 12, 2026, The Vanguard Group, Inc. exercises portfolio management responsibilities for the fund through its wholly-owned subsidiary, Vanguard Capital Management, LLC. This is a summary of certain changes to the Fund since January 31, 2025. For more complete information, you may review the Fund’s next prospectus, which we expect to be available by May 31, 2026, at https://personal1.vanguard.com/ngf-next-gen-form-webapp/fund-literature or upon request at 800-662-7447. |
|
| Material Fund Change Adviser [Text Block] |
|
Effective January 12, 2026, The Vanguard Group, Inc. exercises portfolio management responsibilities for the fund through its wholly-owned subsidiary, Vanguard Capital Management, LLC.
|
|
| Summary of Change Legend [Text Block] |
|
This is a summary of certain changes to the Fund since January 31, 2025. For more complete information, you may review the Fund’s next prospectus, which we expect to be available by May 31, 2026, at https://personal1.vanguard.com/ngf-next-gen-form-webapp/fund-literature or upon request at 800-662-7447.
|
|
| Updated Prospectus Phone Number |
|
800-662-7447
|
|
| Updated Prospectus Web Address |
|
https://personal1.vanguard.com/ngf-next-gen-form-webapp/fund-literature
|
|
| C000007092 |
|
|
|
| Shareholder Report [Line Items] |
|
|
|
| Fund Name |
|
High-Yield Corporate Fund
|
|
| Class Name |
|
Investor Shares
|
|
| Trading Symbol |
|
VWEHX
|
|
| Annual or Semi-Annual Statement [Text Block] |
|
This annual shareholder report contains important information about Vanguard High-Yield Corporate Fund (the "Fund") for the period of February 1, 2025, to January 31, 2026.
|
|
| Additional Information [Text Block] |
|
You can find additional information about the Fund at https://personal1.vanguard.com/ngf-next-gen-form-webapp/fund-literature. You can also request this information by contacting us at 800-662-7447.
|
|
| Material Fund Change Notice [Text Block] |
|
The report describes changes to the Fund that occurred during the reporting period.
|
|
| Additional Information Phone Number |
|
<span style="white-space: nowrap; box-sizing: border-box; color: rgb(0, 0, 0); display: inline; flex-wrap: nowrap; font-size: 10.6667px; font-weight: 400; grid-area: auto; line-height: 16px; margin: 0px; overflow: visible; text-align: left; text-align-last: auto;"> 800-662-7447</span>
|
|
| Additional Information Website |
|
<span style="white-space: nowrap; box-sizing: border-box; color: rgb(0, 0, 0); display: inline; flex-wrap: nowrap; font-size: 10.6667px; font-weight: 400; grid-area: auto; line-height: 16px; margin: 0px; overflow: visible; text-align: left; text-align-last: auto;"><span style="box-sizing: border-box; color: rgb(0, 0, 0); display: inline; flex-wrap: nowrap; font-size: 10.6667px; font-weight: 400; grid-area: auto; line-height: 16px; margin: 0px; overflow: visible; text-align: left; text-align-last: auto; white-space-collapse: collapse;"><span style="text-decoration: underline; box-sizing: border-box; color: rgb(0, 0, 0); display: inline; flex-wrap: nowrap; font-size: 10.6667px; font-weight: 400; grid-area: auto; line-height: 16px; margin: 0px; overflow: visible; text-align: left; text-align-last: auto; white-space-collapse: collapse;">https://personal1.vanguard.com/ngf-next-gen-form-webapp/fund-literature</span></span></span>
|
|
| Expenses [Text Block] |
|
What were the Fund costs for the last year?(based on a hypothetical $10,000 investment) Table SummaryShare Class Name | Costs of a $10,000 investment | Costs paid as a percentage of a $10,000 investment |
|---|
Investor Shares | $23 | 0.22% |
|---|
|
|
| Expenses Paid, Amount |
|
$ 23
|
|
| Expense Ratio, Percent |
|
0.22%
|
|
| Factors Affecting Performance [Text Block] |
|
How did the Fund perform during the reporting period? For the 12 months ended January 31, 2026, the Fund outperformed its benchmark. The first part of the period was marked by volatility in the financial markets amid fears that U.S. tariff announcements might spark trade wars and drag down global growth. Despite these concerns, markets posted solid gains for the 12 months, buoyed by optimism surrounding artificial intelligence, robust corporate earnings, and a more dovish monetary policy. The European Central Bank and the Federal Reserve each cut interest rates three times, while the Bank of England lowered rates four times. The Fund benefited from positive security selection in high-yield corporates, notably among industrial issuers.
|
|
| Performance Past Does Not Indicate Future [Text] |
|
Keep in mind that the Fund's past performance does not indicate how the Fund will perform in the future.
|
|
| Line Graph [Table Text Block] |
|
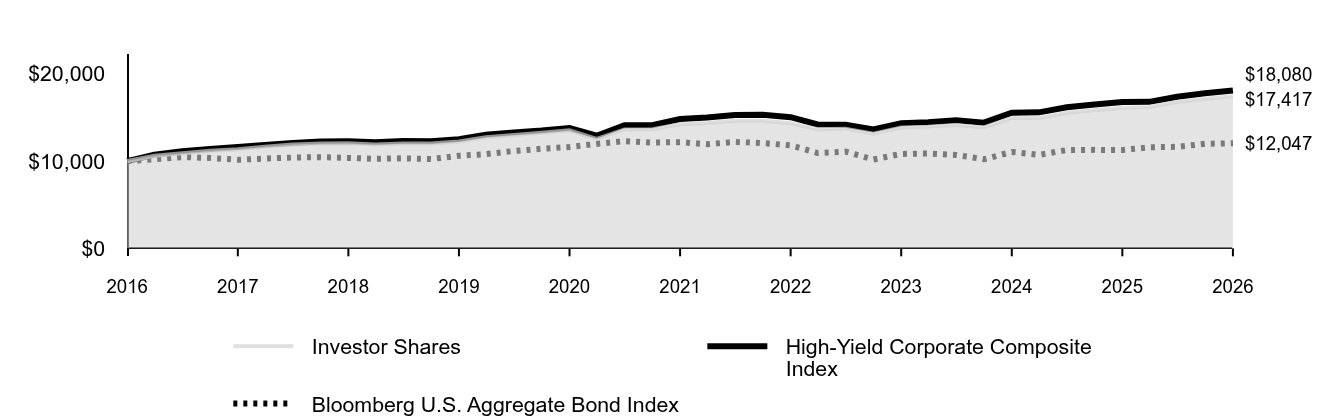 Table Summary | Investor Shares | High-Yield Corporate Composite Index | Bloomberg U.S. Aggregate Bond Index |
|---|
2016 | $10,000 | $10,000 | $10,000 |
|---|
2016 | $10,601 | $10,736 | $10,202 |
|---|
2016 | $10,898 | $11,113 | $10,454 |
|---|
2016 | $11,179 | $11,373 | $10,356 |
|---|
2017 | $11,343 | $11,601 | $10,145 |
|---|
2017 | $11,629 | $11,855 | $10,287 |
|---|
2017 | $11,905 | $12,082 | $10,400 |
|---|
2017 | $12,020 | $12,230 | $10,450 |
|---|
2018 | $12,045 | $12,261 | $10,363 |
|---|
2018 | $11,897 | $12,152 | $10,254 |
|---|
2018 | $12,023 | $12,285 | $10,317 |
|---|
2018 | $12,005 | $12,263 | $10,235 |
|---|
2019 | $12,238 | $12,513 | $10,597 |
|---|
2019 | $12,733 | $13,006 | $10,797 |
|---|
2019 | $12,996 | $13,283 | $11,151 |
|---|
2019 | $13,256 | $13,493 | $11,413 |
|---|
2020 | $13,517 | $13,786 | $11,619 |
|---|
2020 | $12,539 | $12,907 | $11,967 |
|---|
2020 | $13,628 | $14,107 | $12,279 |
|---|
2020 | $13,644 | $14,109 | $12,119 |
|---|
2021 | $14,222 | $14,820 | $12,167 |
|---|
2021 | $14,372 | $14,999 | $11,935 |
|---|
2021 | $14,617 | $15,285 | $12,193 |
|---|
2021 | $14,619 | $15,319 | $12,061 |
|---|
2022 | $14,342 | $15,029 | $11,806 |
|---|
2022 | $13,646 | $14,202 | $10,919 |
|---|
2022 | $13,716 | $14,149 | $11,082 |
|---|
2022 | $13,128 | $13,620 | $10,170 |
|---|
2023 | $13,859 | $14,327 | $10,819 |
|---|
2023 | $13,923 | $14,440 | $10,873 |
|---|
2023 | $14,132 | $14,674 | $10,708 |
|---|
2023 | $13,859 | $14,406 | $10,206 |
|---|
2024 | $14,927 | $15,550 | $11,046 |
|---|
2024 | $14,928 | $15,580 | $10,713 |
|---|
2024 | $15,532 | $16,167 | $11,255 |
|---|
2024 | $15,830 | $16,471 | $11,282 |
|---|
2025 | $16,103 | $16,777 | $11,274 |
|---|
2025 | $16,205 | $16,786 | $11,572 |
|---|
2025 | $16,767 | $17,377 | $11,635 |
|---|
2025 | $17,153 | $17,767 | $11,977 |
|---|
2026 | $17,417 | $18,080 | $12,047 |
|---|
|
|
| Average Annual Return [Table Text Block] |
|
Table Summary | 1 Year | 5 Years | 10 Years |
|---|
Investor Shares | 8.16% | 4.14% | 5.71% |
|---|
High-Yield Corporate Composite Index | 7.77% | 4.06% | 6.10% |
|---|
Bloomberg U.S. Aggregate Bond Index | 6.85% | -0.20% | 1.88% |
|---|
|
|
| No Deduction of Taxes [Text Block] |
|
The graph and returns shown do not reflect taxes that a shareholder would pay on fund distributions or on the sale of fund shares.
|
|
| Material Change Date |
|
|
Jan. 31, 2025
|
| Updated Performance Information Location [Text Block] |
|
Updated performance information is available on our website at vanguard.com/performance or by calling Vanguard toll-free at 800-662-7447.
|
|
| AssetsNet |
|
$ 25,899,000,000
|
|
| Holdings Count | Holding |
|
1,048
|
|
| Advisory Fees Paid, Amount |
|
$ 6,226,000
|
|
| InvestmentCompanyPortfolioTurnover |
|
44.00%
|
|
| Additional Fund Statistics [Text Block] |
|
Fund Statistics
(as of January 31, 2026)Table SummaryFund Net Assets (in millions) | $25,899 |
|---|
Number of Portfolio Holdings | 1,048 |
|---|
Portfolio Turnover Rate | 44% |
|---|
Total Investment Advisory Fees (in thousands) | $6,226 |
|---|
|
|
| Holdings [Text Block] |
|
Portfolio Composition % of Net Assets
(as of January 31, 2026)Table SummaryCommunications | 13.0% | |
|---|
Consumer Discretionary | 15.4% | |
|---|
Consumer Staples | 3.7% | |
|---|
Energy | 10.4% | |
|---|
Financials | 10.1% | |
|---|
Health Care | 6.8% | |
|---|
Industrials | 7.2% | |
|---|
Materials | 9.6% | |
|---|
Real Estate | 2.1% | |
|---|
Technology | 5.4% | |
|---|
Utilities | 2.4% | |
|---|
Other | 9.0% | |
|---|
Other Assets and Liabilities—NetFootnote Reference | 4.9% | |
|---|
This table reflects the Fund's investments, including short-term investments, derivatives and other assets and liabilities. |
|
| Material Fund Change [Text Block] |
|
How has the Fund changed?Effective January 12, 2026, The Vanguard Group, Inc. exercises portfolio management responsibilities for the fund through its wholly-owned subsidiary, Vanguard Capital Management, LLC. This is a summary of certain changes to the Fund since January 31, 2025. For more complete information, you may review the Fund’s next prospectus, which we expect to be available by May 31, 2026, at https://personal1.vanguard.com/ngf-next-gen-form-webapp/fund-literature or upon request at 800-662-7447. |
|
| Material Fund Change Adviser [Text Block] |
|
Effective January 12, 2026, The Vanguard Group, Inc. exercises portfolio management responsibilities for the fund through its wholly-owned subsidiary, Vanguard Capital Management, LLC.
|
|
| Summary of Change Legend [Text Block] |
|
This is a summary of certain changes to the Fund since January 31, 2025. For more complete information, you may review the Fund’s next prospectus, which we expect to be available by May 31, 2026, at https://personal1.vanguard.com/ngf-next-gen-form-webapp/fund-literature or upon request at 800-662-7447.
|
|
| Updated Prospectus Phone Number |
|
800-662-7447
|
|
| Updated Prospectus Web Address |
|
https://personal1.vanguard.com/ngf-next-gen-form-webapp/fund-literature
|
|
| C000007093 |
|
|
|
| Shareholder Report [Line Items] |
|
|
|
| Fund Name |
|
High-Yield Corporate Fund
|
|
| Class Name |
|
Admiral™ Shares
|
|
| Trading Symbol |
|
VWEAX
|
|
| Annual or Semi-Annual Statement [Text Block] |
|
This annual shareholder report contains important information about Vanguard High-Yield Corporate Fund (the "Fund") for the period of February 1, 2025, to January 31, 2026.
|
|
| Additional Information [Text Block] |
|
You can find additional information about the Fund at https://personal1.vanguard.com/ngf-next-gen-form-webapp/fund-literature. You can also request this information by contacting us at 800-662-7447.
|
|
| Material Fund Change Notice [Text Block] |
|
The report describes changes to the Fund that occurred during the reporting period.
|
|
| Additional Information Phone Number |
|
<span style="white-space: nowrap; box-sizing: border-box; color: rgb(0, 0, 0); display: inline; flex-wrap: nowrap; font-size: 10.6667px; font-weight: 400; grid-area: auto; line-height: 16px; margin: 0px; overflow: visible; text-align: left; text-align-last: auto;"> 800-662-7447</span>
|
|
| Additional Information Website |
|
<span style="white-space: nowrap; box-sizing: border-box; color: rgb(0, 0, 0); display: inline; flex-wrap: nowrap; font-size: 10.6667px; font-weight: 400; grid-area: auto; line-height: 16px; margin: 0px; overflow: visible; text-align: left; text-align-last: auto;"><span style="box-sizing: border-box; color: rgb(0, 0, 0); display: inline; flex-wrap: nowrap; font-size: 10.6667px; font-weight: 400; grid-area: auto; line-height: 16px; margin: 0px; overflow: visible; text-align: left; text-align-last: auto; white-space-collapse: collapse;"><span style="text-decoration: underline; box-sizing: border-box; color: rgb(0, 0, 0); display: inline; flex-wrap: nowrap; font-size: 10.6667px; font-weight: 400; grid-area: auto; line-height: 16px; margin: 0px; overflow: visible; text-align: left; text-align-last: auto; white-space-collapse: collapse;">https://personal1.vanguard.com/ngf-next-gen-form-webapp/fund-literature</span></span></span>
|
|
| Expenses [Text Block] |
|
What were the Fund costs for the last year?(based on a hypothetical $10,000 investment) Table SummaryShare Class Name | Costs of a $10,000 investment | Costs paid as a percentage of a $10,000 investment |
|---|
Admiral Shares | $12 | 0.12% |
|---|
|
|
| Expenses Paid, Amount |
|
$ 12
|
|
| Expense Ratio, Percent |
|
0.12%
|
|
| Factors Affecting Performance [Text Block] |
|
How did the Fund perform during the reporting period? For the 12 months ended January 31, 2026, the Fund outperformed its benchmark. The first part of the period was marked by volatility in the financial markets amid fears that U.S. tariff announcements might spark trade wars and drag down global growth. Despite these concerns, markets posted solid gains for the 12 months, buoyed by optimism surrounding artificial intelligence, robust corporate earnings, and a more dovish monetary policy. The European Central Bank and the Federal Reserve each cut interest rates three times, while the Bank of England lowered rates four times. The Fund benefited from positive security selection in high-yield corporates, notably among industrial issuers.
|
|
| Performance Past Does Not Indicate Future [Text] |
|
Keep in mind that the Fund's past performance does not indicate how the Fund will perform in the future.
|
|
| Line Graph [Table Text Block] |
|
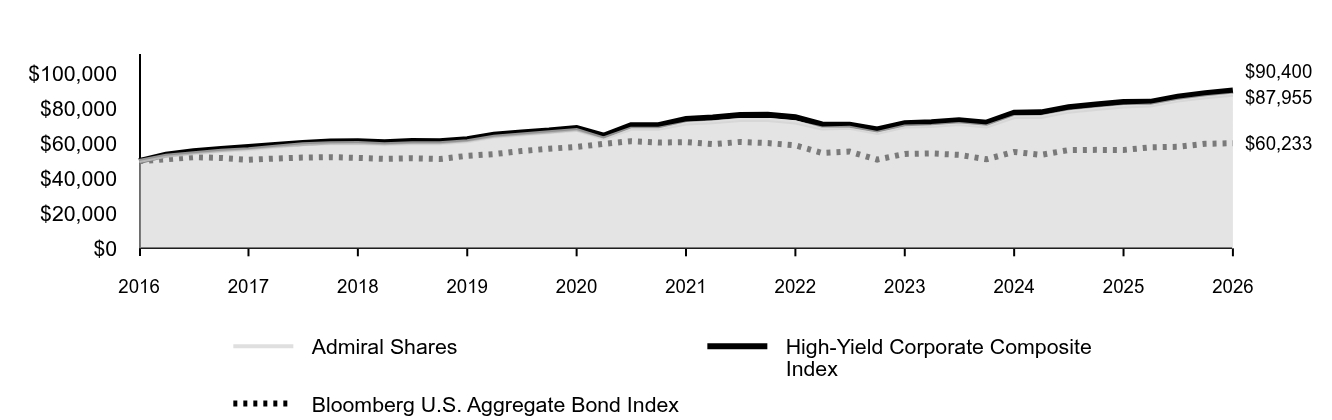 Table Summary | Admiral Shares | High-Yield Corporate Composite Index | Bloomberg U.S. Aggregate Bond Index |
|---|
2016 | $50,000 | $50,000 | $50,000 |
|---|
2016 | $53,019 | $53,678 | $51,012 |
|---|
2016 | $54,517 | $55,564 | $52,270 |
|---|
2016 | $55,937 | $56,867 | $51,781 |
|---|
2017 | $56,771 | $58,005 | $50,726 |
|---|
2017 | $58,218 | $59,274 | $51,434 |
|---|
2017 | $59,613 | $60,408 | $52,001 |
|---|
2017 | $60,205 | $61,150 | $52,248 |
|---|
2018 | $60,343 | $61,307 | $51,816 |
|---|
2018 | $59,618 | $60,758 | $51,270 |
|---|
2018 | $60,265 | $61,424 | $51,585 |
|---|
2018 | $60,188 | $61,315 | $51,175 |
|---|
2019 | $61,374 | $62,565 | $52,983 |
|---|
2019 | $63,873 | $65,032 | $53,983 |
|---|
2019 | $65,204 | $66,416 | $55,753 |
|---|
2019 | $66,527 | $67,464 | $57,065 |
|---|
2020 | $67,852 | $68,931 | $58,093 |
|---|
2020 | $62,962 | $64,536 | $59,835 |
|---|
2020 | $68,445 | $70,533 | $61,396 |
|---|
2020 | $68,541 | $70,545 | $60,596 |
|---|
2021 | $71,465 | $74,100 | $60,835 |
|---|
2021 | $72,234 | $74,994 | $59,676 |
|---|
2021 | $73,485 | $76,427 | $60,965 |
|---|
2021 | $73,514 | $76,593 | $60,306 |
|---|
2022 | $72,139 | $75,143 | $59,030 |
|---|
2022 | $68,654 | $71,008 | $54,596 |
|---|
2022 | $69,024 | $70,746 | $55,408 |
|---|
2022 | $66,084 | $68,097 | $50,848 |
|---|
2023 | $69,780 | $71,634 | $54,095 |
|---|
2023 | $70,117 | $72,202 | $54,363 |
|---|
2023 | $71,190 | $73,371 | $53,542 |
|---|
2023 | $69,834 | $72,030 | $51,029 |
|---|
2024 | $75,234 | $77,750 | $55,230 |
|---|
2024 | $75,254 | $77,900 | $53,565 |
|---|
2024 | $78,321 | $80,834 | $56,273 |
|---|
2024 | $79,844 | $82,354 | $56,411 |
|---|
2025 | $81,238 | $83,885 | $56,372 |
|---|
2025 | $81,773 | $83,932 | $57,861 |
|---|
2025 | $84,632 | $86,883 | $58,176 |
|---|
2025 | $86,601 | $88,837 | $59,886 |
|---|
2026 | $87,955 | $90,400 | $60,233 |
|---|
|
|
| Average Annual Return [Table Text Block] |
|
Table Summary | 1 Year | 5 Years | 10 Years |
|---|
Admiral Shares | 8.27% | 4.24% | 5.81% |
|---|
High-Yield Corporate Composite Index | 7.77% | 4.06% | 6.10% |
|---|
Bloomberg U.S. Aggregate Bond Index | 6.85% | -0.20% | 1.88% |
|---|
|
|
| No Deduction of Taxes [Text Block] |
|
The graph and returns shown do not reflect taxes that a shareholder would pay on fund distributions or on the sale of fund shares.
|
|
| Material Change Date |
|
|
Jan. 31, 2025
|
| Updated Performance Information Location [Text Block] |
|
Updated performance information is available on our website at vanguard.com/performance or by calling Vanguard toll-free at 800-662-7447.
|
|
| AssetsNet |
|
$ 25,899,000,000
|
|
| Holdings Count | Holding |
|
1,048
|
|
| Advisory Fees Paid, Amount |
|
$ 6,226,000
|
|
| InvestmentCompanyPortfolioTurnover |
|
44.00%
|
|
| Additional Fund Statistics [Text Block] |
|
Fund Statistics
(as of January 31, 2026)Table SummaryFund Net Assets (in millions) | $25,899 |
|---|
Number of Portfolio Holdings | 1,048 |
|---|
Portfolio Turnover Rate | 44% |
|---|
Total Investment Advisory Fees (in thousands) | $6,226 |
|---|
|
|
| Holdings [Text Block] |
|
Portfolio Composition % of Net Assets
(as of January 31, 2026)Table SummaryCommunications | 13.0% | |
|---|
Consumer Discretionary | 15.4% | |
|---|
Consumer Staples | 3.7% | |
|---|
Energy | 10.4% | |
|---|
Financials | 10.1% | |
|---|
Health Care | 6.8% | |
|---|
Industrials | 7.2% | |
|---|
Materials | 9.6% | |
|---|
Real Estate | 2.1% | |
|---|
Technology | 5.4% | |
|---|
Utilities | 2.4% | |
|---|
Other | 9.0% | |
|---|
Other Assets and Liabilities—NetFootnote Reference | 4.9% | |
|---|
This table reflects the Fund's investments, including short-term investments, derivatives and other assets and liabilities. |
|
| Material Fund Change [Text Block] |
|
How has the Fund changed?Effective January 12, 2026, The Vanguard Group, Inc. exercises portfolio management responsibilities for the fund through its wholly-owned subsidiary, Vanguard Capital Management, LLC. This is a summary of certain changes to the Fund since January 31, 2025. For more complete information, you may review the Fund’s next prospectus, which we expect to be available by May 31, 2026, at https://personal1.vanguard.com/ngf-next-gen-form-webapp/fund-literature or upon request at 800-662-7447. |
|
| Material Fund Change Adviser [Text Block] |
|
Effective January 12, 2026, The Vanguard Group, Inc. exercises portfolio management responsibilities for the fund through its wholly-owned subsidiary, Vanguard Capital Management, LLC.
|
|
| Summary of Change Legend [Text Block] |
|
This is a summary of certain changes to the Fund since January 31, 2025. For more complete information, you may review the Fund’s next prospectus, which we expect to be available by May 31, 2026, at https://personal1.vanguard.com/ngf-next-gen-form-webapp/fund-literature or upon request at 800-662-7447.
|
|
| Updated Prospectus Phone Number |
|
800-662-7447
|
|
| Updated Prospectus Web Address |
|
https://personal1.vanguard.com/ngf-next-gen-form-webapp/fund-literature
|
|
| C000007097 |
|
|
|
| Shareholder Report [Line Items] |
|
|
|
| Fund Name |
|
Intermediate-Term Investment-Grade Fund
|
|
| Class Name |
|
Investor Shares
|
|
| Trading Symbol |
|
VFICX
|
|
| Annual or Semi-Annual Statement [Text Block] |
|
This annual shareholder report contains important information about Vanguard Intermediate-Term Investment-Grade Fund (the "Fund") for the period of February 1, 2025, to January 31, 2026.
|
|
| Additional Information [Text Block] |
|
You can find additional information about the Fund at https://personal1.vanguard.com/ngf-next-gen-form-webapp/fund-literature. You can also request this information by contacting us at 800-662-7447.
|
|
| Material Fund Change Notice [Text Block] |
|
The report describes changes to the Fund that occurred during the reporting period.
|
|
| Additional Information Phone Number |
|
<span style="white-space: nowrap; box-sizing: border-box; color: rgb(0, 0, 0); display: inline; flex-wrap: nowrap; font-size: 10.6667px; font-weight: 400; grid-area: auto; line-height: 16px; margin: 0px; overflow: visible; text-align: left; text-align-last: auto;"> 800-662-7447</span>
|
|
| Additional Information Website |
|
<span style="white-space: nowrap; box-sizing: border-box; color: rgb(0, 0, 0); display: inline; flex-wrap: nowrap; font-size: 10.6667px; font-weight: 400; grid-area: auto; line-height: 16px; margin: 0px; overflow: visible; text-align: left; text-align-last: auto;"><span style="box-sizing: border-box; color: rgb(0, 0, 0); display: inline; flex-wrap: nowrap; font-size: 10.6667px; font-weight: 400; grid-area: auto; line-height: 16px; margin: 0px; overflow: visible; text-align: left; text-align-last: auto; white-space-collapse: collapse;"><span style="text-decoration: underline; box-sizing: border-box; color: rgb(0, 0, 0); display: inline; flex-wrap: nowrap; font-size: 10.6667px; font-weight: 400; grid-area: auto; line-height: 16px; margin: 0px; overflow: visible; text-align: left; text-align-last: auto; white-space-collapse: collapse;">https://personal1.vanguard.com/ngf-next-gen-form-webapp/fund-literature</span></span></span>
|
|
| Expenses [Text Block] |
|
What were the Fund costs for the last year?(based on a hypothetical $10,000 investment) Table SummaryShare Class Name | Costs of a $10,000 investment | Costs paid as a percentage of a $10,000 investment |
|---|
Investor Shares | $21 | 0.20% |
|---|
|
|
| Expenses Paid, Amount |
|
$ 21
|
|
| Expense Ratio, Percent |
|
0.20%
|
|
| Factors Affecting Performance [Text Block] |
|
How did the Fund perform during the reporting period? For the 12 months ended January 31, 2026, the Fund slightly outperformed its benchmark. The first part of the period was marked by volatility in the financial markets amid fears that U.S. tariff announcements might spark trade wars and drag down global growth. Despite these concerns, markets posted solid gains for the 12 months, buoyed by optimism surrounding artificial intelligence, robust corporate earnings, and a more dovish monetary policy. The European Central Bank and the Federal Reserve each cut interest rates three times, while the Bank of England lowered rates four times. Security selection within investment-grade corporate bonds helped the Fund’s relative performance. An overweight to overall credit risk also added value.
|
|
| Performance Past Does Not Indicate Future [Text] |
|
Keep in mind that the Fund's past performance does not indicate how the Fund will perform in the future.
|
|
| Line Graph [Table Text Block] |
|
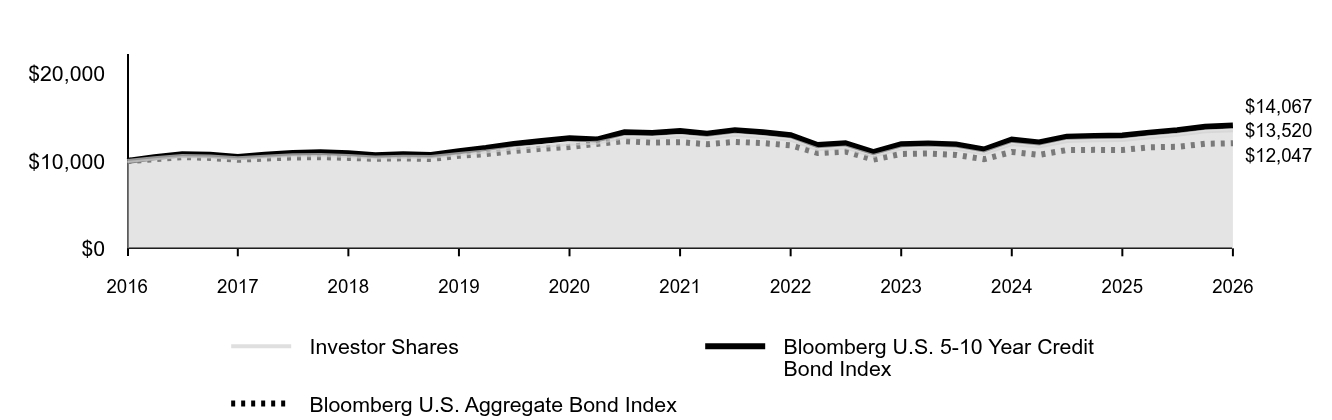 Table Summary | Investor Shares | Bloomberg U.S. 5-10 Year Credit Bond Index | Bloomberg U.S. Aggregate Bond Index |
|---|
2016 | $10,000 | $10,000 | $10,000 |
|---|
2016 | $10,320 | $10,441 | $10,202 |
|---|
2016 | $10,582 | $10,779 | $10,454 |
|---|
2016 | $10,529 | $10,725 | $10,356 |
|---|
2017 | $10,316 | $10,480 | $10,145 |
|---|
2017 | $10,506 | $10,723 | $10,287 |
|---|
2017 | $10,656 | $10,922 | $10,400 |
|---|
2017 | $10,705 | $11,006 | $10,450 |
|---|
2018 | $10,572 | $10,886 | $10,363 |
|---|
2018 | $10,418 | $10,669 | $10,254 |
|---|
2018 | $10,501 | $10,771 | $10,317 |
|---|
2018 | $10,463 | $10,699 | $10,235 |
|---|
2019 | $10,815 | $11,120 | $10,597 |
|---|
2019 | $11,097 | $11,490 | $10,797 |
|---|
2019 | $11,474 | $11,969 | $11,151 |
|---|
2019 | $11,733 | $12,308 | $11,413 |
|---|
2020 | $11,979 | $12,627 | $11,619 |
|---|
2020 | $12,088 | $12,459 | $11,967 |
|---|
2020 | $12,762 | $13,290 | $12,279 |
|---|
2020 | $12,692 | $13,212 | $12,119 |
|---|
2021 | $12,876 | $13,434 | $12,167 |
|---|
2021 | $12,642 | $13,142 | $11,935 |
|---|
2021 | $13,001 | $13,538 | $12,193 |
|---|
2021 | $12,768 | $13,294 | $12,061 |
|---|
2022 | $12,455 | $12,969 | $11,806 |
|---|
2022 | $11,356 | $11,828 | $10,919 |
|---|
2022 | $11,559 | $12,032 | $11,082 |
|---|
2022 | $10,600 | $11,021 | $10,170 |
|---|
2023 | $11,448 | $11,916 | $10,819 |
|---|
2023 | $11,537 | $12,010 | $10,873 |
|---|
2023 | $11,422 | $11,890 | $10,708 |
|---|
2023 | $10,873 | $11,324 | $10,206 |
|---|
2024 | $11,956 | $12,452 | $11,046 |
|---|
2024 | $11,657 | $12,137 | $10,713 |
|---|
2024 | $12,300 | $12,797 | $11,255 |
|---|
2024 | $12,382 | $12,886 | $11,282 |
|---|
2025 | $12,414 | $12,920 | $11,274 |
|---|
2025 | $12,739 | $13,257 | $11,572 |
|---|
2025 | $13,016 | $13,542 | $11,635 |
|---|
2025 | $13,402 | $13,939 | $11,977 |
|---|
2026 | $13,520 | $14,067 | $12,047 |
|---|
|
|
| Average Annual Return [Table Text Block] |
|
Table Summary | 1 Year | 5 Years | 10 Years |
|---|
Investor Shares | 8.91% | 0.98% | 3.06% |
|---|
Bloomberg U.S. 5-10 Year Credit Bond Index | 8.88% | 0.92% | 3.47% |
|---|
Bloomberg U.S. Aggregate Bond Index | 6.85% | -0.20% | 1.88% |
|---|
|
|
| No Deduction of Taxes [Text Block] |
|
The graph and returns shown do not reflect taxes that a shareholder would pay on fund distributions or on the sale of fund shares.
|
|
| Material Change Date |
|
|
Jan. 31, 2025
|
| Updated Performance Information Location [Text Block] |
|
Updated performance information is available on our website at vanguard.com/performance or by calling Vanguard toll-free at 800-662-7447.
|
|
| AssetsNet |
|
$ 38,785,000,000
|
|
| Holdings Count | Holding |
|
1,776
|
|
| Advisory Fees Paid, Amount |
|
$ 6,969,000
|
|
| InvestmentCompanyPortfolioTurnover |
|
68.00%
|
|
| Additional Fund Statistics [Text Block] |
|
Fund Statistics
(as of January 31, 2026)Table SummaryFund Net Assets (in millions) | $38,785 |
|---|
Number of Portfolio Holdings | 1,776 |
|---|
Portfolio Turnover Rate | 68% |
|---|
Total Investment Advisory Fees (in thousands) | $6,969 |
|---|
|
|
| Holdings [Text Block] |
|
Portfolio Composition % of Net Assets
(as of January 31, 2026)Table SummaryCommunication Services | 6.6% | |
|---|
Consumer Discretionary | 4.2% | |
|---|
Consumer Staples | 4.5% | |
|---|
Energy | 6.5% | |
|---|
Financials | 30.5% | |
|---|
Health Care | 6.5% | |
|---|
Industrials | 4.5% | |
|---|
Materials | 2.5% | |
|---|
Real Estate | 3.6% | |
|---|
Technology | 6.1% | |
|---|
Utilities | 8.4% | |
|---|
Other | 15.4% | |
|---|
Other Assets and Liabilities—NetFootnote Reference | 0.7% | |
|---|
This table reflects the Fund's investments, including short-term investments, derivatives and other assets and liabilities. |
|
| Material Fund Change [Text Block] |
|
How has the Fund changed?Effective January 12, 2026, The Vanguard Group, Inc. exercises portfolio management responsibilities for the fund through its wholly-owned subsidiary, Vanguard Capital Management, LLC. This is a summary of certain changes to the Fund since January 31, 2025. For more complete information, you may review the Fund’s next prospectus, which we expect to be available by May 31, 2026, at https://personal1.vanguard.com/ngf-next-gen-form-webapp/fund-literature or upon request at 800-662-7447. |
|
| Material Fund Change Adviser [Text Block] |
|
Effective January 12, 2026, The Vanguard Group, Inc. exercises portfolio management responsibilities for the fund through its wholly-owned subsidiary, Vanguard Capital Management, LLC.
|
|
| Summary of Change Legend [Text Block] |
|
This is a summary of certain changes to the Fund since January 31, 2025. For more complete information, you may review the Fund’s next prospectus, which we expect to be available by May 31, 2026, at https://personal1.vanguard.com/ngf-next-gen-form-webapp/fund-literature or upon request at 800-662-7447.
|
|
| Updated Prospectus Phone Number |
|
800-662-7447
|
|
| Updated Prospectus Web Address |
|
https://personal1.vanguard.com/ngf-next-gen-form-webapp/fund-literature
|
|
| C000007098 |
|
|
|
| Shareholder Report [Line Items] |
|
|
|
| Fund Name |
|
Intermediate-Term Investment-Grade Fund
|
|
| Class Name |
|
Admiral™ Shares
|
|
| Trading Symbol |
|
VFIDX
|
|
| Annual or Semi-Annual Statement [Text Block] |
|
This annual shareholder report contains important information about Vanguard Intermediate-Term Investment-Grade Fund (the "Fund") for the period of February 1, 2025, to January 31, 2026.
|
|
| Additional Information [Text Block] |
|
You can find additional information about the Fund at https://personal1.vanguard.com/ngf-next-gen-form-webapp/fund-literature. You can also request this information by contacting us at 800-662-7447.
|
|
| Material Fund Change Notice [Text Block] |
|
The report describes changes to the Fund that occurred during the reporting period.
|
|
| Additional Information Phone Number |
|
<span style="white-space: nowrap; box-sizing: border-box; color: rgb(0, 0, 0); display: inline; flex-wrap: nowrap; font-size: 10.6667px; font-weight: 400; grid-area: auto; line-height: 16px; margin: 0px; overflow: visible; text-align: left; text-align-last: auto;"> 800-662-7447</span>
|
|
| Additional Information Website |
|
<span style="white-space: nowrap; box-sizing: border-box; color: rgb(0, 0, 0); display: inline; flex-wrap: nowrap; font-size: 10.6667px; font-weight: 400; grid-area: auto; line-height: 16px; margin: 0px; overflow: visible; text-align: left; text-align-last: auto;"><span style="box-sizing: border-box; color: rgb(0, 0, 0); display: inline; flex-wrap: nowrap; font-size: 10.6667px; font-weight: 400; grid-area: auto; line-height: 16px; margin: 0px; overflow: visible; text-align: left; text-align-last: auto; white-space-collapse: collapse;"><span style="text-decoration: underline; box-sizing: border-box; color: rgb(0, 0, 0); display: inline; flex-wrap: nowrap; font-size: 10.6667px; font-weight: 400; grid-area: auto; line-height: 16px; margin: 0px; overflow: visible; text-align: left; text-align-last: auto; white-space-collapse: collapse;">https://personal1.vanguard.com/ngf-next-gen-form-webapp/fund-literature</span></span></span>
|
|
| Expenses [Text Block] |
|
What were the Fund costs for the last year?(based on a hypothetical $10,000 investment) Table SummaryShare Class Name | Costs of a $10,000 investment | Costs paid as a percentage of a $10,000 investment |
|---|
Admiral Shares | $9 | 0.09% |
|---|
|
|
| Expenses Paid, Amount |
|
$ 9
|
|
| Expense Ratio, Percent |
|
0.09%
|
|
| Factors Affecting Performance [Text Block] |
|
How did the Fund perform during the reporting period? For the 12 months ended January 31, 2026, the Fund slightly outperformed its benchmark. The first part of the period was marked by volatility in the financial markets amid fears that U.S. tariff announcements might spark trade wars and drag down global growth. Despite these concerns, markets posted solid gains for the 12 months, buoyed by optimism surrounding artificial intelligence, robust corporate earnings, and a more dovish monetary policy. The European Central Bank and the Federal Reserve each cut interest rates three times, while the Bank of England lowered rates four times. Security selection within investment-grade corporate bonds helped the Fund’s relative performance. An overweight to overall credit risk also added value.
|
|
| Performance Past Does Not Indicate Future [Text] |
|
Keep in mind that the Fund's past performance does not indicate how the Fund will perform in the future.
|
|
| Line Graph [Table Text Block] |
|
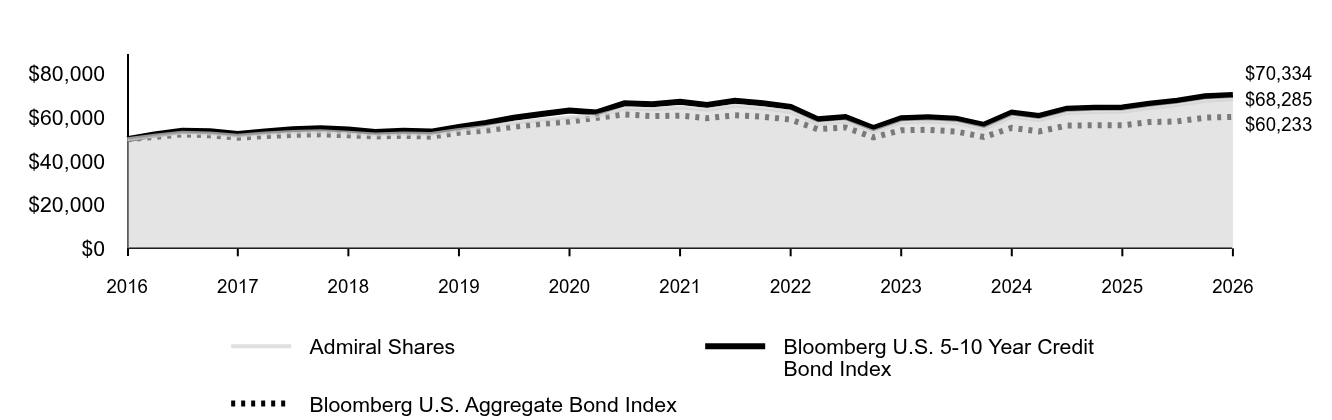 Table Summary | Admiral Shares | Bloomberg U.S. 5-10 Year Credit Bond Index | Bloomberg U.S. Aggregate Bond Index |
|---|
2016 | $50,000 | $50,000 | $50,000 |
|---|
2016 | $51,611 | $52,206 | $51,012 |
|---|
2016 | $52,936 | $53,897 | $52,270 |
|---|
2016 | $52,683 | $53,625 | $51,781 |
|---|
2017 | $51,633 | $52,402 | $50,726 |
|---|
2017 | $52,596 | $53,614 | $51,434 |
|---|
2017 | $53,362 | $54,610 | $52,001 |
|---|
2017 | $53,620 | $55,032 | $52,248 |
|---|
2018 | $52,963 | $54,430 | $51,816 |
|---|
2018 | $52,207 | $53,346 | $51,270 |
|---|
2018 | $52,634 | $53,853 | $51,585 |
|---|
2018 | $52,460 | $53,496 | $51,175 |
|---|
2019 | $54,239 | $55,600 | $52,983 |
|---|
2019 | $55,667 | $57,450 | $53,983 |
|---|
2019 | $57,570 | $59,845 | $55,753 |
|---|
2019 | $58,886 | $61,538 | $57,065 |
|---|
2020 | $60,136 | $63,136 | $58,093 |
|---|
2020 | $60,695 | $62,297 | $59,835 |
|---|
2020 | $64,096 | $66,451 | $61,396 |
|---|
2020 | $63,760 | $66,058 | $60,596 |
|---|
2021 | $64,703 | $67,172 | $60,835 |
|---|
2021 | $63,542 | $65,710 | $59,676 |
|---|
2021 | $65,359 | $67,689 | $60,965 |
|---|
2021 | $64,209 | $66,468 | $60,306 |
|---|
2022 | $62,649 | $64,845 | $59,030 |
|---|
2022 | $57,136 | $59,138 | $54,596 |
|---|
2022 | $58,170 | $60,159 | $55,408 |
|---|
2022 | $53,357 | $55,106 | $50,848 |
|---|
2023 | $57,639 | $59,578 | $54,095 |
|---|
2023 | $58,106 | $60,050 | $54,363 |
|---|
2023 | $57,537 | $59,450 | $53,542 |
|---|
2023 | $54,788 | $56,619 | $51,029 |
|---|
2024 | $60,257 | $62,258 | $55,230 |
|---|
2024 | $58,764 | $60,683 | $53,565 |
|---|
2024 | $62,023 | $63,984 | $56,273 |
|---|
2024 | $62,454 | $64,428 | $56,411 |
|---|
2025 | $62,629 | $64,598 | $56,372 |
|---|
2025 | $64,284 | $66,286 | $57,861 |
|---|
2025 | $65,703 | $67,712 | $58,176 |
|---|
2025 | $67,671 | $69,694 | $59,886 |
|---|
2026 | $68,285 | $70,334 | $60,233 |
|---|
|
|
| Average Annual Return [Table Text Block] |
|
Table Summary | 1 Year | 5 Years | 10 Years |
|---|
Admiral Shares | 9.03% | 1.08% | 3.17% |
|---|
Bloomberg U.S. 5-10 Year Credit Bond Index | 8.88% | 0.92% | 3.47% |
|---|
Bloomberg U.S. Aggregate Bond Index | 6.85% | -0.20% | 1.88% |
|---|
|
|
| No Deduction of Taxes [Text Block] |
|
The graph and returns shown do not reflect taxes that a shareholder would pay on fund distributions or on the sale of fund shares.
|
|
| Material Change Date |
|
|
Jan. 31, 2025
|
| Updated Performance Information Location [Text Block] |
|
Updated performance information is available on our website at vanguard.com/performance or by calling Vanguard toll-free at 800-662-7447.
|
|
| AssetsNet |
|
$ 38,785,000,000
|
|
| Holdings Count | Holding |
|
1,776
|
|
| Advisory Fees Paid, Amount |
|
$ 6,969,000
|
|
| InvestmentCompanyPortfolioTurnover |
|
68.00%
|
|
| Additional Fund Statistics [Text Block] |
|
Fund Statistics
(as of January 31, 2026)Table SummaryFund Net Assets (in millions) | $38,785 |
|---|
Number of Portfolio Holdings | 1,776 |
|---|
Portfolio Turnover Rate | 68% |
|---|
Total Investment Advisory Fees (in thousands) | $6,969 |
|---|
|
|
| Holdings [Text Block] |
|
Portfolio Composition % of Net Assets
(as of January 31, 2026)Table SummaryCommunication Services | 6.6% | |
|---|
Consumer Discretionary | 4.2% | |
|---|
Consumer Staples | 4.5% | |
|---|
Energy | 6.5% | |
|---|
Financials | 30.5% | |
|---|
Health Care | 6.5% | |
|---|
Industrials | 4.5% | |
|---|
Materials | 2.5% | |
|---|
Real Estate | 3.6% | |
|---|
Technology | 6.1% | |
|---|
Utilities | 8.4% | |
|---|
Other | 15.4% | |
|---|
Other Assets and Liabilities—NetFootnote Reference | 0.7% | |
|---|
This table reflects the Fund's investments, including short-term investments, derivatives and other assets and liabilities. |
|
| Material Fund Change [Text Block] |
|
How has the Fund changed?During the reporting period, the expense ratio for the Admiral Share class was reduced. Effective January 12, 2026, The Vanguard Group, Inc. exercises portfolio management responsibilities for the fund through its wholly-owned subsidiary, Vanguard Capital Management, LLC. This is a summary of certain changes to the Fund since January 31, 2025. For more complete information, you may review the Fund’s next prospectus, which we expect to be available by May 31, 2026, at https://personal1.vanguard.com/ngf-next-gen-form-webapp/fund-literature or upon request at 800-662-7447. |
|
| Material Fund Change Expenses [Text Block] |
|
During the reporting period, the expense ratio for the Admiral Share class was reduced.
|
|
| Material Fund Change Adviser [Text Block] |
|
Effective January 12, 2026, The Vanguard Group, Inc. exercises portfolio management responsibilities for the fund through its wholly-owned subsidiary, Vanguard Capital Management, LLC.
|
|
| Summary of Change Legend [Text Block] |
|
This is a summary of certain changes to the Fund since January 31, 2025. For more complete information, you may review the Fund’s next prospectus, which we expect to be available by May 31, 2026, at https://personal1.vanguard.com/ngf-next-gen-form-webapp/fund-literature or upon request at 800-662-7447.
|
|
| Updated Prospectus Phone Number |
|
800-662-7447
|
|
| Updated Prospectus Web Address |
|
https://personal1.vanguard.com/ngf-next-gen-form-webapp/fund-literature
|
|
| C000007099 |
|
|
|
| Shareholder Report [Line Items] |
|
|
|
| Fund Name |
|
Intermediate-Term Treasury Fund
|
|
| Class Name |
|
Investor Shares
|
|
| Trading Symbol |
|
VFITX
|
|
| Annual or Semi-Annual Statement [Text Block] |
|
This annual shareholder report contains important information about Vanguard Intermediate-Term Treasury Fund (the "Fund") for the period of February 1, 2025, to January 31, 2026.
|
|
| Additional Information [Text Block] |
|
You can find additional information about the Fund at https://personal1.vanguard.com/ngf-next-gen-form-webapp/fund-literature. You can also request this information by contacting us at 800-662-7447.
|
|
| Material Fund Change Notice [Text Block] |
|
The report describes changes to the Fund that occurred during the reporting period.
|
|
| Additional Information Phone Number |
|
<span style="white-space: nowrap; box-sizing: border-box; color: rgb(0, 0, 0); display: inline; flex-wrap: nowrap; font-size: 10.6667px; font-weight: 400; grid-area: auto; line-height: 16px; margin: 0px; overflow: visible; text-align: left; text-align-last: auto;"> 800-662-7447</span>
|
|
| Additional Information Website |
|
<span style="white-space: nowrap; box-sizing: border-box; color: rgb(0, 0, 0); display: inline; flex-wrap: nowrap; font-size: 10.6667px; font-weight: 400; grid-area: auto; line-height: 16px; margin: 0px; overflow: visible; text-align: left; text-align-last: auto;"><span style="box-sizing: border-box; color: rgb(0, 0, 0); display: inline; flex-wrap: nowrap; font-size: 10.6667px; font-weight: 400; grid-area: auto; line-height: 16px; margin: 0px; overflow: visible; text-align: left; text-align-last: auto; white-space-collapse: collapse;"><span style="text-decoration: underline; box-sizing: border-box; color: rgb(0, 0, 0); display: inline; flex-wrap: nowrap; font-size: 10.6667px; font-weight: 400; grid-area: auto; line-height: 16px; margin: 0px; overflow: visible; text-align: left; text-align-last: auto; white-space-collapse: collapse;">https://personal1.vanguard.com/ngf-next-gen-form-webapp/fund-literature</span></span></span>
|
|
| Expenses [Text Block] |
|
What were the Fund costs for the last year?(based on a hypothetical $10,000 investment) Table SummaryShare Class Name | Costs of a $10,000 investment | Costs paid as a percentage of a $10,000 investment |
|---|
Investor Shares | $21 | 0.20% |
|---|
|
|
| Expenses Paid, Amount |
|
$ 21
|
|
| Expense Ratio, Percent |
|
0.20%
|
|
| Factors Affecting Performance [Text Block] |
|
How did the Fund perform during the reporting period? For the 12 months ended January 31, 2026, the Fund underperformed its benchmark. The first part of the period was marked by volatility in the financial markets amid fears that U.S. tariff announcements might spark trade wars and drag down global growth. Despite these concerns, markets posted solid gains for the 12 months, buoyed by optimism surrounding artificial intelligence, robust corporate earnings, and a more dovish monetary policy. The European Central Bank and the Federal Reserve each cut interest rates three times, while the Bank of England lowered rates four times. U.S. Treasury yields ended the period lower for all but the longest-dated maturities. The yield on the 2-year U.S. Treasury bill fell 0.67 percentage points to end the period at 3.52%, while the yield on the bellwether 10-year U.S. Treasury note declined a more modest 0.30 percentage points to finish at 4.24%. The Fund’s underperformance was driven largely by its duration positioning throughout the period. Strong security selection, on the other hand, added value.
|
|
| Performance Past Does Not Indicate Future [Text] |
|
Keep in mind that the Fund's past performance does not indicate how the Fund will perform in the future.
|
|
| Line Graph [Table Text Block] |
|
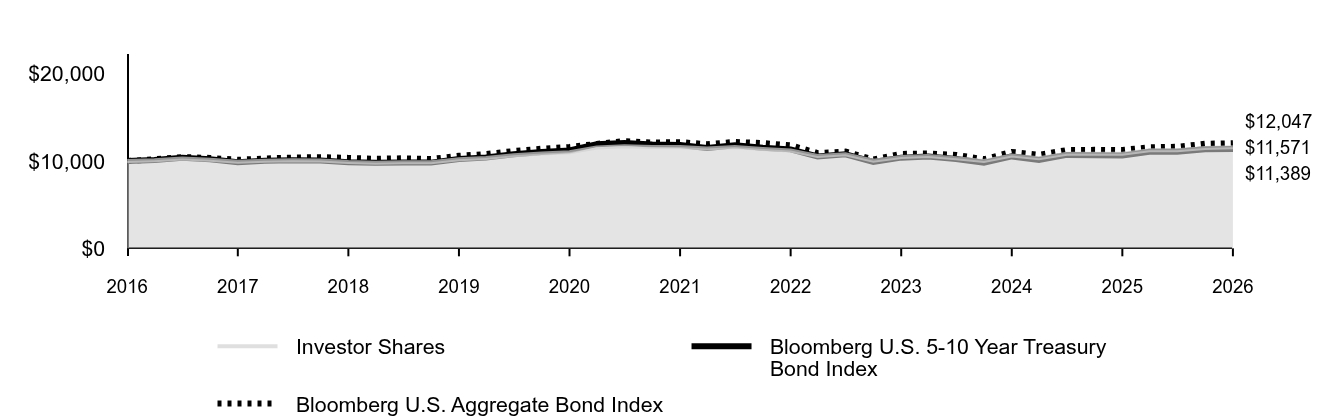 Table Summary | Investor Shares | Bloomberg U.S. 5-10 Year Treasury Bond Index | Bloomberg U.S. Aggregate Bond Index |
|---|
2016 | $10,000 | $10,000 | $10,000 |
|---|
2016 | $10,091 | $10,111 | $10,202 |
|---|
2016 | $10,281 | $10,373 | $10,454 |
|---|
2016 | $10,160 | $10,194 | $10,356 |
|---|
2017 | $9,916 | $9,859 | $10,145 |
|---|
2017 | $10,038 | $10,024 | $10,287 |
|---|
2017 | $10,092 | $10,089 | $10,400 |
|---|
2017 | $10,073 | $10,074 | $10,450 |
|---|
2018 | $9,885 | $9,867 | $10,363 |
|---|
2018 | $9,819 | $9,793 | $10,254 |
|---|
2018 | $9,869 | $9,847 | $10,317 |
|---|
2018 | $9,858 | $9,822 | $10,235 |
|---|
2019 | $10,201 | $10,242 | $10,597 |
|---|
2019 | $10,350 | $10,398 | $10,797 |
|---|
2019 | $10,653 | $10,770 | $11,151 |
|---|
2019 | $10,858 | $11,042 | $11,413 |
|---|
2020 | $11,015 | $11,224 | $11,619 |
|---|
2020 | $11,558 | $11,940 | $11,967 |
|---|
2020 | $11,698 | $12,066 | $12,279 |
|---|
2020 | $11,621 | $11,908 | $12,119 |
|---|
2021 | $11,620 | $11,839 | $12,167 |
|---|
2021 | $11,437 | $11,495 | $11,935 |
|---|
2021 | $11,616 | $11,798 | $12,193 |
|---|
2021 | $11,388 | $11,517 | $12,061 |
|---|
2022 | $11,215 | $11,341 | $11,806 |
|---|
2022 | $10,576 | $10,531 | $10,919 |
|---|
2022 | $10,769 | $10,776 | $11,082 |
|---|
2022 | $10,032 | $9,898 | $10,170 |
|---|
2023 | $10,458 | $10,392 | $10,819 |
|---|
2023 | $10,569 | $10,523 | $10,873 |
|---|
2023 | $10,313 | $10,228 | $10,708 |
|---|
2023 | $10,008 | $9,798 | $10,206 |
|---|
2024 | $10,646 | $10,532 | $11,046 |
|---|
2024 | $10,328 | $10,133 | $10,713 |
|---|
2024 | $10,847 | $10,707 | $11,255 |
|---|
2024 | $10,831 | $10,655 | $11,282 |
|---|
2025 | $10,829 | $10,626 | $11,274 |
|---|
2025 | $11,248 | $11,072 | $11,572 |
|---|
2025 | $11,237 | $11,060 | $11,635 |
|---|
2025 | $11,507 | $11,361 | $11,977 |
|---|
2026 | $11,571 | $11,389 | $12,047 |
|---|
|
|
| Average Annual Return [Table Text Block] |
|
Table Summary | 1 Year | 5 Years | 10 Years |
|---|
Investor Shares | 6.86% | -0.08% | 1.47% |
|---|
Bloomberg U.S. 5-10 Year Treasury Bond Index | 7.18% | -0.77% | 1.31% |
|---|
Bloomberg U.S. Aggregate Bond Index | 6.85% | -0.20% | 1.88% |
|---|
|
|
| No Deduction of Taxes [Text Block] |
|
The graph and returns shown do not reflect taxes that a shareholder would pay on fund distributions or on the sale of fund shares.
|
|
| Material Change Date |
|
|
Jan. 31, 2025
|
| Updated Performance Information Location [Text Block] |
|
Updated performance information is available on our website at vanguard.com/performance or by calling Vanguard toll-free at 800-662-7447.
|
|
| AssetsNet |
|
$ 7,105,000,000
|
|
| Holdings Count | Holding |
|
231
|
|
| Advisory Fees Paid, Amount |
|
$ 829,000
|
|
| InvestmentCompanyPortfolioTurnover |
|
173.00%
|
|
| Additional Fund Statistics [Text Block] |
|
Fund Statistics
(as of January 31, 2026)Table SummaryFund Net Assets (in millions) | $7,105 |
|---|
Number of Portfolio Holdings | 231 |
|---|
Portfolio Turnover Rate | 173% |
|---|
Total Investment Advisory Fees (in thousands) | $829 |
|---|
|
|
| Holdings [Text Block] |
|
Portfolio Composition % of Net Assets
(as of January 31, 2026)Table SummaryAgency Bonds and Notes | 5.0% |
|---|
Asset-Backed/Commercial Mortgage-Backed Securities | 1.3% |
|---|
Conventional Mortgage-Backed Securities | 6.3% |
|---|
Nonconventional Mortgage-Backed Securities | 3.6% |
|---|
U.S. Government Securities | 81.6% |
|---|
Other Assets and Liabilities—NetFootnote Reference | 2.2% |
|---|
This table reflects the Fund's investments, including short-term investments, derivatives and other assets and liabilities. |
|
| Material Fund Change [Text Block] |
|
How has the Fund changed?Effective January 12, 2026, The Vanguard Group, Inc. exercises portfolio management responsibilities for the fund through its wholly-owned subsidiary, Vanguard Capital Management, LLC. This is a summary of certain changes to the Fund since January 31, 2025. For more complete information, you may review the Fund’s next prospectus, which we expect to be available by May 31, 2026, at https://personal1.vanguard.com/ngf-next-gen-form-webapp/fund-literature or upon request at 800-662-7447. |
|
| Material Fund Change Adviser [Text Block] |
|
Effective January 12, 2026, The Vanguard Group, Inc. exercises portfolio management responsibilities for the fund through its wholly-owned subsidiary, Vanguard Capital Management, LLC.
|
|
| Summary of Change Legend [Text Block] |
|
This is a summary of certain changes to the Fund since January 31, 2025. For more complete information, you may review the Fund’s next prospectus, which we expect to be available by May 31, 2026, at https://personal1.vanguard.com/ngf-next-gen-form-webapp/fund-literature or upon request at 800-662-7447.
|
|
| Updated Prospectus Phone Number |
|
800-662-7447
|
|
| Updated Prospectus Web Address |
|
https://personal1.vanguard.com/ngf-next-gen-form-webapp/fund-literature
|
|
| C000007100 |
|
|
|
| Shareholder Report [Line Items] |
|
|
|
| Fund Name |
|
Intermediate-Term Treasury Fund
|
|
| Class Name |
|
Admiral™ Shares
|
|
| Trading Symbol |
|
VFIUX
|
|
| Annual or Semi-Annual Statement [Text Block] |
|
This annual shareholder report contains important information about Vanguard Intermediate-Term Treasury Fund (the "Fund") for the period of February 1, 2025, to January 31, 2026.
|
|
| Additional Information [Text Block] |
|
You can find additional information about the Fund at https://personal1.vanguard.com/ngf-next-gen-form-webapp/fund-literature. You can also request this information by contacting us at 800-662-7447.
|
|
| Material Fund Change Notice [Text Block] |
|
The report describes changes to the Fund that occurred during the reporting period.
|
|
| Additional Information Phone Number |
|
<span style="white-space: nowrap; box-sizing: border-box; color: rgb(0, 0, 0); display: inline; flex-wrap: nowrap; font-size: 10.6667px; font-weight: 400; grid-area: auto; line-height: 16px; margin: 0px; overflow: visible; text-align: left; text-align-last: auto;"> 800-662-7447</span>
|
|
| Additional Information Website |
|
<span style="white-space: nowrap; box-sizing: border-box; color: rgb(0, 0, 0); display: inline; flex-wrap: nowrap; font-size: 10.6667px; font-weight: 400; grid-area: auto; line-height: 16px; margin: 0px; overflow: visible; text-align: left; text-align-last: auto;"><span style="box-sizing: border-box; color: rgb(0, 0, 0); display: inline; flex-wrap: nowrap; font-size: 10.6667px; font-weight: 400; grid-area: auto; line-height: 16px; margin: 0px; overflow: visible; text-align: left; text-align-last: auto; white-space-collapse: collapse;"><span style="text-decoration: underline; box-sizing: border-box; color: rgb(0, 0, 0); display: inline; flex-wrap: nowrap; font-size: 10.6667px; font-weight: 400; grid-area: auto; line-height: 16px; margin: 0px; overflow: visible; text-align: left; text-align-last: auto; white-space-collapse: collapse;">https://personal1.vanguard.com/ngf-next-gen-form-webapp/fund-literature</span></span></span>
|
|
| Expenses [Text Block] |
|
What were the Fund costs for the last year?(based on a hypothetical $10,000 investment) Table SummaryShare Class Name | Costs of a $10,000 investment | Costs paid as a percentage of a $10,000 investment |
|---|
Admiral Shares | $10 | 0.10% |
|---|
|
|
| Expenses Paid, Amount |
|
$ 10
|
|
| Expense Ratio, Percent |
|
0.10%
|
|
| Factors Affecting Performance [Text Block] |
|
How did the Fund perform during the reporting period? For the 12 months ended January 31, 2026, the Fund underperformed its benchmark. The first part of the period was marked by volatility in the financial markets amid fears that U.S. tariff announcements might spark trade wars and drag down global growth. Despite these concerns, markets posted solid gains for the 12 months, buoyed by optimism surrounding artificial intelligence, robust corporate earnings, and a more dovish monetary policy. The European Central Bank and the Federal Reserve each cut interest rates three times, while the Bank of England lowered rates four times. U.S. Treasury yields ended the period lower for all but the longest-dated maturities. The yield on the 2-year U.S. Treasury bill fell 0.67 percentage points to end the period at 3.52%, while the yield on the bellwether 10-year U.S. Treasury note declined a more modest 0.30 percentage points to finish at 4.24%. The Fund’s underperformance was driven largely by its duration positioning throughout the period. Strong security selection, on the other hand, added value.
|
|
| Performance Past Does Not Indicate Future [Text] |
|
Keep in mind that the Fund's past performance does not indicate how the Fund will perform in the future.
|
|
| Line Graph [Table Text Block] |
|
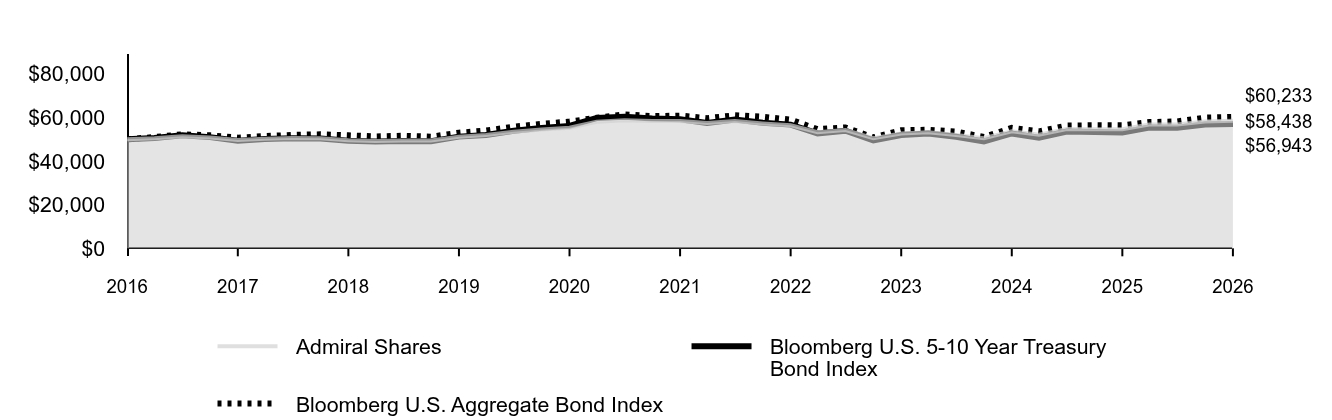 Table Summary | Admiral Shares | Bloomberg U.S. 5-10 Year Treasury Bond Index | Bloomberg U.S. Aggregate Bond Index |
|---|
2016 | $50,000 | $50,000 | $50,000 |
|---|
2016 | $50,467 | $50,556 | $51,012 |
|---|
2016 | $51,428 | $51,867 | $52,270 |
|---|
2016 | $50,838 | $50,970 | $51,781 |
|---|
2017 | $49,628 | $49,297 | $50,726 |
|---|
2017 | $50,254 | $50,118 | $51,434 |
|---|
2017 | $50,535 | $50,443 | $52,001 |
|---|
2017 | $50,453 | $50,371 | $52,248 |
|---|
2018 | $49,522 | $49,334 | $51,816 |
|---|
2018 | $49,206 | $48,965 | $51,270 |
|---|
2018 | $49,469 | $49,237 | $51,585 |
|---|
2018 | $49,423 | $49,112 | $51,175 |
|---|
2019 | $51,157 | $51,208 | $52,983 |
|---|
2019 | $51,917 | $51,991 | $53,983 |
|---|
2019 | $53,450 | $53,850 | $55,753 |
|---|
2019 | $54,495 | $55,210 | $57,065 |
|---|
2020 | $55,295 | $56,120 | $58,093 |
|---|
2020 | $58,034 | $59,702 | $59,835 |
|---|
2020 | $58,752 | $60,332 | $61,396 |
|---|
2020 | $58,382 | $59,542 | $60,596 |
|---|
2021 | $58,393 | $59,197 | $60,835 |
|---|
2021 | $57,487 | $57,476 | $59,676 |
|---|
2021 | $58,399 | $58,990 | $60,965 |
|---|
2021 | $57,269 | $57,586 | $60,306 |
|---|
2022 | $56,412 | $56,706 | $59,030 |
|---|
2022 | $53,209 | $52,657 | $54,596 |
|---|
2022 | $54,196 | $53,880 | $55,408 |
|---|
2022 | $50,500 | $49,490 | $50,848 |
|---|
2023 | $52,656 | $51,959 | $54,095 |
|---|
2023 | $53,230 | $52,616 | $54,363 |
|---|
2023 | $51,955 | $51,139 | $53,542 |
|---|
2023 | $50,429 | $48,990 | $51,029 |
|---|
2024 | $53,657 | $52,659 | $55,230 |
|---|
2024 | $52,066 | $50,665 | $53,565 |
|---|
2024 | $54,699 | $53,534 | $56,273 |
|---|
2024 | $54,632 | $53,274 | $56,411 |
|---|
2025 | $54,631 | $53,130 | $56,372 |
|---|
2025 | $56,763 | $55,361 | $57,861 |
|---|
2025 | $56,719 | $55,302 | $58,176 |
|---|
2025 | $58,096 | $56,804 | $59,886 |
|---|
2026 | $58,438 | $56,943 | $60,233 |
|---|
|
|
| Average Annual Return [Table Text Block] |
|
Table Summary | 1 Year | 5 Years | 10 Years |
|---|
Admiral Shares | 6.97% | 0.02% | 1.57% |
|---|
Bloomberg U.S. 5-10 Year Treasury Bond Index | 7.18% | -0.77% | 1.31% |
|---|
Bloomberg U.S. Aggregate Bond Index | 6.85% | -0.20% | 1.88% |
|---|
|
|
| No Deduction of Taxes [Text Block] |
|
The graph and returns shown do not reflect taxes that a shareholder would pay on fund distributions or on the sale of fund shares.
|
|
| Material Change Date |
|
|
Jan. 31, 2025
|
| Updated Performance Information Location [Text Block] |
|
Updated performance information is available on our website at vanguard.com/performance or by calling Vanguard toll-free at 800-662-7447.
|
|
| AssetsNet |
|
$ 7,105,000,000
|
|
| Holdings Count | Holding |
|
231
|
|
| Advisory Fees Paid, Amount |
|
$ 829,000
|
|
| InvestmentCompanyPortfolioTurnover |
|
173.00%
|
|
| Additional Fund Statistics [Text Block] |
|
Fund Statistics
(as of January 31, 2026)Table SummaryFund Net Assets (in millions) | $7,105 |
|---|
Number of Portfolio Holdings | 231 |
|---|
Portfolio Turnover Rate | 173% |
|---|
Total Investment Advisory Fees (in thousands) | $829 |
|---|
|
|
| Holdings [Text Block] |
|
Portfolio Composition % of Net Assets
(as of January 31, 2026)Table SummaryAgency Bonds and Notes | 5.0% |
|---|
Asset-Backed/Commercial Mortgage-Backed Securities | 1.3% |
|---|
Conventional Mortgage-Backed Securities | 6.3% |
|---|
Nonconventional Mortgage-Backed Securities | 3.6% |
|---|
U.S. Government Securities | 81.6% |
|---|
Other Assets and Liabilities—NetFootnote Reference | 2.2% |
|---|
This table reflects the Fund's investments, including short-term investments, derivatives and other assets and liabilities. |
|
| Material Fund Change [Text Block] |
|
How has the Fund changed?Effective January 12, 2026, The Vanguard Group, Inc. exercises portfolio management responsibilities for the fund through its wholly-owned subsidiary, Vanguard Capital Management, LLC. This is a summary of certain changes to the Fund since January 31, 2025. For more complete information, you may review the Fund’s next prospectus, which we expect to be available by May 31, 2026, at https://personal1.vanguard.com/ngf-next-gen-form-webapp/fund-literature or upon request at 800-662-7447. |
|
| Material Fund Change Adviser [Text Block] |
|
Effective January 12, 2026, The Vanguard Group, Inc. exercises portfolio management responsibilities for the fund through its wholly-owned subsidiary, Vanguard Capital Management, LLC.
|
|
| Summary of Change Legend [Text Block] |
|
This is a summary of certain changes to the Fund since January 31, 2025. For more complete information, you may review the Fund’s next prospectus, which we expect to be available by May 31, 2026, at https://personal1.vanguard.com/ngf-next-gen-form-webapp/fund-literature or upon request at 800-662-7447.
|
|
| Updated Prospectus Phone Number |
|
800-662-7447
|
|
| Updated Prospectus Web Address |
|
https://personal1.vanguard.com/ngf-next-gen-form-webapp/fund-literature
|
|
| C000007101 |
|
|
|
| Shareholder Report [Line Items] |
|
|
|
| Fund Name |
|
Long-Term Investment-Grade Fund
|
|
| Class Name |
|
Investor Shares
|
|
| Trading Symbol |
|
VWESX
|
|
| Annual or Semi-Annual Statement [Text Block] |
|
This annual shareholder report contains important information about Vanguard Long-Term Investment-Grade Fund (the "Fund") for the period of February 1, 2025, to January 31, 2026.
|
|
| Additional Information [Text Block] |
|
You can find additional information about the Fund at https://personal1.vanguard.com/ngf-next-gen-form-webapp/fund-literature. You can also request this information by contacting us at 800-662-7447.
|
|
| Material Fund Change Notice [Text Block] |
|
The report describes changes to the Fund that occurred during the reporting period.
|
|
| Additional Information Phone Number |
|
<span style="white-space: nowrap; box-sizing: border-box; color: rgb(0, 0, 0); display: inline; flex-wrap: nowrap; font-size: 10.6667px; font-weight: 400; grid-area: auto; line-height: 16px; margin: 0px; overflow: visible; text-align: left; text-align-last: auto;"> 800-662-7447</span>
|
|
| Additional Information Website |
|
<span style="white-space: nowrap; box-sizing: border-box; color: rgb(0, 0, 0); display: inline; flex-wrap: nowrap; font-size: 10.6667px; font-weight: 400; grid-area: auto; line-height: 16px; margin: 0px; overflow: visible; text-align: left; text-align-last: auto;"><span style="box-sizing: border-box; color: rgb(0, 0, 0); display: inline; flex-wrap: nowrap; font-size: 10.6667px; font-weight: 400; grid-area: auto; line-height: 16px; margin: 0px; overflow: visible; text-align: left; text-align-last: auto; white-space-collapse: collapse;"><span style="text-decoration: underline; box-sizing: border-box; color: rgb(0, 0, 0); display: inline; flex-wrap: nowrap; font-size: 10.6667px; font-weight: 400; grid-area: auto; line-height: 16px; margin: 0px; overflow: visible; text-align: left; text-align-last: auto; white-space-collapse: collapse;">https://personal1.vanguard.com/ngf-next-gen-form-webapp/fund-literature</span></span></span>
|
|
| Expenses [Text Block] |
|
What were the Fund costs for the last year?(based on a hypothetical $10,000 investment) Table SummaryShare Class Name | Costs of a $10,000 investment | Costs paid as a percentage of a $10,000 investment |
|---|
Investor Shares | $22 | 0.21% |
|---|
|
|
| Expenses Paid, Amount |
|
$ 22
|
|
| Expense Ratio, Percent |
|
0.21%
|
|
| Factors Affecting Performance [Text Block] |
|
How did the Fund perform during the reporting period? For the 12 months ended January 31, 2026, the Fund slightly underperformed its benchmark. The first part of the period was marked by volatility in the financial markets amid fears that U.S. tariff announcements might spark trade wars and drag down global growth. Despite these concerns, markets posted solid gains for the 12 months, buoyed by optimism surrounding artificial intelligence, robust corporate earnings, and a more dovish monetary policy. The European Central Bank and the Federal Reserve each cut interest rates three times, while the Bank of England lowered rates four times. The Fund’s underweight allocation to credit risk detracted the most from relative performance. Security selection, particularly among industrial issuers, added value.
|
|
| Performance Past Does Not Indicate Future [Text] |
|
Keep in mind that the Fund's past performance does not indicate how the Fund will perform in the future.
|
|
| Line Graph [Table Text Block] |
|
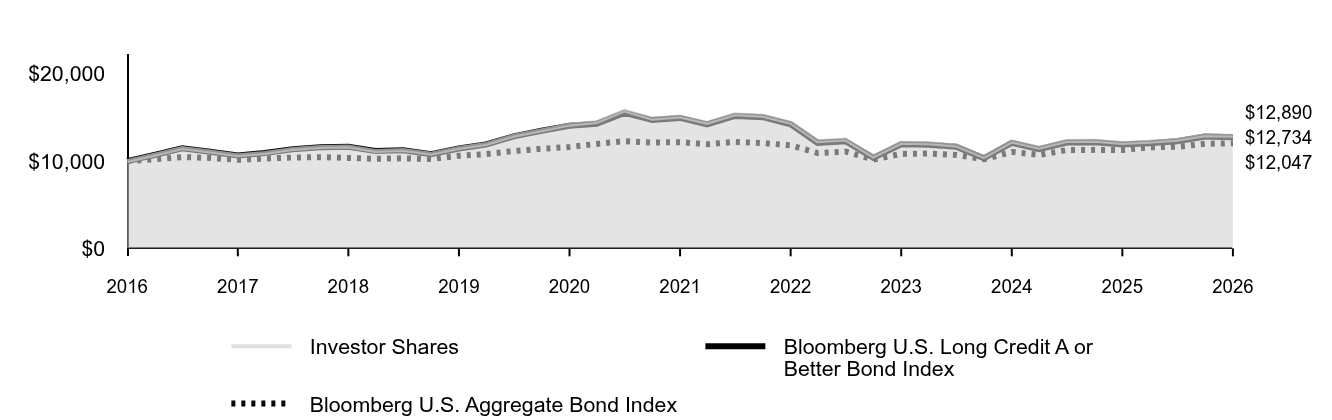 Table Summary | Investor Shares | Bloomberg U.S. Long Credit A or Better Bond Index | Bloomberg U.S. Aggregate Bond Index |
|---|
2016 | $10,000 | $10,000 | $10,000 |
|---|
2016 | $10,729 | $10,697 | $10,202 |
|---|
2016 | $11,482 | $11,459 | $10,454 |
|---|
2016 | $11,090 | $11,059 | $10,356 |
|---|
2017 | $10,671 | $10,644 | $10,145 |
|---|
2017 | $10,931 | $10,930 | $10,287 |
|---|
2017 | $11,389 | $11,349 | $10,400 |
|---|
2017 | $11,601 | $11,583 | $10,450 |
|---|
2018 | $11,662 | $11,639 | $10,363 |
|---|
2018 | $11,151 | $11,150 | $10,254 |
|---|
2018 | $11,270 | $11,225 | $10,317 |
|---|
2018 | $10,846 | $10,794 | $10,235 |
|---|
2019 | $11,493 | $11,444 | $10,597 |
|---|
2019 | $11,964 | $11,899 | $10,797 |
|---|
2019 | $12,893 | $12,830 | $11,151 |
|---|
2019 | $13,538 | $13,469 | $11,413 |
|---|
2020 | $14,172 | $14,041 | $11,619 |
|---|
2020 | $14,479 | $14,269 | $11,967 |
|---|
2020 | $15,793 | $15,527 | $12,279 |
|---|
2020 | $14,860 | $14,701 | $12,119 |
|---|
2021 | $15,098 | $14,942 | $12,167 |
|---|
2021 | $14,381 | $14,210 | $11,935 |
|---|
2021 | $15,355 | $15,172 | $12,193 |
|---|
2021 | $15,199 | $15,027 | $12,061 |
|---|
2022 | $14,398 | $14,214 | $11,806 |
|---|
2022 | $12,276 | $12,088 | $10,919 |
|---|
2022 | $12,469 | $12,276 | $11,082 |
|---|
2022 | $10,529 | $10,367 | $10,170 |
|---|
2023 | $12,086 | $11,920 | $10,819 |
|---|
2023 | $12,047 | $11,881 | $10,873 |
|---|
2023 | $11,787 | $11,635 | $10,708 |
|---|
2023 | $10,448 | $10,321 | $10,206 |
|---|
2024 | $12,233 | $12,081 | $11,046 |
|---|
2024 | $11,520 | $11,365 | $10,713 |
|---|
2024 | $12,302 | $12,121 | $11,255 |
|---|
2024 | $12,322 | $12,147 | $11,282 |
|---|
2025 | $12,058 | $11,891 | $11,274 |
|---|
2025 | $12,208 | $12,033 | $11,572 |
|---|
2025 | $12,428 | $12,271 | $11,635 |
|---|
2025 | $12,964 | $12,813 | $11,977 |
|---|
2026 | $12,890 | $12,734 | $12,047 |
|---|
|
|
| Average Annual Return [Table Text Block] |
|
Table Summary | 1 Year | 5 Years | 10 Years |
|---|
Investor Shares | 6.90% | -3.11% | 2.57% |
|---|
Bloomberg U.S. Long Credit A or Better Bond Index | 7.09% | -3.15% | 2.45% |
|---|
Bloomberg U.S. Aggregate Bond Index | 6.85% | -0.20% | 1.88% |
|---|
|
|
| No Deduction of Taxes [Text Block] |
|
The graph and returns shown do not reflect taxes that a shareholder would pay on fund distributions or on the sale of fund shares.
|
|
| Material Change Date |
|
|
Jan. 31, 2025
|
| Updated Performance Information Location [Text Block] |
|
Updated performance information is available on our website at vanguard.com/performance or by calling Vanguard toll-free at 800-662-7447.
|
|
| AssetsNet |
|
$ 10,483,000,000
|
|
| Holdings Count | Holding |
|
1,375
|
|
| Advisory Fees Paid, Amount |
|
$ 2,053,000
|
|
| InvestmentCompanyPortfolioTurnover |
|
60.00%
|
|
| Additional Fund Statistics [Text Block] |
|
Fund Statistics
(as of January 31, 2026)Table SummaryFund Net Assets (in millions) | $10,483 |
|---|
Number of Portfolio Holdings | 1,375 |
|---|
Portfolio Turnover Rate | 60% |
|---|
Total Investment Advisory Fees (in thousands) | $2,053 |
|---|
|
|
| Holdings [Text Block] |
|
Portfolio Composition % of Net Assets
(as of January 31, 2026)Table SummaryCommunications | 6.8% | |
|---|
Consumer Discretionary | 3.6% | |
|---|
Consumer Staples | 4.7% | |
|---|
Energy | 5.6% | |
|---|
Financials | 17.8% | |
|---|
Health Care | 11.6% | |
|---|
Industrials | 6.1% | |
|---|
Materials | 1.3% | |
|---|
Real Estate | 0.6% | |
|---|
Technology | 6.3% | |
|---|
Utilities | 15.4% | |
|---|
Other | 16.8% | |
|---|
Other Assets and Liabilities—NetFootnote Reference | 3.4% | |
|---|
This table reflects the Fund's investments, including short-term investments, derivatives and other assets and liabilities. |
|
| Material Fund Change [Text Block] |
|
How has the Fund changed?Effective January 12, 2026, The Vanguard Group, Inc. exercises portfolio management responsibilities for the fund through its wholly-owned subsidiary, Vanguard Capital Management, LLC. This is a summary of certain changes to the Fund since January 31, 2025. For more complete information, you may review the Fund’s next prospectus, which we expect to be available by May 31, 2026, at https://personal1.vanguard.com/ngf-next-gen-form-webapp/fund-literature or upon request at 800-662-7447. |
|
| Material Fund Change Adviser [Text Block] |
|
Effective January 12, 2026, The Vanguard Group, Inc. exercises portfolio management responsibilities for the fund through its wholly-owned subsidiary, Vanguard Capital Management, LLC.
|
|
| Summary of Change Legend [Text Block] |
|
This is a summary of certain changes to the Fund since January 31, 2025. For more complete information, you may review the Fund’s next prospectus, which we expect to be available by May 31, 2026, at https://personal1.vanguard.com/ngf-next-gen-form-webapp/fund-literature or upon request at 800-662-7447.
|
|
| Updated Prospectus Phone Number |
|
800-662-7447
|
|
| Updated Prospectus Web Address |
|
https://personal1.vanguard.com/ngf-next-gen-form-webapp/fund-literature
|
|
| C000007102 |
|
|
|
| Shareholder Report [Line Items] |
|
|
|
| Fund Name |
|
Long-Term Investment-Grade Fund
|
|
| Class Name |
|
Admiral™ Shares
|
|
| Trading Symbol |
|
VWETX
|
|
| Annual or Semi-Annual Statement [Text Block] |
|
This annual shareholder report contains important information about Vanguard Long-Term Investment-Grade Fund (the "Fund") for the period of February 1, 2025, to January 31, 2026.
|
|
| Additional Information [Text Block] |
|
You can find additional information about the Fund at https://personal1.vanguard.com/ngf-next-gen-form-webapp/fund-literature. You can also request this information by contacting us at 800-662-7447.
|
|
| Material Fund Change Notice [Text Block] |
|
The report describes changes to the Fund that occurred during the reporting period.
|
|
| Additional Information Phone Number |
|
<span style="white-space: nowrap; box-sizing: border-box; color: rgb(0, 0, 0); display: inline; flex-wrap: nowrap; font-size: 10.6667px; font-weight: 400; grid-area: auto; line-height: 16px; margin: 0px; overflow: visible; text-align: left; text-align-last: auto;"> 800-662-7447</span>
|
|
| Additional Information Website |
|
<span style="white-space: nowrap; box-sizing: border-box; color: rgb(0, 0, 0); display: inline; flex-wrap: nowrap; font-size: 10.6667px; font-weight: 400; grid-area: auto; line-height: 16px; margin: 0px; overflow: visible; text-align: left; text-align-last: auto;"><span style="box-sizing: border-box; color: rgb(0, 0, 0); display: inline; flex-wrap: nowrap; font-size: 10.6667px; font-weight: 400; grid-area: auto; line-height: 16px; margin: 0px; overflow: visible; text-align: left; text-align-last: auto; white-space-collapse: collapse;"><span style="text-decoration: underline; box-sizing: border-box; color: rgb(0, 0, 0); display: inline; flex-wrap: nowrap; font-size: 10.6667px; font-weight: 400; grid-area: auto; line-height: 16px; margin: 0px; overflow: visible; text-align: left; text-align-last: auto; white-space-collapse: collapse;">https://personal1.vanguard.com/ngf-next-gen-form-webapp/fund-literature</span></span></span>
|
|
| Expenses [Text Block] |
|
What were the Fund costs for the last year?(based on a hypothetical $10,000 investment) Table SummaryShare Class Name | Costs of a $10,000 investment | Costs paid as a percentage of a $10,000 investment |
|---|
Admiral Shares | $10 | 0.10% |
|---|
|
|
| Expenses Paid, Amount |
|
$ 10
|
|
| Expense Ratio, Percent |
|
0.10%
|
|
| Factors Affecting Performance [Text Block] |
|
How did the Fund perform during the reporting period? For the 12 months ended January 31, 2026, the Fund slightly underperformed its benchmark. The first part of the period was marked by volatility in the financial markets amid fears that U.S. tariff announcements might spark trade wars and drag down global growth. Despite these concerns, markets posted solid gains for the 12 months, buoyed by optimism surrounding artificial intelligence, robust corporate earnings, and a more dovish monetary policy. The European Central Bank and the Federal Reserve each cut interest rates three times, while the Bank of England lowered rates four times. The Fund’s underweight allocation to credit risk detracted the most from relative performance. Security selection, particularly among industrial issuers, added value.
|
|
| Performance Past Does Not Indicate Future [Text] |
|
Keep in mind that the Fund's past performance does not indicate how the Fund will perform in the future.
|
|
| Line Graph [Table Text Block] |
|
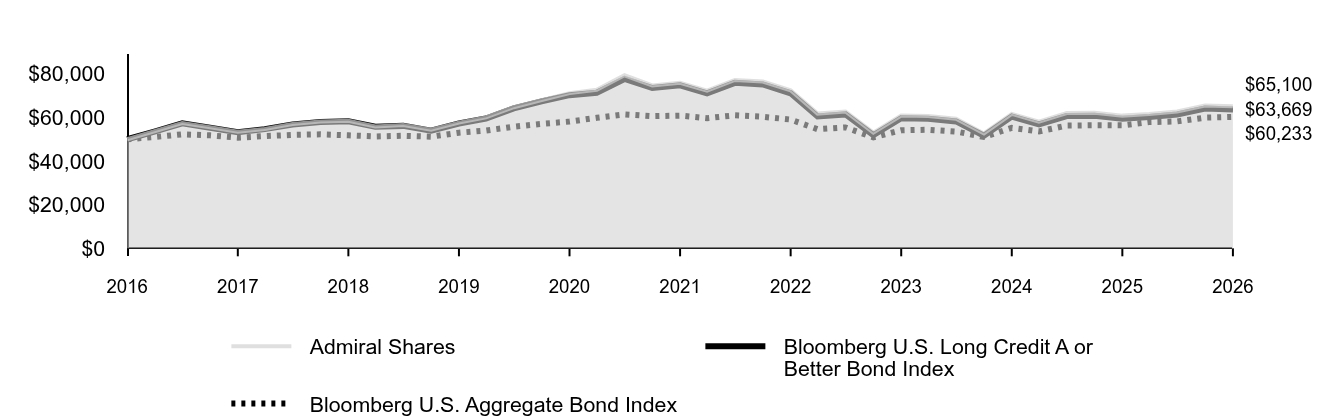 Table Summary | Admiral Shares | Bloomberg U.S. Long Credit A or Better Bond Index | Bloomberg U.S. Aggregate Bond Index |
|---|
2016 | $50,000 | $50,000 | $50,000 |
|---|
2016 | $53,657 | $53,483 | $51,012 |
|---|
2016 | $57,436 | $57,297 | $52,270 |
|---|
2016 | $55,490 | $55,297 | $51,781 |
|---|
2017 | $53,410 | $53,219 | $50,726 |
|---|
2017 | $54,725 | $54,648 | $51,434 |
|---|
2017 | $57,031 | $56,744 | $52,001 |
|---|
2017 | $58,109 | $57,916 | $52,248 |
|---|
2018 | $58,426 | $58,196 | $51,816 |
|---|
2018 | $55,878 | $55,748 | $51,270 |
|---|
2018 | $56,489 | $56,127 | $51,585 |
|---|
2018 | $54,379 | $53,970 | $51,175 |
|---|
2019 | $57,637 | $57,218 | $52,983 |
|---|
2019 | $60,014 | $59,496 | $53,983 |
|---|
2019 | $64,689 | $64,150 | $55,753 |
|---|
2019 | $67,943 | $67,344 | $57,065 |
|---|
2020 | $71,140 | $70,205 | $58,093 |
|---|
2020 | $72,700 | $71,343 | $59,835 |
|---|
2020 | $79,317 | $77,634 | $61,396 |
|---|
2020 | $74,652 | $73,503 | $60,596 |
|---|
2021 | $75,865 | $74,712 | $60,835 |
|---|
2021 | $72,282 | $71,048 | $59,676 |
|---|
2021 | $77,197 | $75,860 | $60,965 |
|---|
2021 | $76,431 | $75,134 | $60,306 |
|---|
2022 | $72,418 | $71,068 | $59,030 |
|---|
2022 | $61,761 | $60,441 | $54,596 |
|---|
2022 | $62,749 | $61,380 | $55,408 |
|---|
2022 | $53,002 | $51,833 | $50,848 |
|---|
2023 | $60,853 | $59,598 | $54,095 |
|---|
2023 | $60,673 | $59,405 | $54,363 |
|---|
2023 | $59,377 | $58,175 | $53,542 |
|---|
2023 | $52,643 | $51,606 | $51,029 |
|---|
2024 | $61,653 | $60,403 | $55,230 |
|---|
2024 | $58,075 | $56,824 | $53,565 |
|---|
2024 | $62,032 | $60,604 | $56,273 |
|---|
2024 | $62,147 | $60,735 | $56,411 |
|---|
2025 | $60,832 | $59,455 | $56,372 |
|---|
2025 | $61,606 | $60,164 | $57,861 |
|---|
2025 | $62,734 | $61,357 | $58,176 |
|---|
2025 | $65,456 | $64,066 | $59,886 |
|---|
2026 | $65,100 | $63,669 | $60,233 |
|---|
|
|
| Average Annual Return [Table Text Block] |
|
Table Summary | 1 Year | 5 Years | 10 Years |
|---|
Admiral Shares | 7.02% | -3.01% | 2.67% |
|---|
Bloomberg U.S. Long Credit A or Better Bond Index | 7.09% | -3.15% | 2.45% |
|---|
Bloomberg U.S. Aggregate Bond Index | 6.85% | -0.20% | 1.88% |
|---|
|
|
| No Deduction of Taxes [Text Block] |
|
The graph and returns shown do not reflect taxes that a shareholder would pay on fund distributions or on the sale of fund shares.
|
|
| Material Change Date |
|
|
Jan. 31, 2025
|
| Updated Performance Information Location [Text Block] |
|
Updated performance information is available on our website at vanguard.com/performance or by calling Vanguard toll-free at 800-662-7447.
|
|
| AssetsNet |
|
$ 10,483,000,000
|
|
| Holdings Count | Holding |
|
1,375
|
|
| Advisory Fees Paid, Amount |
|
$ 2,053,000
|
|
| InvestmentCompanyPortfolioTurnover |
|
60.00%
|
|
| Additional Fund Statistics [Text Block] |
|
Fund Statistics
(as of January 31, 2026)Table SummaryFund Net Assets (in millions) | $10,483 |
|---|
Number of Portfolio Holdings | 1,375 |
|---|
Portfolio Turnover Rate | 60% |
|---|
Total Investment Advisory Fees (in thousands) | $2,053 |
|---|
|
|
| Holdings [Text Block] |
|
Portfolio Composition % of Net Assets
(as of January 31, 2026)Table SummaryCommunications | 6.8% | |
|---|
Consumer Discretionary | 3.6% | |
|---|
Consumer Staples | 4.7% | |
|---|
Energy | 5.6% | |
|---|
Financials | 17.8% | |
|---|
Health Care | 11.6% | |
|---|
Industrials | 6.1% | |
|---|
Materials | 1.3% | |
|---|
Real Estate | 0.6% | |
|---|
Technology | 6.3% | |
|---|
Utilities | 15.4% | |
|---|
Other | 16.8% | |
|---|
Other Assets and Liabilities—NetFootnote Reference | 3.4% | |
|---|
This table reflects the Fund's investments, including short-term investments, derivatives and other assets and liabilities. |
|
| Material Fund Change [Text Block] |
|
How has the Fund changed?During the reporting period, the expense ratio for the Admiral Share class was reduced. Effective January 12, 2026, The Vanguard Group, Inc. exercises portfolio management responsibilities for the fund through its wholly-owned subsidiary, Vanguard Capital Management, LLC. This is a summary of certain changes to the Fund since January 31, 2025. For more complete information, you may review the Fund’s next prospectus, which we expect to be available by May 31, 2026, at https://personal1.vanguard.com/ngf-next-gen-form-webapp/fund-literature or upon request at 800-662-7447. |
|
| Material Fund Change Expenses [Text Block] |
|
During the reporting period, the expense ratio for the Admiral Share class was reduced.
|
|
| Material Fund Change Adviser [Text Block] |
|
Effective January 12, 2026, The Vanguard Group, Inc. exercises portfolio management responsibilities for the fund through its wholly-owned subsidiary, Vanguard Capital Management, LLC.
|
|
| Summary of Change Legend [Text Block] |
|
This is a summary of certain changes to the Fund since January 31, 2025. For more complete information, you may review the Fund’s next prospectus, which we expect to be available by May 31, 2026, at https://personal1.vanguard.com/ngf-next-gen-form-webapp/fund-literature or upon request at 800-662-7447.
|
|
| Updated Prospectus Phone Number |
|
800-662-7447
|
|
| Updated Prospectus Web Address |
|
https://personal1.vanguard.com/ngf-next-gen-form-webapp/fund-literature
|
|
| C000007103 |
|
|
|
| Shareholder Report [Line Items] |
|
|
|
| Fund Name |
|
Long-Term Treasury Fund
|
|
| Class Name |
|
Investor Shares
|
|
| Trading Symbol |
|
VUSTX
|
|
| Annual or Semi-Annual Statement [Text Block] |
|
This annual shareholder report contains important information about Vanguard Long-Term Treasury Fund (the "Fund") for the period of February 1, 2025, to January 31, 2026.
|
|
| Additional Information [Text Block] |
|
You can find additional information about the Fund at https://personal1.vanguard.com/ngf-next-gen-form-webapp/fund-literature. You can also request this information by contacting us at 800-662-7447.
|
|
| Material Fund Change Notice [Text Block] |
|
The report describes changes to the Fund that occurred during the reporting period.
|
|
| Additional Information Phone Number |
|
<span style="white-space: nowrap; box-sizing: border-box; color: rgb(0, 0, 0); display: inline; flex-wrap: nowrap; font-size: 10.6667px; font-weight: 400; grid-area: auto; line-height: 16px; margin: 0px; overflow: visible; text-align: left; text-align-last: auto;"> 800-662-7447</span>
|
|
| Additional Information Website |
|
<span style="white-space: nowrap; box-sizing: border-box; color: rgb(0, 0, 0); display: inline; flex-wrap: nowrap; font-size: 10.6667px; font-weight: 400; grid-area: auto; line-height: 16px; margin: 0px; overflow: visible; text-align: left; text-align-last: auto;"><span style="box-sizing: border-box; color: rgb(0, 0, 0); display: inline; flex-wrap: nowrap; font-size: 10.6667px; font-weight: 400; grid-area: auto; line-height: 16px; margin: 0px; overflow: visible; text-align: left; text-align-last: auto; white-space-collapse: collapse;"><span style="text-decoration: underline; box-sizing: border-box; color: rgb(0, 0, 0); display: inline; flex-wrap: nowrap; font-size: 10.6667px; font-weight: 400; grid-area: auto; line-height: 16px; margin: 0px; overflow: visible; text-align: left; text-align-last: auto; white-space-collapse: collapse;">https://personal1.vanguard.com/ngf-next-gen-form-webapp/fund-literature</span></span></span>
|
|
| Expenses [Text Block] |
|
What were the Fund costs for the last year?(based on a hypothetical $10,000 investment) Table SummaryShare Class Name | Costs of a $10,000 investment | Costs paid as a percentage of a $10,000 investment |
|---|
Investor Shares | $20 | 0.20% |
|---|
|
|
| Expenses Paid, Amount |
|
$ 20
|
|
| Expense Ratio, Percent |
|
0.20%
|
|
| Factors Affecting Performance [Text Block] |
|
How did the Fund perform during the reporting period? For the 12 months ended January 31, 2026, the Fund slightly outperformed its benchmark. The first part of the period was marked by volatility in the financial markets amid fears that U.S. tariff announcements might spark trade wars and drag down global growth. Despite these concerns, markets posted solid gains for the 12 months, buoyed by optimism surrounding artificial intelligence, robust corporate earnings, and a more dovish monetary policy. The European Central Bank and the Federal Reserve each cut interest rates three times, while the Bank of England lowered rates four times. U.S. Treasury yields ended the period lower for all but the longest-dated maturities. The yield on the 2-year U.S. Treasury bill fell 0.67 percentage points to end the period at 3.52%, while the yield on the bellwether 10-year U.S. Treasury note declined a more modest 0.30 percentage points to finish at 4.24%. The Fund’s outperformance was largely due to security selection within Treasuries and allocations to agency debentures and agency mortgage-backed securities. Curve positioning was a detractor.
|
|
| Performance Past Does Not Indicate Future [Text] |
|
Keep in mind that the Fund's past performance does not indicate how the Fund will perform in the future.
|
|
| Line Graph [Table Text Block] |
|
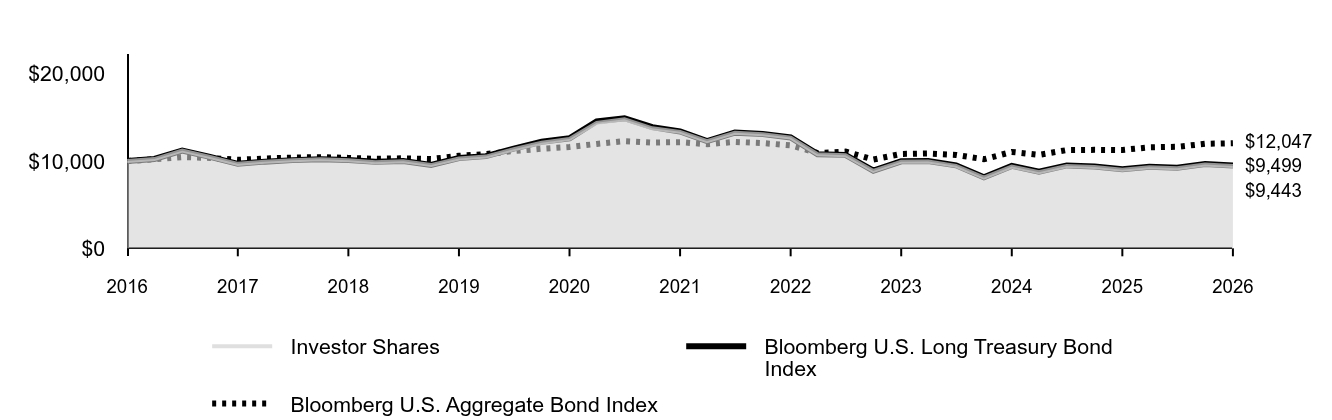 Table Summary | Investor Shares | Bloomberg U.S. Long Treasury Bond Index | Bloomberg U.S. Aggregate Bond Index |
|---|
2016 | $10,000 | $10,000 | $10,000 |
|---|
2016 | $10,227 | $10,246 | $10,202 |
|---|
2016 | $11,194 | $11,207 | $10,454 |
|---|
2016 | $10,473 | $10,477 | $10,356 |
|---|
2017 | $9,679 | $9,686 | $10,145 |
|---|
2017 | $9,927 | $9,934 | $10,287 |
|---|
2017 | $10,103 | $10,107 | $10,400 |
|---|
2017 | $10,195 | $10,221 | $10,450 |
|---|
2018 | $10,086 | $10,133 | $10,363 |
|---|
2018 | $9,860 | $9,929 | $10,254 |
|---|
2018 | $9,974 | $10,008 | $10,317 |
|---|
2018 | $9,539 | $9,564 | $10,235 |
|---|
2019 | $10,294 | $10,347 | $10,597 |
|---|
2019 | $10,514 | $10,565 | $10,797 |
|---|
2019 | $11,351 | $11,425 | $11,151 |
|---|
2019 | $12,099 | $12,204 | $11,413 |
|---|
2020 | $12,542 | $12,610 | $11,619 |
|---|
2020 | $14,382 | $14,558 | $11,967 |
|---|
2020 | $14,790 | $14,909 | $12,279 |
|---|
2020 | $13,750 | $13,890 | $12,119 |
|---|
2021 | $13,346 | $13,390 | $12,167 |
|---|
2021 | $12,276 | $12,294 | $11,935 |
|---|
2021 | $13,236 | $13,258 | $12,193 |
|---|
2021 | $13,082 | $13,090 | $12,061 |
|---|
2022 | $12,690 | $12,698 | $11,806 |
|---|
2022 | $10,775 | $10,791 | $10,919 |
|---|
2022 | $10,677 | $10,709 | $11,082 |
|---|
2022 | $8,872 | $8,903 | $10,170 |
|---|
2023 | $9,926 | $9,972 | $10,819 |
|---|
2023 | $9,949 | $10,001 | $10,873 |
|---|
2023 | $9,449 | $9,509 | $10,708 |
|---|
2023 | $8,092 | $8,147 | $10,206 |
|---|
2024 | $9,372 | $9,445 | $11,046 |
|---|
2024 | $8,718 | $8,774 | $10,713 |
|---|
2024 | $9,442 | $9,502 | $11,255 |
|---|
2024 | $9,317 | $9,376 | $11,282 |
|---|
2025 | $9,013 | $9,076 | $11,274 |
|---|
2025 | $9,288 | $9,358 | $11,572 |
|---|
2025 | $9,171 | $9,233 | $11,635 |
|---|
2025 | $9,612 | $9,671 | $11,977 |
|---|
2026 | $9,443 | $9,499 | $12,047 |
|---|
|
|
| Average Annual Return [Table Text Block] |
|
Table Summary | 1 Year | 5 Years | 10 Years |
|---|
Investor Shares | 4.76% | -6.69% | -0.57% |
|---|
Bloomberg U.S. Long Treasury Bond Index | 4.66% | -6.64% | -0.51% |
|---|
Bloomberg U.S. Aggregate Bond Index | 6.85% | -0.20% | 1.88% |
|---|
|
|
| No Deduction of Taxes [Text Block] |
|
The graph and returns shown do not reflect taxes that a shareholder would pay on fund distributions or on the sale of fund shares.
|
|
| Material Change Date |
|
|
Jan. 31, 2025
|
| Updated Performance Information Location [Text Block] |
|
Updated performance information is available on our website at vanguard.com/performance or by calling Vanguard toll-free at 800-662-7447.
|
|
| AssetsNet |
|
$ 2,836,000,000
|
|
| Holdings Count | Holding |
|
171
|
|
| Advisory Fees Paid, Amount |
|
$ 345,000
|
|
| InvestmentCompanyPortfolioTurnover |
|
292.00%
|
|
| Additional Fund Statistics [Text Block] |
|
Fund Statistics
(as of January 31, 2026)Table SummaryFund Net Assets (in millions) | $2,836 |
|---|
Number of Portfolio Holdings | 171 |
|---|
Portfolio Turnover Rate | 292% |
|---|
Total Investment Advisory Fees (in thousands) | $345 |
|---|
|
|
| Holdings [Text Block] |
|
Portfolio Composition % of Net Assets
(as of January 31, 2026)Table SummaryAgency Bonds and Notes | 4.3% |
|---|
Conventional Mortgage-Backed Securities | 7.2% |
|---|
Nonconventional Mortgage-Backed Securities | 2.0% |
|---|
U.S. Government Securities | 86.9% |
|---|
Conventional Mortgage-Backed Securities-Liability for Sale Commitments | (2.1%) |
|---|
Other Assets and Liabilities—NetFootnote Reference | 1.7% |
|---|
This table reflects the Fund's investments, including short-term investments, derivatives and other assets and liabilities. |
|
| Material Fund Change [Text Block] |
|
How has the Fund changed?Effective January 12, 2026, The Vanguard Group, Inc. exercises portfolio management responsibilities for the fund through its wholly-owned subsidiary, Vanguard Capital Management, LLC. This is a summary of certain changes to the Fund since January 31, 2025. For more complete information, you may review the Fund’s next prospectus, which we expect to be available by May 31, 2026, at https://personal1.vanguard.com/ngf-next-gen-form-webapp/fund-literature or upon request at 800-662-7447. |
|
| Material Fund Change Adviser [Text Block] |
|
Effective January 12, 2026, The Vanguard Group, Inc. exercises portfolio management responsibilities for the fund through its wholly-owned subsidiary, Vanguard Capital Management, LLC.
|
|
| Summary of Change Legend [Text Block] |
|
This is a summary of certain changes to the Fund since January 31, 2025. For more complete information, you may review the Fund’s next prospectus, which we expect to be available by May 31, 2026, at https://personal1.vanguard.com/ngf-next-gen-form-webapp/fund-literature or upon request at 800-662-7447.
|
|
| Updated Prospectus Phone Number |
|
800-662-7447
|
|
| Updated Prospectus Web Address |
|
https://personal1.vanguard.com/ngf-next-gen-form-webapp/fund-literature
|
|
| C000007104 |
|
|
|
| Shareholder Report [Line Items] |
|
|
|
| Fund Name |
|
Long-Term Treasury Fund
|
|
| Class Name |
|
Admiral™ Shares
|
|
| Trading Symbol |
|
VUSUX
|
|
| Annual or Semi-Annual Statement [Text Block] |
|
This annual shareholder report contains important information about Vanguard Long-Term Treasury Fund (the "Fund") for the period of February 1, 2025, to January 31, 2026.
|
|
| Additional Information [Text Block] |
|
You can find additional information about the Fund at https://personal1.vanguard.com/ngf-next-gen-form-webapp/fund-literature. You can also request this information by contacting us at 800-662-7447.
|
|
| Material Fund Change Notice [Text Block] |
|
The report describes changes to the Fund that occurred during the reporting period.
|
|
| Additional Information Phone Number |
|
<span style="white-space: nowrap; box-sizing: border-box; color: rgb(0, 0, 0); display: inline; flex-wrap: nowrap; font-size: 10.6667px; font-weight: 400; grid-area: auto; line-height: 16px; margin: 0px; overflow: visible; text-align: left; text-align-last: auto;"> 800-662-7447</span>
|
|
| Additional Information Website |
|
<span style="white-space: nowrap; box-sizing: border-box; color: rgb(0, 0, 0); display: inline; flex-wrap: nowrap; font-size: 10.6667px; font-weight: 400; grid-area: auto; line-height: 16px; margin: 0px; overflow: visible; text-align: left; text-align-last: auto;"><span style="box-sizing: border-box; color: rgb(0, 0, 0); display: inline; flex-wrap: nowrap; font-size: 10.6667px; font-weight: 400; grid-area: auto; line-height: 16px; margin: 0px; overflow: visible; text-align: left; text-align-last: auto; white-space-collapse: collapse;"><span style="text-decoration: underline; box-sizing: border-box; color: rgb(0, 0, 0); display: inline; flex-wrap: nowrap; font-size: 10.6667px; font-weight: 400; grid-area: auto; line-height: 16px; margin: 0px; overflow: visible; text-align: left; text-align-last: auto; white-space-collapse: collapse;">https://personal1.vanguard.com/ngf-next-gen-form-webapp/fund-literature</span></span></span>
|
|
| Expenses [Text Block] |
|
What were the Fund costs for the last year?(based on a hypothetical $10,000 investment) Table SummaryShare Class Name | Costs of a $10,000 investment | Costs paid as a percentage of a $10,000 investment |
|---|
Admiral Shares | $10 | 0.10% |
|---|
|
|
| Expenses Paid, Amount |
|
$ 10
|
|
| Expense Ratio, Percent |
|
0.10%
|
|
| Factors Affecting Performance [Text Block] |
|
How did the Fund perform during the reporting period? For the 12 months ended January 31, 2026, the Fund slightly outperformed its benchmark. The first part of the period was marked by volatility in the financial markets amid fears that U.S. tariff announcements might spark trade wars and drag down global growth. Despite these concerns, markets posted solid gains for the 12 months, buoyed by optimism surrounding artificial intelligence, robust corporate earnings, and a more dovish monetary policy. The European Central Bank and the Federal Reserve each cut interest rates three times, while the Bank of England lowered rates four times. U.S. Treasury yields ended the period lower for all but the longest-dated maturities. The yield on the 2-year U.S. Treasury bill fell 0.67 percentage points to end the period at 3.52%, while the yield on the bellwether 10-year U.S. Treasury note declined a more modest 0.30 percentage points to finish at 4.24%. The Fund’s outperformance was largely due to security selection within Treasuries and allocations to agency debentures and agency mortgage-backed securities. Curve positioning was a detractor.
|
|
| Performance Past Does Not Indicate Future [Text] |
|
Keep in mind that the Fund's past performance does not indicate how the Fund will perform in the future.
|
|
| Line Graph [Table Text Block] |
|
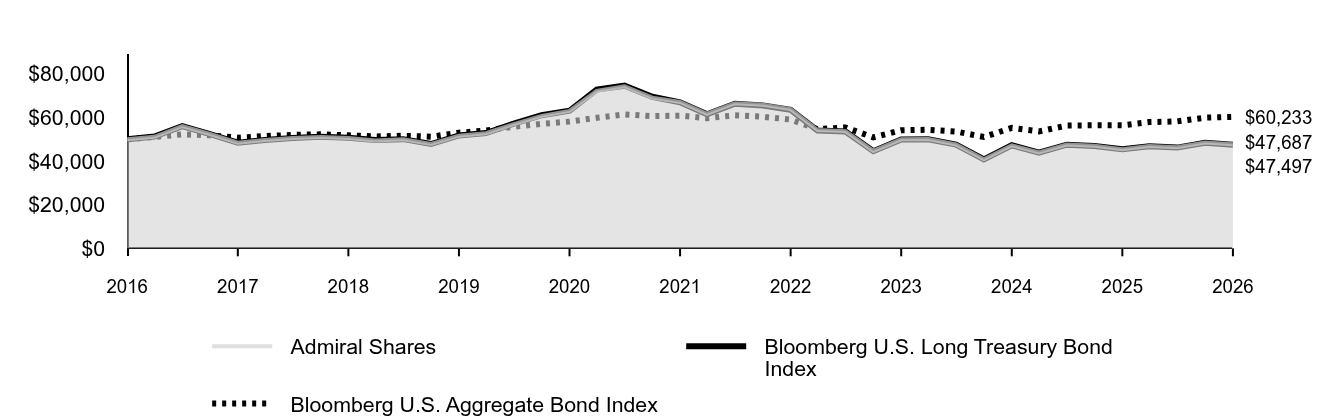 Table Summary | Admiral Shares | Bloomberg U.S. Long Treasury Bond Index | Bloomberg U.S. Aggregate Bond Index |
|---|
2016 | $50,000 | $50,000 | $50,000 |
|---|
2016 | $51,146 | $51,232 | $51,012 |
|---|
2016 | $55,997 | $56,037 | $52,270 |
|---|
2016 | $52,405 | $52,384 | $51,781 |
|---|
2017 | $48,441 | $48,429 | $50,726 |
|---|
2017 | $49,655 | $49,668 | $51,434 |
|---|
2017 | $50,588 | $50,537 | $52,001 |
|---|
2017 | $51,062 | $51,105 | $52,248 |
|---|
2018 | $50,533 | $50,665 | $51,816 |
|---|
2018 | $49,411 | $49,647 | $51,270 |
|---|
2018 | $49,993 | $50,040 | $51,585 |
|---|
2018 | $47,824 | $47,820 | $51,175 |
|---|
2019 | $51,622 | $51,736 | $52,983 |
|---|
2019 | $52,738 | $52,827 | $53,983 |
|---|
2019 | $56,952 | $57,126 | $55,753 |
|---|
2019 | $60,719 | $61,021 | $57,065 |
|---|
2020 | $62,961 | $63,051 | $58,093 |
|---|
2020 | $72,214 | $72,791 | $59,835 |
|---|
2020 | $74,282 | $74,547 | $61,396 |
|---|
2020 | $69,076 | $69,452 | $60,596 |
|---|
2021 | $67,062 | $66,952 | $60,835 |
|---|
2021 | $61,701 | $61,471 | $59,676 |
|---|
2021 | $66,545 | $66,288 | $60,965 |
|---|
2021 | $65,788 | $65,449 | $60,306 |
|---|
2022 | $63,829 | $63,490 | $59,030 |
|---|
2022 | $54,211 | $53,956 | $54,596 |
|---|
2022 | $53,730 | $53,546 | $55,408 |
|---|
2022 | $44,659 | $44,517 | $50,848 |
|---|
2023 | $49,980 | $49,858 | $54,095 |
|---|
2023 | $50,104 | $50,003 | $54,363 |
|---|
2023 | $47,598 | $47,544 | $53,542 |
|---|
2023 | $40,774 | $40,733 | $51,029 |
|---|
2024 | $47,233 | $47,227 | $55,230 |
|---|
2024 | $43,948 | $43,871 | $53,565 |
|---|
2024 | $47,611 | $47,509 | $56,273 |
|---|
2024 | $46,993 | $46,882 | $56,411 |
|---|
2025 | $45,474 | $45,382 | $56,372 |
|---|
2025 | $46,872 | $46,792 | $57,861 |
|---|
2025 | $46,293 | $46,165 | $58,176 |
|---|
2025 | $48,529 | $48,355 | $59,886 |
|---|
2026 | $47,687 | $47,497 | $60,233 |
|---|
|
|
| Average Annual Return [Table Text Block] |
|
Table Summary | 1 Year | 5 Years | 10 Years |
|---|
Admiral Shares | 4.87% | -6.59% | -0.47% |
|---|
Bloomberg U.S. Long Treasury Bond Index | 4.66% | -6.64% | -0.51% |
|---|
Bloomberg U.S. Aggregate Bond Index | 6.85% | -0.20% | 1.88% |
|---|
|
|
| No Deduction of Taxes [Text Block] |
|
The graph and returns shown do not reflect taxes that a shareholder would pay on fund distributions or on the sale of fund shares.
|
|
| Material Change Date |
|
|
Jan. 31, 2025
|
| Updated Performance Information Location [Text Block] |
|
Updated performance information is available on our website at vanguard.com/performance or by calling Vanguard toll-free at 800-662-7447.
|
|
| AssetsNet |
|
$ 2,836,000,000
|
|
| Holdings Count | Holding |
|
171
|
|
| Advisory Fees Paid, Amount |
|
$ 345,000
|
|
| InvestmentCompanyPortfolioTurnover |
|
292.00%
|
|
| Additional Fund Statistics [Text Block] |
|
Fund Statistics
(as of January 31, 2026)Table SummaryFund Net Assets (in millions) | $2,836 |
|---|
Number of Portfolio Holdings | 171 |
|---|
Portfolio Turnover Rate | 292% |
|---|
Total Investment Advisory Fees (in thousands) | $345 |
|---|
|
|
| Holdings [Text Block] |
|
Portfolio Composition % of Net Assets
(as of January 31, 2026)Table SummaryAgency Bonds and Notes | 4.3% |
|---|
Conventional Mortgage-Backed Securities | 7.2% |
|---|
Nonconventional Mortgage-Backed Securities | 2.0% |
|---|
U.S. Government Securities | 86.9% |
|---|
Conventional Mortgage-Backed Securities-Liability for Sale Commitments | (2.1%) |
|---|
Other Assets and Liabilities—NetFootnote Reference | 1.7% |
|---|
This table reflects the Fund's investments, including short-term investments, derivatives and other assets and liabilities. |
|
| Material Fund Change [Text Block] |
|
How has the Fund changed?Effective January 12, 2026, The Vanguard Group, Inc. exercises portfolio management responsibilities for the fund through its wholly-owned subsidiary, Vanguard Capital Management, LLC. This is a summary of certain changes to the Fund since January 31, 2025. For more complete information, you may review the Fund’s next prospectus, which we expect to be available by May 31, 2026, at https://personal1.vanguard.com/ngf-next-gen-form-webapp/fund-literature or upon request at 800-662-7447. |
|
| Material Fund Change Adviser [Text Block] |
|
Effective January 12, 2026, The Vanguard Group, Inc. exercises portfolio management responsibilities for the fund through its wholly-owned subsidiary, Vanguard Capital Management, LLC.
|
|
| Summary of Change Legend [Text Block] |
|
This is a summary of certain changes to the Fund since January 31, 2025. For more complete information, you may review the Fund’s next prospectus, which we expect to be available by May 31, 2026, at https://personal1.vanguard.com/ngf-next-gen-form-webapp/fund-literature or upon request at 800-662-7447.
|
|
| Updated Prospectus Phone Number |
|
800-662-7447
|
|
| Updated Prospectus Web Address |
|
https://personal1.vanguard.com/ngf-next-gen-form-webapp/fund-literature
|
|
| C000007105 |
|
|
|
| Shareholder Report [Line Items] |
|
|
|
| Fund Name |
|
Short-Term Federal Fund
|
|
| Class Name |
|
Investor Shares
|
|
| Trading Symbol |
|
VSGBX
|
|
| Annual or Semi-Annual Statement [Text Block] |
|
This annual shareholder report contains important information about Vanguard Short-Term Federal Fund (the "Fund") for the period of February 1, 2025, to January 31, 2026.
|
|
| Additional Information [Text Block] |
|
You can find additional information about the Fund at https://personal1.vanguard.com/ngf-next-gen-form-webapp/fund-literature. You can also request this information by contacting us at 800-662-7447.
|
|
| Material Fund Change Notice [Text Block] |
|
The report describes changes to the Fund that occurred during the reporting period.
|
|
| Additional Information Phone Number |
|
<span style="white-space: nowrap; box-sizing: border-box; color: rgb(0, 0, 0); display: inline; flex-wrap: nowrap; font-size: 10.6667px; font-weight: 400; grid-area: auto; line-height: 16px; margin: 0px; overflow: visible; text-align: left; text-align-last: auto;"> 800-662-7447</span>
|
|
| Additional Information Website |
|
<span style="white-space: nowrap; box-sizing: border-box; color: rgb(0, 0, 0); display: inline; flex-wrap: nowrap; font-size: 10.6667px; font-weight: 400; grid-area: auto; line-height: 16px; margin: 0px; overflow: visible; text-align: left; text-align-last: auto;"><span style="box-sizing: border-box; color: rgb(0, 0, 0); display: inline; flex-wrap: nowrap; font-size: 10.6667px; font-weight: 400; grid-area: auto; line-height: 16px; margin: 0px; overflow: visible; text-align: left; text-align-last: auto; white-space-collapse: collapse;"><span style="text-decoration: underline; box-sizing: border-box; color: rgb(0, 0, 0); display: inline; flex-wrap: nowrap; font-size: 10.6667px; font-weight: 400; grid-area: auto; line-height: 16px; margin: 0px; overflow: visible; text-align: left; text-align-last: auto; white-space-collapse: collapse;">https://personal1.vanguard.com/ngf-next-gen-form-webapp/fund-literature</span></span></span>
|
|
| Expenses [Text Block] |
|
What were the Fund costs for the last year?(based on a hypothetical $10,000 investment) Table SummaryShare Class Name | Costs of a $10,000 investment | Costs paid as a percentage of a $10,000 investment |
|---|
Investor Shares | $21 | 0.20% |
|---|
|
|
| Expenses Paid, Amount |
|
$ 21
|
|
| Expense Ratio, Percent |
|
0.20%
|
|
| Factors Affecting Performance [Text Block] |
|
How did the Fund perform during the reporting period? For the 12 months ended January 31, 2026, the Fund outperformed its benchmark index. The first part of the period was marked by volatility in the financial markets amid fears that U.S. tariff announcements might spark trade wars and drag down global growth. Despite these concerns, markets posted solid gains for the 12 months, buoyed by optimism surrounding artificial intelligence, robust corporate earnings, and a more dovish monetary policy. The European Central Bank and the Federal Reserve each cut interest rates three times, while the Bank of England lowered rates four times. U.S. Treasury yields ended the period lower for all but the longest-dated maturities. The yield on the 2-Year U.S. Treasury bill fell 0.67 percentage points to end the period at 3.52%, while the yield on the bellwether 10-Year U.S. Treasury note declined a more modest 0.30 percentage points to finish at 4.24%. The Fund’s outperformance was largely driven by positions in agency mortgage-backed securities and agency commercial mortgage-backed securities.
|
|
| Performance Past Does Not Indicate Future [Text] |
|
Keep in mind that the Fund's past performance does not indicate how the Fund will perform in the future.
|
|
| Line Graph [Table Text Block] |
|
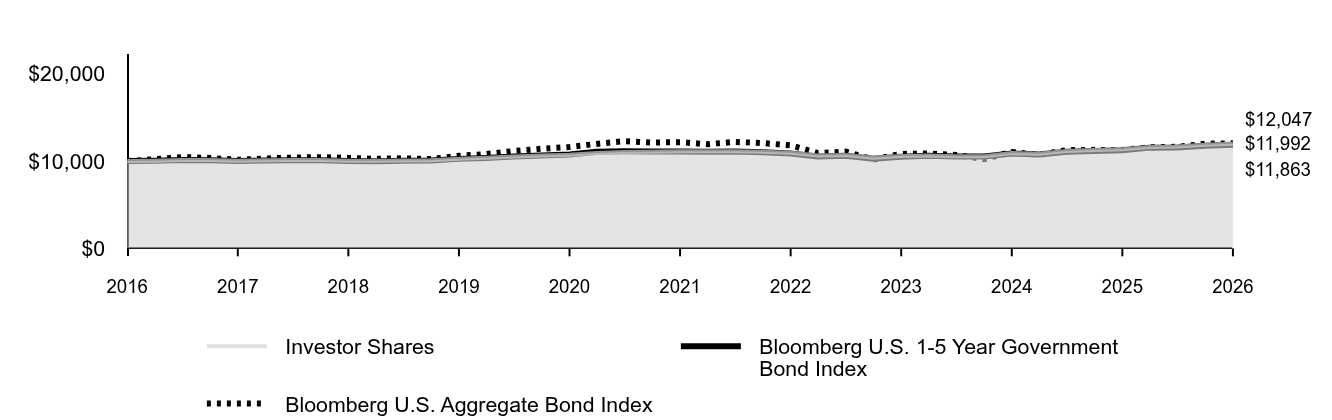 Table Summary | Investor Shares | Bloomberg U.S. 1-5 Year Government Bond Index | Bloomberg U.S. Aggregate Bond Index |
|---|
2016 | $10,000 | $10,000 | $10,000 |
|---|
2016 | $10,044 | $10,046 | $10,202 |
|---|
2016 | $10,110 | $10,123 | $10,454 |
|---|
2016 | $10,109 | $10,089 | $10,356 |
|---|
2017 | $10,049 | $10,013 | $10,145 |
|---|
2017 | $10,088 | $10,066 | $10,287 |
|---|
2017 | $10,129 | $10,103 | $10,400 |
|---|
2017 | $10,124 | $10,094 | $10,450 |
|---|
2018 | $10,047 | $10,006 | $10,363 |
|---|
2018 | $10,041 | $9,989 | $10,254 |
|---|
2018 | $10,071 | $10,028 | $10,317 |
|---|
2018 | $10,104 | $10,055 | $10,235 |
|---|
2019 | $10,268 | $10,250 | $10,597 |
|---|
2019 | $10,378 | $10,359 | $10,797 |
|---|
2019 | $10,518 | $10,515 | $11,151 |
|---|
2019 | $10,632 | $10,647 | $11,413 |
|---|
2020 | $10,726 | $10,745 | $11,619 |
|---|
2020 | $10,929 | $11,070 | $11,967 |
|---|
2020 | $11,033 | $11,114 | $12,279 |
|---|
2020 | $11,058 | $11,096 | $12,119 |
|---|
2021 | $11,123 | $11,109 | $12,167 |
|---|
2021 | $11,113 | $11,067 | $11,935 |
|---|
2021 | $11,137 | $11,103 | $12,193 |
|---|
2021 | $11,065 | $11,006 | $12,061 |
|---|
2022 | $10,959 | $10,877 | $11,806 |
|---|
2022 | $10,629 | $10,521 | $10,919 |
|---|
2022 | $10,694 | $10,604 | $11,082 |
|---|
2022 | $10,367 | $10,264 | $10,170 |
|---|
2023 | $10,588 | $10,495 | $10,819 |
|---|
2023 | $10,629 | $10,619 | $10,873 |
|---|
2023 | $10,559 | $10,512 | $10,708 |
|---|
2023 | $10,548 | $10,511 | $10,206 |
|---|
2024 | $10,909 | $10,870 | $11,046 |
|---|
2024 | $10,833 | $10,741 | $10,713 |
|---|
2024 | $11,148 | $11,079 | $11,255 |
|---|
2024 | $11,254 | $11,164 | $11,282 |
|---|
2025 | $11,363 | $11,251 | $11,274 |
|---|
2025 | $11,617 | $11,539 | $11,572 |
|---|
2025 | $11,675 | $11,563 | $11,635 |
|---|
2025 | $11,868 | $11,758 | $11,977 |
|---|
2026 | $11,992 | $11,863 | $12,047 |
|---|
|
|
| Average Annual Return [Table Text Block] |
|
Table Summary | 1 Year | 5 Years | 10 Years |
|---|
Investor Shares | 5.54% | 1.51% | 1.83% |
|---|
Bloomberg U.S. 1-5 Year Government Bond Index | 5.44% | 1.32% | 1.72% |
|---|
Bloomberg U.S. Aggregate Bond Index | 6.85% | -0.20% | 1.88% |
|---|
|
|
| No Deduction of Taxes [Text Block] |
|
The graph and returns shown do not reflect taxes that a shareholder would pay on fund distributions or on the sale of fund shares.
|
|
| Material Change Date |
|
|
Jan. 31, 2025
|
| Updated Performance Information Location [Text Block] |
|
Updated performance information is available on our website at vanguard.com/performance or by calling Vanguard toll-free at 800-662-7447.
|
|
| AssetsNet |
|
$ 4,497,000,000
|
|
| Holdings Count | Holding |
|
535
|
|
| Advisory Fees Paid, Amount |
|
$ 521,000
|
|
| InvestmentCompanyPortfolioTurnover |
|
398.00%
|
|
| Additional Fund Statistics [Text Block] |
|
Fund Statistics
(as of January 31, 2026)Table SummaryFund Net Assets (in millions) | $4,497 |
|---|
Number of Portfolio Holdings | 535 |
|---|
Portfolio Turnover Rate | 398% |
|---|
Total Investment Advisory Fees (in thousands) | $521 |
|---|
|
|
| Holdings [Text Block] |
|
Portfolio Composition % of Net Assets
(as of January 31, 2026)Table SummaryAgency Bonds and Notes | 16.9% |
|---|
Asset-Backed/Commercial Mortgage-Backed Securities | 23.4% |
|---|
Conventional Mortgage-Backed Securities | 43.3% |
|---|
Nonconventional Mortgage-Backed Securities | 5.5% |
|---|
U.S. Government Securities | 12.0% |
|---|
Conventional Mortgage-Backed Securities-Liability for Sale Commitments | (1.3%) |
|---|
Other Assets and Liabilities—NetFootnote Reference | 0.2% |
|---|
This table reflects the Fund's investments, including short-term investments, derivatives and other assets and liabilities. |
|
| Material Fund Change [Text Block] |
|
How has the Fund changed?Effective January 12, 2026, The Vanguard Group, Inc. exercises portfolio management responsibilities for the fund through its wholly-owned subsidiary, Vanguard Capital Management, LLC. This is a summary of certain changes to the Fund since January 31, 2025. For more complete information, you may review the Fund’s next prospectus, which we expect to be available by May 31, 2026, at https://personal1.vanguard.com/ngf-next-gen-form-webapp/fund-literature or upon request at 800-662-7447. |
|
| Material Fund Change Adviser [Text Block] |
|
Effective January 12, 2026, The Vanguard Group, Inc. exercises portfolio management responsibilities for the fund through its wholly-owned subsidiary, Vanguard Capital Management, LLC.
|
|
| Summary of Change Legend [Text Block] |
|
This is a summary of certain changes to the Fund since January 31, 2025. For more complete information, you may review the Fund’s next prospectus, which we expect to be available by May 31, 2026, at https://personal1.vanguard.com/ngf-next-gen-form-webapp/fund-literature or upon request at 800-662-7447.
|
|
| Updated Prospectus Phone Number |
|
800-662-7447
|
|
| Updated Prospectus Web Address |
|
https://personal1.vanguard.com/ngf-next-gen-form-webapp/fund-literature
|
|
| C000007106 |
|
|
|
| Shareholder Report [Line Items] |
|
|
|
| Fund Name |
|
Short-Term Federal Fund
|
|
| Class Name |
|
Admiral™ Shares
|
|
| Trading Symbol |
|
VSGDX
|
|
| Annual or Semi-Annual Statement [Text Block] |
|
This annual shareholder report contains important information about Vanguard Short-Term Federal Fund (the "Fund") for the period of February 1, 2025, to January 31, 2026.
|
|
| Additional Information [Text Block] |
|
You can find additional information about the Fund at https://personal1.vanguard.com/ngf-next-gen-form-webapp/fund-literature. You can also request this information by contacting us at 800-662-7447.
|
|
| Material Fund Change Notice [Text Block] |
|
The report describes changes to the Fund that occurred during the reporting period.
|
|
| Additional Information Phone Number |
|
<span style="white-space: nowrap; box-sizing: border-box; color: rgb(0, 0, 0); display: inline; flex-wrap: nowrap; font-size: 10.6667px; font-weight: 400; grid-area: auto; line-height: 16px; margin: 0px; overflow: visible; text-align: left; text-align-last: auto;"> 800-662-7447</span>
|
|
| Additional Information Website |
|
<span style="white-space: nowrap; box-sizing: border-box; color: rgb(0, 0, 0); display: inline; flex-wrap: nowrap; font-size: 10.6667px; font-weight: 400; grid-area: auto; line-height: 16px; margin: 0px; overflow: visible; text-align: left; text-align-last: auto;"><span style="box-sizing: border-box; color: rgb(0, 0, 0); display: inline; flex-wrap: nowrap; font-size: 10.6667px; font-weight: 400; grid-area: auto; line-height: 16px; margin: 0px; overflow: visible; text-align: left; text-align-last: auto; white-space-collapse: collapse;"><span style="text-decoration: underline; box-sizing: border-box; color: rgb(0, 0, 0); display: inline; flex-wrap: nowrap; font-size: 10.6667px; font-weight: 400; grid-area: auto; line-height: 16px; margin: 0px; overflow: visible; text-align: left; text-align-last: auto; white-space-collapse: collapse;">https://personal1.vanguard.com/ngf-next-gen-form-webapp/fund-literature</span></span></span>
|
|
| Expenses [Text Block] |
|
What were the Fund costs for the last year?(based on a hypothetical $10,000 investment) Table SummaryShare Class Name | Costs of a $10,000 investment | Costs paid as a percentage of a $10,000 investment |
|---|
Admiral Shares | $10 | 0.10% |
|---|
|
|
| Expenses Paid, Amount |
|
$ 10
|
|
| Expense Ratio, Percent |
|
0.10%
|
|
| Factors Affecting Performance [Text Block] |
|
How did the Fund perform during the reporting period? For the 12 months ended January 31, 2026, the Fund outperformed its benchmark index. The first part of the period was marked by volatility in the financial markets amid fears that U.S. tariff announcements might spark trade wars and drag down global growth. Despite these concerns, markets posted solid gains for the 12 months, buoyed by optimism surrounding artificial intelligence, robust corporate earnings, and a more dovish monetary policy. The European Central Bank and the Federal Reserve each cut interest rates three times, while the Bank of England lowered rates four times. U.S. Treasury yields ended the period lower for all but the longest-dated maturities. The yield on the 2-Year U.S. Treasury bill fell 0.67 percentage points to end the period at 3.52%, while the yield on the bellwether 10-Year U.S. Treasury note declined a more modest 0.30 percentage points to finish at 4.24%. The Fund’s outperformance was largely driven by positions in agency mortgage-backed securities and agency commercial mortgage-backed securities.
|
|
| Performance Past Does Not Indicate Future [Text] |
|
Keep in mind that the Fund's past performance does not indicate how the Fund will perform in the future.
|
|
| Line Graph [Table Text Block] |
|
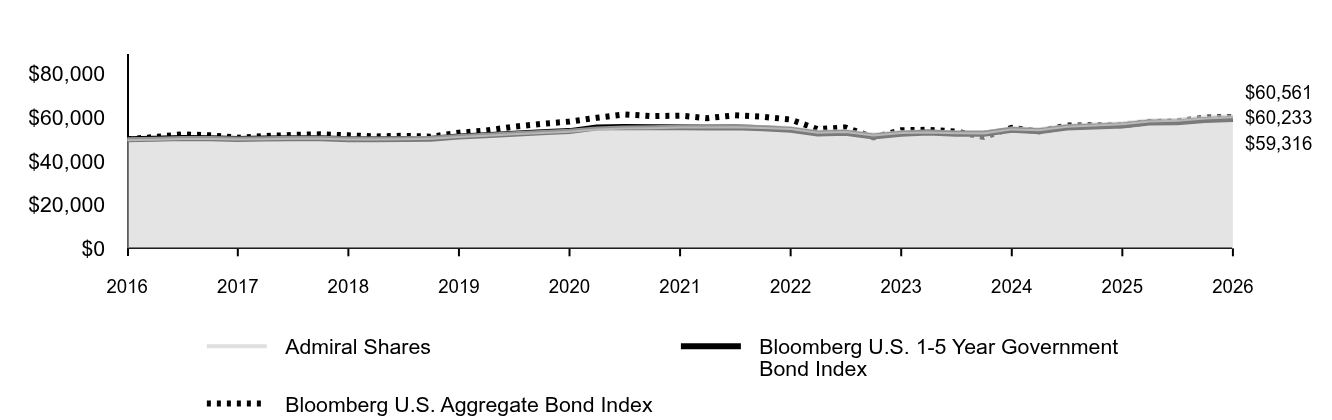 Table Summary | Admiral Shares | Bloomberg U.S. 1-5 Year Government Bond Index | Bloomberg U.S. Aggregate Bond Index |
|---|
2016 | $50,000 | $50,000 | $50,000 |
|---|
2016 | $50,231 | $50,230 | $51,012 |
|---|
2016 | $50,574 | $50,615 | $52,270 |
|---|
2016 | $50,584 | $50,444 | $51,781 |
|---|
2017 | $50,294 | $50,067 | $50,726 |
|---|
2017 | $50,502 | $50,332 | $51,434 |
|---|
2017 | $50,720 | $50,513 | $52,001 |
|---|
2017 | $50,711 | $50,470 | $52,248 |
|---|
2018 | $50,334 | $50,028 | $51,816 |
|---|
2018 | $50,317 | $49,945 | $51,270 |
|---|
2018 | $50,483 | $50,138 | $51,585 |
|---|
2018 | $50,659 | $50,276 | $51,175 |
|---|
2019 | $51,492 | $51,251 | $52,983 |
|---|
2019 | $52,056 | $51,793 | $53,983 |
|---|
2019 | $52,774 | $52,573 | $55,753 |
|---|
2019 | $53,359 | $53,236 | $57,065 |
|---|
2020 | $53,842 | $53,726 | $58,093 |
|---|
2020 | $54,875 | $55,351 | $59,835 |
|---|
2020 | $55,412 | $55,568 | $61,396 |
|---|
2020 | $55,555 | $55,480 | $60,596 |
|---|
2021 | $55,895 | $55,546 | $60,835 |
|---|
2021 | $55,859 | $55,334 | $59,676 |
|---|
2021 | $55,992 | $55,515 | $60,965 |
|---|
2021 | $55,644 | $55,032 | $60,306 |
|---|
2022 | $55,123 | $54,384 | $59,030 |
|---|
2022 | $53,478 | $52,606 | $54,596 |
|---|
2022 | $53,816 | $53,019 | $55,408 |
|---|
2022 | $52,187 | $51,321 | $50,848 |
|---|
2023 | $53,310 | $52,476 | $54,095 |
|---|
2023 | $53,529 | $53,094 | $54,363 |
|---|
2023 | $53,192 | $52,558 | $53,542 |
|---|
2023 | $53,150 | $52,555 | $51,029 |
|---|
2024 | $54,982 | $54,349 | $55,230 |
|---|
2024 | $54,611 | $53,706 | $53,565 |
|---|
2024 | $56,213 | $55,395 | $56,273 |
|---|
2024 | $56,765 | $55,820 | $56,411 |
|---|
2025 | $57,325 | $56,257 | $56,372 |
|---|
2025 | $58,624 | $57,695 | $57,861 |
|---|
2025 | $58,929 | $57,817 | $58,176 |
|---|
2025 | $59,921 | $58,789 | $59,886 |
|---|
2026 | $60,561 | $59,316 | $60,233 |
|---|
|
|
| Average Annual Return [Table Text Block] |
|
Table Summary | 1 Year | 5 Years | 10 Years |
|---|
Admiral Shares | 5.64% | 1.62% | 1.93% |
|---|
Bloomberg U.S. 1-5 Year Government Bond Index | 5.44% | 1.32% | 1.72% |
|---|
Bloomberg U.S. Aggregate Bond Index | 6.85% | -0.20% | 1.88% |
|---|
|
|
| No Deduction of Taxes [Text Block] |
|
The graph and returns shown do not reflect taxes that a shareholder would pay on fund distributions or on the sale of fund shares.
|
|
| Material Change Date |
|
|
Jan. 31, 2025
|
| Updated Performance Information Location [Text Block] |
|
Updated performance information is available on our website at vanguard.com/performance or by calling Vanguard toll-free at 800-662-7447.
|
|
| AssetsNet |
|
$ 4,497,000,000
|
|
| Holdings Count | Holding |
|
535
|
|
| Advisory Fees Paid, Amount |
|
$ 521,000
|
|
| InvestmentCompanyPortfolioTurnover |
|
398.00%
|
|
| Additional Fund Statistics [Text Block] |
|
Fund Statistics
(as of January 31, 2026)Table SummaryFund Net Assets (in millions) | $4,497 |
|---|
Number of Portfolio Holdings | 535 |
|---|
Portfolio Turnover Rate | 398% |
|---|
Total Investment Advisory Fees (in thousands) | $521 |
|---|
|
|
| Holdings [Text Block] |
|
Portfolio Composition % of Net Assets
(as of January 31, 2026)Table SummaryAgency Bonds and Notes | 16.9% |
|---|
Asset-Backed/Commercial Mortgage-Backed Securities | 23.4% |
|---|
Conventional Mortgage-Backed Securities | 43.3% |
|---|
Nonconventional Mortgage-Backed Securities | 5.5% |
|---|
U.S. Government Securities | 12.0% |
|---|
Conventional Mortgage-Backed Securities-Liability for Sale Commitments | (1.3%) |
|---|
Other Assets and Liabilities—NetFootnote Reference | 0.2% |
|---|
This table reflects the Fund's investments, including short-term investments, derivatives and other assets and liabilities. |
|
| Material Fund Change [Text Block] |
|
How has the Fund changed?Effective January 12, 2026, The Vanguard Group, Inc. exercises portfolio management responsibilities for the fund through its wholly-owned subsidiary, Vanguard Capital Management, LLC. This is a summary of certain changes to the Fund since January 31, 2025. For more complete information, you may review the Fund’s next prospectus, which we expect to be available by May 31, 2026, at https://personal1.vanguard.com/ngf-next-gen-form-webapp/fund-literature or upon request at 800-662-7447. |
|
| Material Fund Change Adviser [Text Block] |
|
Effective January 12, 2026, The Vanguard Group, Inc. exercises portfolio management responsibilities for the fund through its wholly-owned subsidiary, Vanguard Capital Management, LLC.
|
|
| Summary of Change Legend [Text Block] |
|
This is a summary of certain changes to the Fund since January 31, 2025. For more complete information, you may review the Fund’s next prospectus, which we expect to be available by May 31, 2026, at https://personal1.vanguard.com/ngf-next-gen-form-webapp/fund-literature or upon request at 800-662-7447.
|
|
| Updated Prospectus Phone Number |
|
800-662-7447
|
|
| Updated Prospectus Web Address |
|
https://personal1.vanguard.com/ngf-next-gen-form-webapp/fund-literature
|
|
| C000007107 |
|
|
|
| Shareholder Report [Line Items] |
|
|
|
| Fund Name |
|
Short-Term Investment-Grade Fund
|
|
| Class Name |
|
Investor Shares
|
|
| Trading Symbol |
|
VFSTX
|
|
| Annual or Semi-Annual Statement [Text Block] |
|
This annual shareholder report contains important information about Vanguard Short-Term Investment-Grade Fund (the "Fund") for the period of February 1, 2025, to January 31, 2026.
|
|
| Additional Information [Text Block] |
|
You can find additional information about the Fund at https://personal1.vanguard.com/ngf-next-gen-form-webapp/fund-literature. You can also request this information by contacting us at 800-662-7447.
|
|
| Material Fund Change Notice [Text Block] |
|
The report describes changes to the Fund that occurred during the reporting period.
|
|
| Additional Information Phone Number |
|
<span style="white-space: nowrap; box-sizing: border-box; color: rgb(0, 0, 0); display: inline; flex-wrap: nowrap; font-size: 10.6667px; font-weight: 400; grid-area: auto; line-height: 16px; margin: 0px; overflow: visible; text-align: left; text-align-last: auto;"> 800-662-7447</span>
|
|
| Additional Information Website |
|
<span style="white-space: nowrap; box-sizing: border-box; color: rgb(0, 0, 0); display: inline; flex-wrap: nowrap; font-size: 10.6667px; font-weight: 400; grid-area: auto; line-height: 16px; margin: 0px; overflow: visible; text-align: left; text-align-last: auto;"><span style="box-sizing: border-box; color: rgb(0, 0, 0); display: inline; flex-wrap: nowrap; font-size: 10.6667px; font-weight: 400; grid-area: auto; line-height: 16px; margin: 0px; overflow: visible; text-align: left; text-align-last: auto; white-space-collapse: collapse;"><span style="text-decoration: underline; box-sizing: border-box; color: rgb(0, 0, 0); display: inline; flex-wrap: nowrap; font-size: 10.6667px; font-weight: 400; grid-area: auto; line-height: 16px; margin: 0px; overflow: visible; text-align: left; text-align-last: auto; white-space-collapse: collapse;">https://personal1.vanguard.com/ngf-next-gen-form-webapp/fund-literature</span></span></span>
|
|
| Expenses [Text Block] |
|
What were the Fund costs for the last year?(based on a hypothetical $10,000 investment) Table SummaryShare Class Name | Costs of a $10,000 investment | Costs paid as a percentage of a $10,000 investment |
|---|
Investor Shares | $21 | 0.20% |
|---|
|
|
| Expenses Paid, Amount |
|
$ 21
|
|
| Expense Ratio, Percent |
|
0.20%
|
|
| Factors Affecting Performance [Text Block] |
|
How did the Fund perform during the reporting period? For the 12 months ended January 31, 2026, the Fund outperformed its benchmark. The first part of the period was marked by volatility in the financial markets amid fears that U.S. tariff announcements might spark trade wars and drag down global growth. Despite these concerns, markets posted solid gains for the 12 months, buoyed by optimism surrounding artificial intelligence, robust corporate earnings, and a more dovish monetary policy. The European Central Bank and the Federal Reserve each cut interest rates three times, while the Bank of England lowered rates four times. The Fund’s overweight allocation to overall credit risk contributed to its outperformance. An out-of-benchmark allocation to asset-backed securities and selection among investment-grade corporate issuers also added value.
|
|
| Performance Past Does Not Indicate Future [Text] |
|
Keep in mind that the Fund's past performance does not indicate how the Fund will perform in the future.
|
|
| Line Graph [Table Text Block] |
|
 Table Summary | Investor Shares | Bloomberg U.S. 1-5 Year Credit Bond Index | Bloomberg U.S. Aggregate Bond Index |
|---|
2016 | $10,000 | $10,000 | $10,000 |
|---|
2016 | $10,164 | $10,166 | $10,202 |
|---|
2016 | $10,294 | $10,287 | $10,454 |
|---|
2016 | $10,300 | $10,288 | $10,356 |
|---|
2017 | $10,252 | $10,242 | $10,145 |
|---|
2017 | $10,336 | $10,344 | $10,287 |
|---|
2017 | $10,410 | $10,435 | $10,400 |
|---|
2017 | $10,437 | $10,463 | $10,450 |
|---|
2018 | $10,384 | $10,396 | $10,363 |
|---|
2018 | $10,340 | $10,355 | $10,254 |
|---|
2018 | $10,399 | $10,418 | $10,317 |
|---|
2018 | $10,431 | $10,452 | $10,235 |
|---|
2019 | $10,599 | $10,663 | $10,597 |
|---|
2019 | $10,776 | $10,845 | $10,797 |
|---|
2019 | $10,958 | $11,039 | $11,151 |
|---|
2019 | $11,085 | $11,209 | $11,413 |
|---|
2020 | $11,213 | $11,352 | $11,619 |
|---|
2020 | $11,209 | $11,382 | $11,967 |
|---|
2020 | $11,558 | $11,713 | $12,279 |
|---|
2020 | $11,586 | $11,740 | $12,119 |
|---|
2021 | $11,694 | $11,832 | $12,167 |
|---|
2021 | $11,678 | $11,815 | $11,935 |
|---|
2021 | $11,754 | $11,883 | $12,193 |
|---|
2021 | $11,661 | $11,790 | $12,061 |
|---|
2022 | $11,499 | $11,634 | $11,806 |
|---|
2022 | $11,046 | $11,192 | $10,919 |
|---|
2022 | $11,141 | $11,294 | $11,082 |
|---|
2022 | $10,739 | $10,889 | $10,170 |
|---|
2023 | $11,133 | $11,281 | $10,819 |
|---|
2023 | $11,231 | $11,382 | $10,873 |
|---|
2023 | $11,219 | $11,368 | $10,708 |
|---|
2023 | $11,169 | $11,320 | $10,206 |
|---|
2024 | $11,667 | $11,820 | $11,046 |
|---|
2024 | $11,608 | $11,757 | $10,713 |
|---|
2024 | $11,996 | $12,134 | $11,255 |
|---|
2024 | $12,135 | $12,276 | $11,282 |
|---|
2025 | $12,265 | $12,403 | $11,274 |
|---|
2025 | $12,521 | $12,671 | $11,572 |
|---|
2025 | $12,677 | $12,809 | $11,635 |
|---|
2025 | $12,909 | $13,048 | $11,977 |
|---|
2026 | $13,067 | $13,205 | $12,047 |
|---|
|
|
| Average Annual Return [Table Text Block] |
|
Table Summary | 1 Year | 5 Years | 10 Years |
|---|
Investor Shares | 6.54% | 2.25% | 2.71% |
|---|
Bloomberg U.S. 1-5 Year Credit Bond Index | 6.46% | 2.22% | 2.82% |
|---|
Bloomberg U.S. Aggregate Bond Index | 6.85% | -0.20% | 1.88% |
|---|
|
|
| No Deduction of Taxes [Text Block] |
|
The graph and returns shown do not reflect taxes that a shareholder would pay on fund distributions or on the sale of fund shares.
|
|
| Material Change Date |
|
|
Jan. 31, 2025
|
| Updated Performance Information Location [Text Block] |
|
Updated performance information is available on our website at vanguard.com/performance or by calling Vanguard toll-free at 800-662-7447.
|
|
| AssetsNet |
|
$ 54,620,000,000
|
|
| Holdings Count | Holding |
|
2,244
|
|
| Advisory Fees Paid, Amount |
|
$ 10,060,000
|
|
| InvestmentCompanyPortfolioTurnover |
|
73.00%
|
|
| Additional Fund Statistics [Text Block] |
|
Fund Statistics
(as of January 31, 2026)Table SummaryFund Net Assets (in millions) | $54,620 |
|---|
Number of Portfolio Holdings | 2,244 |
|---|
Portfolio Turnover Rate | 73% |
|---|
Total Investment Advisory Fees (in thousands) | $10,060 |
|---|
|
|
| Holdings [Text Block] |
|
Portfolio Composition % of Net Assets
(as of January 31, 2026)Table SummaryCommunications | 5.0% | |
|---|
Consumer Discretionary | 5.5% | |
|---|
Consumer Staples | 4.8% | |
|---|
Energy | 6.1% | |
|---|
Financials | 30.6% | |
|---|
Health Care | 6.7% | |
|---|
Industrials | 5.5% | |
|---|
Materials | 1.9% | |
|---|
Real Estate | 3.1% | |
|---|
Technology | 5.2% | |
|---|
Utilities | 6.1% | |
|---|
Other | 18.7% | |
|---|
Other Assets and Liabilities—NetFootnote Reference | 0.8% | |
|---|
This table reflects the Fund's investments, including short-term investments, derivatives and other assets and liabilities. |
|
| Material Fund Change [Text Block] |
|
How has the Fund changed?Effective January 12, 2026, The Vanguard Group, Inc. exercises portfolio management responsibilities for the fund through its wholly-owned subsidiary, Vanguard Capital Management, LLC. This is a summary of certain changes to the Fund since January 31, 2025. For more complete information, you may review the Fund’s next prospectus, which we expect to be available by May 31, 2026, at https://personal1.vanguard.com/ngf-next-gen-form-webapp/fund-literature or upon request at 800-662-7447. |
|
| Material Fund Change Adviser [Text Block] |
|
Effective January 12, 2026, The Vanguard Group, Inc. exercises portfolio management responsibilities for the fund through its wholly-owned subsidiary, Vanguard Capital Management, LLC.
|
|
| Summary of Change Legend [Text Block] |
|
This is a summary of certain changes to the Fund since January 31, 2025. For more complete information, you may review the Fund’s next prospectus, which we expect to be available by May 31, 2026, at https://personal1.vanguard.com/ngf-next-gen-form-webapp/fund-literature or upon request at 800-662-7447.
|
|
| Updated Prospectus Phone Number |
|
800-662-7447
|
|
| Updated Prospectus Web Address |
|
https://personal1.vanguard.com/ngf-next-gen-form-webapp/fund-literature
|
|
| C000007108 |
|
|
|
| Shareholder Report [Line Items] |
|
|
|
| Fund Name |
|
Short-Term Investment-Grade Fund
|
|
| Class Name |
|
Admiral™ Shares
|
|
| Trading Symbol |
|
VFSUX
|
|
| Annual or Semi-Annual Statement [Text Block] |
|
This annual shareholder report contains important information about Vanguard Short-Term Investment-Grade Fund (the "Fund") for the period of February 1, 2025, to January 31, 2026.
|
|
| Additional Information [Text Block] |
|
You can find additional information about the Fund at https://personal1.vanguard.com/ngf-next-gen-form-webapp/fund-literature. You can also request this information by contacting us at 800-662-7447.
|
|
| Material Fund Change Notice [Text Block] |
|
The report describes changes to the Fund that occurred during the reporting period.
|
|
| Additional Information Phone Number |
|
<span style="white-space: nowrap; box-sizing: border-box; color: rgb(0, 0, 0); display: inline; flex-wrap: nowrap; font-size: 10.6667px; font-weight: 400; grid-area: auto; line-height: 16px; margin: 0px; overflow: visible; text-align: left; text-align-last: auto;"> 800-662-7447</span>
|
|
| Additional Information Website |
|
<span style="white-space: nowrap; box-sizing: border-box; color: rgb(0, 0, 0); display: inline; flex-wrap: nowrap; font-size: 10.6667px; font-weight: 400; grid-area: auto; line-height: 16px; margin: 0px; overflow: visible; text-align: left; text-align-last: auto;"><span style="box-sizing: border-box; color: rgb(0, 0, 0); display: inline; flex-wrap: nowrap; font-size: 10.6667px; font-weight: 400; grid-area: auto; line-height: 16px; margin: 0px; overflow: visible; text-align: left; text-align-last: auto; white-space-collapse: collapse;"><span style="text-decoration: underline; box-sizing: border-box; color: rgb(0, 0, 0); display: inline; flex-wrap: nowrap; font-size: 10.6667px; font-weight: 400; grid-area: auto; line-height: 16px; margin: 0px; overflow: visible; text-align: left; text-align-last: auto; white-space-collapse: collapse;">https://personal1.vanguard.com/ngf-next-gen-form-webapp/fund-literature</span></span></span>
|
|
| Expenses [Text Block] |
|
What were the Fund costs for the last year?(based on a hypothetical $10,000 investment) Table SummaryShare Class Name | Costs of a $10,000 investment | Costs paid as a percentage of a $10,000 investment |
|---|
Admiral Shares | $9 | 0.09% |
|---|
|
|
| Expenses Paid, Amount |
|
$ 9
|
|
| Expense Ratio, Percent |
|
0.09%
|
|
| Factors Affecting Performance [Text Block] |
|
How did the Fund perform during the reporting period? For the 12 months ended January 31, 2026, the Fund outperformed its benchmark. The first part of the period was marked by volatility in the financial markets amid fears that U.S. tariff announcements might spark trade wars and drag down global growth. Despite these concerns, markets posted solid gains for the 12 months, buoyed by optimism surrounding artificial intelligence, robust corporate earnings, and a more dovish monetary policy. The European Central Bank and the Federal Reserve each cut interest rates three times, while the Bank of England lowered rates four times. The Fund’s overweight allocation to overall credit risk contributed to its outperformance. An out-of-benchmark allocation to asset-backed securities and selection among investment-grade corporate issuers also added value.
|
|
| Performance Past Does Not Indicate Future [Text] |
|
Keep in mind that the Fund's past performance does not indicate how the Fund will perform in the future.
|
|
| Line Graph [Table Text Block] |
|
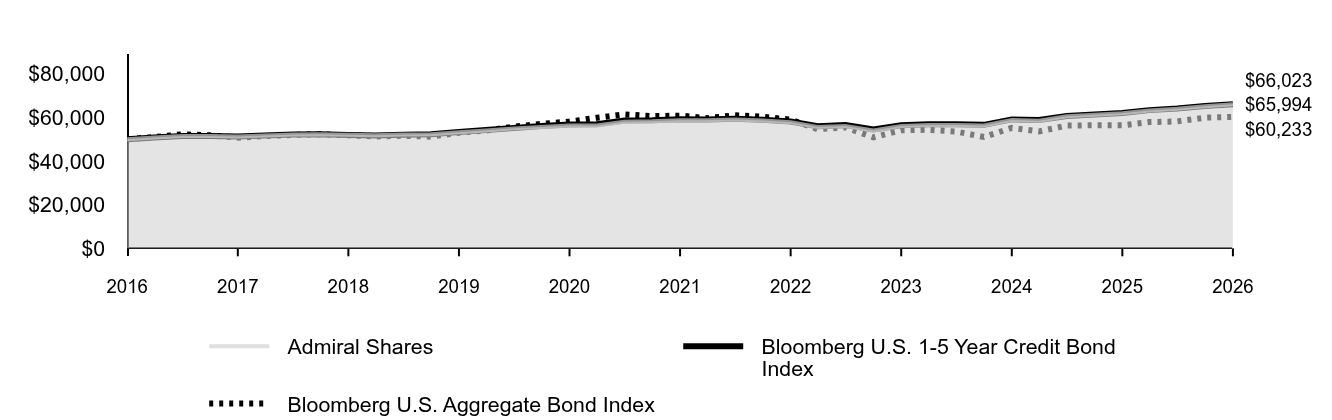 Table Summary | Admiral Shares | Bloomberg U.S. 1-5 Year Credit Bond Index | Bloomberg U.S. Aggregate Bond Index |
|---|
2016 | $50,000 | $50,000 | $50,000 |
|---|
2016 | $50,831 | $50,828 | $51,012 |
|---|
2016 | $51,495 | $51,436 | $52,270 |
|---|
2016 | $51,536 | $51,442 | $51,781 |
|---|
2017 | $51,309 | $51,209 | $50,726 |
|---|
2017 | $51,746 | $51,718 | $51,434 |
|---|
2017 | $52,125 | $52,175 | $52,001 |
|---|
2017 | $52,275 | $52,316 | $52,248 |
|---|
2018 | $52,024 | $51,979 | $51,816 |
|---|
2018 | $51,815 | $51,773 | $51,270 |
|---|
2018 | $52,123 | $52,089 | $51,585 |
|---|
2018 | $52,300 | $52,262 | $51,175 |
|---|
2019 | $53,152 | $53,314 | $52,983 |
|---|
2019 | $54,056 | $54,226 | $53,983 |
|---|
2019 | $54,984 | $55,193 | $55,753 |
|---|
2019 | $55,631 | $56,043 | $57,065 |
|---|
2020 | $56,288 | $56,758 | $58,093 |
|---|
2020 | $56,281 | $56,912 | $59,835 |
|---|
2020 | $58,052 | $58,565 | $61,396 |
|---|
2020 | $58,206 | $58,700 | $60,596 |
|---|
2021 | $58,760 | $59,160 | $60,835 |
|---|
2021 | $58,695 | $59,075 | $59,676 |
|---|
2021 | $59,091 | $59,415 | $60,965 |
|---|
2021 | $58,640 | $58,952 | $60,306 |
|---|
2022 | $57,842 | $58,170 | $59,030 |
|---|
2022 | $55,576 | $55,961 | $54,596 |
|---|
2022 | $56,069 | $56,470 | $55,408 |
|---|
2022 | $54,057 | $54,446 | $50,848 |
|---|
2023 | $56,057 | $56,407 | $54,095 |
|---|
2023 | $56,563 | $56,910 | $54,363 |
|---|
2023 | $56,518 | $56,838 | $53,542 |
|---|
2023 | $56,281 | $56,601 | $51,029 |
|---|
2024 | $58,803 | $59,100 | $55,230 |
|---|
2024 | $58,518 | $58,784 | $53,565 |
|---|
2024 | $60,490 | $60,668 | $56,273 |
|---|
2024 | $61,205 | $61,382 | $56,411 |
|---|
2025 | $61,878 | $62,017 | $56,372 |
|---|
2025 | $63,185 | $63,353 | $57,861 |
|---|
2025 | $63,994 | $64,047 | $58,176 |
|---|
2025 | $65,178 | $65,240 | $59,886 |
|---|
2026 | $65,994 | $66,023 | $60,233 |
|---|
|
|
| Average Annual Return [Table Text Block] |
|
Table Summary | 1 Year | 5 Years | 10 Years |
|---|
Admiral Shares | 6.65% | 2.35% | 2.81% |
|---|
Bloomberg U.S. 1-5 Year Credit Bond Index | 6.46% | 2.22% | 2.82% |
|---|
Bloomberg U.S. Aggregate Bond Index | 6.85% | -0.20% | 1.88% |
|---|
|
|
| No Deduction of Taxes [Text Block] |
|
The graph and returns shown do not reflect taxes that a shareholder would pay on fund distributions or on the sale of fund shares.
|
|
| Material Change Date |
|
|
Jan. 31, 2025
|
| Updated Performance Information Location [Text Block] |
|
Updated performance information is available on our website at vanguard.com/performance or by calling Vanguard toll-free at 800-662-7447.
|
|
| AssetsNet |
|
$ 54,620,000,000
|
|
| Holdings Count | Holding |
|
2,244
|
|
| Advisory Fees Paid, Amount |
|
$ 10,060,000
|
|
| InvestmentCompanyPortfolioTurnover |
|
73.00%
|
|
| Additional Fund Statistics [Text Block] |
|
Fund Statistics
(as of January 31, 2026)Table SummaryFund Net Assets (in millions) | $54,620 |
|---|
Number of Portfolio Holdings | 2,244 |
|---|
Portfolio Turnover Rate | 73% |
|---|
Total Investment Advisory Fees (in thousands) | $10,060 |
|---|
|
|
| Holdings [Text Block] |
|
Portfolio Composition % of Net Assets
(as of January 31, 2026)Table SummaryCommunications | 5.0% | |
|---|
Consumer Discretionary | 5.5% | |
|---|
Consumer Staples | 4.8% | |
|---|
Energy | 6.1% | |
|---|
Financials | 30.6% | |
|---|
Health Care | 6.7% | |
|---|
Industrials | 5.5% | |
|---|
Materials | 1.9% | |
|---|
Real Estate | 3.1% | |
|---|
Technology | 5.2% | |
|---|
Utilities | 6.1% | |
|---|
Other | 18.7% | |
|---|
Other Assets and Liabilities—NetFootnote Reference | 0.8% | |
|---|
This table reflects the Fund's investments, including short-term investments, derivatives and other assets and liabilities. |
|
| Material Fund Change [Text Block] |
|
How has the Fund changed?During the reporting period, the expense ratio for the Admiral Share class was reduced. Effective January 12, 2026, The Vanguard Group, Inc. exercises portfolio management responsibilities for the fund through its wholly-owned subsidiary, Vanguard Capital Management, LLC. This is a summary of certain changes to the Fund since January 31, 2025. For more complete information, you may review the Fund’s next prospectus, which we expect to be available by May 31, 2026, at https://personal1.vanguard.com/ngf-next-gen-form-webapp/fund-literature or upon request at 800-662-7447. |
|
| Material Fund Change Expenses [Text Block] |
|
During the reporting period, the expense ratio for the Admiral Share class was reduced.
|
|
| Material Fund Change Adviser [Text Block] |
|
Effective January 12, 2026, The Vanguard Group, Inc. exercises portfolio management responsibilities for the fund through its wholly-owned subsidiary, Vanguard Capital Management, LLC.
|
|
| Summary of Change Legend [Text Block] |
|
This is a summary of certain changes to the Fund since January 31, 2025. For more complete information, you may review the Fund’s next prospectus, which we expect to be available by May 31, 2026, at https://personal1.vanguard.com/ngf-next-gen-form-webapp/fund-literature or upon request at 800-662-7447.
|
|
| Updated Prospectus Phone Number |
|
800-662-7447
|
|
| Updated Prospectus Web Address |
|
https://personal1.vanguard.com/ngf-next-gen-form-webapp/fund-literature
|
|
| C000007109 |
|
|
|
| Shareholder Report [Line Items] |
|
|
|
| Fund Name |
|
Short-Term Investment-Grade Fund
|
|
| Class Name |
|
Institutional Shares
|
|
| Trading Symbol |
|
VFSIX
|
|
| Annual or Semi-Annual Statement [Text Block] |
|
This annual shareholder report contains important information about Vanguard Short-Term Investment-Grade Fund (the "Fund") for the period of February 1, 2025, to January 31, 2026.
|
|
| Additional Information [Text Block] |
|
You can find additional information about the Fund at https://personal1.vanguard.com/ngf-next-gen-form-webapp/fund-literature. You can also request this information by contacting us at 800-662-7447.
|
|
| Material Fund Change Notice [Text Block] |
|
The report describes changes to the Fund that occurred during the reporting period.
|
|
| Additional Information Phone Number |
|
<span style="white-space: nowrap; box-sizing: border-box; color: rgb(0, 0, 0); display: inline; flex-wrap: nowrap; font-size: 10.6667px; font-weight: 400; grid-area: auto; line-height: 16px; margin: 0px; overflow: visible; text-align: left; text-align-last: auto;"> 800-662-7447</span>
|
|
| Additional Information Website |
|
<span style="white-space: nowrap; box-sizing: border-box; color: rgb(0, 0, 0); display: inline; flex-wrap: nowrap; font-size: 10.6667px; font-weight: 400; grid-area: auto; line-height: 16px; margin: 0px; overflow: visible; text-align: left; text-align-last: auto;"><span style="box-sizing: border-box; color: rgb(0, 0, 0); display: inline; flex-wrap: nowrap; font-size: 10.6667px; font-weight: 400; grid-area: auto; line-height: 16px; margin: 0px; overflow: visible; text-align: left; text-align-last: auto; white-space-collapse: collapse;"><span style="text-decoration: underline; box-sizing: border-box; color: rgb(0, 0, 0); display: inline; flex-wrap: nowrap; font-size: 10.6667px; font-weight: 400; grid-area: auto; line-height: 16px; margin: 0px; overflow: visible; text-align: left; text-align-last: auto; white-space-collapse: collapse;">https://personal1.vanguard.com/ngf-next-gen-form-webapp/fund-literature</span></span></span>
|
|
| Expenses [Text Block] |
|
What were the Fund costs for the last year?(based on a hypothetical $10,000 investment) Table SummaryShare Class Name | Costs of a $10,000 investment | Costs paid as a percentage of a $10,000 investment |
|---|
Institutional Shares | $7 | 0.07% |
|---|
|
|
| Expenses Paid, Amount |
|
$ 7
|
|
| Expense Ratio, Percent |
|
0.07%
|
|
| Factors Affecting Performance [Text Block] |
|
How did the Fund perform during the reporting period? For the 12 months ended January 31, 2026, the Fund outperformed its benchmark. The first part of the period was marked by volatility in the financial markets amid fears that U.S. tariff announcements might spark trade wars and drag down global growth. Despite these concerns, markets posted solid gains for the 12 months, buoyed by optimism surrounding artificial intelligence, robust corporate earnings, and a more dovish monetary policy. The European Central Bank and the Federal Reserve each cut interest rates three times, while the Bank of England lowered rates four times. The Fund’s overweight allocation to overall credit risk contributed to its outperformance. An out-of-benchmark allocation to asset-backed securities and selection among investment-grade corporate issuers also added value.
|
|
| Performance Past Does Not Indicate Future [Text] |
|
Keep in mind that the Fund's past performance does not indicate how the Fund will perform in the future.
|
|
| Line Graph [Table Text Block] |
|
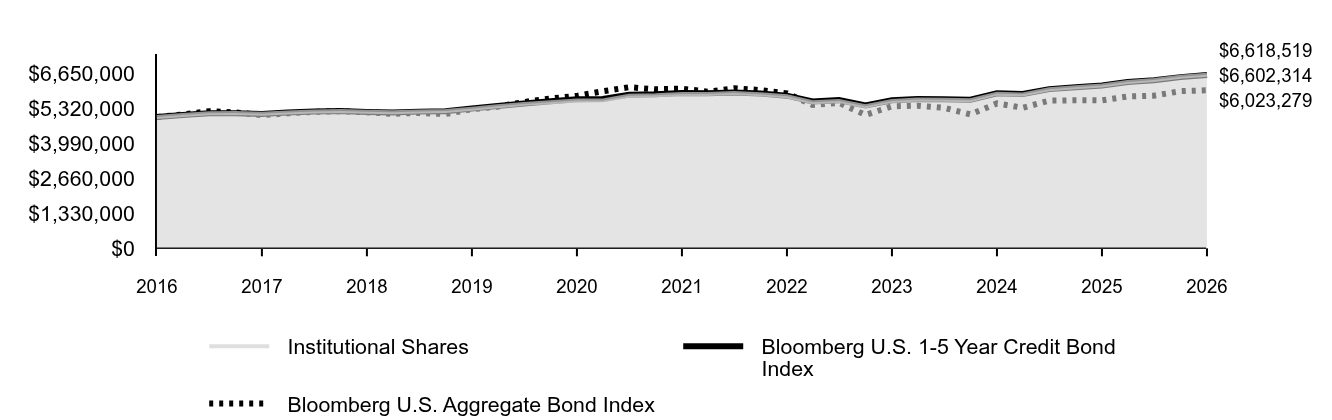 Table Summary | Institutional Shares | Bloomberg U.S. 1-5 Year Credit Bond Index | Bloomberg U.S. Aggregate Bond Index |
|---|
2016 | $5,000,000 | $5,000,000 | $5,000,000 |
|---|
2016 | $5,083,492 | $5,082,804 | $5,101,175 |
|---|
2016 | $5,150,246 | $5,143,620 | $5,227,003 |
|---|
2016 | $5,154,541 | $5,144,184 | $5,178,055 |
|---|
2017 | $5,132,437 | $5,120,946 | $5,072,639 |
|---|
2017 | $5,176,493 | $5,171,805 | $5,143,442 |
|---|
2017 | $5,214,873 | $5,217,479 | $5,200,097 |
|---|
2017 | $5,230,258 | $5,231,620 | $5,224,776 |
|---|
2018 | $5,205,506 | $5,197,864 | $5,181,646 |
|---|
2018 | $5,184,937 | $5,177,300 | $5,127,024 |
|---|
2018 | $5,216,222 | $5,208,906 | $5,158,490 |
|---|
2018 | $5,234,353 | $5,226,237 | $5,117,488 |
|---|
2019 | $5,319,999 | $5,331,385 | $5,298,287 |
|---|
2019 | $5,410,891 | $5,422,573 | $5,398,277 |
|---|
2019 | $5,504,134 | $5,519,255 | $5,575,337 |
|---|
2019 | $5,569,364 | $5,604,329 | $5,706,477 |
|---|
2020 | $5,635,493 | $5,675,773 | $5,809,283 |
|---|
2020 | $5,635,291 | $5,691,180 | $5,983,546 |
|---|
2020 | $5,813,000 | $5,856,514 | $6,139,630 |
|---|
2020 | $5,828,828 | $5,869,971 | $6,059,555 |
|---|
2021 | $5,884,841 | $5,915,970 | $6,083,511 |
|---|
2021 | $5,878,708 | $5,907,543 | $5,967,570 |
|---|
2021 | $5,918,778 | $5,941,456 | $6,096,545 |
|---|
2021 | $5,874,045 | $5,895,173 | $6,030,591 |
|---|
2022 | $5,794,620 | $5,817,014 | $5,902,981 |
|---|
2022 | $5,567,945 | $5,596,124 | $5,459,607 |
|---|
2022 | $5,617,805 | $5,646,958 | $5,540,763 |
|---|
2022 | $5,416,592 | $5,444,574 | $5,084,843 |
|---|
2023 | $5,617,488 | $5,640,680 | $5,409,513 |
|---|
2023 | $5,668,586 | $5,690,976 | $5,436,259 |
|---|
2023 | $5,664,524 | $5,683,792 | $5,354,152 |
|---|
2023 | $5,641,107 | $5,660,132 | $5,102,943 |
|---|
2024 | $5,894,401 | $5,910,047 | $5,523,009 |
|---|
2024 | $5,866,259 | $5,878,350 | $5,356,455 |
|---|
2024 | $6,064,427 | $6,066,814 | $5,627,272 |
|---|
2024 | $6,136,492 | $6,138,214 | $5,641,113 |
|---|
2025 | $6,204,481 | $6,201,688 | $5,637,207 |
|---|
2025 | $6,335,805 | $6,335,337 | $5,786,054 |
|---|
2025 | $6,417,240 | $6,404,698 | $5,817,572 |
|---|
2025 | $6,536,370 | $6,523,956 | $5,988,556 |
|---|
2026 | $6,618,519 | $6,602,314 | $6,023,279 |
|---|
|
|
| Average Annual Return [Table Text Block] |
|
Table Summary | 1 Year | 5 Years | 10 Years |
|---|
Institutional Shares | 6.67% | 2.38% | 2.84% |
|---|
Bloomberg U.S. 1-5 Year Credit Bond Index | 6.46% | 2.22% | 2.82% |
|---|
Bloomberg U.S. Aggregate Bond Index | 6.85% | -0.20% | 1.88% |
|---|
|
|
| No Deduction of Taxes [Text Block] |
|
The graph and returns shown do not reflect taxes that a shareholder would pay on fund distributions or on the sale of fund shares.
|
|
| Material Change Date |
|
|
Jan. 31, 2025
|
| Updated Performance Information Location [Text Block] |
|
Updated performance information is available on our website at vanguard.com/performance or by calling Vanguard toll-free at 800-662-7447.
|
|
| AssetsNet |
|
$ 54,620,000,000
|
|
| Holdings Count | Holding |
|
2,244
|
|
| Advisory Fees Paid, Amount |
|
$ 10,060,000
|
|
| InvestmentCompanyPortfolioTurnover |
|
73.00%
|
|
| Additional Fund Statistics [Text Block] |
|
Fund Statistics
(as of January 31, 2026)Table SummaryFund Net Assets (in millions) | $54,620 |
|---|
Number of Portfolio Holdings | 2,244 |
|---|
Portfolio Turnover Rate | 73% |
|---|
Total Investment Advisory Fees (in thousands) | $10,060 |
|---|
|
|
| Holdings [Text Block] |
|
Portfolio Composition % of Net Assets
(as of January 31, 2026)Table SummaryCommunications | 5.0% | |
|---|
Consumer Discretionary | 5.5% | |
|---|
Consumer Staples | 4.8% | |
|---|
Energy | 6.1% | |
|---|
Financials | 30.6% | |
|---|
Health Care | 6.7% | |
|---|
Industrials | 5.5% | |
|---|
Materials | 1.9% | |
|---|
Real Estate | 3.1% | |
|---|
Technology | 5.2% | |
|---|
Utilities | 6.1% | |
|---|
Other | 18.7% | |
|---|
Other Assets and Liabilities—NetFootnote Reference | 0.8% | |
|---|
This table reflects the Fund's investments, including short-term investments, derivatives and other assets and liabilities. |
|
| Material Fund Change [Text Block] |
|
How has the Fund changed?Effective January 12, 2026, The Vanguard Group, Inc. exercises portfolio management responsibilities for the fund through its wholly-owned subsidiary, Vanguard Capital Management, LLC. This is a summary of certain changes to the Fund since January 31, 2025. For more complete information, you may review the Fund’s next prospectus, which we expect to be available by May 31, 2026, at https://personal1.vanguard.com/ngf-next-gen-form-webapp/fund-literature or upon request at 800-662-7447. |
|
| Material Fund Change Adviser [Text Block] |
|
Effective January 12, 2026, The Vanguard Group, Inc. exercises portfolio management responsibilities for the fund through its wholly-owned subsidiary, Vanguard Capital Management, LLC.
|
|
| Summary of Change Legend [Text Block] |
|
This is a summary of certain changes to the Fund since January 31, 2025. For more complete information, you may review the Fund’s next prospectus, which we expect to be available by May 31, 2026, at https://personal1.vanguard.com/ngf-next-gen-form-webapp/fund-literature or upon request at 800-662-7447.
|
|
| Updated Prospectus Phone Number |
|
800-662-7447
|
|
| Updated Prospectus Web Address |
|
https://personal1.vanguard.com/ngf-next-gen-form-webapp/fund-literature
|
|
| C000151976 |
|
|
|
| Shareholder Report [Line Items] |
|
|
|
| Fund Name |
|
Ultra-Short-Term Bond Fund
|
|
| Class Name |
|
Investor Shares
|
|
| Trading Symbol |
|
VUBFX
|
|
| Annual or Semi-Annual Statement [Text Block] |
|
This annual shareholder report contains important information about Vanguard Ultra-Short-Term Bond Fund (the "Fund") for the period of February 1, 2025, to January 31, 2026.
|
|
| Additional Information [Text Block] |
|
You can find additional information about the Fund at https://personal1.vanguard.com/ngf-next-gen-form-webapp/fund-literature. You can also request this information by contacting us at 800-662-7447.
|
|
| Material Fund Change Notice [Text Block] |
|
The report describes changes to the Fund that occurred during the reporting period.
|
|
| Additional Information Phone Number |
|
<span style="white-space: nowrap; box-sizing: border-box; color: rgb(0, 0, 0); display: inline; flex-wrap: nowrap; font-size: 10.6667px; font-weight: 400; grid-area: auto; line-height: 16px; margin: 0px; overflow: visible; text-align: left; text-align-last: auto;"> 800-662-7447</span>
|
|
| Additional Information Website |
|
<span style="white-space: nowrap; box-sizing: border-box; color: rgb(0, 0, 0); display: inline; flex-wrap: nowrap; font-size: 10.6667px; font-weight: 400; grid-area: auto; line-height: 16px; margin: 0px; overflow: visible; text-align: left; text-align-last: auto;"><span style="box-sizing: border-box; color: rgb(0, 0, 0); display: inline; flex-wrap: nowrap; font-size: 10.6667px; font-weight: 400; grid-area: auto; line-height: 16px; margin: 0px; overflow: visible; text-align: left; text-align-last: auto; white-space-collapse: collapse;"><span style="text-decoration: underline; box-sizing: border-box; color: rgb(0, 0, 0); display: inline; flex-wrap: nowrap; font-size: 10.6667px; font-weight: 400; grid-area: auto; line-height: 16px; margin: 0px; overflow: visible; text-align: left; text-align-last: auto; white-space-collapse: collapse;">https://personal1.vanguard.com/ngf-next-gen-form-webapp/fund-literature</span></span></span>
|
|
| Expenses [Text Block] |
|
What were the Fund costs for the last year?(based on a hypothetical $10,000 investment) Table SummaryShare Class Name | Costs of a $10,000 investment | Costs paid as a percentage of a $10,000 investment |
|---|
Investor Shares | $20 | 0.20% |
|---|
|
|
| Expenses Paid, Amount |
|
$ 20
|
|
| Expense Ratio, Percent |
|
0.20%
|
|
| Factors Affecting Performance [Text Block] |
|
How did the Fund perform during the reporting period? For the 12 months ended January 31, 2026, the Fund outperformed its benchmark. The first part of the period was marked by volatility in the financial markets amid fears that U.S. tariff announcements might spark trade wars and drag down global growth. Despite these concerns, markets posted solid gains for the 12 months, buoyed by optimism surrounding artificial intelligence, robust corporate earnings, and a more dovish monetary policy. The European Central Bank and the Federal Reserve each cut interest rates three times, while the Bank of England lowered rates four times. U.S. Treasury yields ended the period lower for all but the longest-dated maturities. The yield on the 2-Year U.S. Treasury bill fell 0.67 percentage points to end the period at 3.52%. The yield on the bellwether 10-Year U.S. Treasury note declined a more modest 0.30 percentage points to finish at 4.24%. The Fund’s outperformance was driven by its credit exposure as spreads tightened over the period.
|
|
| Performance Past Does Not Indicate Future [Text] |
|
Keep in mind that the Fund's past performance does not indicate how the Fund will perform in the future.
|
|
| Line Graph [Table Text Block] |
|
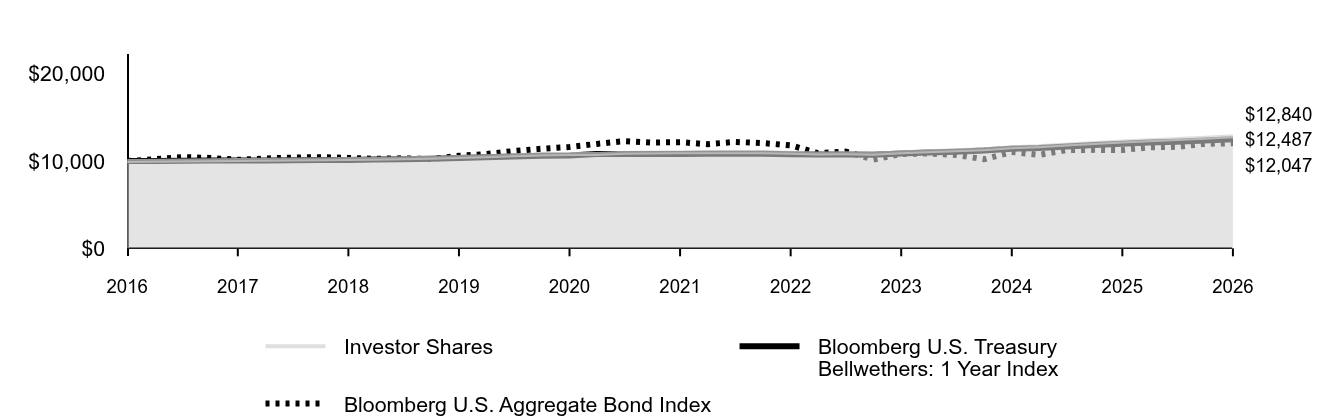 Table Summary | Investor Shares | Bloomberg U.S. Treasury Bellwethers: 1 Year Index | Bloomberg U.S. Aggregate Bond Index |
|---|
2016 | $10,000 | $10,000 | $10,000 |
|---|
2016 | $10,032 | $10,016 | $10,202 |
|---|
2016 | $10,070 | $10,045 | $10,454 |
|---|
2016 | $10,093 | $10,056 | $10,356 |
|---|
2017 | $10,113 | $10,071 | $10,145 |
|---|
2017 | $10,140 | $10,077 | $10,287 |
|---|
2017 | $10,182 | $10,100 | $10,400 |
|---|
2017 | $10,215 | $10,120 | $10,450 |
|---|
2018 | $10,231 | $10,135 | $10,363 |
|---|
2018 | $10,258 | $10,165 | $10,254 |
|---|
2018 | $10,313 | $10,215 | $10,317 |
|---|
2018 | $10,373 | $10,265 | $10,235 |
|---|
2019 | $10,470 | $10,349 | $10,597 |
|---|
2019 | $10,561 | $10,429 | $10,797 |
|---|
2019 | $10,653 | $10,514 | $11,151 |
|---|
2019 | $10,741 | $10,604 | $11,413 |
|---|
2020 | $10,806 | $10,650 | $11,619 |
|---|
2020 | $10,802 | $10,799 | $11,967 |
|---|
2020 | $10,941 | $10,808 | $12,279 |
|---|
2020 | $10,969 | $10,813 | $12,119 |
|---|
2021 | $11,002 | $10,823 | $12,167 |
|---|
2021 | $11,011 | $10,829 | $11,935 |
|---|
2021 | $11,023 | $10,831 | $12,193 |
|---|
2021 | $11,012 | $10,830 | $12,061 |
|---|
2022 | $10,958 | $10,791 | $11,806 |
|---|
2022 | $10,863 | $10,745 | $10,919 |
|---|
2022 | $10,890 | $10,746 | $11,082 |
|---|
2022 | $10,849 | $10,720 | $10,170 |
|---|
2023 | $11,012 | $10,859 | $10,819 |
|---|
2023 | $11,127 | $10,975 | $10,873 |
|---|
2023 | $11,230 | $11,056 | $10,708 |
|---|
2023 | $11,346 | $11,198 | $10,206 |
|---|
2024 | $11,591 | $11,411 | $11,046 |
|---|
2024 | $11,694 | $11,487 | $10,713 |
|---|
2024 | $11,903 | $11,673 | $11,255 |
|---|
2024 | $12,075 | $11,839 | $11,282 |
|---|
2025 | $12,235 | $11,982 | $11,274 |
|---|
2025 | $12,382 | $12,121 | $11,572 |
|---|
2025 | $12,515 | $12,208 | $11,635 |
|---|
2025 | $12,682 | $12,360 | $11,977 |
|---|
2026 | $12,840 | $12,487 | $12,047 |
|---|
|
|
| Average Annual Return [Table Text Block] |
|
Table Summary | 1 Year | 5 Years | 10 Years |
|---|
Investor Shares | 4.94% | 3.14% | 2.53% |
|---|
Bloomberg U.S. Treasury Bellwethers: 1 Year Index | 4.22% | 2.90% | 2.25% |
|---|
Bloomberg U.S. Aggregate Bond Index | 6.85% | -0.20% | 1.88% |
|---|
|
|
| No Deduction of Taxes [Text Block] |
|
The graph and returns shown do not reflect taxes that a shareholder would pay on fund distributions or on the sale of fund shares.
|
|
| Material Change Date |
|
|
Jan. 31, 2025
|
| Updated Performance Information Location [Text Block] |
|
Updated performance information is available on our website at vanguard.com/performance or by calling Vanguard toll-free at 800-662-7447.
|
|
| AssetsNet |
|
$ 15,582,000,000
|
|
| Holdings Count | Holding |
|
954
|
|
| Advisory Fees Paid, Amount |
|
$ 2,768,000
|
|
| InvestmentCompanyPortfolioTurnover |
|
82.00%
|
|
| Additional Fund Statistics [Text Block] |
|
Fund Statistics
(as of January 31, 2026)Table SummaryFund Net Assets (in millions) | $15,582 |
|---|
Number of Portfolio Holdings | 954 |
|---|
Portfolio Turnover Rate | 82% |
|---|
Total Investment Advisory Fees (in thousands) | $2,768 |
|---|
|
|
| Holdings [Text Block] |
|
Portfolio Composition % of Net Assets
(as of January 31, 2026)Table SummaryAsset-Backed/Commercial Mortgage-Backed Securities | 30.1% |
|---|
Corporate Bonds | 57.2% |
|---|
Sovereign Bonds | 2.6% |
|---|
U.S. Government and Agency Obligations | 1.4% |
|---|
Other Assets and Liabilities—NetFootnote Reference | 8.7% |
|---|
This table reflects the Fund's investments, including short-term investments, derivatives and other assets and liabilities. |
|
| Material Fund Change [Text Block] |
|
How has the Fund changed?Effective January 12, 2026, The Vanguard Group, Inc. exercises portfolio management responsibilities for the fund through its wholly-owned subsidiary, Vanguard Capital Management, LLC. This is a summary of certain changes to the Fund since January 31, 2025. For more complete information, you may review the Fund’s next prospectus, which we expect to be available by May 31, 2026, at https://personal1.vanguard.com/ngf-next-gen-form-webapp/fund-literature or upon request at 800-662-7447. |
|
| Material Fund Change Adviser [Text Block] |
|
Effective January 12, 2026, The Vanguard Group, Inc. exercises portfolio management responsibilities for the fund through its wholly-owned subsidiary, Vanguard Capital Management, LLC.
|
|
| Summary of Change Legend [Text Block] |
|
This is a summary of certain changes to the Fund since January 31, 2025. For more complete information, you may review the Fund’s next prospectus, which we expect to be available by May 31, 2026, at https://personal1.vanguard.com/ngf-next-gen-form-webapp/fund-literature or upon request at 800-662-7447.
|
|
| Updated Prospectus Phone Number |
|
800-662-7447
|
|
| Updated Prospectus Web Address |
|
https://personal1.vanguard.com/ngf-next-gen-form-webapp/fund-literature
|
|
| C000151975 |
|
|
|
| Shareholder Report [Line Items] |
|
|
|
| Fund Name |
|
Ultra-Short-Term Bond Fund
|
|
| Class Name |
|
Admiral™ Shares
|
|
| Trading Symbol |
|
VUSFX
|
|
| Annual or Semi-Annual Statement [Text Block] |
|
This annual shareholder report contains important information about Vanguard Ultra-Short-Term Bond Fund (the "Fund") for the period of February 1, 2025, to January 31, 2026.
|
|
| Additional Information [Text Block] |
|
You can find additional information about the Fund at https://personal1.vanguard.com/ngf-next-gen-form-webapp/fund-literature. You can also request this information by contacting us at 800-662-7447.
|
|
| Material Fund Change Notice [Text Block] |
|
The report describes changes to the Fund that occurred during the reporting period.
|
|
| Additional Information Phone Number |
|
<span style="white-space: nowrap; box-sizing: border-box; color: rgb(0, 0, 0); display: inline; flex-wrap: nowrap; font-size: 10.6667px; font-weight: 400; grid-area: auto; line-height: 16px; margin: 0px; overflow: visible; text-align: left; text-align-last: auto;"> 800-662-7447</span>
|
|
| Additional Information Website |
|
<span style="white-space: nowrap; box-sizing: border-box; color: rgb(0, 0, 0); display: inline; flex-wrap: nowrap; font-size: 10.6667px; font-weight: 400; grid-area: auto; line-height: 16px; margin: 0px; overflow: visible; text-align: left; text-align-last: auto;"><span style="box-sizing: border-box; color: rgb(0, 0, 0); display: inline; flex-wrap: nowrap; font-size: 10.6667px; font-weight: 400; grid-area: auto; line-height: 16px; margin: 0px; overflow: visible; text-align: left; text-align-last: auto; white-space-collapse: collapse;"><span style="text-decoration: underline; box-sizing: border-box; color: rgb(0, 0, 0); display: inline; flex-wrap: nowrap; font-size: 10.6667px; font-weight: 400; grid-area: auto; line-height: 16px; margin: 0px; overflow: visible; text-align: left; text-align-last: auto; white-space-collapse: collapse;">https://personal1.vanguard.com/ngf-next-gen-form-webapp/fund-literature</span></span></span>
|
|
| Expenses [Text Block] |
|
What were the Fund costs for the last year?(based on a hypothetical $10,000 investment) Table SummaryShare Class Name | Costs of a $10,000 investment | Costs paid as a percentage of a $10,000 investment |
|---|
Admiral Shares | $9 | 0.09% |
|---|
|
|
| Expenses Paid, Amount |
|
$ 9
|
|
| Expense Ratio, Percent |
|
0.09%
|
|
| Factors Affecting Performance [Text Block] |
|
How did the Fund perform during the reporting period? For the 12 months ended January 31, 2026, the Fund outperformed its benchmark. The first part of the period was marked by volatility in the financial markets amid fears that U.S. tariff announcements might spark trade wars and drag down global growth. Despite these concerns, markets posted solid gains for the 12 months, buoyed by optimism surrounding artificial intelligence, robust corporate earnings, and a more dovish monetary policy. The European Central Bank and the Federal Reserve each cut interest rates three times, while the Bank of England lowered rates four times. U.S. Treasury yields ended the period lower for all but the longest-dated maturities. The yield on the 2-Year U.S. Treasury bill fell 0.67 percentage points to end the period at 3.52%. The yield on the bellwether 10-Year U.S. Treasury note declined a more modest 0.30 percentage points to finish at 4.24%. The Fund’s outperformance was driven by its credit exposure as spreads tightened over the period.
|
|
| Performance Past Does Not Indicate Future [Text] |
|
Keep in mind that the Fund's past performance does not indicate how the Fund will perform in the future.
|
|
| Line Graph [Table Text Block] |
|
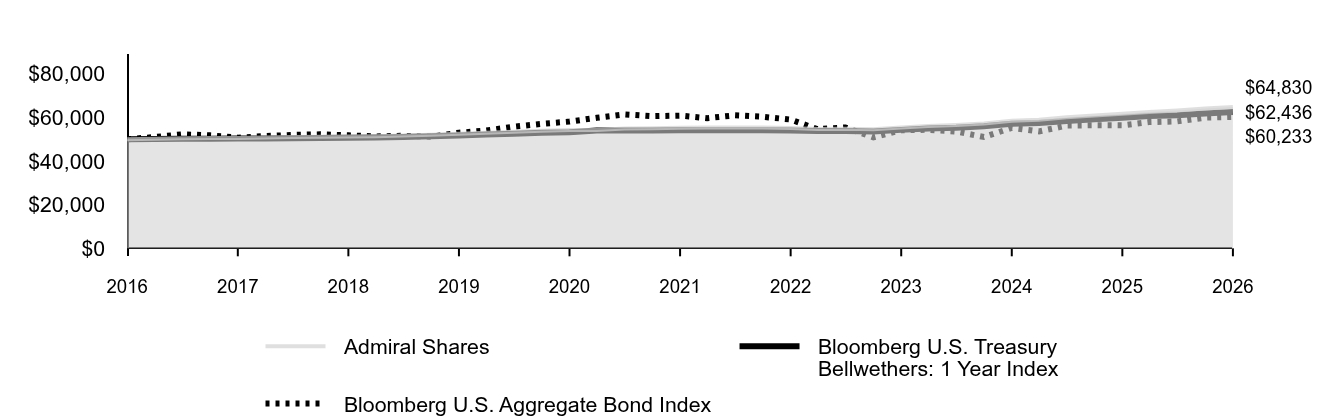 Table Summary | Admiral Shares | Bloomberg U.S. Treasury Bellwethers: 1 Year Index | Bloomberg U.S. Aggregate Bond Index |
|---|
2016 | $50,000 | $50,000 | $50,000 |
|---|
2016 | $50,195 | $50,080 | $51,012 |
|---|
2016 | $50,401 | $50,227 | $52,270 |
|---|
2016 | $50,532 | $50,278 | $51,781 |
|---|
2017 | $50,611 | $50,357 | $50,726 |
|---|
2017 | $50,783 | $50,384 | $51,434 |
|---|
2017 | $51,004 | $50,499 | $52,001 |
|---|
2017 | $51,185 | $50,599 | $52,248 |
|---|
2018 | $51,248 | $50,676 | $51,816 |
|---|
2018 | $51,394 | $50,827 | $51,270 |
|---|
2018 | $51,709 | $51,075 | $51,585 |
|---|
2018 | $52,022 | $51,323 | $51,175 |
|---|
2019 | $52,499 | $51,744 | $52,983 |
|---|
2019 | $52,996 | $52,146 | $53,983 |
|---|
2019 | $53,468 | $52,572 | $55,753 |
|---|
2019 | $53,894 | $53,021 | $57,065 |
|---|
2020 | $54,236 | $53,248 | $58,093 |
|---|
2020 | $54,229 | $53,997 | $59,835 |
|---|
2020 | $54,940 | $54,042 | $61,396 |
|---|
2020 | $55,093 | $54,065 | $60,596 |
|---|
2021 | $55,244 | $54,113 | $60,835 |
|---|
2021 | $55,329 | $54,146 | $59,676 |
|---|
2021 | $55,406 | $54,156 | $60,965 |
|---|
2021 | $55,362 | $54,148 | $60,306 |
|---|
2022 | $55,134 | $53,955 | $59,030 |
|---|
2022 | $54,642 | $53,726 | $54,596 |
|---|
2022 | $54,818 | $53,729 | $55,408 |
|---|
2022 | $54,599 | $53,602 | $50,848 |
|---|
2023 | $55,434 | $54,295 | $54,095 |
|---|
2023 | $56,029 | $54,874 | $54,363 |
|---|
2023 | $56,559 | $55,280 | $53,542 |
|---|
2023 | $57,189 | $55,989 | $51,029 |
|---|
2024 | $58,436 | $57,054 | $55,230 |
|---|
2024 | $58,939 | $57,437 | $53,565 |
|---|
2024 | $60,038 | $58,367 | $56,273 |
|---|
2024 | $60,923 | $59,195 | $56,411 |
|---|
2025 | $61,684 | $59,909 | $56,372 |
|---|
2025 | $62,442 | $60,604 | $57,861 |
|---|
2025 | $63,161 | $61,039 | $58,176 |
|---|
2025 | $64,055 | $61,800 | $59,886 |
|---|
2026 | $64,830 | $62,436 | $60,233 |
|---|
|
|
| Average Annual Return [Table Text Block] |
|
Table Summary | 1 Year | 5 Years | 10 Years |
|---|
Admiral Shares | 5.10% | 3.25% | 2.63% |
|---|
Bloomberg U.S. Treasury Bellwethers: 1 Year Index | 4.22% | 2.90% | 2.25% |
|---|
Bloomberg U.S. Aggregate Bond Index | 6.85% | -0.20% | 1.88% |
|---|
|
|
| No Deduction of Taxes [Text Block] |
|
The graph and returns shown do not reflect taxes that a shareholder would pay on fund distributions or on the sale of fund shares.
|
|
| Material Change Date |
|
|
Jan. 31, 2025
|
| Updated Performance Information Location [Text Block] |
|
Updated performance information is available on our website at vanguard.com/performance or by calling Vanguard toll-free at 800-662-7447.
|
|
| AssetsNet |
|
$ 15,582,000,000
|
|
| Holdings Count | Holding |
|
954
|
|
| Advisory Fees Paid, Amount |
|
$ 2,768,000
|
|
| InvestmentCompanyPortfolioTurnover |
|
82.00%
|
|
| Additional Fund Statistics [Text Block] |
|
Fund Statistics
(as of January 31, 2026)Table SummaryFund Net Assets (in millions) | $15,582 |
|---|
Number of Portfolio Holdings | 954 |
|---|
Portfolio Turnover Rate | 82% |
|---|
Total Investment Advisory Fees (in thousands) | $2,768 |
|---|
|
|
| Holdings [Text Block] |
|
Portfolio Composition % of Net Assets
(as of January 31, 2026)Table SummaryAsset-Backed/Commercial Mortgage-Backed Securities | 30.1% |
|---|
Corporate Bonds | 57.2% |
|---|
Sovereign Bonds | 2.6% |
|---|
U.S. Government and Agency Obligations | 1.4% |
|---|
Other Assets and Liabilities—NetFootnote Reference | 8.7% |
|---|
This table reflects the Fund's investments, including short-term investments, derivatives and other assets and liabilities. |
|
| Material Fund Change [Text Block] |
|
How has the Fund changed?During the reporting period, the expense ratio for the Admiral Share class was reduced. Effective January 12, 2026, The Vanguard Group, Inc. exercises portfolio management responsibilities for the fund through its wholly-owned subsidiary, Vanguard Capital Management, LLC. This is a summary of certain changes to the Fund since January 31, 2025. For more complete information, you may review the Fund’s next prospectus, which we expect to be available by May 31, 2026, at https://personal1.vanguard.com/ngf-next-gen-form-webapp/fund-literature or upon request at 800-662-7447. |
|
| Material Fund Change Expenses [Text Block] |
|
During the reporting period, the expense ratio for the Admiral Share class was reduced.
|
|
| Material Fund Change Adviser [Text Block] |
|
Effective January 12, 2026, The Vanguard Group, Inc. exercises portfolio management responsibilities for the fund through its wholly-owned subsidiary, Vanguard Capital Management, LLC.
|
|
| Summary of Change Legend [Text Block] |
|
This is a summary of certain changes to the Fund since January 31, 2025. For more complete information, you may review the Fund’s next prospectus, which we expect to be available by May 31, 2026, at https://personal1.vanguard.com/ngf-next-gen-form-webapp/fund-literature or upon request at 800-662-7447.
|
|
| Updated Prospectus Phone Number |
|
800-662-7447
|
|
| Updated Prospectus Web Address |
|
https://personal1.vanguard.com/ngf-next-gen-form-webapp/fund-literature
|
|
| C000264003 |
|
|
|
| Shareholder Report [Line Items] |
|
|
|
| Fund Name |
|
High-Yield Active ETF
|
|
| Class Name |
|
ETF Shares
|
|
| Trading Symbol |
|
VGHY
|
|
| Security Exchange Name |
|
CboeBZX
|
|
| Annual or Semi-Annual Statement [Text Block] |
|
This annual shareholder report contains important information about Vanguard High-Yield Active ETF (the "Fund") for the period of September 16, 2025, to January 31, 2026.
|
|
| Additional Information [Text Block] |
|
You can find additional information about the Fund at https://personal1.vanguard.com/ngf-next-gen-form-webapp/fund-literature. You can also request this information by contacting us at 800-662-7447.
|
|
| Material Fund Change Notice [Text Block] |
|
The report describes changes to the Fund that occurred during the reporting period.
|
|
| Additional Information Phone Number |
|
<span style="white-space: nowrap; box-sizing: border-box; color: rgb(0, 0, 0); display: inline; flex-wrap: nowrap; font-size: 10.6667px; font-weight: 400; grid-area: auto; line-height: 16px; margin: 0px; overflow: visible; text-align: left; text-align-last: auto;"> 800-662-7447</span>
|
|
| Additional Information Website |
|
<span style="white-space: nowrap; box-sizing: border-box; color: rgb(0, 0, 0); display: inline; flex-wrap: nowrap; font-size: 10.6667px; font-weight: 400; grid-area: auto; line-height: 16px; margin: 0px; overflow: visible; text-align: left; text-align-last: auto;"><span style="box-sizing: border-box; color: rgb(0, 0, 0); display: inline; flex-wrap: nowrap; font-size: 10.6667px; font-weight: 400; grid-area: auto; line-height: 16px; margin: 0px; overflow: visible; text-align: left; text-align-last: auto; white-space-collapse: collapse;"><span style="text-decoration: underline; box-sizing: border-box; color: rgb(0, 0, 0); display: inline; flex-wrap: nowrap; font-size: 10.6667px; font-weight: 400; grid-area: auto; line-height: 16px; margin: 0px; overflow: visible; text-align: left; text-align-last: auto; white-space-collapse: collapse;">https://personal1.vanguard.com/ngf-next-gen-form-webapp/fund-literature</span></span></span>
|
|
| Expenses [Text Block] |
|
What were the Fund costs for the last period?(based on a hypothetical $10,000 investment) Table SummaryShare Class Name | Costs of a $10,000 investment | Costs paid as a percentage of a $10,000 investment |
|---|
ETF Shares | $8Footnote Reference1 | 0.22%Footnote Reference2 |
|---|
| Footnote | Description | Footnote1 | Costs would be higher for a full year. | Footnote2 | Annualized. |
|
|
| Expenses Paid, Amount |
[1] |
$ 8
|
|
| Expense Ratio, Percent |
[2] |
0.22%
|
|
| Expenses Short Period Footnote [Text Block] |
|
Costs would be higher for a full year.
|
|
| Factors Affecting Performance [Text Block] |
|
How did the Fund perform during the reporting period? From its inception on September 16, 2025, through January 31, 2026, the Fund outperformed its benchmark. From September 2025 through January 2026, global financial markets rose, buoyed by optimism surrounding artificial intelligence, robust corporate earnings, and a more dovish monetary policy. The Federal Reserve lowered rates three times during the period, while the Bank of England cut rates twice. This actively managed fund invests in a diversified portfolio of below-investment-grade bonds, sometimes referred to as “junk bonds.” It seeks to outperform the broad high-yield market through security selection, sector allocation, and other active portfolio management decisions.
|
|
| Performance Past Does Not Indicate Future [Text] |
|
Keep in mind that the Fund's past performance does not indicate how the Fund will perform in the future.
|
|
| Line Graph [Table Text Block] |
|
Table Summary | ETF Shares Net Asset Value | Bloomberg U.S. High Yield 2% Issuer Capped Total Return Index | Bloomberg U.S. Aggregate Bond Index |
|---|
2025 | $10,000 | $10,000 | $10,000 |
|---|
2026 | $10,218 | $10,185 | $10,069 |
|---|
|
|
| Average Annual Return [Table Text Block] |
|
Table Summary | Since Inception 9/16/25 |
|---|
ETF Shares Net Asset Value | 2.18% |
|---|
Bloomberg U.S. High Yield 2% Issuer Capped Total Return Index | 1.85% |
|---|
Bloomberg U.S. Aggregate Bond Index | 0.69% |
|---|
|
|
| Performance Inception Date |
|
Sep. 16, 2025
|
|
| No Deduction of Taxes [Text Block] |
|
The graph and returns shown do not reflect taxes that a shareholder would pay on fund distributions or on the sale of fund shares.
|
|
| Updated Performance Information Location [Text Block] |
|
Updated performance information is available on our website at vanguard.com/performance or by calling Vanguard toll-free at 800-662-7447.
|
|
| AssetsNet |
|
$ 191,000,000
|
|
| Holdings Count | Holding |
|
429
|
|
| Advisory Fees Paid, Amount |
|
$ 6,000
|
|
| InvestmentCompanyPortfolioTurnover |
|
20.00%
|
|
| Additional Fund Statistics [Text Block] |
|
Fund Statistics
(as of January 31, 2026)Table SummaryFund Net Assets (in millions) | $191 |
|---|
Number of Portfolio Holdings | 429 |
|---|
Portfolio Turnover Rate | 20% |
|---|
Total Investment Advisory Fees (in thousands) | $6 |
|---|
|
|
| Holdings [Text Block] |
|
Portfolio Composition % of Net Assets
(as of January 31, 2026)Table SummaryCommunications | 12.3% | |
|---|
Consumer Discretionary | 14.3% | |
|---|
Consumer Staples | 5.7% | |
|---|
Energy | 11.0% | |
|---|
Financials | 9.7% | |
|---|
Health Care | 6.3% | |
|---|
Industrials | 7.4% | |
|---|
Materials | 11.7% | |
|---|
Real Estate | 3.0% | |
|---|
Technology | 3.7% | |
|---|
Utilities | 3.6% | |
|---|
Other | 11.1% | |
|---|
Other Assets and Liabilities—NetFootnote Reference | 0.2% | |
|---|
This table reflects the Fund's investments, including short-term investments, derivatives and other assets and liabilities. |
|
| Material Fund Change [Text Block] |
|
How has the Fund changed?Effective January 12, 2026, The Vanguard Group, Inc. exercises portfolio management responsibilities for the fund through its wholly-owned subsidiary, Vanguard Capital Management, LLC. This is a summary of certain changes to the Fund since September 16, 2025. For more complete information, you may review the Fund’s next prospectus, which we expect to be available by May 31, 2026, at https://personal1.vanguard.com/ngf-next-gen-form-webapp/fund-literature or upon request at 800-662-7447. |
|
| Material Fund Change Adviser [Text Block] |
|
Effective January 12, 2026, The Vanguard Group, Inc. exercises portfolio management responsibilities for the fund through its wholly-owned subsidiary, Vanguard Capital Management, LLC.
|
|
| Summary of Change Legend [Text Block] |
|
This is a summary of certain changes to the Fund since September 16, 2025. For more complete information, you may review the Fund’s next prospectus, which we expect to be available by May 31, 2026, at https://personal1.vanguard.com/ngf-next-gen-form-webapp/fund-literature or upon request at 800-662-7447.
|
|
| Updated Prospectus Phone Number |
|
800-662-7447
|
|
| Updated Prospectus Web Address |
|
https://personal1.vanguard.com/ngf-next-gen-form-webapp/fund-literature
|
|
|
|