Shareholder Report
|
12 Months Ended |
|
Jan. 31, 2026
USD ($)
Holding
|
Jan. 31, 2025 |
| Shareholder Report [Line Items] |
|
|
| Document Type |
N-CSR
|
|
| Amendment Flag |
false
|
|
| Registrant Name |
Vanguard Specialized
Funds
|
|
| Entity Central Index Key |
0000734383
|
|
| Entity Investment Company Type |
N-1A
|
|
| Document Period End Date |
Jan. 31, 2026
|
|
| Shareholder Report Annual or Semi-Annual |
Annual Shareholder Report
|
|
| C000008004 |
|
|
| Shareholder Report [Line Items] |
|
|
| Fund Name |
Dividend Growth Fund
|
|
| Class Name |
Investor Shares
|
|
| Trading Symbol |
VDIGX
|
|
| Annual or Semi-Annual Statement [Text Block] |
This annual shareholder report contains important information about Vanguard Dividend Growth Fund (the "Fund") for the period of February 1, 2025, to January 31, 2026.
|
|
| Additional Information [Text Block] |
You can find additional information about the Fund at https://personal1.vanguard.com/ngf-next-gen-form-webapp/fund-literature. You can also request this information by contacting us at 800-662-7447.
|
|
| Material Fund Change Notice [Text Block] |
The report describes changes to the Fund that occurred during the reporting period.
|
|
| Additional Information Phone Number |
<span style="white-space: nowrap; box-sizing: border-box; color: rgb(0, 0, 0); display: inline; flex-wrap: nowrap; font-size: 10.6667px; font-weight: 400; grid-area: auto; line-height: 16px; margin: 0px; overflow: visible; text-align: left; text-align-last: auto;"> 800-662-7447</span>
|
|
| Additional Information Website |
<span style="white-space: nowrap; box-sizing: border-box; color: rgb(0, 0, 0); display: inline; flex-wrap: nowrap; font-size: 10.6667px; font-weight: 400; grid-area: auto; line-height: 16px; margin: 0px; overflow: visible; text-align: left; text-align-last: auto;"><span style="box-sizing: border-box; color: rgb(0, 0, 0); display: inline; flex-wrap: nowrap; font-size: 10.6667px; font-weight: 400; grid-area: auto; line-height: 16px; margin: 0px; overflow: visible; text-align: left; text-align-last: auto; white-space-collapse: collapse;"><span style="text-decoration: underline; box-sizing: border-box; color: rgb(0, 0, 0); display: inline; flex-wrap: nowrap; font-size: 10.6667px; font-weight: 400; grid-area: auto; line-height: 16px; margin: 0px; overflow: visible; text-align: left; text-align-last: auto; white-space-collapse: collapse;">https://personal1.vanguard.com/ngf-next-gen-form-webapp/fund-literature</span></span></span>
|
|
| Expenses [Text Block] |
What were the Fund costs for the last year?(based on a hypothetical $10,000 investment) Table SummaryShare Class Name | Costs of a $10,000 investment | Costs paid as a percentage of a $10,000 investment |
|---|
Investor Shares | $21 | 0.20% |
|---|
|
|
| Expenses Paid, Amount |
$ 21
|
|
| Expense Ratio, Percent |
0.20%
|
|
| Factors Affecting Performance [Text Block] |
How did the Fund perform during the reporting period? For the 12 months ended January 31, 2026, the Fund underperformed its benchmark. The first part of the period was marked by volatility in the financial markets amid fears that U.S. tariff announcements might spark trade wars and drag down global growth. Despite these concerns, markets posted solid gains for the 12 months, buoyed by optimism surrounding artificial intelligence, robust corporate earnings, and a more dovish monetary policy. The European Central Bank and the Federal Reserve each cut interest rates three times, while the Bank of England lowered rates four times. Eight of 11 industry sectors detracted from relative performance. Information technology hurt results the most due to weak stock selection, while health care and financials also weighed heavily. Strong selection in communication services added value, but the sector’s modest weighting muted its impact on the Fund’s overall performance.
|
|
| Performance Past Does Not Indicate Future [Text] |
Keep in mind that the Fund's past performance does not indicate how the Fund will perform in the future.
|
|
| Line Graph [Table Text Block] |
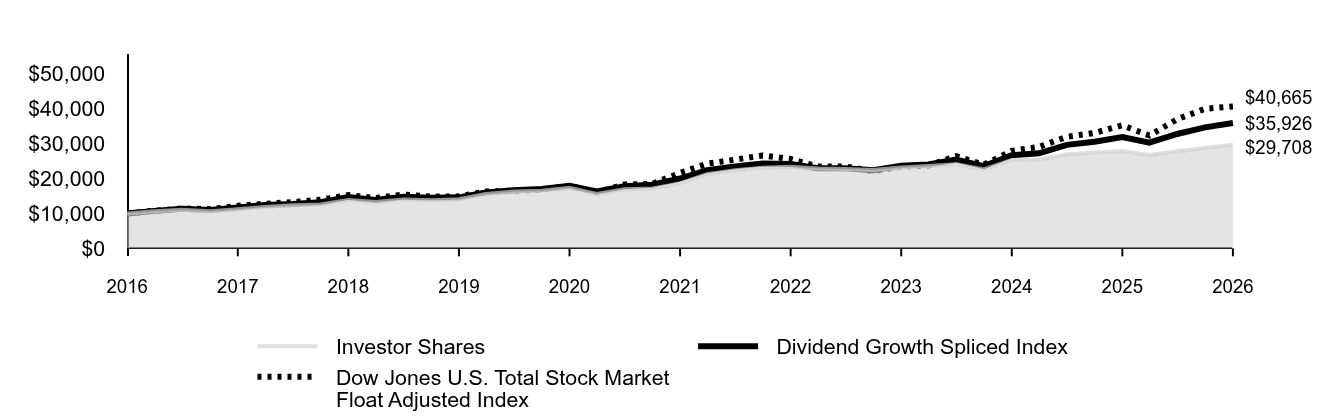 Table Summary | Investor Shares | Dividend Growth Spliced Index | Dow Jones U.S. Total Stock Market Float Adjusted Index |
|---|
2016 | $10,000 | $10,000 | $10,000 |
|---|
2016 | $10,644 | $10,722 | $10,765 |
|---|
2016 | $11,065 | $11,335 | $11,417 |
|---|
2016 | $10,615 | $11,005 | $11,215 |
|---|
2017 | $11,206 | $11,667 | $12,172 |
|---|
2017 | $11,861 | $12,376 | $12,764 |
|---|
2017 | $12,328 | $12,702 | $13,258 |
|---|
2017 | $12,553 | $13,227 | $13,901 |
|---|
2018 | $13,856 | $14,723 | $15,235 |
|---|
2018 | $13,241 | $13,816 | $14,431 |
|---|
2018 | $14,018 | $14,765 | $15,436 |
|---|
2018 | $13,805 | $14,454 | $14,813 |
|---|
2019 | $14,082 | $14,600 | $14,881 |
|---|
2019 | $15,546 | $16,030 | $16,247 |
|---|
2019 | $16,307 | $16,662 | $16,502 |
|---|
2019 | $16,476 | $17,008 | $16,797 |
|---|
2020 | $17,368 | $17,918 | $17,913 |
|---|
2020 | $15,604 | $16,317 | $16,055 |
|---|
2020 | $16,937 | $17,776 | $18,284 |
|---|
2020 | $17,126 | $18,238 | $18,475 |
|---|
2021 | $18,589 | $19,995 | $21,593 |
|---|
2021 | $21,238 | $22,384 | $24,245 |
|---|
2021 | $22,348 | $23,479 | $25,402 |
|---|
2021 | $23,082 | $24,267 | $26,617 |
|---|
2022 | $23,359 | $24,149 | $25,587 |
|---|
2022 | $22,873 | $22,956 | $23,429 |
|---|
2022 | $22,743 | $22,959 | $23,425 |
|---|
2022 | $22,405 | $22,381 | $22,107 |
|---|
2023 | $23,181 | $23,681 | $23,433 |
|---|
2023 | $23,571 | $24,001 | $23,728 |
|---|
2023 | $24,080 | $25,447 | $26,381 |
|---|
2023 | $22,582 | $23,554 | $23,963 |
|---|
2024 | $25,294 | $26,694 | $27,919 |
|---|
2024 | $25,463 | $27,204 | $29,048 |
|---|
2024 | $26,973 | $29,648 | $31,949 |
|---|
2024 | $27,450 | $30,515 | $33,068 |
|---|
2025 | $27,873 | $31,871 | $35,256 |
|---|
2025 | $26,716 | $30,261 | $32,317 |
|---|
2025 | $27,793 | $32,750 | $36,974 |
|---|
2025 | $28,723 | $34,654 | $39,980 |
|---|
2026 | $29,708 | $35,926 | $40,665 |
|---|
|
|
| Average Annual Return [Table Text Block] |
Table Summary | 1 Year | 5 Years | 10 Years |
|---|
Investor Shares | 6.58% | 9.83% | 11.50% |
|---|
Dividend Growth Spliced Index | 12.72% | 12.43% | 13.64% |
|---|
Dow Jones U.S. Total Stock Market Float Adjusted Index | 15.34% | 13.50% | 15.06% |
|---|
|
|
| No Deduction of Taxes [Text Block] |
The graph and returns shown do not reflect taxes that a shareholder would pay on fund distributions or on the sale of fund shares.
|
|
| Material Change Date |
|
Jan. 31, 2025
|
| Updated Performance Information Location [Text Block] |
Updated performance information is available on our website at vanguard.com/performance or by calling Vanguard toll-free at 800-662-7447.
|
|
| AssetsNet |
$ 40,339,000,000
|
|
| Holdings Count | Holding |
55
|
|
| Advisory Fees Paid, Amount |
$ 26,394,000
|
|
| InvestmentCompanyPortfolioTurnover |
40.00%
|
|
| Additional Fund Statistics [Text Block] |
Fund Statistics
(as of January 31, 2026)Table SummaryFund Net Assets (in millions) | $40,339 |
|---|
Number of Portfolio Holdings | 55 |
|---|
Portfolio Turnover Rate | 40% |
|---|
Total Investment Advisory Fees (in thousands) | $26,394 |
|---|
|
|
| Holdings [Text Block] |
Portfolio Composition % of Net Assets
(as of January 31, 2026)Table SummaryCommunication Services | 3.6% |
|---|
Consumer Discretionary | 11.4% |
|---|
Consumer Staples | 8.2% |
|---|
Financials | 17.6% |
|---|
Health Care | 16.8% |
|---|
Industrials | 14.5% |
|---|
Information Technology | 23.3% |
|---|
Materials | 2.7% |
|---|
Other Assets and Liabilities—Net | 1.9% |
|---|
This table reflects the Fund's investments, including short-term investments and other assets and liabilities. |
|
| Material Fund Change [Text Block] |
How has the Fund changed?Effective January 12, 2026, The Vanguard Group, Inc. exercises portfolio management responsibilities through its wholly-owned subsidiaries, Vanguard Capital Management, LLC and Vanguard Portfolio Management, LLC. This is a summary of certain changes to the Fund since January 31, 2025. For more complete information, you may review the Fund’s next prospectus, which we expect to be available by May 31, 2026, at https://personal1.vanguard.com/ngf-next-gen-form-webapp/fund-literature or upon request at 800-662-7447. |
|
| Material Fund Change Adviser [Text Block] |
Effective January 12, 2026, The Vanguard Group, Inc. exercises portfolio management responsibilities through its wholly-owned subsidiaries, Vanguard Capital Management, LLC and Vanguard Portfolio Management, LLC.
|
|
| Summary of Change Legend [Text Block] |
This is a summary of certain changes to the Fund since January 31, 2025. For more complete information, you may review the Fund’s next prospectus, which we expect to be available by May 31, 2026, at https://personal1.vanguard.com/ngf-next-gen-form-webapp/fund-literature or upon request at 800-662-7447.
|
|
| Updated Prospectus Phone Number |
800-662-7447
|
|
| Updated Prospectus Web Address |
https://personal1.vanguard.com/ngf-next-gen-form-webapp/fund-literature
|
|
| C000008005 |
|
|
| Shareholder Report [Line Items] |
|
|
| Fund Name |
Energy Fund
|
|
| Class Name |
Investor Shares
|
|
| Trading Symbol |
VGENX
|
|
| Annual or Semi-Annual Statement [Text Block] |
This annual shareholder report contains important information about Vanguard Energy Fund (the "Fund") for the period of February 1, 2025, to January 31, 2026.
|
|
| Additional Information [Text Block] |
You can find additional information about the Fund at https://personal1.vanguard.com/ngf-next-gen-form-webapp/fund-literature. You can also request this information by contacting us at 800-662-7447.
|
|
| Material Fund Change Notice [Text Block] |
The report describes changes to the Fund that occurred during the reporting period.
|
|
| Additional Information Phone Number |
<span style="white-space: nowrap; box-sizing: border-box; color: rgb(0, 0, 0); display: inline; flex-wrap: nowrap; font-size: 10.6667px; font-weight: 400; grid-area: auto; line-height: 16px; margin: 0px; overflow: visible; text-align: left; text-align-last: auto;"> 800-662-7447</span>
|
|
| Additional Information Website |
<span style="white-space: nowrap; box-sizing: border-box; color: rgb(0, 0, 0); display: inline; flex-wrap: nowrap; font-size: 10.6667px; font-weight: 400; grid-area: auto; line-height: 16px; margin: 0px; overflow: visible; text-align: left; text-align-last: auto;"><span style="box-sizing: border-box; color: rgb(0, 0, 0); display: inline; flex-wrap: nowrap; font-size: 10.6667px; font-weight: 400; grid-area: auto; line-height: 16px; margin: 0px; overflow: visible; text-align: left; text-align-last: auto; white-space-collapse: collapse;"><span style="text-decoration: underline; box-sizing: border-box; color: rgb(0, 0, 0); display: inline; flex-wrap: nowrap; font-size: 10.6667px; font-weight: 400; grid-area: auto; line-height: 16px; margin: 0px; overflow: visible; text-align: left; text-align-last: auto; white-space-collapse: collapse;">https://personal1.vanguard.com/ngf-next-gen-form-webapp/fund-literature</span></span></span>
|
|
| Expenses [Text Block] |
What were the Fund costs for the last year?(based on a hypothetical $10,000 investment) Table SummaryShare Class Name | Costs of a $10,000 investment | Costs paid as a percentage of a $10,000 investment |
|---|
Investor Shares | $51 | 0.45% |
|---|
|
|
| Expenses Paid, Amount |
$ 51
|
|
| Expense Ratio, Percent |
0.45%
|
|
| Factors Affecting Performance [Text Block] |
How did the Fund perform during the reporting period? For the 12 months ended January 31, 2026, the Fund outperformed its benchmark. The first part of the period was marked by volatility in the financial markets amid fears that U.S. tariff announcements might spark trade wars and drag down global growth. Despite these concerns, markets posted solid gains for the 12 months, buoyed by optimism surrounding artificial intelligence, robust corporate earnings, and a more dovish monetary policy. The European Central Bank and the Federal Reserve each cut interest rates three times, while the Bank of England lowered rates four times. The Fund’s stock selection in multi-utilities contributed the most to relative performance. An overweight allocation to semiconductors and an underweight to independent power producers & energy traders also added to results. On the other hand, oil & gas exploration & production detracted the most. Regionally, Europe boosted relative performance, while North America and emerging markets detracted.
|
|
| Performance Past Does Not Indicate Future [Text] |
Keep in mind that the Fund's past performance does not indicate how the Fund will perform in the future.
|
|
| Line Graph [Table Text Block] |
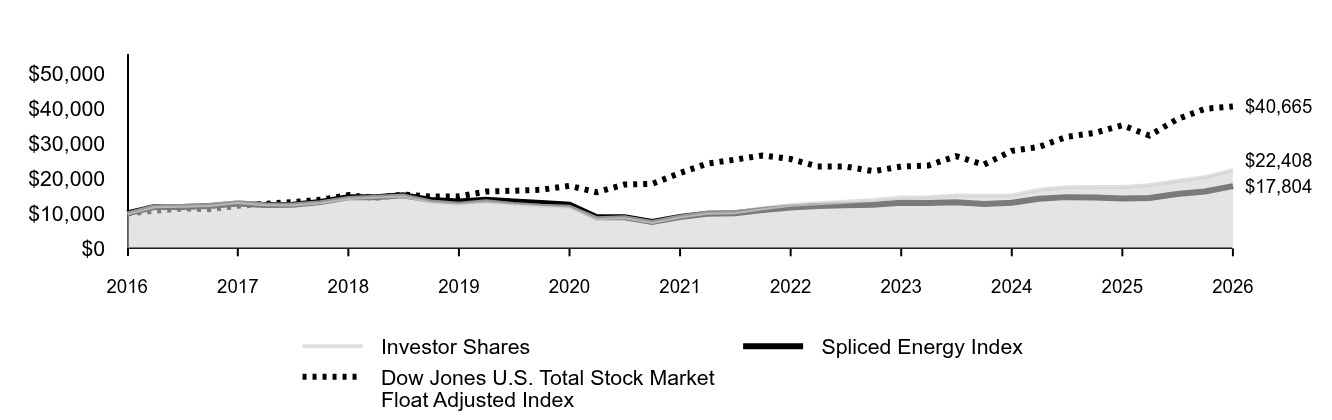 Table Summary | Investor Shares | Spliced Energy Index | Dow Jones U.S. Total Stock Market Float Adjusted Index |
|---|
2016 | $10,000 | $10,000 | $10,000 |
|---|
2016 | $12,053 | $11,847 | $10,765 |
|---|
2016 | $12,177 | $11,807 | $11,417 |
|---|
2016 | $12,439 | $12,114 | $11,215 |
|---|
2017 | $13,273 | $12,854 | $12,172 |
|---|
2017 | $12,622 | $12,403 | $12,764 |
|---|
2017 | $12,569 | $12,485 | $13,258 |
|---|
2017 | $13,222 | $13,276 | $13,901 |
|---|
2018 | $14,434 | $14,619 | $15,235 |
|---|
2018 | $14,754 | $14,631 | $14,431 |
|---|
2018 | $15,131 | $15,214 | $15,436 |
|---|
2018 | $13,434 | $13,830 | $14,813 |
|---|
2019 | $12,777 | $13,448 | $14,881 |
|---|
2019 | $13,490 | $13,944 | $16,247 |
|---|
2019 | $12,684 | $13,381 | $16,502 |
|---|
2019 | $12,219 | $12,963 | $16,797 |
|---|
2020 | $11,940 | $12,509 | $17,913 |
|---|
2020 | $8,641 | $8,923 | $16,055 |
|---|
2020 | $8,879 | $8,902 | $18,284 |
|---|
2020 | $7,547 | $7,525 | $18,475 |
|---|
2021 | $9,128 | $8,976 | $21,593 |
|---|
2021 | $10,196 | $9,914 | $24,245 |
|---|
2021 | $10,341 | $10,024 | $25,402 |
|---|
2021 | $11,482 | $10,971 | $26,617 |
|---|
2022 | $12,445 | $11,676 | $25,587 |
|---|
2022 | $12,892 | $12,132 | $23,429 |
|---|
2022 | $13,335 | $12,314 | $23,425 |
|---|
2022 | $13,841 | $12,507 | $22,107 |
|---|
2023 | $14,525 | $13,063 | $23,433 |
|---|
2023 | $14,639 | $13,001 | $23,728 |
|---|
2023 | $15,159 | $13,209 | $26,381 |
|---|
2023 | $15,034 | $12,669 | $23,963 |
|---|
2024 | $15,107 | $13,078 | $27,919 |
|---|
2024 | $16,782 | $14,216 | $29,048 |
|---|
2024 | $17,482 | $14,664 | $31,949 |
|---|
2024 | $17,569 | $14,566 | $33,068 |
|---|
2025 | $17,561 | $14,294 | $35,256 |
|---|
2025 | $18,039 | $14,402 | $32,317 |
|---|
2025 | $19,275 | $15,537 | $36,974 |
|---|
2025 | $20,385 | $16,265 | $39,980 |
|---|
2026 | $22,408 | $17,804 | $40,665 |
|---|
|
|
| Average Annual Return [Table Text Block] |
Table Summary | 1 Year | 5 Years | 10 Years |
|---|
Investor Shares | 27.60% | 19.67% | 8.40% |
|---|
Spliced Energy Index | 24.55% | 14.68% | 5.94% |
|---|
Dow Jones U.S. Total Stock Market Float Adjusted Index | 15.34% | 13.50% | 15.06% |
|---|
|
|
| No Deduction of Taxes [Text Block] |
The graph and returns shown do not reflect taxes that a shareholder would pay on fund distributions or on the sale of fund shares.
|
|
| Material Change Date |
|
Jan. 31, 2025
|
| Updated Performance Information Location [Text Block] |
Updated performance information is available on our website at vanguard.com/performance or by calling Vanguard toll-free at 800-662-7447.
|
|
| AssetsNet |
$ 6,631,000,000
|
|
| Holdings Count | Holding |
43
|
|
| Advisory Fees Paid, Amount |
$ 11,886,000
|
|
| InvestmentCompanyPortfolioTurnover |
19.00%
|
|
| Additional Fund Statistics [Text Block] |
Fund Statistics
(as of January 31, 2026)Table SummaryFund Net Assets (in millions) | $6,631 |
|---|
Number of Portfolio Holdings | 43 |
|---|
Portfolio Turnover Rate | 19% |
|---|
Total Investment Advisory Fees (in thousands) | $11,886 |
|---|
|
|
| Holdings [Text Block] |
Portfolio Composition % of Net Assets
(as of January 31, 2026)Table SummaryAsia | 3.2% |
|---|
Europe | 32.8% |
|---|
North America | 61.9% |
|---|
South America | 1.0% |
|---|
Other Assets and Liabilities—Net | 1.1% |
|---|
This table reflects the Fund's investments, including short-term investments and other assets and liabilities. |
|
| Material Fund Change [Text Block] |
How has the Fund changed?Effective January 12, 2026, The Vanguard Group, Inc. exercises portfolio management responsibilities through its wholly-owned subsidiaries, Vanguard Capital Management, LLC and Vanguard Portfolio Management, LLC. This is a summary of certain changes to the Fund since January 31, 2025. For more complete information, you may review the Fund’s next prospectus, which we expect to be available by May 31, 2026, at https://personal1.vanguard.com/ngf-next-gen-form-webapp/fund-literature or upon request at 800-662-7447. |
|
| Material Fund Change Adviser [Text Block] |
Effective January 12, 2026, The Vanguard Group, Inc. exercises portfolio management responsibilities through its wholly-owned subsidiaries, Vanguard Capital Management, LLC and Vanguard Portfolio Management, LLC.
|
|
| Summary of Change Legend [Text Block] |
This is a summary of certain changes to the Fund since January 31, 2025. For more complete information, you may review the Fund’s next prospectus, which we expect to be available by May 31, 2026, at https://personal1.vanguard.com/ngf-next-gen-form-webapp/fund-literature or upon request at 800-662-7447.
|
|
| Updated Prospectus Phone Number |
800-662-7447
|
|
| Updated Prospectus Web Address |
https://personal1.vanguard.com/ngf-next-gen-form-webapp/fund-literature
|
|
| C000008006 |
|
|
| Shareholder Report [Line Items] |
|
|
| Fund Name |
Energy Fund
|
|
| Class Name |
Admiral™ Shares
|
|
| Trading Symbol |
VGELX
|
|
| Annual or Semi-Annual Statement [Text Block] |
This annual shareholder report contains important information about Vanguard Energy Fund (the "Fund") for the period of February 1, 2025, to January 31, 2026.
|
|
| Additional Information [Text Block] |
You can find additional information about the Fund at https://personal1.vanguard.com/ngf-next-gen-form-webapp/fund-literature. You can also request this information by contacting us at 800-662-7447.
|
|
| Material Fund Change Notice [Text Block] |
The report describes changes to the Fund that occurred during the reporting period.
|
|
| Additional Information Phone Number |
<span style="white-space: nowrap; box-sizing: border-box; color: rgb(0, 0, 0); display: inline; flex-wrap: nowrap; font-size: 10.6667px; font-weight: 400; grid-area: auto; line-height: 16px; margin: 0px; overflow: visible; text-align: left; text-align-last: auto;"> 800-662-7447</span>
|
|
| Additional Information Website |
<span style="white-space: nowrap; box-sizing: border-box; color: rgb(0, 0, 0); display: inline; flex-wrap: nowrap; font-size: 10.6667px; font-weight: 400; grid-area: auto; line-height: 16px; margin: 0px; overflow: visible; text-align: left; text-align-last: auto;"><span style="box-sizing: border-box; color: rgb(0, 0, 0); display: inline; flex-wrap: nowrap; font-size: 10.6667px; font-weight: 400; grid-area: auto; line-height: 16px; margin: 0px; overflow: visible; text-align: left; text-align-last: auto; white-space-collapse: collapse;"><span style="text-decoration: underline; box-sizing: border-box; color: rgb(0, 0, 0); display: inline; flex-wrap: nowrap; font-size: 10.6667px; font-weight: 400; grid-area: auto; line-height: 16px; margin: 0px; overflow: visible; text-align: left; text-align-last: auto; white-space-collapse: collapse;">https://personal1.vanguard.com/ngf-next-gen-form-webapp/fund-literature</span></span></span>
|
|
| Expenses [Text Block] |
What were the Fund costs for the last year?(based on a hypothetical $10,000 investment) Table SummaryShare Class Name | Costs of a $10,000 investment | Costs paid as a percentage of a $10,000 investment |
|---|
Admiral Shares | $42 | 0.37% |
|---|
|
|
| Expenses Paid, Amount |
$ 42
|
|
| Expense Ratio, Percent |
0.37%
|
|
| Factors Affecting Performance [Text Block] |
How did the Fund perform during the reporting period? For the 12 months ended January 31, 2026, the Fund outperformed its benchmark. The first part of the period was marked by volatility in the financial markets amid fears that U.S. tariff announcements might spark trade wars and drag down global growth. Despite these concerns, markets posted solid gains for the 12 months, buoyed by optimism surrounding artificial intelligence, robust corporate earnings, and a more dovish monetary policy. The European Central Bank and the Federal Reserve each cut interest rates three times, while the Bank of England lowered rates four times. The Fund’s stock selection in multi-utilities contributed the most to relative performance. An overweight allocation to semiconductors and an underweight to independent power producers & energy traders also added to results. On the other hand, oil & gas exploration & production detracted the most. Regionally, Europe boosted relative performance, while North America and emerging markets detracted.
|
|
| Performance Past Does Not Indicate Future [Text] |
Keep in mind that the Fund's past performance does not indicate how the Fund will perform in the future.
|
|
| Line Graph [Table Text Block] |
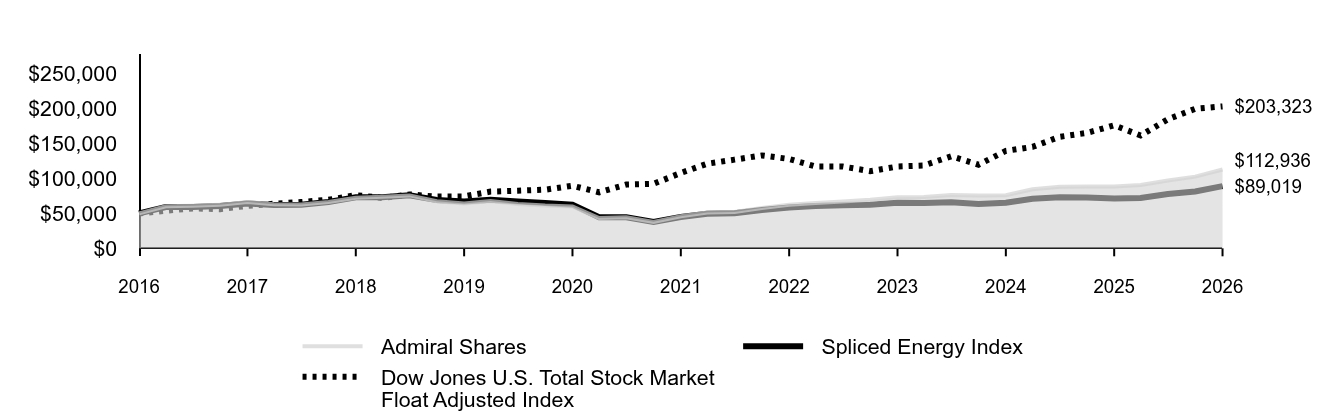 Table Summary | Admiral Shares | Spliced Energy Index | Dow Jones U.S. Total Stock Market Float Adjusted Index |
|---|
2016 | $50,000 | $50,000 | $50,000 |
|---|
2016 | $60,277 | $59,233 | $53,827 |
|---|
2016 | $60,903 | $59,034 | $57,084 |
|---|
2016 | $62,235 | $60,571 | $56,073 |
|---|
2017 | $66,417 | $64,271 | $60,862 |
|---|
2017 | $63,168 | $62,014 | $63,818 |
|---|
2017 | $62,920 | $62,427 | $66,290 |
|---|
2017 | $66,199 | $66,380 | $69,507 |
|---|
2018 | $72,286 | $73,095 | $76,175 |
|---|
2018 | $73,907 | $73,155 | $72,156 |
|---|
2018 | $75,808 | $76,069 | $77,182 |
|---|
2018 | $67,322 | $69,152 | $74,067 |
|---|
2019 | $64,047 | $67,241 | $74,404 |
|---|
2019 | $67,631 | $69,721 | $81,235 |
|---|
2019 | $63,600 | $66,906 | $82,511 |
|---|
2019 | $61,288 | $64,816 | $83,987 |
|---|
2020 | $59,883 | $62,547 | $89,564 |
|---|
2020 | $43,352 | $44,614 | $80,274 |
|---|
2020 | $44,549 | $44,512 | $91,422 |
|---|
2020 | $37,875 | $37,626 | $92,375 |
|---|
2021 | $45,825 | $44,881 | $107,965 |
|---|
2021 | $51,195 | $49,568 | $121,223 |
|---|
2021 | $51,929 | $50,122 | $127,008 |
|---|
2021 | $57,682 | $54,857 | $133,086 |
|---|
2022 | $62,519 | $58,381 | $127,935 |
|---|
2022 | $64,778 | $60,660 | $117,147 |
|---|
2022 | $67,030 | $61,570 | $117,125 |
|---|
2022 | $69,580 | $62,535 | $110,536 |
|---|
2023 | $73,039 | $65,316 | $117,165 |
|---|
2023 | $73,612 | $65,005 | $118,641 |
|---|
2023 | $76,242 | $66,047 | $131,906 |
|---|
2023 | $75,629 | $63,345 | $119,815 |
|---|
2024 | $76,024 | $65,390 | $139,596 |
|---|
2024 | $84,468 | $71,081 | $145,242 |
|---|
2024 | $88,022 | $73,318 | $159,745 |
|---|
2024 | $88,468 | $72,828 | $165,337 |
|---|
2025 | $88,438 | $71,471 | $176,278 |
|---|
2025 | $90,858 | $72,010 | $161,587 |
|---|
2025 | $97,114 | $77,687 | $184,871 |
|---|
2025 | $102,717 | $81,323 | $199,899 |
|---|
2026 | $112,936 | $89,019 | $203,323 |
|---|
|
|
| Average Annual Return [Table Text Block] |
Table Summary | 1 Year | 5 Years | 10 Years |
|---|
Admiral Shares | 27.70% | 19.77% | 8.49% |
|---|
Spliced Energy Index | 24.55% | 14.68% | 5.94% |
|---|
Dow Jones U.S. Total Stock Market Float Adjusted Index | 15.34% | 13.50% | 15.06% |
|---|
|
|
| No Deduction of Taxes [Text Block] |
The graph and returns shown do not reflect taxes that a shareholder would pay on fund distributions or on the sale of fund shares.
|
|
| Material Change Date |
|
Jan. 31, 2025
|
| Updated Performance Information Location [Text Block] |
Updated performance information is available on our website at vanguard.com/performance or by calling Vanguard toll-free at 800-662-7447.
|
|
| AssetsNet |
$ 6,631,000,000
|
|
| Holdings Count | Holding |
43
|
|
| Advisory Fees Paid, Amount |
$ 11,886,000
|
|
| InvestmentCompanyPortfolioTurnover |
19.00%
|
|
| Additional Fund Statistics [Text Block] |
Fund Statistics
(as of January 31, 2026)Table SummaryFund Net Assets (in millions) | $6,631 |
|---|
Number of Portfolio Holdings | 43 |
|---|
Portfolio Turnover Rate | 19% |
|---|
Total Investment Advisory Fees (in thousands) | $11,886 |
|---|
|
|
| Holdings [Text Block] |
Portfolio Composition % of Net Assets
(as of January 31, 2026)Table SummaryAsia | 3.2% |
|---|
Europe | 32.8% |
|---|
North America | 61.9% |
|---|
South America | 1.0% |
|---|
Other Assets and Liabilities—Net | 1.1% |
|---|
This table reflects the Fund's investments, including short-term investments and other assets and liabilities. |
|
| Material Fund Change [Text Block] |
How has the Fund changed?Effective January 12, 2026, The Vanguard Group, Inc. exercises portfolio management responsibilities through its wholly-owned subsidiaries, Vanguard Capital Management, LLC and Vanguard Portfolio Management, LLC. This is a summary of certain changes to the Fund since January 31, 2025. For more complete information, you may review the Fund’s next prospectus, which we expect to be available by May 31, 2026, at https://personal1.vanguard.com/ngf-next-gen-form-webapp/fund-literature or upon request at 800-662-7447. |
|
| Material Fund Change Adviser [Text Block] |
Effective January 12, 2026, The Vanguard Group, Inc. exercises portfolio management responsibilities through its wholly-owned subsidiaries, Vanguard Capital Management, LLC and Vanguard Portfolio Management, LLC.
|
|
| Summary of Change Legend [Text Block] |
This is a summary of certain changes to the Fund since January 31, 2025. For more complete information, you may review the Fund’s next prospectus, which we expect to be available by May 31, 2026, at https://personal1.vanguard.com/ngf-next-gen-form-webapp/fund-literature or upon request at 800-662-7447.
|
|
| Updated Prospectus Phone Number |
800-662-7447
|
|
| Updated Prospectus Web Address |
https://personal1.vanguard.com/ngf-next-gen-form-webapp/fund-literature
|
|
| C000008007 |
|
|
| Shareholder Report [Line Items] |
|
|
| Fund Name |
Health Care Fund
|
|
| Class Name |
Investor Shares
|
|
| Trading Symbol |
VGHCX
|
|
| Annual or Semi-Annual Statement [Text Block] |
This annual shareholder report contains important information about Vanguard Health Care Fund (the "Fund") for the period of February 1, 2025, to January 31, 2026.
|
|
| Additional Information [Text Block] |
You can find additional information about the Fund at https://personal1.vanguard.com/ngf-next-gen-form-webapp/fund-literature. You can also request this information by contacting us at 800-662-7447.
|
|
| Material Fund Change Notice [Text Block] |
The report describes changes to the Fund that occurred during the reporting period.
|
|
| Additional Information Phone Number |
<span style="white-space: nowrap; box-sizing: border-box; color: rgb(0, 0, 0); display: inline; flex-wrap: nowrap; font-size: 10.6667px; font-weight: 400; grid-area: auto; line-height: 16px; margin: 0px; overflow: visible; text-align: left; text-align-last: auto;"> 800-662-7447</span>
|
|
| Additional Information Website |
<span style="white-space: nowrap; box-sizing: border-box; color: rgb(0, 0, 0); display: inline; flex-wrap: nowrap; font-size: 10.6667px; font-weight: 400; grid-area: auto; line-height: 16px; margin: 0px; overflow: visible; text-align: left; text-align-last: auto;"><span style="box-sizing: border-box; color: rgb(0, 0, 0); display: inline; flex-wrap: nowrap; font-size: 10.6667px; font-weight: 400; grid-area: auto; line-height: 16px; margin: 0px; overflow: visible; text-align: left; text-align-last: auto; white-space-collapse: collapse;"><span style="text-decoration: underline; box-sizing: border-box; color: rgb(0, 0, 0); display: inline; flex-wrap: nowrap; font-size: 10.6667px; font-weight: 400; grid-area: auto; line-height: 16px; margin: 0px; overflow: visible; text-align: left; text-align-last: auto; white-space-collapse: collapse;">https://personal1.vanguard.com/ngf-next-gen-form-webapp/fund-literature</span></span></span>
|
|
| Expenses [Text Block] |
What were the Fund costs for the last year?(based on a hypothetical $10,000 investment) Table SummaryShare Class Name | Costs of a $10,000 investment | Costs paid as a percentage of a $10,000 investment |
|---|
Investor Shares | $35 | 0.33% |
|---|
|
|
| Expenses Paid, Amount |
$ 35
|
|
| Expense Ratio, Percent |
0.33%
|
|
| Factors Affecting Performance [Text Block] |
How did the Fund perform during the reporting period? For the 12 months ended January 31, 2026, the Fund outperformed its benchmark. The first part of the period was marked by volatility in the financial markets amid fears that U.S. tariff announcements might spark trade wars and drag down global growth. Despite these concerns, markets posted solid gains for the 12 months, buoyed by optimism surrounding artificial intelligence, robust corporate earnings, and a more dovish monetary policy. The European Central Bank and the Federal Reserve each cut interest rates three times, while the Bank of England lowered rates four times. Eight of the Fund’s 10 subsectors outperformed those of its benchmark. Health care equipment and biotechnology contributed the most to relative performance because of differences in allocation weights and stock selection. Stock selection in pharmaceuticals was also a top contributor. The largest detractors were stock selection in health care facilities and an overweight allocation to the poorly performing managed health care subsector.
|
|
| Performance Past Does Not Indicate Future [Text] |
Keep in mind that the Fund's past performance does not indicate how the Fund will perform in the future.
|
|
| Line Graph [Table Text Block] |
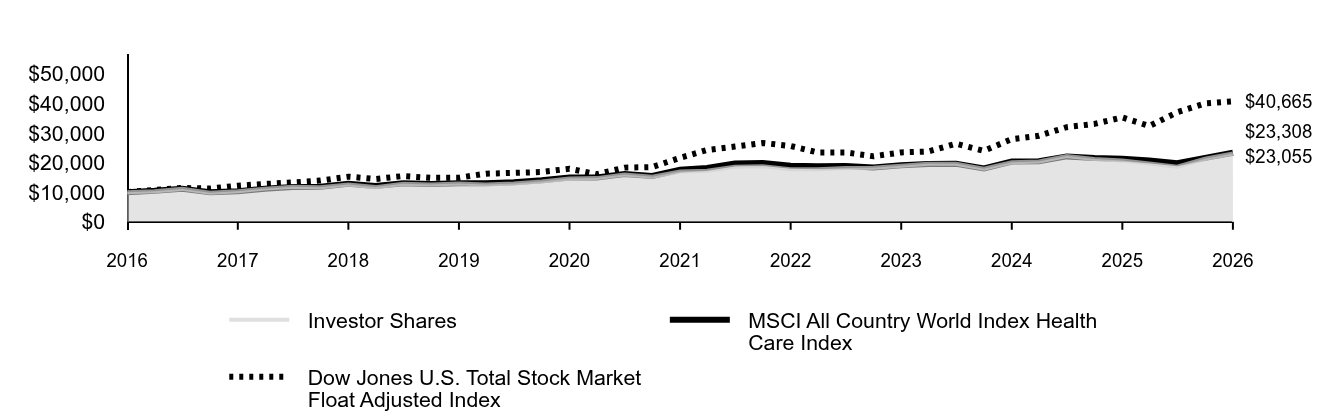 Table Summary | Investor Shares | MSCI All Country World Index Health Care Index | Dow Jones U.S. Total Stock Market Float Adjusted Index |
|---|
2016 | $10,000 | $10,000 | $10,000 |
|---|
2016 | $10,275 | $10,448 | $10,765 |
|---|
2016 | $11,100 | $11,160 | $11,417 |
|---|
2016 | $9,814 | $9,964 | $11,215 |
|---|
2017 | $10,271 | $10,327 | $12,172 |
|---|
2017 | $11,188 | $11,153 | $12,764 |
|---|
2017 | $11,848 | $11,711 | $13,258 |
|---|
2017 | $11,688 | $11,855 | $13,901 |
|---|
2018 | $12,560 | $12,832 | $15,235 |
|---|
2018 | $11,698 | $12,117 | $14,431 |
|---|
2018 | $12,837 | $13,029 | $15,436 |
|---|
2018 | $12,557 | $12,736 | $14,813 |
|---|
2019 | $12,906 | $12,983 | $14,881 |
|---|
2019 | $12,559 | $13,010 | $16,247 |
|---|
2019 | $12,949 | $13,354 | $16,502 |
|---|
2019 | $13,585 | $14,009 | $16,797 |
|---|
2020 | $14,604 | $14,931 | $17,913 |
|---|
2020 | $14,737 | $14,982 | $16,055 |
|---|
2020 | $15,939 | $16,136 | $18,284 |
|---|
2020 | $15,228 | $15,443 | $18,475 |
|---|
2021 | $16,964 | $17,580 | $21,593 |
|---|
2021 | $17,266 | $18,172 | $24,245 |
|---|
2021 | $18,605 | $19,678 | $25,402 |
|---|
2021 | $18,769 | $19,855 | $26,617 |
|---|
2022 | $17,724 | $18,891 | $25,587 |
|---|
2022 | $17,698 | $18,733 | $23,429 |
|---|
2022 | $18,181 | $18,824 | $23,425 |
|---|
2022 | $18,230 | $18,345 | $22,107 |
|---|
2023 | $18,889 | $19,104 | $23,433 |
|---|
2023 | $19,592 | $19,517 | $23,728 |
|---|
2023 | $19,611 | $19,566 | $26,381 |
|---|
2023 | $17,927 | $18,023 | $23,963 |
|---|
2024 | $20,102 | $20,334 | $27,919 |
|---|
2024 | $20,362 | $20,449 | $29,048 |
|---|
2024 | $22,230 | $22,078 | $31,949 |
|---|
2024 | $21,175 | $21,562 | $33,068 |
|---|
2025 | $20,697 | $21,322 | $35,256 |
|---|
2025 | $19,700 | $20,718 | $32,317 |
|---|
2025 | $18,570 | $19,800 | $36,974 |
|---|
2025 | $21,286 | $21,574 | $39,980 |
|---|
2026 | $23,055 | $23,308 | $40,665 |
|---|
|
|
| Average Annual Return [Table Text Block] |
Table Summary | 1 Year | 5 Years | 10 Years |
|---|
Investor Shares | 11.39% | 6.33% | 8.71% |
|---|
MSCI All Country World Index Health Care Index | 9.31% | 5.80% | 8.83% |
|---|
Dow Jones U.S. Total Stock Market Float Adjusted Index | 15.34% | 13.50% | 15.06% |
|---|
|
|
| No Deduction of Taxes [Text Block] |
The graph and returns shown do not reflect taxes that a shareholder would pay on fund distributions or on the sale of fund shares.
|
|
| Material Change Date |
|
Jan. 31, 2025
|
| Updated Performance Information Location [Text Block] |
Updated performance information is available on our website at vanguard.com/performance or by calling Vanguard toll-free at 800-662-7447.
|
|
| AssetsNet |
$ 39,264,000,000
|
|
| Holdings Count | Holding |
101
|
|
| Advisory Fees Paid, Amount |
$ 52,431,000
|
|
| InvestmentCompanyPortfolioTurnover |
47.00%
|
|
| Additional Fund Statistics [Text Block] |
Fund Statistics
(as of January 31, 2026)Table SummaryFund Net Assets (in millions) | $39,264 |
|---|
Number of Portfolio Holdings | 101 |
|---|
Portfolio Turnover Rate | 47% |
|---|
Total Investment Advisory Fees (in thousands) | $52,431 |
|---|
|
|
| Holdings [Text Block] |
Portfolio Composition % of Net Assets
(as of January 31, 2026)Table SummaryAsia | 6.0% |
|---|
Europe | 20.0% |
|---|
North America | 71.5% |
|---|
Other Assets and Liabilities—Net | 2.5% |
|---|
This table reflects the Fund's investments, including short-term investments and other assets and liabilities. |
|
| Material Fund Change [Text Block] |
How has the Fund changed?Effective January 12, 2026, The Vanguard Group, Inc. exercises portfolio management responsibilities through its wholly-owned subsidiaries, Vanguard Capital Management, LLC and Vanguard Portfolio Management, LLC. This is a summary of certain changes to the Fund since January 31, 2025. For more complete information, you may review the Fund’s next prospectus, which we expect to be available by May 31, 2026, at https://personal1.vanguard.com/ngf-next-gen-form-webapp/fund-literature or upon request at 800-662-7447. |
|
| Material Fund Change Adviser [Text Block] |
Effective January 12, 2026, The Vanguard Group, Inc. exercises portfolio management responsibilities through its wholly-owned subsidiaries, Vanguard Capital Management, LLC and Vanguard Portfolio Management, LLC.
|
|
| Summary of Change Legend [Text Block] |
This is a summary of certain changes to the Fund since January 31, 2025. For more complete information, you may review the Fund’s next prospectus, which we expect to be available by May 31, 2026, at https://personal1.vanguard.com/ngf-next-gen-form-webapp/fund-literature or upon request at 800-662-7447.
|
|
| Updated Prospectus Phone Number |
800-662-7447
|
|
| Updated Prospectus Web Address |
https://personal1.vanguard.com/ngf-next-gen-form-webapp/fund-literature
|
|
| C000008008 |
|
|
| Shareholder Report [Line Items] |
|
|
| Fund Name |
Health Care Fund
|
|
| Class Name |
Admiral™ Shares
|
|
| Trading Symbol |
VGHAX
|
|
| Annual or Semi-Annual Statement [Text Block] |
This annual shareholder report contains important information about Vanguard Health Care Fund (the "Fund") for the period of February 1, 2025, to January 31, 2026.
|
|
| Additional Information [Text Block] |
You can find additional information about the Fund at https://personal1.vanguard.com/ngf-next-gen-form-webapp/fund-literature. You can also request this information by contacting us at 800-662-7447.
|
|
| Material Fund Change Notice [Text Block] |
The report describes changes to the Fund that occurred during the reporting period.
|
|
| Additional Information Phone Number |
<span style="white-space: nowrap; box-sizing: border-box; color: rgb(0, 0, 0); display: inline; flex-wrap: nowrap; font-size: 10.6667px; font-weight: 400; grid-area: auto; line-height: 16px; margin: 0px; overflow: visible; text-align: left; text-align-last: auto;"> 800-662-7447</span>
|
|
| Additional Information Website |
<span style="white-space: nowrap; box-sizing: border-box; color: rgb(0, 0, 0); display: inline; flex-wrap: nowrap; font-size: 10.6667px; font-weight: 400; grid-area: auto; line-height: 16px; margin: 0px; overflow: visible; text-align: left; text-align-last: auto;"><span style="box-sizing: border-box; color: rgb(0, 0, 0); display: inline; flex-wrap: nowrap; font-size: 10.6667px; font-weight: 400; grid-area: auto; line-height: 16px; margin: 0px; overflow: visible; text-align: left; text-align-last: auto; white-space-collapse: collapse;"><span style="text-decoration: underline; box-sizing: border-box; color: rgb(0, 0, 0); display: inline; flex-wrap: nowrap; font-size: 10.6667px; font-weight: 400; grid-area: auto; line-height: 16px; margin: 0px; overflow: visible; text-align: left; text-align-last: auto; white-space-collapse: collapse;">https://personal1.vanguard.com/ngf-next-gen-form-webapp/fund-literature</span></span></span>
|
|
| Expenses [Text Block] |
What were the Fund costs for the last year?(based on a hypothetical $10,000 investment) Table SummaryShare Class Name | Costs of a $10,000 investment | Costs paid as a percentage of a $10,000 investment |
|---|
Admiral Shares | $29 | 0.27% |
|---|
|
|
| Expenses Paid, Amount |
$ 29
|
|
| Expense Ratio, Percent |
0.27%
|
|
| Factors Affecting Performance [Text Block] |
How did the Fund perform during the reporting period? For the 12 months ended January 31, 2026, the Fund outperformed its benchmark. The first part of the period was marked by volatility in the financial markets amid fears that U.S. tariff announcements might spark trade wars and drag down global growth. Despite these concerns, markets posted solid gains for the 12 months, buoyed by optimism surrounding artificial intelligence, robust corporate earnings, and a more dovish monetary policy. The European Central Bank and the Federal Reserve each cut interest rates three times, while the Bank of England lowered rates four times. Eight of the Fund’s 10 subsectors outperformed those of its benchmark. Health care equipment and biotechnology contributed the most to relative performance because of differences in allocation weights and stock selection. Stock selection in pharmaceuticals was also a top contributor. The largest detractors were stock selection in health care facilities and an overweight allocation to the poorly performing managed health care subsector.
|
|
| Performance Past Does Not Indicate Future [Text] |
Keep in mind that the Fund's past performance does not indicate how the Fund will perform in the future.
|
|
| Line Graph [Table Text Block] |
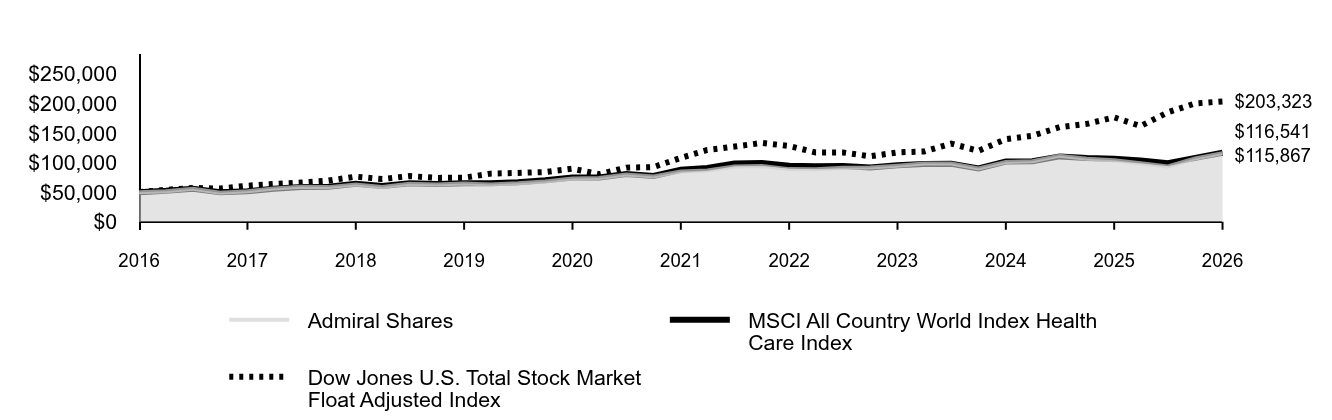 Table Summary | Admiral Shares | MSCI All Country World Index Health Care Index | Dow Jones U.S. Total Stock Market Float Adjusted Index |
|---|
2016 | $50,000 | $50,000 | $50,000 |
|---|
2016 | $51,383 | $52,240 | $53,827 |
|---|
2016 | $55,513 | $55,798 | $57,084 |
|---|
2016 | $49,088 | $49,819 | $56,073 |
|---|
2017 | $51,382 | $51,634 | $60,862 |
|---|
2017 | $55,976 | $55,765 | $63,818 |
|---|
2017 | $59,287 | $58,557 | $66,290 |
|---|
2017 | $58,489 | $59,275 | $69,507 |
|---|
2018 | $62,864 | $64,158 | $76,175 |
|---|
2018 | $58,557 | $60,585 | $72,156 |
|---|
2018 | $64,270 | $65,144 | $77,182 |
|---|
2018 | $62,876 | $63,679 | $74,067 |
|---|
2019 | $64,628 | $64,915 | $74,404 |
|---|
2019 | $62,894 | $65,049 | $81,235 |
|---|
2019 | $64,856 | $66,769 | $82,511 |
|---|
2019 | $68,054 | $70,045 | $83,987 |
|---|
2020 | $73,169 | $74,657 | $89,564 |
|---|
2020 | $73,846 | $74,911 | $80,274 |
|---|
2020 | $79,875 | $80,682 | $91,422 |
|---|
2020 | $76,324 | $77,217 | $92,375 |
|---|
2021 | $85,030 | $87,901 | $107,965 |
|---|
2021 | $86,560 | $90,861 | $121,223 |
|---|
2021 | $93,278 | $98,391 | $127,008 |
|---|
2021 | $94,112 | $99,276 | $133,086 |
|---|
2022 | $88,883 | $94,455 | $127,935 |
|---|
2022 | $88,772 | $93,666 | $117,147 |
|---|
2022 | $91,200 | $94,120 | $117,125 |
|---|
2022 | $91,459 | $91,723 | $110,536 |
|---|
2023 | $94,775 | $95,522 | $117,165 |
|---|
2023 | $98,318 | $97,583 | $118,641 |
|---|
2023 | $98,427 | $97,832 | $131,906 |
|---|
2023 | $89,980 | $90,116 | $119,815 |
|---|
2024 | $100,920 | $101,669 | $139,596 |
|---|
2024 | $102,235 | $102,247 | $145,242 |
|---|
2024 | $111,623 | $110,388 | $159,745 |
|---|
2024 | $106,339 | $107,809 | $165,337 |
|---|
2025 | $103,955 | $106,612 | $176,278 |
|---|
2025 | $98,961 | $103,589 | $161,587 |
|---|
2025 | $93,297 | $99,001 | $184,871 |
|---|
2025 | $106,965 | $107,869 | $199,899 |
|---|
2026 | $115,867 | $116,541 | $203,323 |
|---|
|
|
| Average Annual Return [Table Text Block] |
Table Summary | 1 Year | 5 Years | 10 Years |
|---|
Admiral Shares | 11.46% | 6.38% | 8.77% |
|---|
MSCI All Country World Index Health Care Index | 9.31% | 5.80% | 8.83% |
|---|
Dow Jones U.S. Total Stock Market Float Adjusted Index | 15.34% | 13.50% | 15.06% |
|---|
|
|
| No Deduction of Taxes [Text Block] |
The graph and returns shown do not reflect taxes that a shareholder would pay on fund distributions or on the sale of fund shares.
|
|
| Material Change Date |
|
Jan. 31, 2025
|
| Updated Performance Information Location [Text Block] |
Updated performance information is available on our website at vanguard.com/performance or by calling Vanguard toll-free at 800-662-7447.
|
|
| AssetsNet |
$ 39,264,000,000
|
|
| Holdings Count | Holding |
101
|
|
| Advisory Fees Paid, Amount |
$ 52,431,000
|
|
| InvestmentCompanyPortfolioTurnover |
47.00%
|
|
| Additional Fund Statistics [Text Block] |
Fund Statistics
(as of January 31, 2026)Table SummaryFund Net Assets (in millions) | $39,264 |
|---|
Number of Portfolio Holdings | 101 |
|---|
Portfolio Turnover Rate | 47% |
|---|
Total Investment Advisory Fees (in thousands) | $52,431 |
|---|
|
|
| Holdings [Text Block] |
Portfolio Composition % of Net Assets
(as of January 31, 2026)Table SummaryAsia | 6.0% |
|---|
Europe | 20.0% |
|---|
North America | 71.5% |
|---|
Other Assets and Liabilities—Net | 2.5% |
|---|
This table reflects the Fund's investments, including short-term investments and other assets and liabilities. |
|
| Material Fund Change [Text Block] |
How has the Fund changed?Effective January 12, 2026, The Vanguard Group, Inc. exercises portfolio management responsibilities through its wholly-owned subsidiaries, Vanguard Capital Management, LLC and Vanguard Portfolio Management, LLC. This is a summary of certain changes to the Fund since January 31, 2025. For more complete information, you may review the Fund’s next prospectus, which we expect to be available by May 31, 2026, at https://personal1.vanguard.com/ngf-next-gen-form-webapp/fund-literature or upon request at 800-662-7447. |
|
| Material Fund Change Adviser [Text Block] |
Effective January 12, 2026, The Vanguard Group, Inc. exercises portfolio management responsibilities through its wholly-owned subsidiaries, Vanguard Capital Management, LLC and Vanguard Portfolio Management, LLC.
|
|
| Summary of Change Legend [Text Block] |
This is a summary of certain changes to the Fund since January 31, 2025. For more complete information, you may review the Fund’s next prospectus, which we expect to be available by May 31, 2026, at https://personal1.vanguard.com/ngf-next-gen-form-webapp/fund-literature or upon request at 800-662-7447.
|
|
| Updated Prospectus Phone Number |
800-662-7447
|
|
| Updated Prospectus Web Address |
https://personal1.vanguard.com/ngf-next-gen-form-webapp/fund-literature
|
|
| C000031350 |
|
|
| Shareholder Report [Line Items] |
|
|
| Fund Name |
Dividend Appreciation Index Fund
|
|
| Class Name |
ETF Shares
|
|
| Trading Symbol |
VIG
|
|
| Security Exchange Name |
NYSEArca
|
|
| Annual or Semi-Annual Statement [Text Block] |
This annual shareholder report contains important information about Vanguard Dividend Appreciation Index Fund (the "Fund") for the period of February 1, 2025, to January 31, 2026.
|
|
| Additional Information [Text Block] |
You can find additional information about the Fund at https://personal1.vanguard.com/ngf-next-gen-form-webapp/fund-literature. You can also request this information by contacting us at 800-662-7447.
|
|
| Material Fund Change Notice [Text Block] |
The report describes changes to the Fund that occurred during the reporting period.
|
|
| Additional Information Phone Number |
<span style="white-space: nowrap; box-sizing: border-box; color: rgb(0, 0, 0); display: inline; flex-wrap: nowrap; font-size: 10.6667px; font-weight: 400; grid-area: auto; line-height: 16px; margin: 0px; overflow: visible; text-align: left; text-align-last: auto;"> 800-662-7447</span>
|
|
| Additional Information Website |
<span style="white-space: nowrap; box-sizing: border-box; color: rgb(0, 0, 0); display: inline; flex-wrap: nowrap; font-size: 10.6667px; font-weight: 400; grid-area: auto; line-height: 16px; margin: 0px; overflow: visible; text-align: left; text-align-last: auto;"><span style="box-sizing: border-box; color: rgb(0, 0, 0); display: inline; flex-wrap: nowrap; font-size: 10.6667px; font-weight: 400; grid-area: auto; line-height: 16px; margin: 0px; overflow: visible; text-align: left; text-align-last: auto; white-space-collapse: collapse;"><span style="text-decoration: underline; box-sizing: border-box; color: rgb(0, 0, 0); display: inline; flex-wrap: nowrap; font-size: 10.6667px; font-weight: 400; grid-area: auto; line-height: 16px; margin: 0px; overflow: visible; text-align: left; text-align-last: auto; white-space-collapse: collapse;">https://personal1.vanguard.com/ngf-next-gen-form-webapp/fund-literature</span></span></span>
|
|
| Expenses [Text Block] |
What were the Fund costs for the last year?(based on a hypothetical $10,000 investment) Table SummaryShare Class Name | Costs of a $10,000 investment | Costs paid as a percentage of a $10,000 investment |
|---|
ETF Shares | $5 | 0.05% |
|---|
|
|
| Expenses Paid, Amount |
$ 5
|
|
| Expense Ratio, Percent |
0.05%
|
|
| Factors Affecting Performance [Text Block] |
How did the Fund perform during the reporting period? For the 12 months ended January 31, 2026, the Fund performed in line with its benchmark. The first part of the period was marked by volatility in the financial markets amid fears that U.S. tariff announcements might spark trade wars and drag down global growth. Despite these concerns, markets posted solid gains for the 12 months, buoyed by optimism surrounding artificial intelligence, robust corporate earnings, and a more dovish monetary policy. The European Central Bank and the Federal Reserve each cut interest rates three times, while the Bank of England lowered rates four times. Eight of 10 industry sectors contributed positively to the benchmark’s return, reflecting broad-based strength. Information technology and financials contributed the most, while industrials, health care, energy, and consumer staples also added meaningful support. Consumer discretionary and communication services modestly detracted.
|
|
| Performance Past Does Not Indicate Future [Text] |
Keep in mind that the Fund's past performance does not indicate how the Fund will perform in the future.
|
|
| Line Graph [Table Text Block] |
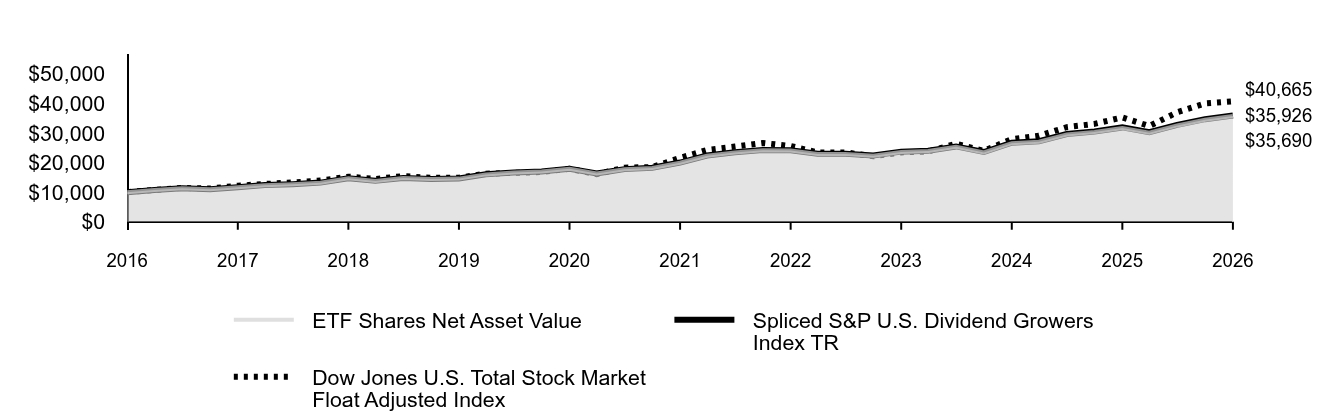 Table Summary | ETF Shares Net Asset Value | Spliced S&P U.S. Dividend Growers Index TR | Dow Jones U.S. Total Stock Market Float Adjusted Index |
|---|
2016 | $10,000 | $10,000 | $10,000 |
|---|
2016 | $10,718 | $10,722 | $10,765 |
|---|
2016 | $11,328 | $11,335 | $11,417 |
|---|
2016 | $10,998 | $11,005 | $11,215 |
|---|
2017 | $11,659 | $11,667 | $12,172 |
|---|
2017 | $12,366 | $12,376 | $12,764 |
|---|
2017 | $12,690 | $12,702 | $13,258 |
|---|
2017 | $13,212 | $13,227 | $13,901 |
|---|
2018 | $14,702 | $14,723 | $15,235 |
|---|
2018 | $13,795 | $13,816 | $14,431 |
|---|
2018 | $14,742 | $14,765 | $15,436 |
|---|
2018 | $14,429 | $14,454 | $14,813 |
|---|
2019 | $14,574 | $14,600 | $14,881 |
|---|
2019 | $16,001 | $16,030 | $16,247 |
|---|
2019 | $16,630 | $16,662 | $16,502 |
|---|
2019 | $16,973 | $17,008 | $16,797 |
|---|
2020 | $17,880 | $17,918 | $17,913 |
|---|
2020 | $16,279 | $16,317 | $16,055 |
|---|
2020 | $17,717 | $17,776 | $18,284 |
|---|
2020 | $18,175 | $18,238 | $18,475 |
|---|
2021 | $19,924 | $19,995 | $21,593 |
|---|
2021 | $22,301 | $22,384 | $24,245 |
|---|
2021 | $23,388 | $23,479 | $25,402 |
|---|
2021 | $24,173 | $24,267 | $26,617 |
|---|
2022 | $24,050 | $24,149 | $25,587 |
|---|
2022 | $22,858 | $22,956 | $23,429 |
|---|
2022 | $22,856 | $22,959 | $23,425 |
|---|
2022 | $22,274 | $22,381 | $22,107 |
|---|
2023 | $23,563 | $23,681 | $23,433 |
|---|
2023 | $23,877 | $24,001 | $23,728 |
|---|
2023 | $25,314 | $25,447 | $26,381 |
|---|
2023 | $23,428 | $23,554 | $23,963 |
|---|
2024 | $26,546 | $26,694 | $27,919 |
|---|
2024 | $27,051 | $27,204 | $29,048 |
|---|
2024 | $29,478 | $29,648 | $31,949 |
|---|
2024 | $30,335 | $30,515 | $33,068 |
|---|
2025 | $31,679 | $31,871 | $35,256 |
|---|
2025 | $30,072 | $30,261 | $32,317 |
|---|
2025 | $32,544 | $32,750 | $36,974 |
|---|
2025 | $34,432 | $34,654 | $39,980 |
|---|
2026 | $35,690 | $35,926 | $40,665 |
|---|
|
|
| Average Annual Return [Table Text Block] |
Table Summary | 1 Year | 5 Years | 10 Years |
|---|
ETF Shares Net Asset Value | 12.66% | 12.37% | 13.57% |
|---|
ETF Shares Market Price | 12.69% | 12.38% | 13.57% |
|---|
Spliced S&P U.S. Dividend Growers Index TR | 12.72% | 12.43% | 13.64% |
|---|
Dow Jones U.S. Total Stock Market Float Adjusted Index | 15.34% | 13.50% | 15.06% |
|---|
|
|
| No Deduction of Taxes [Text Block] |
The graph and returns shown do not reflect taxes that a shareholder would pay on fund distributions or on the sale of fund shares.
|
|
| Material Change Date |
|
Jan. 31, 2025
|
| Updated Performance Information Location [Text Block] |
Updated performance information is available on our website at vanguard.com/performance or by calling Vanguard toll-free at 800-662-7447.
|
|
| AssetsNet |
$ 121,514,000,000
|
|
| Holdings Count | Holding |
347
|
|
| Advisory Fees Paid, Amount |
$ 2,256,000
|
|
| InvestmentCompanyPortfolioTurnover |
8.00%
|
|
| Additional Fund Statistics [Text Block] |
Fund Statistics
(as of January 31, 2026)Table SummaryFund Net Assets (in millions) | $121,514 |
|---|
Number of Portfolio Holdings | 347 |
|---|
Portfolio Turnover Rate | 8% |
|---|
Total Investment Advisory Fees (in thousands) | $2,256 |
|---|
|
|
| Holdings [Text Block] |
Portfolio Composition % of Net Assets
(as of January 31, 2026)Table SummaryCommunication Services | 0.5% |
|---|
Consumer Discretionary | 5.0% |
|---|
Consumer Staples | 10.0% |
|---|
Energy | 3.1% |
|---|
Financials | 21.1% |
|---|
Health Care | 16.3% |
|---|
Industrials | 11.6% |
|---|
Information Technology | 25.9% |
|---|
Materials | 3.2% |
|---|
Utilities | 2.7% |
|---|
Other Assets and Liabilities—Net | 0.6% |
|---|
This table reflects the Fund's investments, including short-term investments, derivatives and other assets and liabilities. |
|
| Material Fund Change [Text Block] |
How has the Fund changed?The Fund's principal investment strategy disclosure was modified to add that the Fund may become nondiversified, as defined under the Investment Company Act of 1940, solely as a result of an index rebalance or market movement. The Fund added nondiversification risk and index concentration risk as principal risks. During the reporting period, the expense ratio for the ETF Share class was reduced. Subsequent to the Fund's fiscal year end, the expense ratio for the ETF Share class was further reduced. Effective January 12, 2026, The Vanguard Group, Inc. exercises portfolio management responsibilities for the fund through its wholly-owned subsidiary, Vanguard Portfolio Management, LLC. This is a summary of certain changes to the Fund since January 31, 2025. For more complete information, you may review the Fund’s next prospectus, which we expect to be available by May 31, 2026, at https://personal1.vanguard.com/ngf-next-gen-form-webapp/fund-literature or upon request at 800-662-7447. |
|
| Material Fund Change Expenses [Text Block] |
During the reporting period, the expense ratio for the ETF Share class was reduced. Subsequent to the Fund's fiscal year end, the expense ratio for the ETF Share class was further reduced.
|
|
| Material Fund Change Strategies [Text Block] |
The Fund's principal investment strategy disclosure was modified to add that the Fund may become nondiversified, as defined under the Investment Company Act of 1940, solely as a result of an index rebalance or market movement. The Fund added nondiversification risk and index concentration risk as principal risks.
|
|
| Material Fund Change Adviser [Text Block] |
Effective January 12, 2026, The Vanguard Group, Inc. exercises portfolio management responsibilities for the fund through its wholly-owned subsidiary, Vanguard Portfolio Management, LLC.
|
|
| Summary of Change Legend [Text Block] |
This is a summary of certain changes to the Fund since January 31, 2025. For more complete information, you may review the Fund’s next prospectus, which we expect to be available by May 31, 2026, at https://personal1.vanguard.com/ngf-next-gen-form-webapp/fund-literature or upon request at 800-662-7447.
|
|
| Updated Prospectus Phone Number |
800-662-7447
|
|
| Updated Prospectus Web Address |
https://personal1.vanguard.com/ngf-next-gen-form-webapp/fund-literature
|
|
| C000135474 |
|
|
| Shareholder Report [Line Items] |
|
|
| Fund Name |
Dividend Appreciation Index Fund
|
|
| Class Name |
Admiral™ Shares
|
|
| Trading Symbol |
VDADX
|
|
| Annual or Semi-Annual Statement [Text Block] |
This annual shareholder report contains important information about Vanguard Dividend Appreciation Index Fund (the "Fund") for the period of February 1, 2025, to January 31, 2026.
|
|
| Additional Information [Text Block] |
You can find additional information about the Fund at https://personal1.vanguard.com/ngf-next-gen-form-webapp/fund-literature. You can also request this information by contacting us at 800-662-7447.
|
|
| Material Fund Change Notice [Text Block] |
The report describes changes to the Fund that occurred during the reporting period.
|
|
| Additional Information Phone Number |
<span style="white-space: nowrap; box-sizing: border-box; color: rgb(0, 0, 0); display: inline; flex-wrap: nowrap; font-size: 10.6667px; font-weight: 400; grid-area: auto; line-height: 16px; margin: 0px; overflow: visible; text-align: left; text-align-last: auto;"> 800-662-7447</span>
|
|
| Additional Information Website |
<span style="white-space: nowrap; box-sizing: border-box; color: rgb(0, 0, 0); display: inline; flex-wrap: nowrap; font-size: 10.6667px; font-weight: 400; grid-area: auto; line-height: 16px; margin: 0px; overflow: visible; text-align: left; text-align-last: auto;"><span style="box-sizing: border-box; color: rgb(0, 0, 0); display: inline; flex-wrap: nowrap; font-size: 10.6667px; font-weight: 400; grid-area: auto; line-height: 16px; margin: 0px; overflow: visible; text-align: left; text-align-last: auto; white-space-collapse: collapse;"><span style="text-decoration: underline; box-sizing: border-box; color: rgb(0, 0, 0); display: inline; flex-wrap: nowrap; font-size: 10.6667px; font-weight: 400; grid-area: auto; line-height: 16px; margin: 0px; overflow: visible; text-align: left; text-align-last: auto; white-space-collapse: collapse;">https://personal1.vanguard.com/ngf-next-gen-form-webapp/fund-literature</span></span></span>
|
|
| Expenses [Text Block] |
What were the Fund costs for the last year?(based on a hypothetical $10,000 investment) Table SummaryShare Class Name | Costs of a $10,000 investment | Costs paid as a percentage of a $10,000 investment |
|---|
Admiral Shares | $7 | 0.07% |
|---|
|
|
| Expenses Paid, Amount |
$ 7
|
|
| Expense Ratio, Percent |
0.07%
|
|
| Factors Affecting Performance [Text Block] |
How did the Fund perform during the reporting period? For the 12 months ended January 31, 2026, the Fund performed in line with its benchmark. The first part of the period was marked by volatility in the financial markets amid fears that U.S. tariff announcements might spark trade wars and drag down global growth. Despite these concerns, markets posted solid gains for the 12 months, buoyed by optimism surrounding artificial intelligence, robust corporate earnings, and a more dovish monetary policy. The European Central Bank and the Federal Reserve each cut interest rates three times, while the Bank of England lowered rates four times. Eight of 10 industry sectors contributed positively to the benchmark’s return, reflecting broad-based strength. Information technology and financials contributed the most, while industrials, health care, energy, and consumer staples also added meaningful support. Consumer discretionary and communication services modestly detracted.
|
|
| Performance Past Does Not Indicate Future [Text] |
Keep in mind that the Fund's past performance does not indicate how the Fund will perform in the future.
|
|
| Line Graph [Table Text Block] |
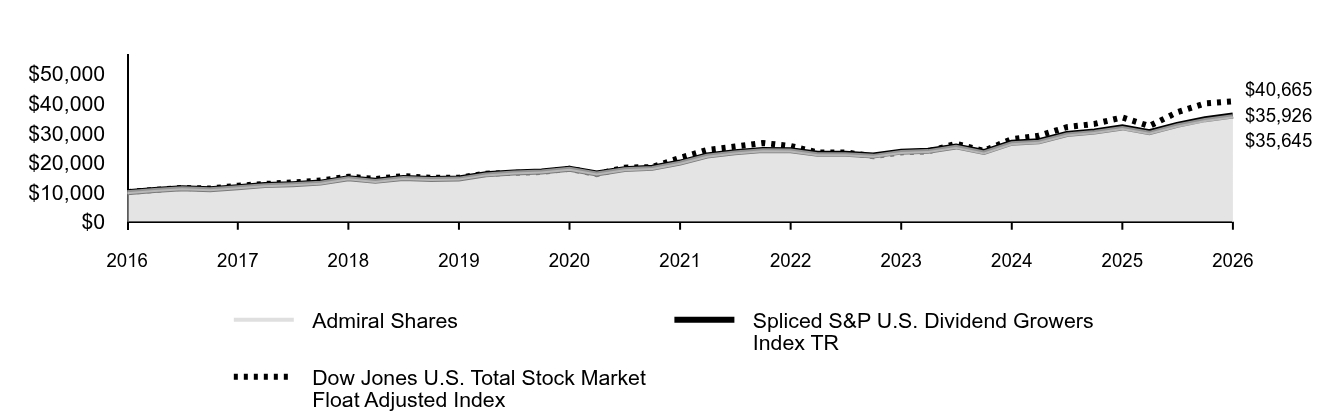 Table Summary | Admiral Shares | Spliced S&P U.S. Dividend Growers Index TR | Dow Jones U.S. Total Stock Market Float Adjusted Index |
|---|
2016 | $10,000 | $10,000 | $10,000 |
|---|
2016 | $10,718 | $10,722 | $10,765 |
|---|
2016 | $11,326 | $11,335 | $11,417 |
|---|
2016 | $10,994 | $11,005 | $11,215 |
|---|
2017 | $11,658 | $11,667 | $12,172 |
|---|
2017 | $12,366 | $12,376 | $12,764 |
|---|
2017 | $12,689 | $12,702 | $13,258 |
|---|
2017 | $13,210 | $13,227 | $13,901 |
|---|
2018 | $14,702 | $14,723 | $15,235 |
|---|
2018 | $13,796 | $13,816 | $14,431 |
|---|
2018 | $14,742 | $14,765 | $15,436 |
|---|
2018 | $14,428 | $14,454 | $14,813 |
|---|
2019 | $14,571 | $14,600 | $14,881 |
|---|
2019 | $15,995 | $16,030 | $16,247 |
|---|
2019 | $16,623 | $16,662 | $16,502 |
|---|
2019 | $16,966 | $17,008 | $16,797 |
|---|
2020 | $17,872 | $17,918 | $17,913 |
|---|
2020 | $16,273 | $16,317 | $16,055 |
|---|
2020 | $17,711 | $17,776 | $18,284 |
|---|
2020 | $18,165 | $18,238 | $18,475 |
|---|
2021 | $19,915 | $19,995 | $21,593 |
|---|
2021 | $22,290 | $22,384 | $24,245 |
|---|
2021 | $23,376 | $23,479 | $25,402 |
|---|
2021 | $24,156 | $24,267 | $26,617 |
|---|
2022 | $24,033 | $24,149 | $25,587 |
|---|
2022 | $22,840 | $22,956 | $23,429 |
|---|
2022 | $22,838 | $22,959 | $23,425 |
|---|
2022 | $22,259 | $22,381 | $22,107 |
|---|
2023 | $23,547 | $23,681 | $23,433 |
|---|
2023 | $23,860 | $24,001 | $23,728 |
|---|
2023 | $25,292 | $25,447 | $26,381 |
|---|
2023 | $23,411 | $23,554 | $23,963 |
|---|
2024 | $26,523 | $26,694 | $27,919 |
|---|
2024 | $27,027 | $27,204 | $29,048 |
|---|
2024 | $29,451 | $29,648 | $31,949 |
|---|
2024 | $30,303 | $30,515 | $33,068 |
|---|
2025 | $31,647 | $31,871 | $35,256 |
|---|
2025 | $30,042 | $30,261 | $32,317 |
|---|
2025 | $32,507 | $32,750 | $36,974 |
|---|
2025 | $34,389 | $34,654 | $39,980 |
|---|
2026 | $35,645 | $35,926 | $40,665 |
|---|
|
|
| Average Annual Return [Table Text Block] |
Table Summary | 1 Year | 5 Years | 10 Years |
|---|
Admiral Shares | 12.63% | 12.35% | 13.55% |
|---|
Spliced S&P U.S. Dividend Growers Index TR | 12.72% | 12.43% | 13.64% |
|---|
Dow Jones U.S. Total Stock Market Float Adjusted Index | 15.34% | 13.50% | 15.06% |
|---|
|
|
| No Deduction of Taxes [Text Block] |
The graph and returns shown do not reflect taxes that a shareholder would pay on fund distributions or on the sale of fund shares.
|
|
| Material Change Date |
|
Jan. 31, 2025
|
| Updated Performance Information Location [Text Block] |
Updated performance information is available on our website at vanguard.com/performance or by calling Vanguard toll-free at 800-662-7447.
|
|
| AssetsNet |
$ 121,514,000,000
|
|
| Holdings Count | Holding |
347
|
|
| Advisory Fees Paid, Amount |
$ 2,256,000
|
|
| InvestmentCompanyPortfolioTurnover |
8.00%
|
|
| Additional Fund Statistics [Text Block] |
Fund Statistics
(as of January 31, 2026)Table SummaryFund Net Assets (in millions) | $121,514 |
|---|
Number of Portfolio Holdings | 347 |
|---|
Portfolio Turnover Rate | 8% |
|---|
Total Investment Advisory Fees (in thousands) | $2,256 |
|---|
|
|
| Holdings [Text Block] |
Portfolio Composition % of Net Assets
(as of January 31, 2026)Table SummaryCommunication Services | 0.5% |
|---|
Consumer Discretionary | 5.0% |
|---|
Consumer Staples | 10.0% |
|---|
Energy | 3.1% |
|---|
Financials | 21.1% |
|---|
Health Care | 16.3% |
|---|
Industrials | 11.6% |
|---|
Information Technology | 25.9% |
|---|
Materials | 3.2% |
|---|
Utilities | 2.7% |
|---|
Other Assets and Liabilities—Net | 0.6% |
|---|
This table reflects the Fund's investments, including short-term investments, derivatives and other assets and liabilities. |
|
| Material Fund Change [Text Block] |
How has the Fund changed?The Fund's principal investment strategy disclosure was modified to add that the Fund may become nondiversified, as defined under the Investment Company Act of 1940, solely as a result of an index rebalance or market movement. The Fund added nondiversification risk and index concentration risk as principal risks. During the reporting period, the expense ratio for the Admiral Share class was reduced. Effective January 12, 2026, The Vanguard Group, Inc. exercises portfolio management responsibilities for the fund through its wholly-owned subsidiary, Vanguard Portfolio Management, LLC. This is a summary of certain changes to the Fund since January 31, 2025. For more complete information, you may review the Fund’s next prospectus, which we expect to be available by May 31, 2026, at https://personal1.vanguard.com/ngf-next-gen-form-webapp/fund-literature or upon request at 800-662-7447. |
|
| Material Fund Change Expenses [Text Block] |
During the reporting period, the expense ratio for the Admiral Share class was reduced.
|
|
| Material Fund Change Strategies [Text Block] |
The Fund's principal investment strategy disclosure was modified to add that the Fund may become nondiversified, as defined under the Investment Company Act of 1940, solely as a result of an index rebalance or market movement. The Fund added nondiversification risk and index concentration risk as principal risks.
|
|
| Material Fund Change Adviser [Text Block] |
Effective January 12, 2026, The Vanguard Group, Inc. exercises portfolio management responsibilities for the fund through its wholly-owned subsidiary, Vanguard Portfolio Management, LLC.
|
|
| Summary of Change Legend [Text Block] |
This is a summary of certain changes to the Fund since January 31, 2025. For more complete information, you may review the Fund’s next prospectus, which we expect to be available by May 31, 2026, at https://personal1.vanguard.com/ngf-next-gen-form-webapp/fund-literature or upon request at 800-662-7447.
|
|
| Updated Prospectus Phone Number |
800-662-7447
|
|
| Updated Prospectus Web Address |
https://personal1.vanguard.com/ngf-next-gen-form-webapp/fund-literature
|
|