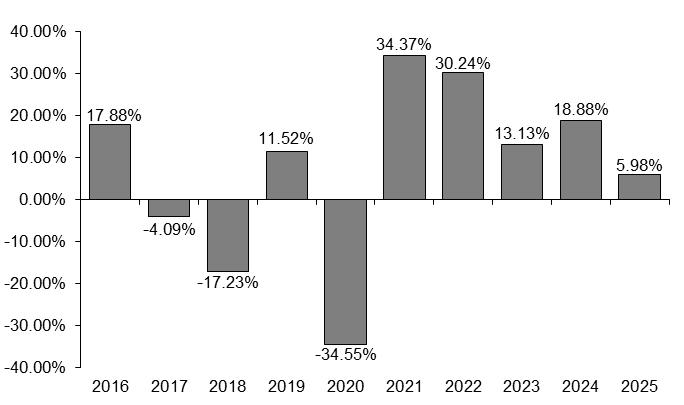
Performance Information: The bar chart and performance table below provide some indication of the risks of investing in the Energy Fund. The bar chart shows the Fund’s performance from calendar year to calendar year for the Fund’s Class A Shares. Sales loads and account fees are not reflected in the bar chart; if they were, returns would be less than those shown. The Fund’s performance table shows how the Fund’s average annual returns for 1 year, 5 years, and 10 years compare with those of a broad measure of market performance. The Fund’s past performance (before and after taxes) does not necessarily indicate how the Fund will perform in the future. Updated performance information, current through the most recent month end, is available by calling Ultimus Fund Solutions, LLC, the Fund’s transfer agent (the “Transfer Agent”), at 1-800-452-4892.
The performance information displayed in the bar chart is the performance of Class A Shares only, which will differ from Class C Shares and Institutional Shares to the extent the Classes do not have the same expenses and inception dates.
| Best Quarter | 28.12% | in the quarter ended June 30, 2020 |
| Worst Quarter | (51.55)% | in the quarter ended March 31, 2020 |
| 1 Year | 5 Years |
10 Years | ||||
| Spirit of America Energy Fund – Class A | ||||||
| Return Before Taxes | (0.12)% | 18.65% | 4.85% | |||
| Return After Taxes on Distributions(1)(2) | (1.10)% | 17.33% | 4.27% | |||
| Return After Taxes on Distributions and Sale of Fund Shares(1)(2) | 0.39% | 14.93% | 3.75% | |||
| Spirit of America Energy Fund – Class C | ||||||
| Return Before Taxes | 4.35% | 19.18% | N/A | |||
| Spirit of America Energy Fund – Institutional | ||||||
| Return Before Taxes | 6.21% | 20.35% | N/A | |||
| S&P 500® Index(3) | 17.88% | 14.42% | 14.82% |
| (1) | After-tax returns are calculated using the historical highest individual federal marginal income tax rates and do not reflect the impact of state and local taxes. |
| (2) | Actual after-tax returns depend on an investor’s tax situation and may differ from those shown. After-tax returns shown are not relevant to investors who hold their Fund shares through tax-deferred arrangements, such as 401(k) plans or individual retirement accounts. The Return After Taxes on Distributions and Sale of Fund Shares for a period may be greater than the Return After Taxes on Distributions for the same period if there was a loss realized on sale of Fund shares. The benefit of the tax loss (to the extent it can be used to offset other gains) may result in a higher return. |
| (3) | S&P 500® Index is an unmanaged capitalization-weighted index of 500 stocks designed to measure the performance of the broad domestic economy through changes in the aggregate market value of 500 stocks representing all major industries. The performance of an index assumes no transaction costs, taxes, management fees or other expenses. A direct investment in an index is not possible. |