Pay vs Performance Disclosure - USD ($)
Dec. 31, 2025
Dec. 31, 2024
Average summary compensation table total for non-PEO NEOs ($)(1)(2) | Value of initial fixed $100 investment based on: | |||||||||||||||||||||||||
| Year | Summary compensation table total for PEO ($)(1)(2) | Compensation actually paid to PEO ($)(1)(3) | Average compensation actually paid to non-PEO NEOs ($)(1)(3) | Company total shareholder return ($)(4) | Peer group total shareholder return ($)(5) | Net income ($ in millions)(6) | Constant currency revenue ($ in millions)(7) | |||||||||||||||||||
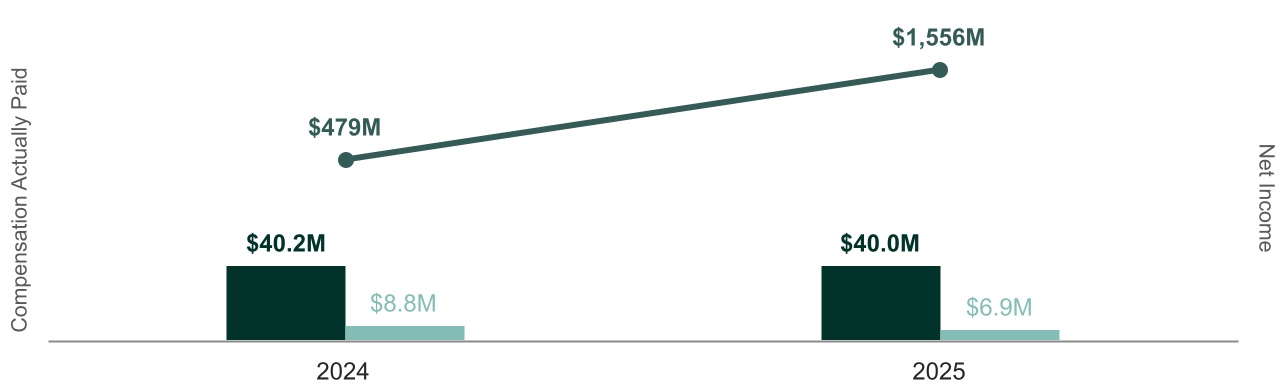
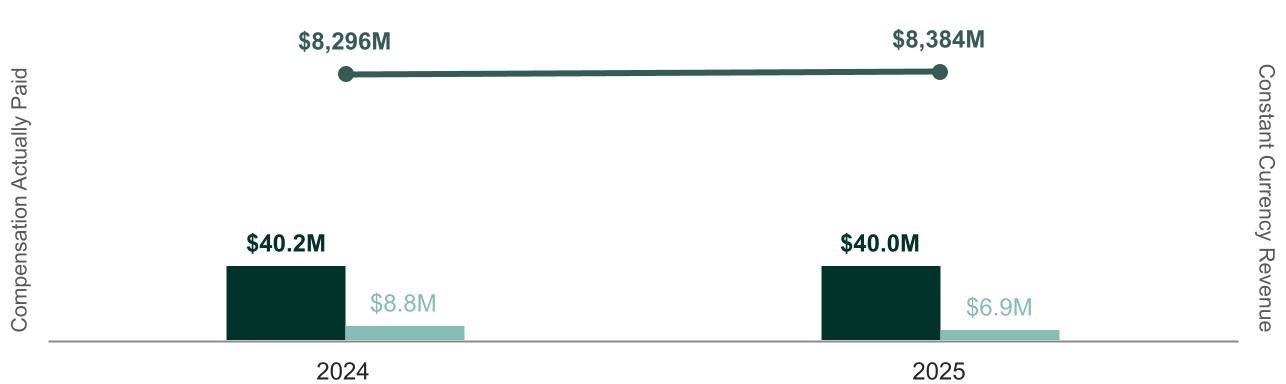
| 2025 | 20,139,981 | 40,020,576 | 5,074,897 | 6,948,350 | 114.67 | 108.95 | 1,556 | 8,384 | ||||||||||||||||||
| 2024 | 39,959,767 | 40,244,984 | 8,528,291 | 8,801,783 | 95.60 | 95.07 | 479 | 8,296 | ||||||||||||||||||
| Year | PEO | Non-PEO NEOs | ||||||
| 2025 | Bryan C. Hanson | Wayde D, McMillan, Heather Knight, Amy L. Landucci, Marcela A. Kirberger, Christopher Barry | ||||||
| 2024 | Bryan C. Hanson | Wayde D. McMillan, Christopher Barry, Tammy L. Gomez, Amy L. Landucci | ||||||
| Reconciliation of Summary Compensation Table Total to Compensation Actually Paid for PEO | Fiscal Year 2025 ($) | |||||||
| Summary Compensation Table Total | 20,139,981 | |||||||
(Minus): Grant Date Fair Value of Equity Awards Granted in the Fiscal Year | (15,209,022) | |||||||
Plus: Fair Value at Fiscal Year End of Outstanding and Unvested Equity Awards Granted in the Fiscal Year | 20,813,673 | |||||||
Plus/(Minus): Change in Fair Value from Prior Fiscal Year-End to This Fiscal Year-End of Outstanding and Unvested Equity Awards Granted in Prior Fiscal Years | 13,547,109 | |||||||
Plus: Fair Value at Vesting Date of Equity Awards Granted and Vested in the Fiscal Year | 0 | |||||||
Plus/(Minus): Change in Fair Value from Prior Fiscal Year-End to the Vesting Date of Equity Awards Granted in Prior Fiscal Years that Vested in the Fiscal Year | 728,835 | |||||||
(Minus): Fair Value as of the Prior Fiscal Year End of Equity Awards Granted in Prior Fiscal Years that Failed to Meet Vesting Conditions in the Fiscal Year | 0 | |||||||
Plus: Value of Dividends or Other Earnings Paid on Equity Awards Not Otherwise Reflected in Total Compensation | 0 | |||||||
| Compensation Actually Paid | 40,020,576 | |||||||
| Reconciliation of Average Compensation Table Total to Average Compensation Actually Paid for Non-PEO NEOs | Fiscal Year 2025 ($) | |||||||
| Summary Compensation Table Total | 5,074,897 | |||||||
(Minus): Grant Date Fair Value of Equity Awards Granted in the Fiscal Year | (3,359,643) | |||||||
Plus: Fair Value at Fiscal Year End of Outstanding and Unvested Equity Awards Granted in the Fiscal Year | 3,619,590 | |||||||
Plus/(Minus): Change in Fair Value from Prior Fiscal Year-End to This Fiscal Year-End of Outstanding and Unvested Equity Awards Granted in Prior Fiscal Years | 1,895,343 | |||||||
Plus: Fair Value at Vesting Date of Equity Awards Granted and Vested in the Fiscal Year | 0 | |||||||
Plus/(Minus): Change in Fair Value from Prior Fiscal Year-End to the Vesting Date of Equity Awards Granted in Prior Fiscal Years that Vested in the Fiscal Year | 223,853 | |||||||
(Minus): Fair Value as of the Prior Fiscal Year End of Equity Awards Granted in Prior Fiscal Years that Failed to Meet Vesting Conditions in the Fiscal Year | (505,689) | |||||||
Plus: Value of Dividends or Other Earnings Paid on Equity Awards Not Otherwise Reflected in Total Compensation | — | |||||||
| Compensation Actually Paid | 6,948,350 | |||||||
For purposes of the above adjustments, the fair value of equity awards are computed based on generally accepted accounting principles in a manner consistent with the fair value methodology used to account for share-based payments included in Note 16 to the Company’s audited financial statements for fiscal year ended December 31, 2025, included in the Company’s Annual Report on Form 10-K filed with the SEC on February 27, 2026.
Compensation actually paid vs. total shareholder return
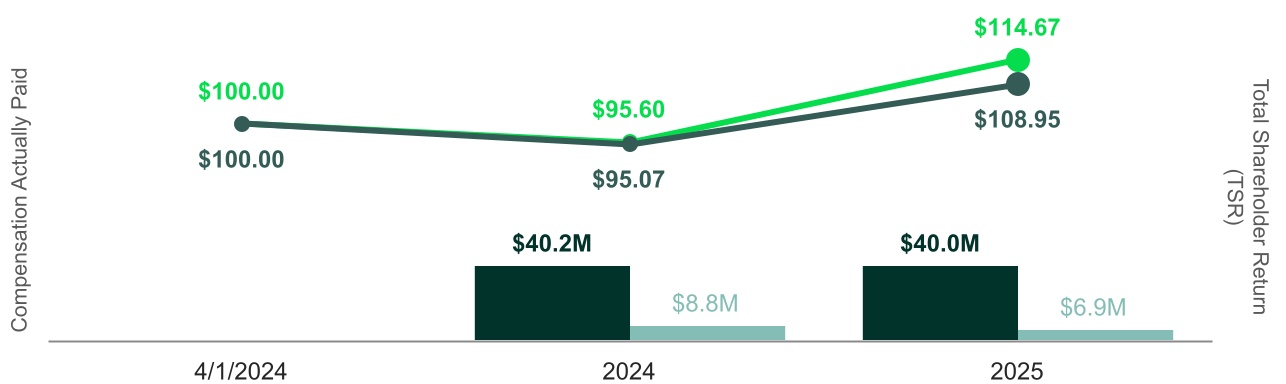
 | Compensation Actually Paid to PEO |  | Average Compensation Actually Paid to Other NEOs | ||||||||
 | Solventum TSR |  | Peer Group TSR | ||||||||
Compensation actually paid vs. net income
| | Compensation Actually Paid to PEO | | Average Compensation Actually Paid to Other NEOs | | Net Income | ||||||||||||
Compensation actually paid vs. constant currency revenue
| | Compensation Actually Paid to PEO | | Average Compensation Actually Paid to Other NEOs | ||||||||
| | Constant Currency Revenue | ||||||||||
Compensation actually paid vs. total shareholder return
| | Compensation Actually Paid to PEO | | Average Compensation Actually Paid to Other NEOs | ||||||||
| | Solventum TSR | | Peer Group TSR | ||||||||