Pay vs Performance Disclosure - USD ($)
Dec. 31, 2025
Dec. 31, 2024
Dec. 31, 2023
Dec. 31, 2022
Dec. 31, 2021
The following table sets forth information regarding the Company’s performance and the “compensation actually paid” to our named executive officers, as calculated in accordance with SEC disclosure rules:
Value of Initial Fixed $100 Investment Based on:(5) | ||||||||||||||||||||||||||
Year (1) | Summary Compensation Table Total for PEO(2) ($) | Compensation Actually Paid to PEO(3) ($) | Average Summary Compensation Table Total for Non-PEO Named Executive Officers(2) ($) | Average Compensation Actually Paid to Non-PEO Named Executive Officers(4) ($) | Total Shareholder Return ($) | Peer Group Total Shareholder Return(6) ($) | Net Income (Loss) ($ in thousands) | Company Selected Measure(7) | ||||||||||||||||||
| 2025 | 5,896,045 | 2,866,614 | 2,575,012 | 1,856,409 | 79.52 | 119.92 | (244,092) | |||||||||||||||||||
| 2024 | 7,230,959 | (1,707,034) | 2,488,366 | (204,492) | 115.32 | 90.58 | (122,310) | |||||||||||||||||||
| 2023 | 7,043,826 | (3,218,100) | 2,644,678 | (1,225,533) | 302.58 | 91.84 | (147,028) | |||||||||||||||||||
| 2022 | 6,736,055 | 7,400,610 | 2,696,607 | 4,104,503 | 501.67 | 88.53 | (116,949) | |||||||||||||||||||
2021(8) | 4,918,363 | 41,144,072 | 2,852,428 | 12,625,320 | 411.32 | 99.37 | 66,975 | |||||||||||||||||||
–2025: Tran B. Nguyen, Brandon S. Smith, Chad J. Swanson, Wagner M. Zago
–2024: Carol D. Karp, Tran B. Nguyen, Brandon S. Smith, Wagner M. Zago.
–2021-2023: Hideki Garren, Carol D. Karp, Tran B. Nguyen, Brandon S. Smith.
| PEO | |||||||||||||||||||||||||||||||||||
| 2025 | 2024 | 2023 | 2022 | 2021 | |||||||||||||||||||||||||||||||
| ($) | ($) | ($) | ($) | ($) | |||||||||||||||||||||||||||||||
Summary Compensation Table - Total Compensation(a) | 5,896,045 | 7,230,959 | 7,043,826 | 6,736,055 | 4,918,363 | ||||||||||||||||||||||||||||||
| - | Grant Date Fair Value of Option Awards and Stock Awards Granted in Fiscal Year(b) | (4,771,538) | (6,168,827) | (6,039,017) | (5,705,925) | (3,900,675) | |||||||||||||||||||||||||||||
| + | Fair Value at Fiscal Year-End of Outstanding and Unvested Option Awards and Stock Awards Granted in Fiscal Year(c) | 3,209,603 | 2,251,121 | 3,269,118 | 12,228,032 | 23,225,521 | |||||||||||||||||||||||||||||
| + | Change in Fair Value of Outstanding and Unvested Option Awards and Stock Awards Granted in Prior Fiscal Years(d) | (925,264) | (2,865,913) | (5,418,699) | 2,227,286 | 8,810,891 | |||||||||||||||||||||||||||||
| + | Fair Value at Vesting of Option Awards and Stock Awards Granted in Fiscal Year That Vested During Fiscal Year(e) | — | — | — | — | — | |||||||||||||||||||||||||||||
| + | Change in Fair Value as of Vesting Date of Option Awards and Stock Awards Granted in Prior Fiscal Years For Which Applicable Vesting Conditions Were Satisfied During Fiscal Year(f) | (542,232) | (2,154,374) | (2,073,328) | (8,084,838) | 8,342,873 | |||||||||||||||||||||||||||||
| - | Fair Value as of Prior Fiscal Year-End of Option Awards and Stock Awards Granted in Prior Fiscal Years That Failed to Meet Applicable Vesting Conditions During Fiscal Year(g) | — | — | — | — | (252,901) | |||||||||||||||||||||||||||||
| = | Compensation Actually Paid | 2,866,614 | (1,707,034) | (3,218,100) | 7,400,610 | 41,144,072 | |||||||||||||||||||||||||||||
(a)Represents Total Compensation as reported in the Summary Compensation Table for the indicated fiscal year.
(b)Represents the aggregate grant date fair value of the option awards granted to Dr. Kinney during the indicated fiscal year, computed in accordance with the methodology used for financial reporting purposes.
(c)Represents the aggregate fair value as of the indicated fiscal year-end of Dr. Kinney’s outstanding and unvested option awards granted during such fiscal year, computed in accordance with the methodology used for financial reporting purposes.
(d) Represents the aggregate change in fair value during the indicated fiscal year of the outstanding and unvested option awards held by Dr. Kinney as of the last day of the indicated fiscal year, computed in accordance with the methodology used for financial reporting purposes and, for awards subject to performance-based vesting conditions, based on the probable outcome of such performance-based vesting conditions as of the last day of the fiscal year.
(e)Represents the aggregate fair value at vesting of the option awards that were granted to Dr. Kinney and vested during the indicated fiscal year, computed in accordance with the methodology used for financial reporting purposes.
(f)Represents the aggregate change in fair value, measured from the prior fiscal year-end to the vesting date, of each option award held by Dr. Kinney that was granted in a prior fiscal year and which vested during the indicated fiscal year, computed in accordance with the methodology used for financial reporting purposes.
(g)Represents the aggregate fair value as of the last day of the prior fiscal year of Dr. Kinney’s option awards that were granted in a prior fiscal year and which failed to meet the applicable vesting conditions in the indicated fiscal year, computed in accordance with the methodology used for financial reporting purposes.
Average Other Named Executive Officers(a) | ||||||||||||||||||||||||||||||||
| 2025 | 2024 | 2023 | 2022 | 2021 | ||||||||||||||||||||||||||||
| ($) | ($) | ($) | ($) | ($) | ||||||||||||||||||||||||||||
Summary Compensation Table - Total Compensation(b) | 2,575,012 | 2,488,366 | 2,644,678 | 2,696,607 | 2,852,428 | |||||||||||||||||||||||||||
| - | Grant Date Fair Value of Option Awards and Stock Awards Granted in Fiscal Year(c) | (1,770,538) | (1,707,982) | (1,870,147) | (1,940,015) | (2,154,308) | ||||||||||||||||||||||||||
| + | Fair Value at Fiscal Year-End of Outstanding and Unvested Option Awards and Stock Awards Granted in Fiscal Year(d) | 1,479,875 | 623,274 | 1,012,372 | 4,157,531 | 7,328,264 | ||||||||||||||||||||||||||
| + | Change in Fair Value of Outstanding and Unvested Option Awards and Stock Awards Granted in Prior Fiscal Years(e) | (269,292) | (931,629) | (2,233,022) | 1,099,351 | 2,776,040 | ||||||||||||||||||||||||||
| + | Fair Value at Vesting of Option Awards and Stock Awards Granted in Fiscal Year That Vested During Fiscal Year(f) | — | — | — | — | — | ||||||||||||||||||||||||||
| + | Change in Fair Value as of Vesting Date of Option Awards and Stock Awards Granted in Prior Fiscal Years For Which Applicable Vesting Conditions Were Satisfied During Fiscal Year(g) | (158,648) | (676,521) | (779,414) | (1,908,971) | 1,869,973 | ||||||||||||||||||||||||||
| - | Fair Value as of Prior Fiscal Year-End of Option Awards and Stock Awards Granted in Prior Fiscal Years That Failed to Meet Applicable Vesting Conditions During Fiscal Year(h) | — | — | — | — | (47,077) | ||||||||||||||||||||||||||
| = | Compensation Actually Paid | 1,856,409 | (204,492) | (1,225,533) | 4,104,503 | 12,625,320 | ||||||||||||||||||||||||||
(a)Please see footnote 1 for the named executive officers included in the average for each indicated fiscal year.
(b)Represents the average Total Compensation as reported in the Summary Compensation Table for the reported named executive officers in the indicated fiscal year.
(c)Represents the average aggregate grant date fair value of the option awards granted to the reported named executive officers during the indicated fiscal year, computed in accordance with the methodology used for financial reporting purposes.
(d)Represents the average aggregate fair value as of the indicated fiscal year-end of the reported named executive officers’ outstanding and unvested option awards granted during such fiscal year, computed in accordance with the methodology used for financial reporting purposes.
(e)Represents the average aggregate change in fair value during the indicated fiscal year of the outstanding and unvested option awards held by the reported named executive officers as of the last day of the indicated fiscal year, computed in accordance with the methodology used for financial reporting purposes.
(f)Represents the average aggregate fair value at vesting of the option awards that were granted to the reported named executive officers and vested during the indicated fiscal year, computed in accordance with the methodology used for financial reporting purposes.
(g)Represents the average aggregate change in fair value, measured from the prior fiscal year-end to the vesting date, of each option award held by the reported named executive officers that was granted in a prior fiscal year and which vested during the indicated fiscal year, computed in accordance with the methodology used for financial reporting purposes.
(h)Represents the average aggregate fair value as of the last day of the prior fiscal year of the reported named executive officers’ option awards that were granted in a prior fiscal year and which failed to meet the applicable vesting conditions in the indicated fiscal year, computed in accordance with the methodology used for financial reporting purposes.
| Relationship Between Pay and Performance | ||
We believe the compensation actually paid in each of the years reported above and over the five-year cumulative period are reflective of the Compensation Committee’s emphasis on “pay-for-performance” as the compensation actually paid fluctuated year-over-year, primarily due to the result of our share performance and our varying levels of achievement against pre-established performance goals under our annual cash bonus opportunities and long-term incentive compensation.
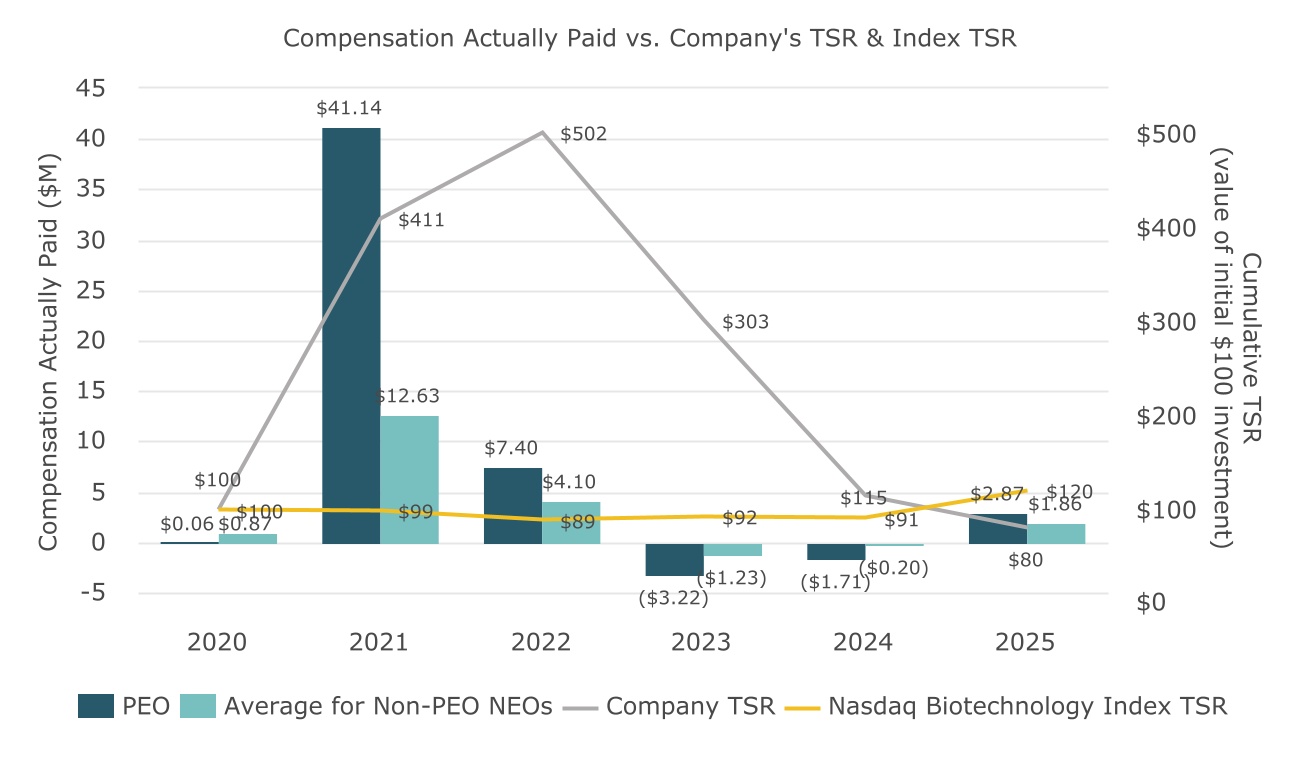
The following graphic illustrates the relationship between the compensation actually paid to the named executive officers and the Company’s TSR, as well as the relationship between the Company’s TSR and the TSR of the Nasdaq Biotechnology Index, an independently prepared index that includes companies in the biotechnology industry. In addition, as noted above, as is the case with many companies in the biotechnology industry, the Company’s annual incentive objectives are generally tied to the Company’s strategic and operational goals rather than financial goals. Accordingly, the Company’s compensation program is less influenced by metrics such as net income. In fiscal year 2021, our net income was $66,975,000 as compared to the compensation actually paid of $41,144,072 to
Dr. Kinney and $12,625,320 for the average of our other named executive officers. In fiscal year 2022, our net income decreased to $(116,949,000), while the compensation actually paid for Dr. Kinney and for the other named executive officers decreased to $7,400,610 and $4,104,503, respectively, primarily due to a smaller increase in our share price year-over-year. In fiscal year 2023, our net income decreased to $(147,028,000), while the compensation actually paid for Dr. Kinney and for the other named executive officers decreased to $(3,218,100) and $(1,225,533), respectively, primarily due to a decrease in our share price year-over-year. In fiscal year 2024, our net income increased to $(122,310,000), while the compensation actually paid for Dr. Kinney and for the other named executive officers increased to $(1,707,034) and $(204,492), respectively, primarily due to a smaller decrease in our share price year-over-year. In fiscal year 2025, our net income decreased to $(244,092,000), while the compensation actually paid for Dr. Kinney and for the other named executive officers increased to $2,866,614 and $1,856,409, respectively, primarily due to a smaller decrease in our share price year-over-year.
| Relationship Between Pay and Performance | ||
We believe the compensation actually paid in each of the years reported above and over the five-year cumulative period are reflective of the Compensation Committee’s emphasis on “pay-for-performance” as the compensation actually paid fluctuated year-over-year, primarily due to the result of our share performance and our varying levels of achievement against pre-established performance goals under our annual cash bonus opportunities and long-term incentive compensation.
The following graphic illustrates the relationship between the compensation actually paid to the named executive officers and the Company’s TSR, as well as the relationship between the Company’s TSR and the TSR of the Nasdaq Biotechnology Index, an independently prepared index that includes companies in the biotechnology industry. In addition, as noted above, as is the case with many companies in the biotechnology industry, the Company’s annual incentive objectives are generally tied to the Company’s strategic and operational goals rather than financial goals. Accordingly, the Company’s compensation program is less influenced by metrics such as net income. In fiscal year 2021, our net income was $66,975,000 as compared to the compensation actually paid of $41,144,072 to
Dr. Kinney and $12,625,320 for the average of our other named executive officers. In fiscal year 2022, our net income decreased to $(116,949,000), while the compensation actually paid for Dr. Kinney and for the other named executive officers decreased to $7,400,610 and $4,104,503, respectively, primarily due to a smaller increase in our share price year-over-year. In fiscal year 2023, our net income decreased to $(147,028,000), while the compensation actually paid for Dr. Kinney and for the other named executive officers decreased to $(3,218,100) and $(1,225,533), respectively, primarily due to a decrease in our share price year-over-year. In fiscal year 2024, our net income increased to $(122,310,000), while the compensation actually paid for Dr. Kinney and for the other named executive officers increased to $(1,707,034) and $(204,492), respectively, primarily due to a smaller decrease in our share price year-over-year. In fiscal year 2025, our net income decreased to $(244,092,000), while the compensation actually paid for Dr. Kinney and for the other named executive officers increased to $2,866,614 and $1,856,409, respectively, primarily due to a smaller decrease in our share price year-over-year.
| Performance Measures Used to Link Company Performance and Compensation Actually Paid to the Named Executive Officers | ||
As noted above, as is the case with many companies in the biotechnology industry, the Company relies less on financial performance goals as compared to non-financial strategic and operational goals. Below is a list of performance measures, which in the Company’s assessment represent the most important performance measures used by the Company to link compensation actually paid to the named executive officers for fiscal year 2025. Please see the Compensation Discussion and Analysis for further information regarding how each of these measures is used in the Company’s executive compensation program.
•Share Price
•Progress R&D Portfolio to Achieve Primary 2025 Milestones
◦For birtamimab, For birtamimab, execute engagement plan to support enrollment and potential commercialization; effectively communicate topline results of Phase 3 AFFIRM-AL trial.
◦For PRX012, effectively communicate topline results of Phase 1 clinical trials; reach decision regarding additional development.
◦For PRX019, complete the Phase 1 clinical trial through a specified cohort.
•Meet Cash Burn Guidance Range and Optimize Shareholder Base
◦Meet publicly-disclosed cash burn guidance range.
◦Optimize shareholder base by: retaining four of top six institutional investors; galvanizing at least one institutional investor (existing or new) to take a >5% ownership stake; or galvanizing at least five institutional investors (existing or new) to take a >1% ownership stake.