Pay vs Performance Disclosure
Dec. 31, 2025
USD ($)
$ / shares
Dec. 31, 2024
USD ($)
$ / shares
Dec. 31, 2023
USD ($)
$ / shares
| Value of Initial Fixed $100 Investment Based On: | ||||||||||||||||||||||||||
Fiscal Year (a)(1) | Summary Compensation Table Total for PEO (b) | Compensation Actually Paid to PEO (c)(2) | Average Summary Compensation Table Total for Non-PEO NEOs (d)(2) | Average Compensation Actually Paid to Non-PEO NEOs (e)(3) | Total Shareholder Return (f)(4,5) | Peer Group Total Shareholder Return (g)(4,5) | Net Income ($ in Millions) (h)(6) | Adjusted EPS (i)(6,7) | ||||||||||||||||||
2025 | $14,803,238 | $10,546,320 | $3,937,787 | $3,031,220 | $119.12 | $158.59 | $940 | $3.90 | ||||||||||||||||||
2024 | $11,532,426 | $18,547,624 | $3,524,128 | $5,360,401 | $121.04 | $132.80 | $833 | $3.54 | ||||||||||||||||||
2023 | $9,392,843 | $5,523,306 | $4,841,783 | $5,109,656 | $97.39 | $113.05 | $839 | $3.19 | ||||||||||||||||||
Fiscal Year | PEO 2025 | Non-PEO NEOs 2025 | ||||||
SCT Total | $14,803,238 | $3,937,787 | ||||||
| - Grant Date Fair Value of Option Awards and Stock Awards Granted in Fiscal Year | ($10,492,910) | ($1,982,135) | ||||||
| + Fair Value at Fiscal Year-End of Outstanding and Unvested Option Awards and Stock Awards Granted in Fiscal Year | $9,650,078 | $1,822,925 | ||||||
| + Change in Fair Value of Outstanding and Unvested Option Awards and Stock Awards Granted in Prior Fiscal Years | ($3,007,202) | ($656,344) | ||||||
| + Fair Value at Vesting of Option Awards and Stock Awards Granted in Fiscal Year That Vested During Fiscal Year | $0 | $0 | ||||||
| + Change in Fair Value as of Vesting Date of Option Awards and Stock Awards Granted in Prior Fiscal Years For Which Applicable Vesting Conditions Were Satisfied During Fiscal Year | ($406,884) | ($91,014) | ||||||
| - Fair Value as of Prior Fiscal Year-End of Option Awards and Stock Awards Granted in Prior Fiscal Years That Failed to Meet Applicable Vesting Conditions During Fiscal Year | $0 | $0 | ||||||
| Compensation Actually Paid | $10,546,320 | $3,031,220 | ||||||
The fair value of P used in the calculation of CAP was determined using a Monte Carlo simulation valuation model, in accordance with ASC 718. The fair value of option awards used in the calculation of CAP was determined using the Black-Scholes option pricing model, in accordance with ASC 718. The assumptions used in this calculation are not materially different than those used for purposes of the Summary Compensation Table.
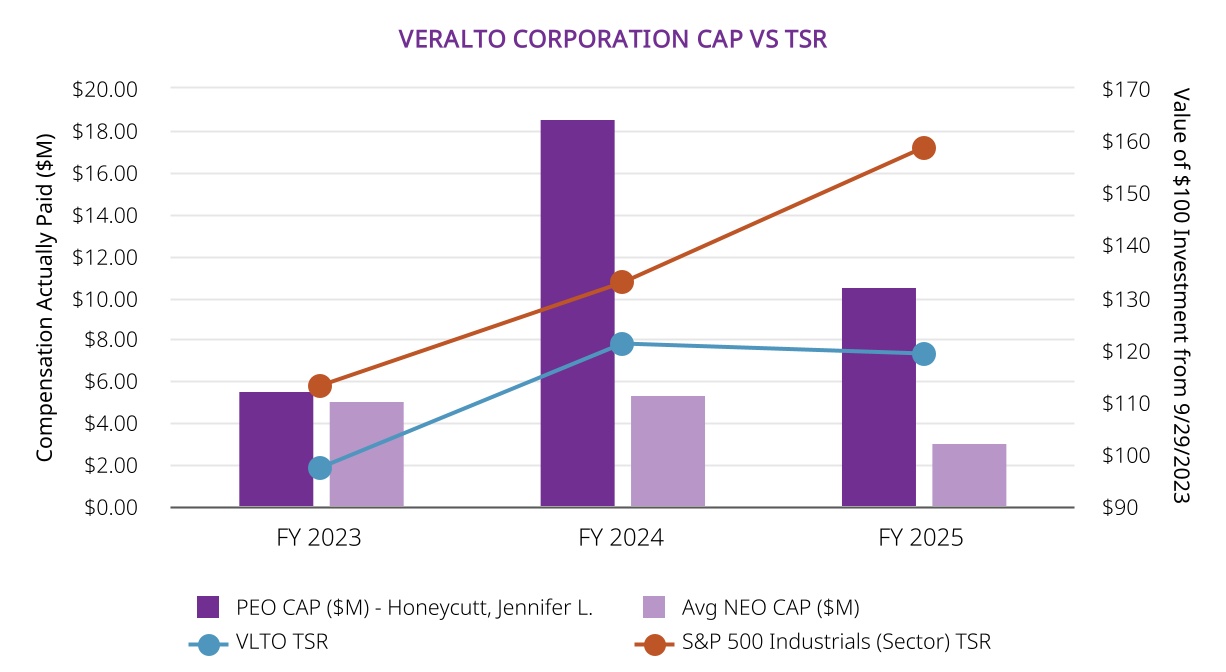
The chart below reflects the relationship between the PEO and Average NEO CAP versus our TSR and the Peer Group TSR.
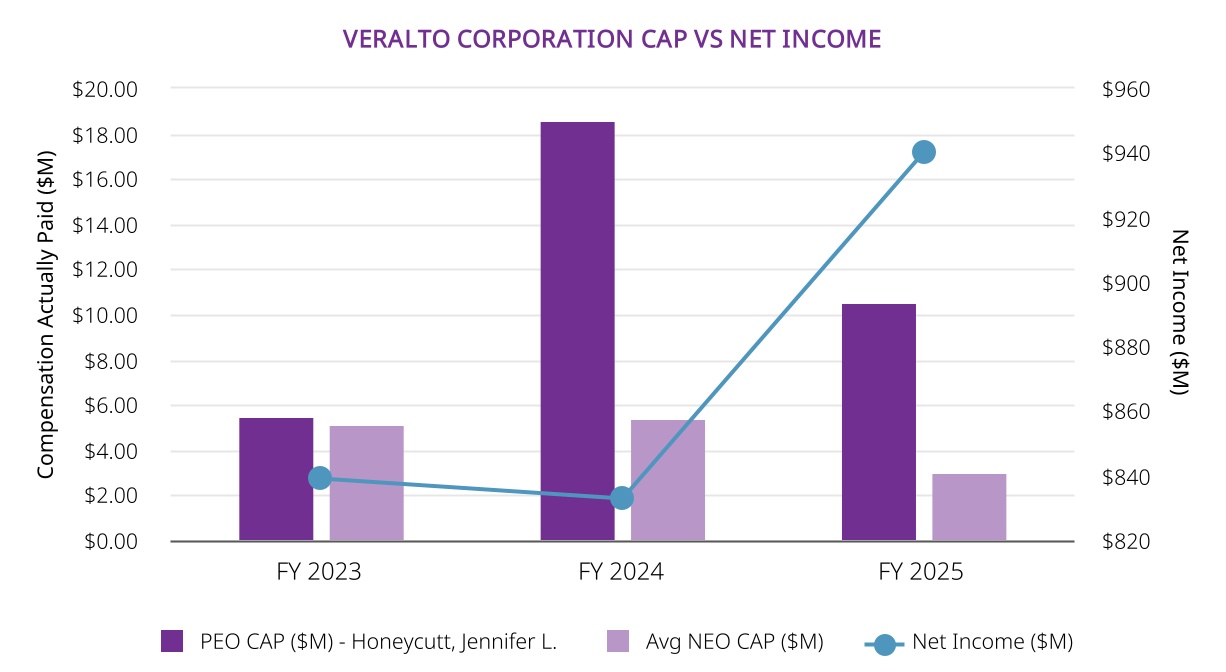
The chart below reflects the relationship between the PEO and Average NEO CAP and our GAAP Net Income.
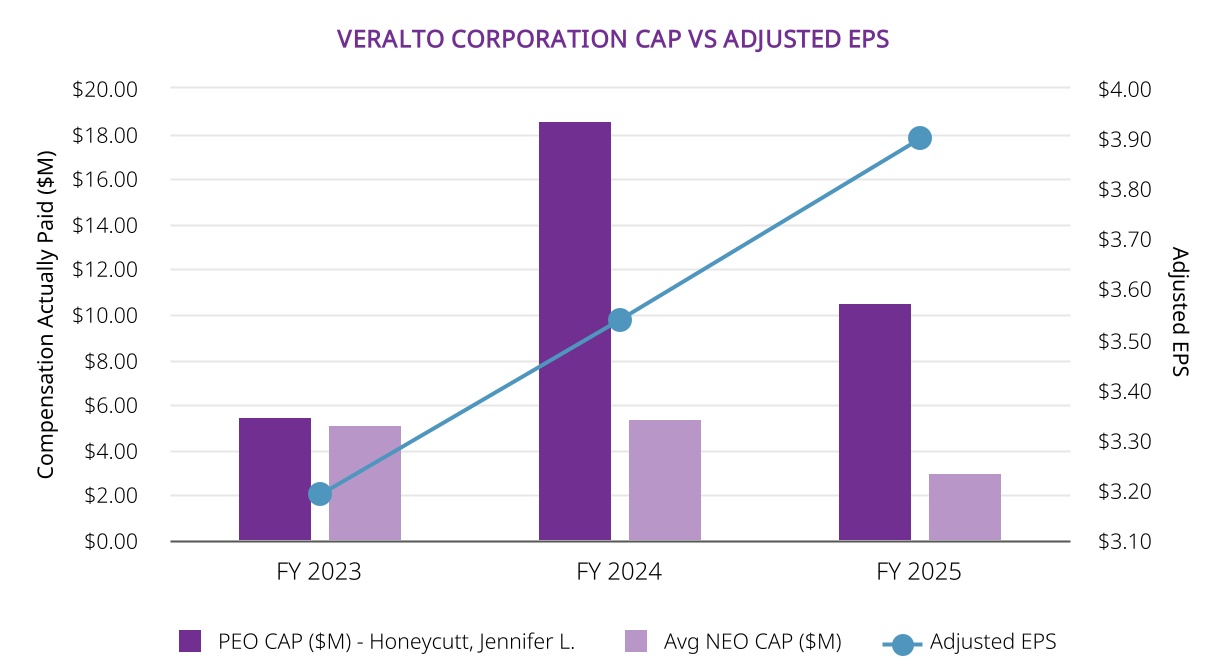
The chart below reflects the relationship between the PEO and Average NEO CAP and our Adjusted Earnings per Share.
The chart below reflects the relationship between the PEO and Average NEO CAP versus our TSR and the Peer Group TSR.
•Adjusted (Segment) Operating Profit (non-GAAP)
•(Segment) Core Revenue Growth (non-GAAP)
•Free Cash Flow Conversion (non-GAAP)
•Absolute TSR
•Relative TSR compared to the S&P 500 TSR
•Return on Invested Capital (non-GAAP)
Adjusted Earnings per Share and Core Revenue Growth are equally weighted metrics used to determine Company performance under our 2025 executive annual cash incentive compensation program. The Compensation Committee weights the two metrics most heavily in the Company performance formula because it believes Adjusted Earnings per Share measures profitable growth for the company and Core Revenue Growth provides incentive to grow the business organically. Accordingly, Adjusted Earnings per Share is the Company-selected measure included in the tables that follow.
Values are shown in millions.Please see page 109 for a definition of Adjusted Earnings per Share. Values shown reflect Adjusted Earnings per Share as calculated for purposes of our executive compensation program for the applicable reporting year.