Pay vs Performance Disclosure - USD ($)
|
12 Months Ended |
Dec. 31, 2025 |
Dec. 31, 2024 |
Dec. 31, 2023 |
| Pay vs Performance Disclosure |
|
|
|
| Pay vs Performance Disclosure, Table |
Pay Versus Performance
The following table sets forth information regarding the compensation of our named executive officers (“NEOs”) for the fiscal years ended December 31, 2023, 2024 and 2025, and our financial performance for each such fiscal year:
Pay Versus Performance Table
|
Year
|
|
Summary Compensation
Table Total
For Former
PEO
($)(1)
|
|
|
Compensation Actually Paid
to Former
PEO
($)(4)
|
|
|
Summary Compensation
Table Total
For Interim
PEO
($)(2)
|
|
|
Compensation Actually Paid
to Interim
PEO
($)(4)
|
|
|
Summary Compensation
Table Total
For Current
PEO
($)(3)
|
|
|
Compensation Actually Paid
to Current
PEO
($)(4)
|
|
|
Average
Summary Compensation
Table Total
for Non-PEO
NEOs
($)(5)
|
|
|
Average Compensation Actually Paid
to Non-PEO
NEOs
($)(6)
|
|
|
Value of
Initial
Fixed $100 Investment
Based on
Total
Shareholder
Return
($)(7)
|
|
|
Net (Loss)
Income
(In thousands)
($)(8)
|
|
|
2025
|
|
|
1,031,490 |
|
|
|
(1,414,997) |
|
|
|
105,000 |
|
|
|
105,000 |
|
|
|
2,127,590 |
|
|
|
2,031,284 |
|
|
|
1,212,050 |
|
|
|
1,163,897 |
|
|
|
51 |
|
|
|
(52,607) |
|
|
2024
|
|
|
778,160 |
|
|
|
190,276 |
|
|
|
- |
|
|
|
- |
|
|
|
- |
|
|
|
- |
|
|
|
478,810 |
|
|
|
417,988 |
|
|
|
63 |
|
|
|
(31,795) |
|
|
2023
|
|
|
1,132,230 |
|
|
|
252,742 |
|
|
|
- |
|
|
|
- |
|
|
|
- |
|
|
|
- |
|
|
|
542,218 |
|
|
|
(11,013) |
|
|
|
80 |
|
|
|
18,416 |
|
| |
(1)
|
Represents the total compensation of our former principal executive officer (PEO), Joseph A. Vitiritto, as reported in the Summary Compensation Table for each year indicated.
|
| |
(2)
|
Represents the total compensation of our interim principal executive officer, Matthew T. Moroun, as reported in the Summary Compensation Table for the year 2025. Mr. Moroun, our Chairman of the Board of Directors, served as interim President and CEO of the Company effective June 27, 2025 until Mr. Lance K. Stewart was appointed as President and CEO effective August 4, 2025.
|
| |
(3)
|
Represents the total compensation of our current principal executive officer (PEO), Lance K. Stewart, as reported in the Summary Compensation Table for the year 2025. On July 31, 2025, the Board of Directors appointed Lance K. Stewart, to succeed Mr. Vitiritto and Mr. Moroun as our new President and Chief Executive Officer beginning August 4, 2025. Mr. Moroun continues to serve as Chairman of the Board of the Company.
|
| |
(4)
|
The amount reported in this column for each year indicated is calculated as follows:
|
|
|
|
| PEO Actually Paid Compensation Amount |
$ 2,031,284
|
$ 0
|
$ 0
|
| Adjustment To PEO Compensation, Footnote |
|
Reconciliation of PEOs SCT Total
|
|
Former PEO
|
|
|
Interim PEO
|
|
|
Current PEO
|
|
| and Compensation Actually Paid. |
|
2025
|
|
|
2024
|
|
|
2023
|
|
|
2025
|
|
|
2025
|
|
| |
Total Compensation as reported SCT
|
|
$ |
1,031,490 |
|
|
$ |
778,160 |
|
|
$ |
1,132,230 |
|
|
$ |
105,000 |
|
|
$ |
2,127,590 |
|
|
Subtract
|
Pension values reported in SCT for covered fiscal year
|
|
|
— |
|
|
|
— |
|
|
|
— |
|
|
|
— |
|
|
|
— |
|
|
Subtract
|
Fair value of equity awards granted during covered fiscal year
|
|
|
(523,250 |
) |
|
|
— |
|
|
|
(366,145 |
) |
|
|
— |
|
|
|
(1,537,000 |
) |
|
Add
|
Pension value attributable to covered fiscal year’s service and any change in pension value attributable to plan amendments made in the covered year
|
|
|
— |
|
|
|
— |
|
|
|
— |
|
|
|
— |
|
|
|
— |
|
|
Add
|
Fair value of equity awards granted in covered fiscal year and that are unvested at end of such covered fiscal year - valued at year-end
|
|
|
392,600 |
|
|
|
— |
|
|
|
268,852 |
|
|
|
— |
|
|
|
1,449,600 |
|
|
Add
|
Fair value of equity awards granted in covered fiscal year that vested during such covered fiscal year - valued on date of vesting
|
|
|
— |
|
|
|
— |
|
|
|
— |
|
|
|
— |
|
|
|
— |
|
|
Add
|
Dividends or other earnings paid on stock or option awards in the covered fiscal year prior to the vesting date that are not otherwise included in the total compensation for the covered fiscal year
|
|
|
— |
|
|
|
— |
|
|
|
— |
|
|
|
— |
|
|
|
— |
|
|
Add/Subtract
|
Change in fair value from end of prior fiscal year to end of covered fiscal year for awards made in prior fiscal years that were unvested at end of current fiscal year
|
|
|
— |
|
|
|
(501,811 |
) |
|
|
(714,010 |
) |
|
|
— |
|
|
|
(7,989 |
) |
|
Add/Subtract
|
Change in fair value from end of prior fiscal year to vesting date for awards made in prior fiscal years that vested during covered fiscal year
|
|
|
(3,947 |
) |
|
|
(86,073 |
) |
|
|
(68,185 |
) |
|
|
— |
|
|
|
(916 |
) |
|
Subtract
|
Fair value of awards forfeited in current fiscal year determined at end of prior fiscal year
|
|
|
(2,311,890 |
) |
|
|
— |
|
|
|
— |
|
|
|
— |
|
|
|
— |
|
|
Equals
|
Compensation Actually Paid to PEO
|
|
$ |
(1,414,997 |
) |
|
$ |
190,276 |
|
|
$ |
252,742 |
|
|
$ |
105,000 |
|
|
$ |
2,031,284 |
|
| |
(5)
|
Represents the total compensation of each of our non-PEO NEOs during 2023, Lance K. Stewart and Allen W. West, our only non-PEO NEO in 2024, Lance K. Stewart, and the average of the total compensation of each of our non-PEO NEOs during 2025, Lance K. Stewart and Daniel C. Kleine, as reported in the Summary Compensation Table for each year indicated.
|
| |
(6)
|
The amount reported in this column for each year indicated is calculated as follows:
|
|
|
|
| Non-PEO NEO Average Total Compensation Amount |
$ 1,212,050
|
478,810
|
542,218
|
| Non-PEO NEO Average Compensation Actually Paid Amount |
$ 1,163,897
|
417,988
|
(11,013)
|
| Adjustment to Non-PEO NEO Compensation Footnote |
|
Reconciliation of Non-PEO NEOs
|
|
Non-PEO NEOs
|
|
| SCT Total and Compensation Actually Paid. |
|
2025
|
|
|
2024
|
|
|
2023
|
|
| |
Total Compensation as reported SCT
|
|
$ |
1,212,050 |
|
|
$ |
478,810 |
|
|
$ |
542,218 |
|
|
Subtract
|
Pension values reported in SCT for covered fiscal year
|
|
|
— |
|
|
|
— |
|
|
|
— |
|
|
Subtract
|
Fair value of equity awards granted during covered fiscal year
|
|
|
(768,500 |
) |
|
|
— |
|
|
|
(117,190 |
) |
|
Add
|
Pension value attributable to covered fiscal year’s service and any change in pension value attributable to plan amendments made in the covered year
|
|
|
— |
|
|
|
— |
|
|
|
— |
|
|
Add
|
Fair value of equity awards granted in covered fiscal year and that are unvested at end of such covered fiscal year - valued at year-end
|
|
|
— |
|
|
|
— |
|
|
|
86,050 |
|
|
Add
|
Fair value of equity awards granted in covered fiscal year that vested during such covered fiscal year - valued on date of vesting
|
|
|
— |
|
|
|
— |
|
|
|
— |
|
|
Add
|
Dividends or other earnings paid on stock or option awards in the covered fiscal year prior to the vesting date that are not otherwise included in the total compensation for the covered fiscal year
|
|
|
— |
|
|
|
— |
|
|
|
— |
|
|
Add/Subtract
|
Change in fair value from end of prior fiscal year to end of covered fiscal year for awards made in prior fiscal years that were unvested at end of current fiscal year
|
|
|
(3,995 |
) |
|
|
(13,697 |
) |
|
|
(109,670 |
) |
|
Add/Subtract
|
Change in fair value from end of prior fiscal year to vesting date for awards made in prior fiscal years that vested during covered fiscal year
|
|
|
(458 |
) |
|
|
(47,125 |
) |
|
|
1,901 |
|
|
Subtract
|
Fair value of awards forfeited in current fiscal year determined at end of prior fiscal year
|
|
|
— |
|
|
|
— |
|
|
|
(414,322 |
) |
|
Equals
|
Compensation Actually Paid to Non-PEO NEOs
|
|
$ |
1,163,897 |
|
|
$ |
417,988 |
|
|
$ |
(11,013 |
) |
| |
(7)
|
Represents the cumulative three-year total return to shareholders of our common stock and assumes that the value of the investment was $100 on December 31, 2022. The Company did not issue any dividends during 2023, 2024 or 2025. The stock price performance included in this column is not necessarily indicative of future stock price performance.
|
| |
(8)
|
Represents our reported net (loss) income for each year indicated.
|
|
|
|
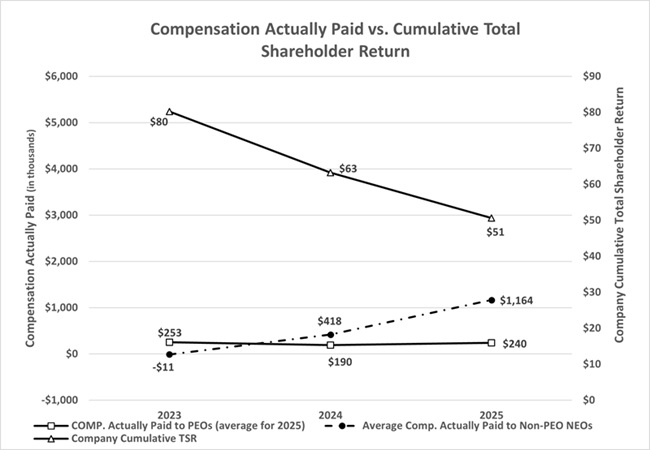
| Compensation Actually Paid vs. Total Shareholder Return |
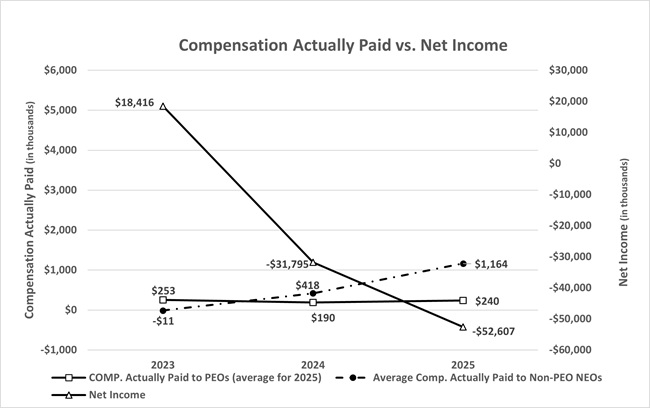
Relationship Between Compensation Actually Paid to our NEOs and Company Performance
The following graphs show the relationship between the compensation actually paid to our PEO and our other NEOs to our total shareholder return and net (loss) income over the three fiscal years ending December 31, 2025 as reported in the table above:
[The graphs follow on the next page.]
|
|
|
| Compensation Actually Paid vs. Net Income |
|
|
|
| Total Shareholder Return Amount |
$ 51
|
63
|
80
|
| Net Income (Loss) |
(52,607,000)
|
(31,795,000)
|
18,416,000
|
| Mr. Vitiritto [Member] |
|
|
|
| Pay vs Performance Disclosure |
|
|
|
| PEO Total Compensation Amount |
1,031,490
|
778,160
|
1,132,230
|
| PEO Actually Paid Compensation Amount |
$ (1,414,997)
|
$ 190,276
|
$ 252,742
|
| PEO Name |
Joseph A. Vitiritto
|
Joseph A. Vitiritto
|
Joseph A. Vitiritto
|
| Mr. Moroun [Member] |
|
|
|
| Pay vs Performance Disclosure |
|
|
|
| PEO Total Compensation Amount |
$ 105,000
|
$ 0
|
$ 0
|
| PEO Actually Paid Compensation Amount |
$ 105,000
|
0
|
0
|
| PEO Name |
Matthew T. Moroun
|
|
|
| Mr. Stewart [Member] |
|
|
|
| Pay vs Performance Disclosure |
|
|
|
| PEO Total Compensation Amount |
$ 2,127,590
|
0
|
0
|
| PEO Actually Paid Compensation Amount |
$ 2,031,284
|
|
|
| PEO Name |
Lance K. Stewart
|
|
|
| PEO | Mr. Vitiritto [Member] | Aggregate Change in Present Value of Accumulated Benefit for All Pension Plans Reported in Summary Compensation Table |
|
|
|
| Pay vs Performance Disclosure |
|
|
|
| Adjustment to Compensation, Amount |
$ 0
|
0
|
0
|
| PEO | Mr. Vitiritto [Member] | Aggregate Pension Adjustments Service Cost |
|
|
|
| Pay vs Performance Disclosure |
|
|
|
| Adjustment to Compensation, Amount |
0
|
0
|
0
|
| PEO | Mr. Vitiritto [Member] | Aggregate Grant Date Fair Value of Equity Award Amounts Reported in Summary Compensation Table |
|
|
|
| Pay vs Performance Disclosure |
|
|
|
| Adjustment to Compensation, Amount |
(523,250)
|
0
|
(366,145)
|
| PEO | Mr. Vitiritto [Member] | Year-end Fair Value of Equity Awards Granted in Covered Year that are Outstanding and Unvested |
|
|
|
| Pay vs Performance Disclosure |
|
|
|
| Adjustment to Compensation, Amount |
392,600
|
0
|
268,852
|
| PEO | Mr. Vitiritto [Member] | Year-over-Year Change in Fair Value of Equity Awards Granted in Prior Years That are Outstanding and Unvested |
|
|
|
| Pay vs Performance Disclosure |
|
|
|
| Adjustment to Compensation, Amount |
0
|
(501,811)
|
(714,010)
|
| PEO | Mr. Vitiritto [Member] | Vesting Date Fair Value of Equity Awards Granted and Vested in Covered Year |
|
|
|
| Pay vs Performance Disclosure |
|
|
|
| Adjustment to Compensation, Amount |
0
|
0
|
0
|
| PEO | Mr. Vitiritto [Member] | Change in Fair Value as of Vesting Date of Prior Year Equity Awards Vested in Covered Year |
|
|
|
| Pay vs Performance Disclosure |
|
|
|
| Adjustment to Compensation, Amount |
(3,947)
|
(86,073)
|
(68,185)
|
| PEO | Mr. Vitiritto [Member] | Prior Year End Fair Value of Equity Awards Granted in Any Prior Year that Fail to Meet Applicable Vesting Conditions During Covered Year |
|
|
|
| Pay vs Performance Disclosure |
|
|
|
| Adjustment to Compensation, Amount |
(2,311,890)
|
0
|
0
|
| PEO | Mr. Vitiritto [Member] | Dividends or Other Earnings Paid on Equity Awards not Otherwise Reflected in Total Compensation for Covered Year |
|
|
|
| Pay vs Performance Disclosure |
|
|
|
| Adjustment to Compensation, Amount |
0
|
0
|
0
|
| PEO | Mr. Moroun [Member] | Aggregate Change in Present Value of Accumulated Benefit for All Pension Plans Reported in Summary Compensation Table |
|
|
|
| Pay vs Performance Disclosure |
|
|
|
| Adjustment to Compensation, Amount |
0
|
|
|
| PEO | Mr. Moroun [Member] | Aggregate Pension Adjustments Service Cost |
|
|
|
| Pay vs Performance Disclosure |
|
|
|
| Adjustment to Compensation, Amount |
0
|
|
|
| PEO | Mr. Moroun [Member] | Aggregate Grant Date Fair Value of Equity Award Amounts Reported in Summary Compensation Table |
|
|
|
| Pay vs Performance Disclosure |
|
|
|
| Adjustment to Compensation, Amount |
0
|
|
|
| PEO | Mr. Moroun [Member] | Year-end Fair Value of Equity Awards Granted in Covered Year that are Outstanding and Unvested |
|
|
|
| Pay vs Performance Disclosure |
|
|
|
| Adjustment to Compensation, Amount |
0
|
|
|
| PEO | Mr. Moroun [Member] | Year-over-Year Change in Fair Value of Equity Awards Granted in Prior Years That are Outstanding and Unvested |
|
|
|
| Pay vs Performance Disclosure |
|
|
|
| Adjustment to Compensation, Amount |
0
|
|
|
| PEO | Mr. Moroun [Member] | Vesting Date Fair Value of Equity Awards Granted and Vested in Covered Year |
|
|
|
| Pay vs Performance Disclosure |
|
|
|
| Adjustment to Compensation, Amount |
0
|
|
|
| PEO | Mr. Moroun [Member] | Change in Fair Value as of Vesting Date of Prior Year Equity Awards Vested in Covered Year |
|
|
|
| Pay vs Performance Disclosure |
|
|
|
| Adjustment to Compensation, Amount |
0
|
|
|
| PEO | Mr. Moroun [Member] | Prior Year End Fair Value of Equity Awards Granted in Any Prior Year that Fail to Meet Applicable Vesting Conditions During Covered Year |
|
|
|
| Pay vs Performance Disclosure |
|
|
|
| Adjustment to Compensation, Amount |
0
|
|
|
| PEO | Mr. Moroun [Member] | Dividends or Other Earnings Paid on Equity Awards not Otherwise Reflected in Total Compensation for Covered Year |
|
|
|
| Pay vs Performance Disclosure |
|
|
|
| Adjustment to Compensation, Amount |
0
|
|
|
| PEO | Mr. Stewart [Member] | Aggregate Change in Present Value of Accumulated Benefit for All Pension Plans Reported in Summary Compensation Table |
|
|
|
| Pay vs Performance Disclosure |
|
|
|
| Adjustment to Compensation, Amount |
0
|
|
|
| PEO | Mr. Stewart [Member] | Aggregate Pension Adjustments Service Cost |
|
|
|
| Pay vs Performance Disclosure |
|
|
|
| Adjustment to Compensation, Amount |
0
|
|
|
| PEO | Mr. Stewart [Member] | Aggregate Grant Date Fair Value of Equity Award Amounts Reported in Summary Compensation Table |
|
|
|
| Pay vs Performance Disclosure |
|
|
|
| Adjustment to Compensation, Amount |
(1,537,000)
|
|
|
| PEO | Mr. Stewart [Member] | Year-end Fair Value of Equity Awards Granted in Covered Year that are Outstanding and Unvested |
|
|
|
| Pay vs Performance Disclosure |
|
|
|
| Adjustment to Compensation, Amount |
1,449,600
|
|
|
| PEO | Mr. Stewart [Member] | Year-over-Year Change in Fair Value of Equity Awards Granted in Prior Years That are Outstanding and Unvested |
|
|
|
| Pay vs Performance Disclosure |
|
|
|
| Adjustment to Compensation, Amount |
(7,989)
|
|
|
| PEO | Mr. Stewart [Member] | Vesting Date Fair Value of Equity Awards Granted and Vested in Covered Year |
|
|
|
| Pay vs Performance Disclosure |
|
|
|
| Adjustment to Compensation, Amount |
0
|
|
|
| PEO | Mr. Stewart [Member] | Change in Fair Value as of Vesting Date of Prior Year Equity Awards Vested in Covered Year |
|
|
|
| Pay vs Performance Disclosure |
|
|
|
| Adjustment to Compensation, Amount |
(916)
|
|
|
| PEO | Mr. Stewart [Member] | Prior Year End Fair Value of Equity Awards Granted in Any Prior Year that Fail to Meet Applicable Vesting Conditions During Covered Year |
|
|
|
| Pay vs Performance Disclosure |
|
|
|
| Adjustment to Compensation, Amount |
0
|
|
|
| PEO | Mr. Stewart [Member] | Dividends or Other Earnings Paid on Equity Awards not Otherwise Reflected in Total Compensation for Covered Year |
|
|
|
| Pay vs Performance Disclosure |
|
|
|
| Adjustment to Compensation, Amount |
0
|
|
|
| Non-PEO NEO | Aggregate Change in Present Value of Accumulated Benefit for All Pension Plans Reported in Summary Compensation Table |
|
|
|
| Pay vs Performance Disclosure |
|
|
|
| Adjustment to Compensation, Amount |
0
|
0
|
0
|
| Non-PEO NEO | Aggregate Pension Adjustments Service Cost |
|
|
|
| Pay vs Performance Disclosure |
|
|
|
| Adjustment to Compensation, Amount |
0
|
0
|
0
|
| Non-PEO NEO | Aggregate Grant Date Fair Value of Equity Award Amounts Reported in Summary Compensation Table |
|
|
|
| Pay vs Performance Disclosure |
|
|
|
| Adjustment to Compensation, Amount |
(768,500)
|
0
|
(117,190)
|
| Non-PEO NEO | Year-end Fair Value of Equity Awards Granted in Covered Year that are Outstanding and Unvested |
|
|
|
| Pay vs Performance Disclosure |
|
|
|
| Adjustment to Compensation, Amount |
0
|
0
|
86,050
|
| Non-PEO NEO | Year-over-Year Change in Fair Value of Equity Awards Granted in Prior Years That are Outstanding and Unvested |
|
|
|
| Pay vs Performance Disclosure |
|
|
|
| Adjustment to Compensation, Amount |
(3,995)
|
(13,697)
|
(109,670)
|
| Non-PEO NEO | Vesting Date Fair Value of Equity Awards Granted and Vested in Covered Year |
|
|
|
| Pay vs Performance Disclosure |
|
|
|
| Adjustment to Compensation, Amount |
0
|
0
|
0
|
| Non-PEO NEO | Change in Fair Value as of Vesting Date of Prior Year Equity Awards Vested in Covered Year |
|
|
|
| Pay vs Performance Disclosure |
|
|
|
| Adjustment to Compensation, Amount |
(458)
|
(47,125)
|
1,901
|
| Non-PEO NEO | Prior Year End Fair Value of Equity Awards Granted in Any Prior Year that Fail to Meet Applicable Vesting Conditions During Covered Year |
|
|
|
| Pay vs Performance Disclosure |
|
|
|
| Adjustment to Compensation, Amount |
0
|
0
|
(414,322)
|
| Non-PEO NEO | Dividends or Other Earnings Paid on Equity Awards not Otherwise Reflected in Total Compensation for Covered Year |
|
|
|
| Pay vs Performance Disclosure |
|
|
|
| Adjustment to Compensation, Amount |
$ 0
|
$ 0
|
$ 0
|