Pay vs Performance Disclosure
number in Millions |
12 Months Ended |
|
Dec. 31, 2025
USD ($)
|
Dec. 31, 2024
USD ($)
|
Dec. 31, 2023
USD ($)
|
Dec. 31, 2022
USD ($)
|
Dec. 31, 2021
USD ($)
|
| Pay vs Performance Disclosure |
|
|
|
|
|
| Pay vs Performance Disclosure, Table |
| | | | | | | | | | | | | | | | | | | | | | | | | | | | | | | | | | | | | | | | | | | | | | | | | | | | | | | | | | | | | | | | | | | | PEO-Michael Weening
(President & CEO) | | PEO-Carl Russo
(Former CEO) | | | | | | Value of Initial Fixed
$100 Investment Based
On: | | | | | | | Year | | Summary
Compensation
Table Total
for PEO
($) (1) | | Compensation
Actually Paid
to PEO
($) (2) | | Summary
Compensation
Table Total
for PEO
($) (1) | | Compensation
Actually Paid
to PEO
($) (2) | | Average
Summary
Compensation
Table Total
for Non-PEO
NEOs
($) (1) (3) | | Average
Compensation
Actually Paid
to Non-PEO
NEOs
($) (2) (3) | | Total
Shareholder
Return
($) (4) | | Peer Group
Total
Shareholder
Return
($) (5) | | Net Income
(in millions)
($) (6) | | Non-GAAP
Operating
Income
(in millions)
($) (7) | | | 2025 | | 10,820,080 | | | 16,180,108 | | | n/a | | n/a | | 9,079,871 | | | 9,653,386 | | | 178 | | | 217 | | | 18 | | | 110 | | | | 2024 | | 8,265,659 | | | 2,278,161 | | | n/a | | n/a | | 6,507,529 | | | 2,816,175 | | | 117 | | | 184 | | | (30) | | | 31 | | | | 2023 | | 7,155,795 | | | (13,126,694) | | | n/a | | n/a | | 6,461,941 | | | (2,804,301) | | | 147 | | | 136 | | | 29 | | | 94 | | | | 2022 | | 22,278,030 | | | 17,458,995 | | | 3,866,660 | | | (1,092,938) | | | 6,724,491 | | | 5,951,904 | | | 230 | | | 116 | | | 41 | | | 99 | | | | 2021 | | n/a | | n/a | | 7,726,910 | | | 30,362,780 | | | 4,914,250 | | | 15,939,257 | | | 269 | | | 148 | | | 238 | | | 96 | | |
|
|
|
|
|
| Company Selected Measure Name |
Non-GAAP Operating Income
|
|
|
|
|
| Named Executive Officers, Footnote |
These amounts reflect the total compensation, as disclosed in the Summary Compensation Table, paid to our CEO (Mr. Weening in 2025, 2024, 2023 and 2022 and Mr. Russo in 2022 and 2021) and the average total compensation for our non-PEO NEOs in 2025, 2024, 2023, 2022 and 2021.The chart below outlines our non-PEO NEOs for 2025, 2024, 2023, 2022 and 2021. | | | | | | | | | | | | | | | | | | | | | | | | | | | | | | 2025 | | 2024 | | 2023 | | 2022 | | 2021 | | | — | | — | | — | | — | | Michael Weening | | | Cory Sindelar | | Cory Sindelar | | Cory Sindelar | | Cory Sindelar | | Cory Sindelar | | | John Durocher (a) | | - | | - | | - | | - | | | Shane Eleniak | | Shane Eleniak | | Shane Eleniak | | Shane Eleniak | | Shane Eleniak | | | J. Matthew Collins (b) | | J. Matthew Collins | | J. Matthew Collins | | J. Matthew Collins | | J. Matthew Collins | |
(a) Mr. Durocher was appointed COO in November 2025. (b) Mr. Collins served as our CCOO until his passing on May 7, 2025.
|
|
|
|
|
| Peer Group Issuers, Footnote |
The peer group reflects the S&P 500 Communications Equipment Index, assuming a fixed investment of $100 as of December 31, 2020.
|
|
|
|
|
| Adjustment To PEO Compensation, Footnote |
Compensation Actually Paid represents the total compensation from the Summary Compensation Table for each of our CEOs and the average total compensation for our non-PEO NEOs as adjusted to reflect changes in the fair value of our outstanding stock option awards in accordance with Item 402(v) of Regulation S-K.
|
|
|
|
|
| Non-PEO NEO Average Total Compensation Amount |
$ 9,079,871
|
$ 6,507,529
|
$ 6,461,941
|
$ 6,724,491
|
$ 4,914,250
|
| Non-PEO NEO Average Compensation Actually Paid Amount |
$ 9,653,386
|
2,816,175
|
(2,804,301)
|
5,951,904
|
15,939,257
|
| Adjustment to Non-PEO NEO Compensation Footnote |
Compensation Actually Paid represents the total compensation from the Summary Compensation Table for each of our CEOs and the average total compensation for our non-PEO NEOs as adjusted to reflect changes in the fair value of our outstanding stock option awards in accordance with Item 402(v) of Regulation S-K.
|
|
|
|
|
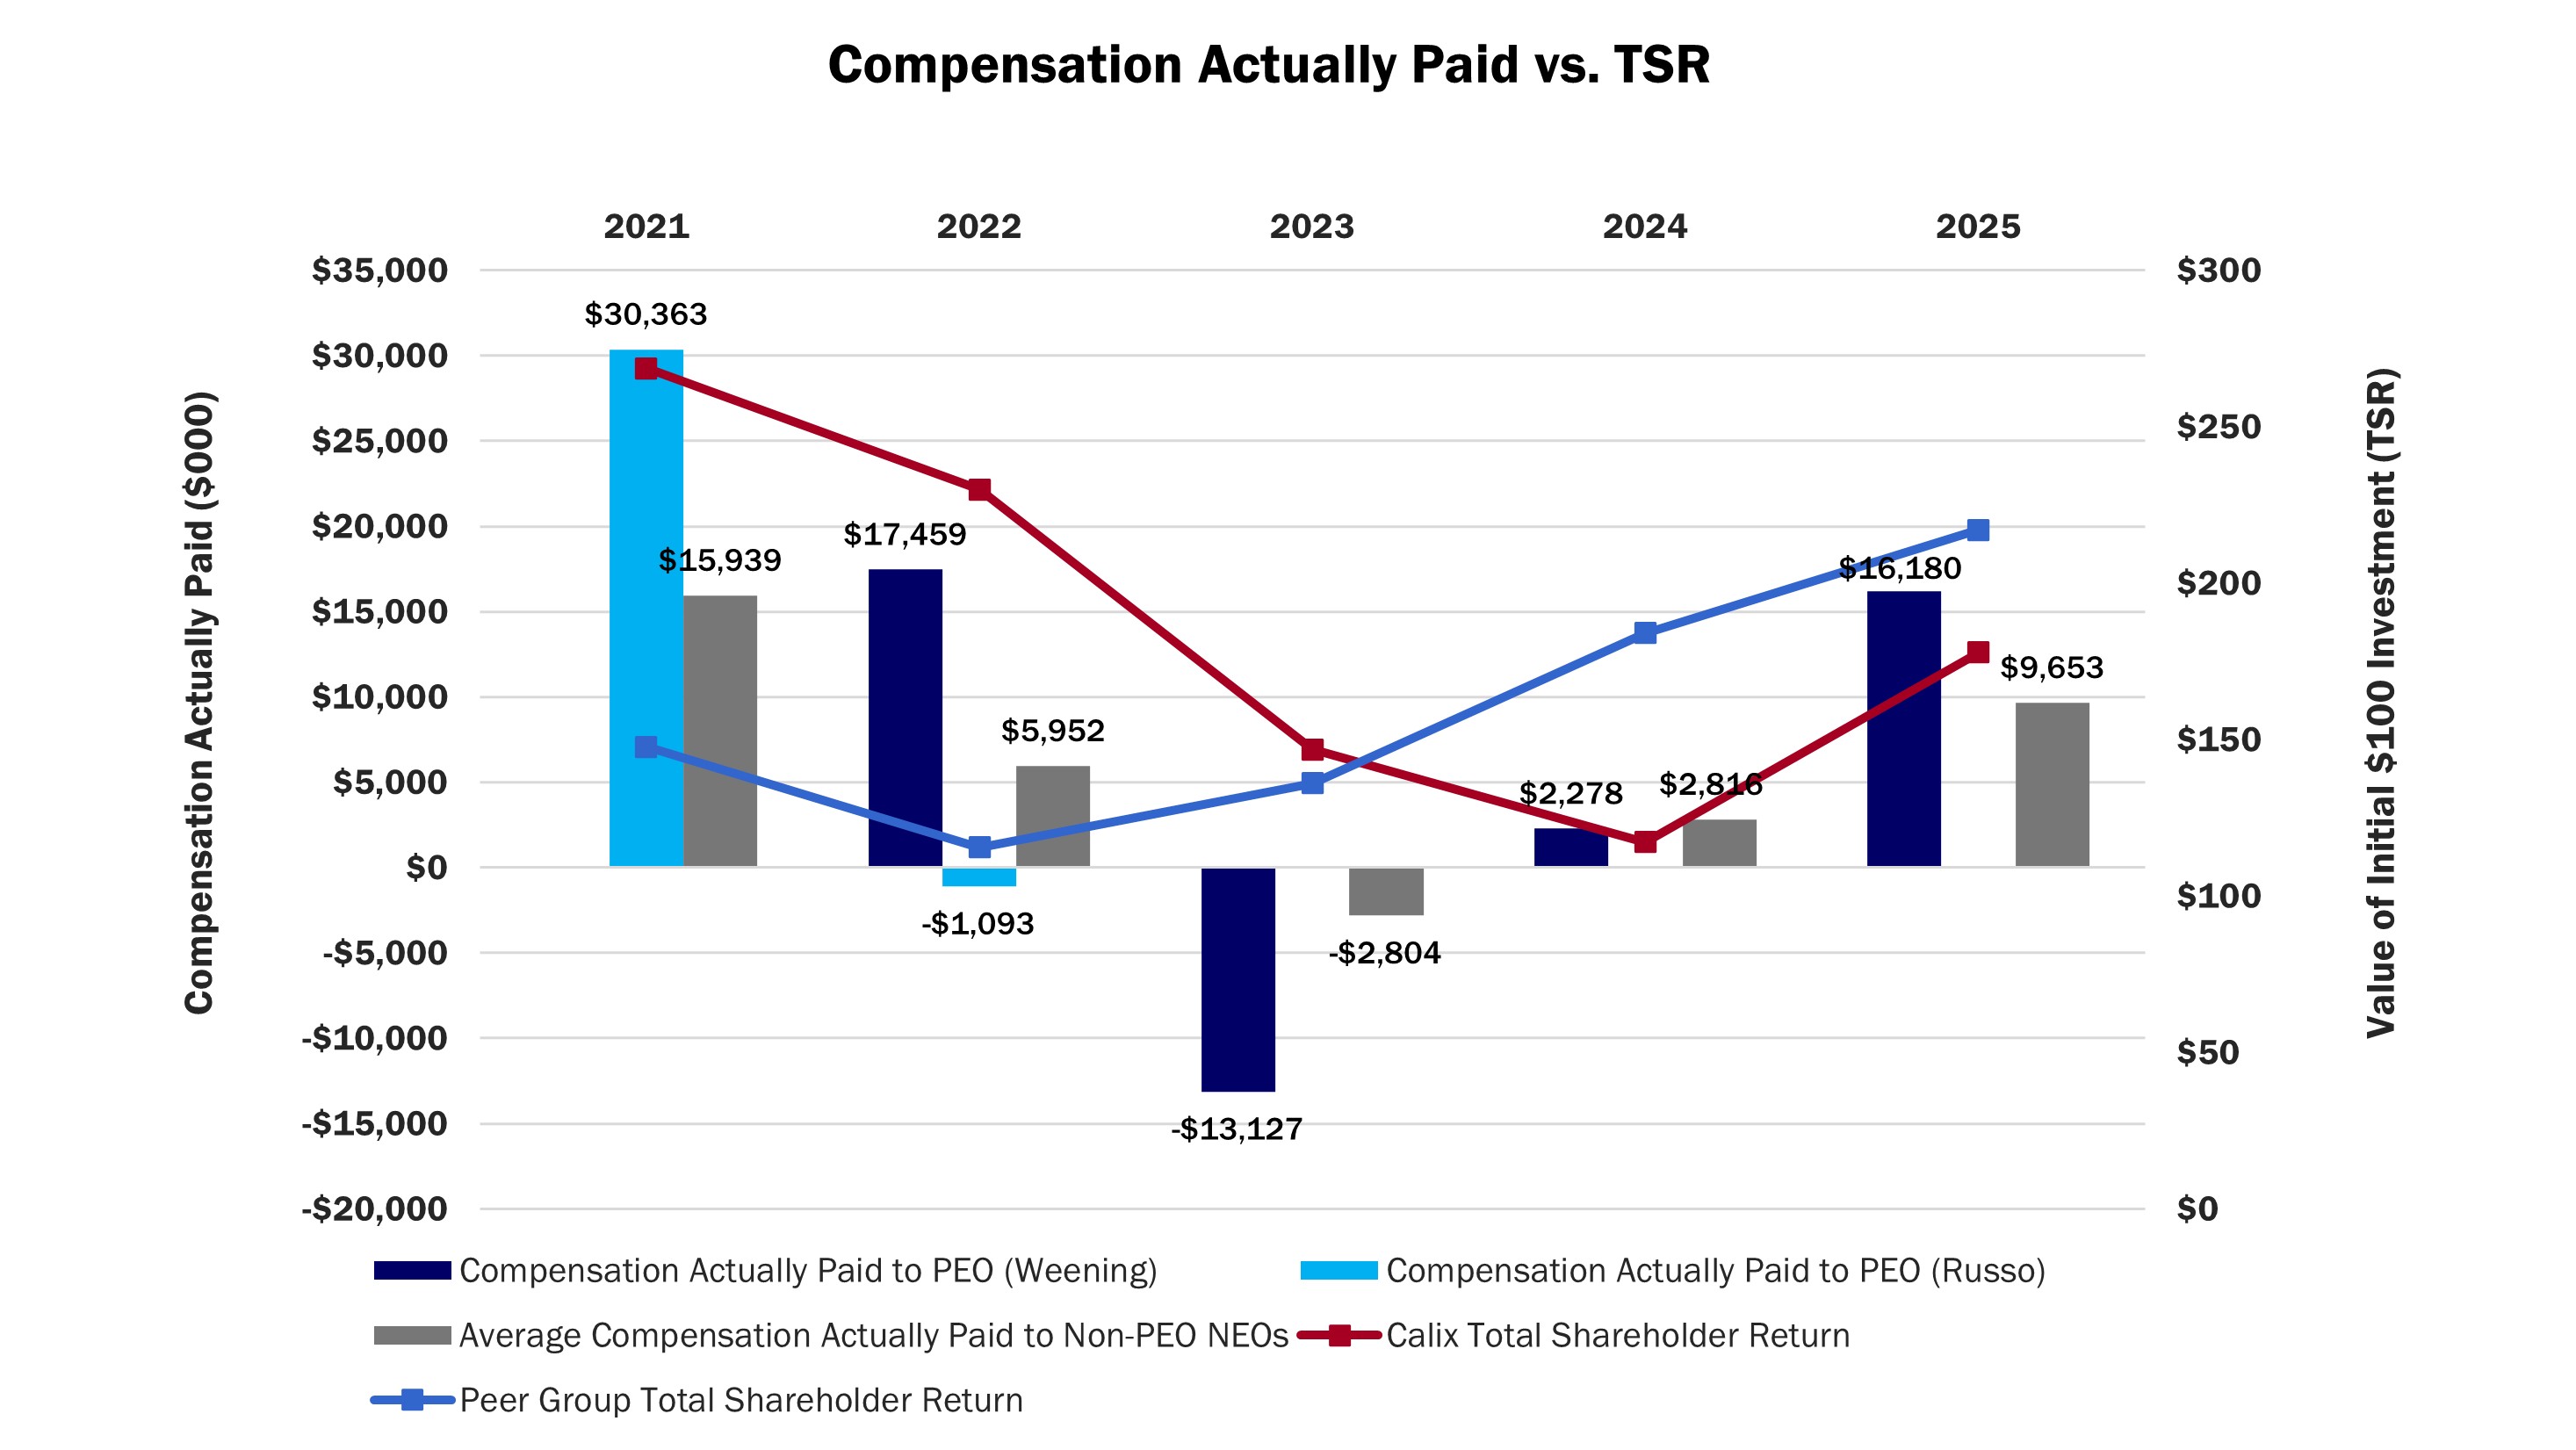
| Compensation Actually Paid vs. Total Shareholder Return |
The table below shows the relationship between the compensation actually paid to the PEOs and Average non-PEO NEOs relative to Total Shareholder Return (“TSR”) for Calix and the peer group for 2025, 2024, 2023, 2022 and 2021.
|
|
|
|
|
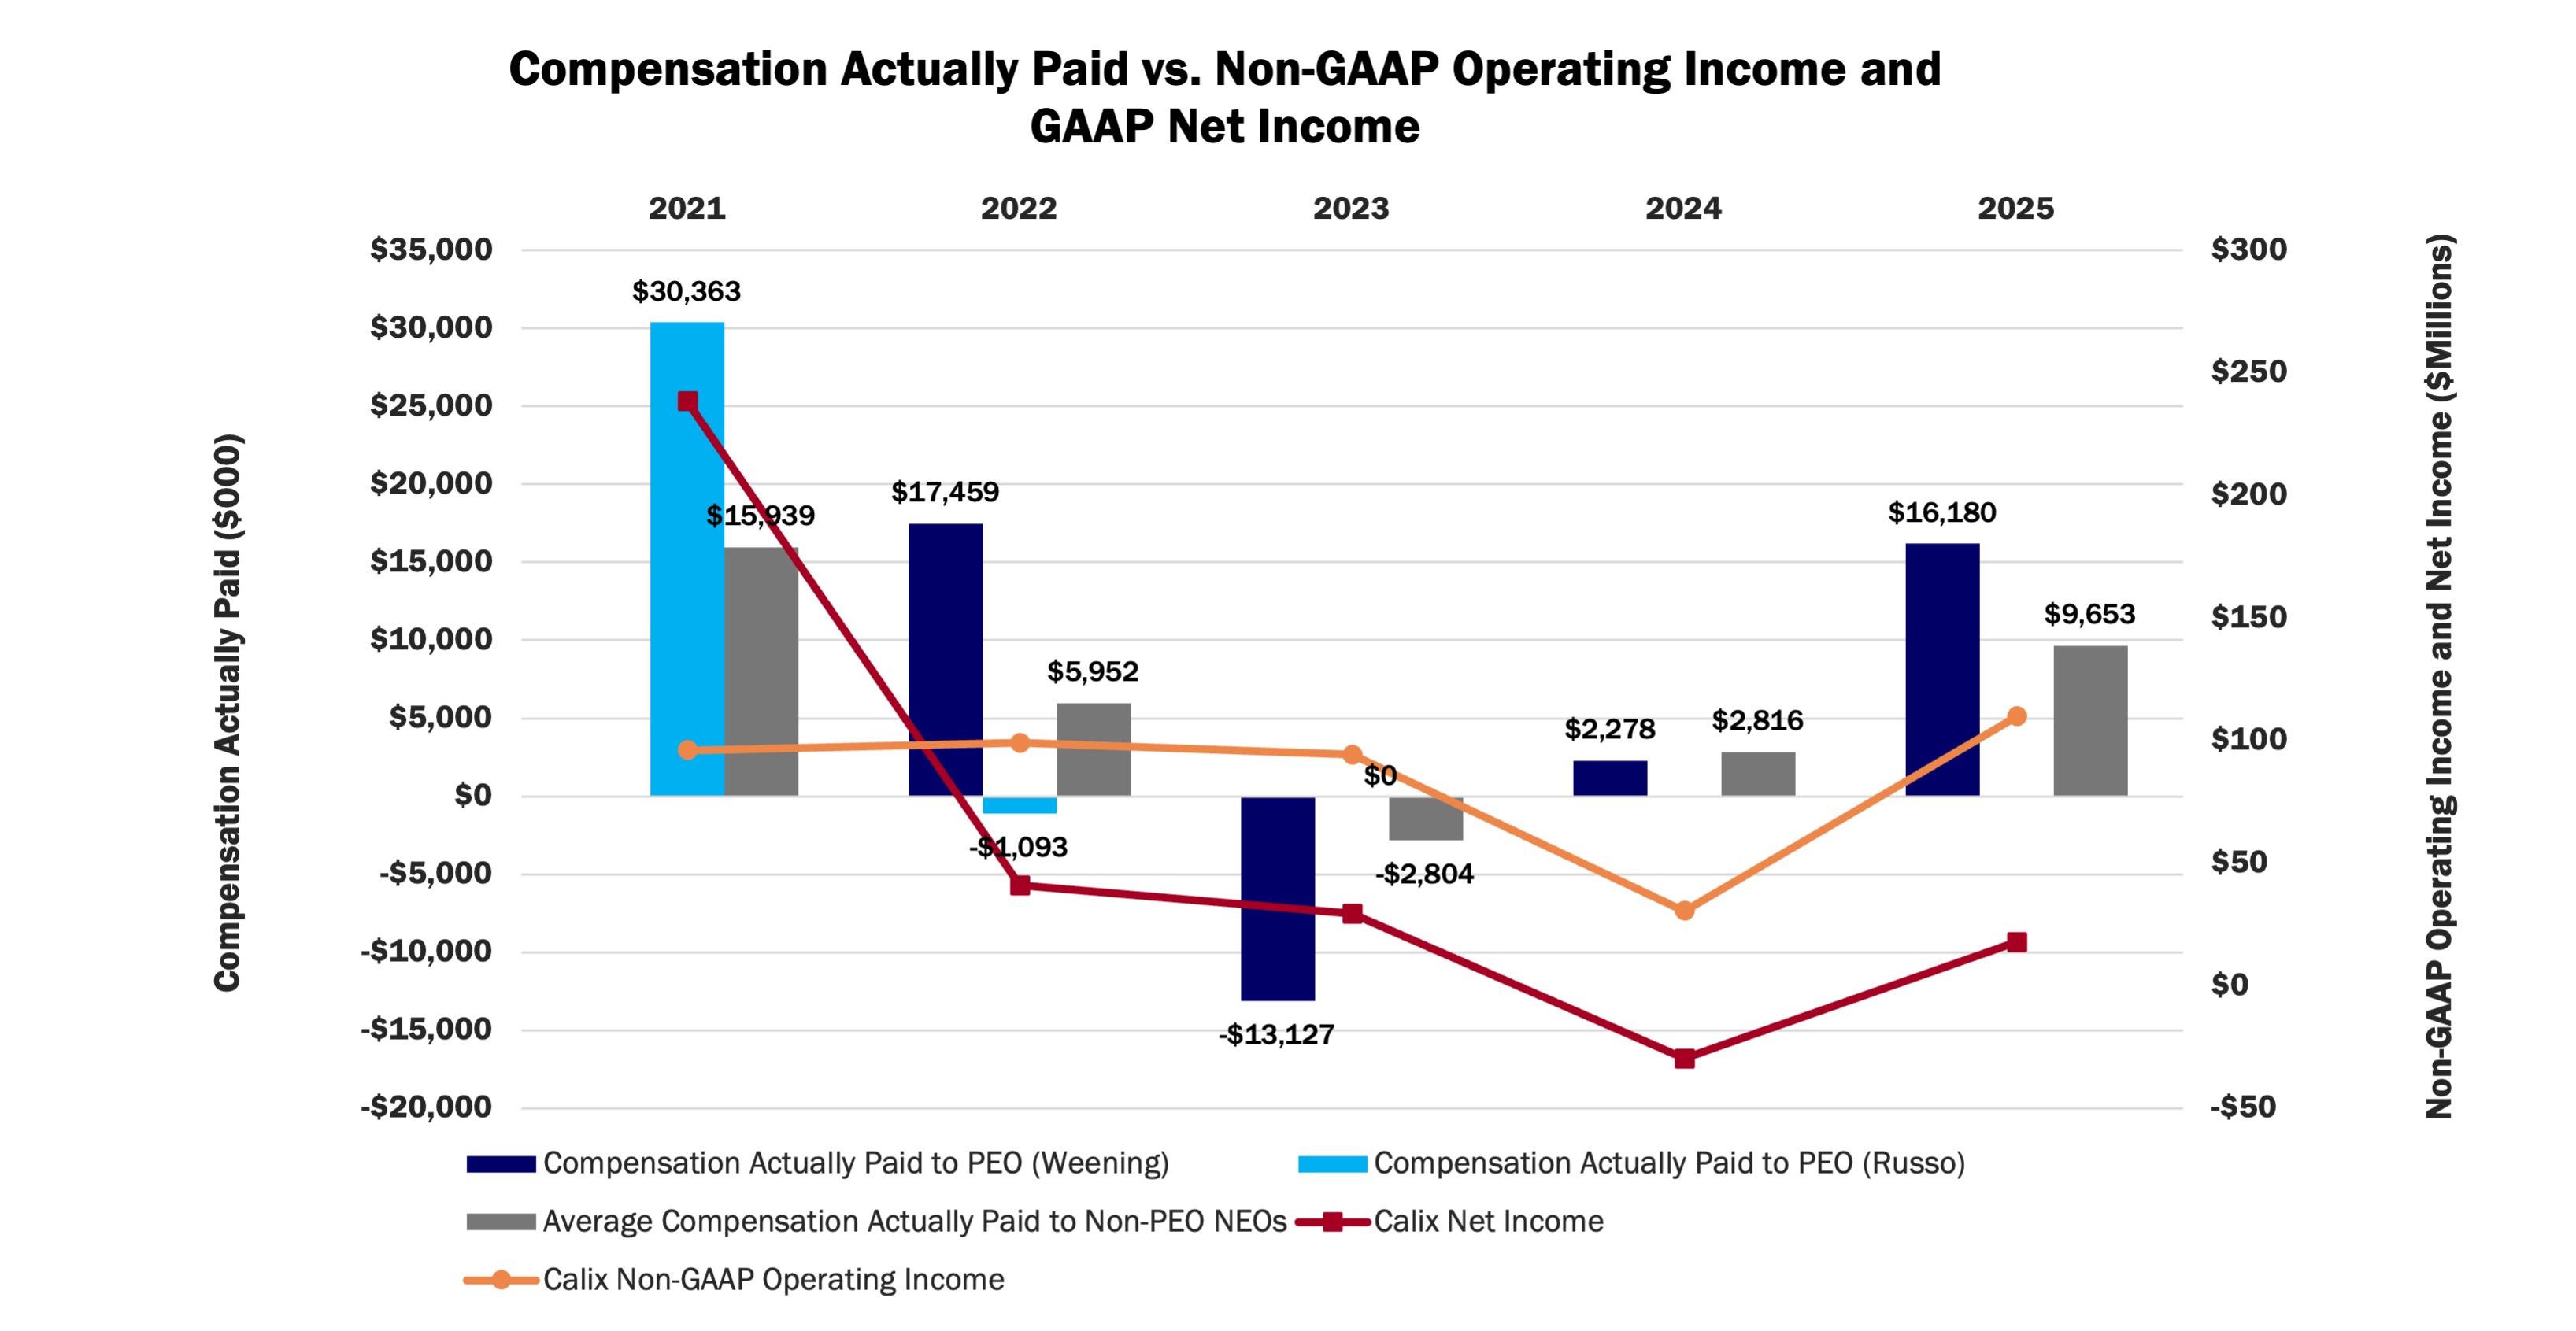
| Compensation Actually Paid vs. Net Income |
The table below shows the relationship between the compensation actually paid to the PEOs and Average non-PEO NEOs relative to net income and non-GAAP operating income for 2025, 2024, 2023, 2022 and 2021. (1)Non-GAAP Operating Income is defined as operating income on a GAAP basis less certain items that are not considered indicative of our performance, consisting of: stock-based compensation, intangible asset amortization and other charges. Reconciliation of these non-GAAP amounts to GAAP is provided in Appendix B.
|
|
|
|
|
| Compensation Actually Paid vs. Company Selected Measure |
The table below shows the relationship between the compensation actually paid to the PEOs and Average non-PEO NEOs relative to net income and non-GAAP operating income for 2025, 2024, 2023, 2022 and 2021. (1)Non-GAAP Operating Income is defined as operating income on a GAAP basis less certain items that are not considered indicative of our performance, consisting of: stock-based compensation, intangible asset amortization and other charges. Reconciliation of these non-GAAP amounts to GAAP is provided in Appendix B.
|
|
|
|
|
| Total Shareholder Return Vs Peer Group |
The table below shows the relationship between the compensation actually paid to the PEOs and Average non-PEO NEOs relative to Total Shareholder Return (“TSR”) for Calix and the peer group for 2025, 2024, 2023, 2022 and 2021.
|
|
|
|
|
| Tabular List, Table |
The Company and the Talent and Compensation Committee consider the following metrics to have the greatest influence on executive pay for our PEO and other NEOs: Bookings, Revenue, Non-GAAP Gross Margin and Non-GAAP Operating Income.
|
|
|
|
|
| Total Shareholder Return Amount |
$ 178
|
117
|
147
|
230
|
269
|
| Peer Group Total Shareholder Return Amount |
217
|
184
|
136
|
116
|
148
|
| Net Income (Loss) |
$ 18,000,000
|
$ (30,000,000)
|
$ 29,000,000
|
$ 41,000,000
|
$ 238,000,000
|
| Company Selected Measure Amount |
110
|
31
|
94
|
99
|
96
|
| PEO Name |
Mr. Weening
|
Mr. Weening
|
Mr. Weening
|
|
Mr. Russo
|
| Additional 402(v) Disclosure |
Total Shareholder Return for each year is based on an initial fixed investment of $100 in our stock on December 31, 2020.The dollar amounts reported reflect our net income as reported in our audited financial statements for each applicable year.
|
|
|
|
|
| Measure:: 1 |
|
|
|
|
|
| Pay vs Performance Disclosure |
|
|
|
|
|
| Name |
Bookings
|
|
|
|
|
| Measure:: 2 |
|
|
|
|
|
| Pay vs Performance Disclosure |
|
|
|
|
|
| Name |
Revenue
|
|
|
|
|
| Measure:: 3 |
|
|
|
|
|
| Pay vs Performance Disclosure |
|
|
|
|
|
| Name |
Non-GAAP Gross Margin
|
|
|
|
|
| Measure:: 4 |
|
|
|
|
|
| Pay vs Performance Disclosure |
|
|
|
|
|
| Name |
Non-GAAP Operating Income
|
|
|
|
|
| Non-GAAP Measure Description |
The dollar amounts represent the most important financial performance measure not otherwise reported in the above table that is used by the Company to link actual compensation paid during the most recent year to the Company’s performance, as required pursuant to Item 402(v) of Regulation S-K. Non-GAAP Operating Income is defined as operating income on a GAAP basis less certain items that are not considered indicative of our performance, consisting of: stock-based compensation, intangible asset amortization and other charges. Reconciliation of these non-GAAP amounts to GAAP is provided in Appendix B.
|
|
|
|
|
| Michael Weening [Member] |
|
|
|
|
|
| Pay vs Performance Disclosure |
|
|
|
|
|
| PEO Total Compensation Amount |
$ 10,820,080
|
$ 8,265,659
|
$ 7,155,795
|
$ 22,278,030
|
|
| PEO Actually Paid Compensation Amount |
$ 16,180,108
|
$ 2,278,161
|
$ (13,126,694)
|
$ 17,458,995
|
|
| PEO Name |
|
|
|
Mr. Weening
|
|
| Carl Russo [Member] |
|
|
|
|
|
| Pay vs Performance Disclosure |
|
|
|
|
|
| PEO Total Compensation Amount |
|
|
|
$ 3,866,660
|
$ 7,726,910
|
| PEO Actually Paid Compensation Amount |
|
|
|
$ (1,092,938)
|
$ 30,362,780
|
| PEO Name |
|
|
|
Mr. Russo
|
|