Pay versus Performance
In accordance with rules adopted by the SEC pursuant to the Dodd-Frank Wall Street Reform and Consumer Protection Act of 2010, we have provided the following disclosure regarding executive compensation for our principal executive officers (“PEOs”) and Non-PEO NEOs, and Company performance for the fiscal years listed below.
Pay versus Performance Table
|
|
Summary |
|
Summary |
|
Compensation |
|
Compensation |
|
Average |
|
Average |
|
Value of Initial Fixed $100 |
|
|
|
|
|||||||||||
Year |
|
for First |
|
for Second |
|
to First |
|
to Second |
|
for Non-PEO |
|
to Non-PEO |
|
TSR |
|
Peer Group |
|
Net Income |
|
PBIT⁵ |
|||||||||
|
|
|
|
|
|
|
|
|
|
|
|
|
|
|
|
|
|
|
|
|
|||||||||
2025 |
|
|
— |
|
|
14,107,588 |
|
|
— |
|
|
41,136,477 |
|
|
4,891,214 |
|
|
9,105,456 |
|
|
164.67 |
|
|
258.77 |
|
|
554.0 |
|
22.2% |
2024 |
|
|
— |
|
|
11,760,656 |
|
|
— |
|
|
17,078,109 |
|
|
2,936,103 |
|
|
4,001,320 |
|
|
188.52 |
|
|
247.21 |
|
|
542.4 |
|
20.4% |
2023 |
|
|
6,258,433 |
|
|
10,110,437 |
|
|
3,226,601 |
|
|
10,526,155 |
|
|
3,180,514 |
|
|
3,464,712 |
|
|
161.83 |
|
|
256.87 |
|
|
448.8 |
|
20.0% |
2022 |
|
|
10,601,249 |
|
|
— |
|
|
(16,408,806 |
) |
|
— |
|
|
2,665,821 |
|
|
(1,673,638 |
) |
|
129.70 |
|
|
161.36 |
|
|
715.5 |
|
28.0% |
2021 |
|
|
10,954,713 |
|
|
— |
|
|
37,477,207 |
|
|
— |
|
|
2,495,173 |
|
|
6,687,782 |
|
|
241.76 |
|
|
246.09 |
|
|
1,014.6 |
|
33.0% |
2021 |
2022 |
2023 |
2024 |
2025 |
Gregory S. Smith |
Gregory S. Smith |
Sanjay Mehta |
Sanjay Mehta |
Sanjay Mehta |
Sanjay Mehta |
Sanjay Mehta |
Charles J. Gray |
Ryan Driscoll |
Ryan Driscoll |
Charles J. Gray |
Charles J. Gray |
Richard J. Burns |
Richard J. Burns |
Michelle Turner |
Bradford B. Robbins |
Richard J. Burns |
Ujjwal Kumar |
Ujjwal Kumar |
Regan Mills |
|
|
|
|
Shannon Poulin |
Year |
Summary |
|
Exclusion of Change in Pension Value for Second PEO |
|
Exclusion of |
|
Inclusion of Pension Service Cost for Second PEO |
|
Inclusion of |
|
Compensation |
|
||||||
2025 |
|
14,107,588 |
|
|
— |
|
|
(11,219,848 |
) |
|
— |
|
|
38,248,737 |
|
|
41,136,477 |
|
Year |
Average |
|
Average Exclusion of Change in Pension Value for Non-PEO NEOs |
|
Average |
|
Average Inclusion of Pension Service Cost for Non-PEO NEOs |
|
Average |
|
Average |
|
||||||
2025 |
|
4,891,214 |
|
|
(424 |
) |
|
(3,520,928 |
) |
|
— |
|
|
7,735,594 |
|
|
9,105,456 |
|
The amounts in the Inclusion of Equity Values in the tables above are derived from the amounts set forth in the following tables:
Year |
Year-End Fair |
|
Change in Fair |
|
Vesting-Date Fair |
|
Change in Fair |
|
Fair Value at Last |
|
Value of |
|
Total-Inclusion |
|
|||||||
2025 |
|
22,274,195 |
|
|
16,252,281 |
|
|
— |
|
|
(277,739 |
) |
|
— |
|
|
— |
|
|
38,248,737 |
|
Year |
Average Year |
|
Average Change |
|
Average Vesting- |
|
Average Change |
|
Average Fair |
|
Average Value of |
|
Total - Average |
|
|||||||
2025 |
|
6,173,591 |
|
|
1,597,732 |
|
|
— |
|
|
(35,729 |
) |
|
— |
|
|
— |
|
|
7,735,594 |
|
Relationship Between PEO and Non-PEO NEO Compensation Actually Paid and Company and Peer Group Total Shareholder Return
The following chart sets forth the relationship between Compensation Actually Paid to our PEOs, the average of Compensation Actually Paid to our Non-PEO NEOs, the Company’s cumulative TSR over the five most recently completed fiscal years, and the Peer Group’s TSR over the same period.
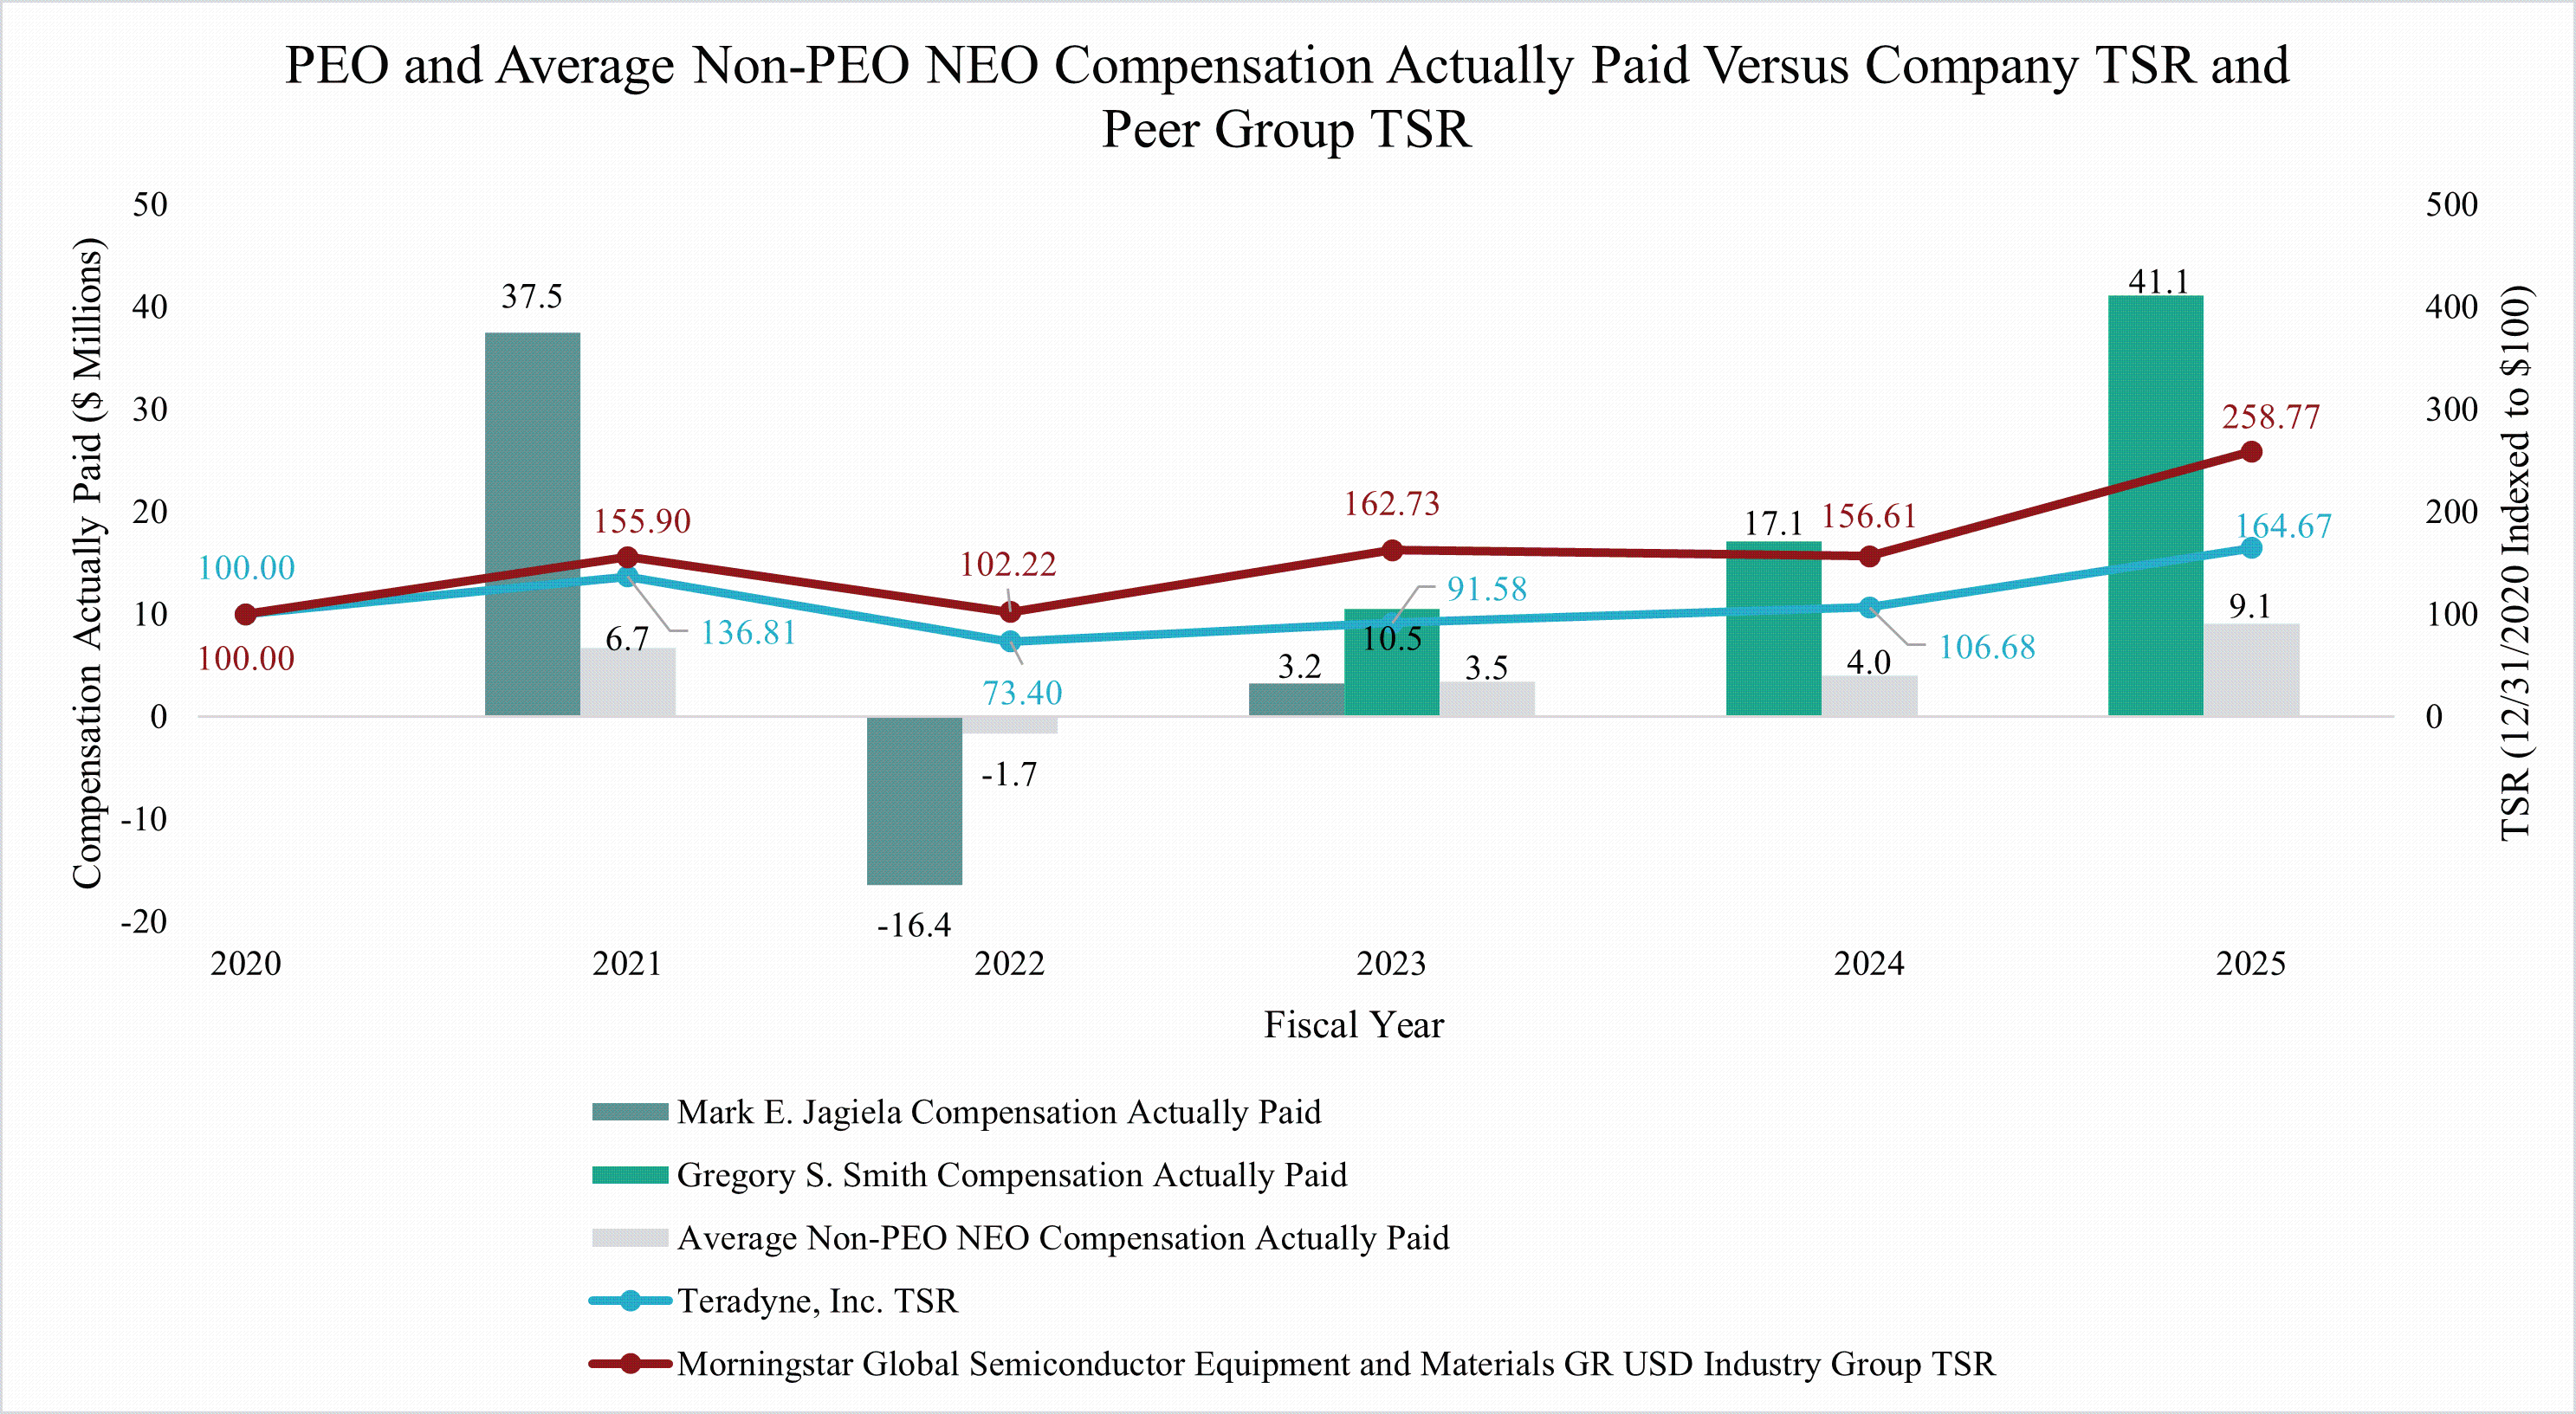
CEO compensation may appear higher than net income or TSR due to the timing and valuation of long-term incentive awards. The SEC’s definition of 'compensation actually paid' includes changes in the fair value of equity awards, which can fluctuate significantly based on stock price movements and vesting schedules.
Relationship Between PEO and Non-PEO NEO Compensation Actually Paid and Net Income
The following chart sets forth the relationship between Compensation Actually Paid to our PEOs, the average of Compensation Actually Paid to our Non-PEO NEOs, and our net income during the five most recently completed fiscal years.
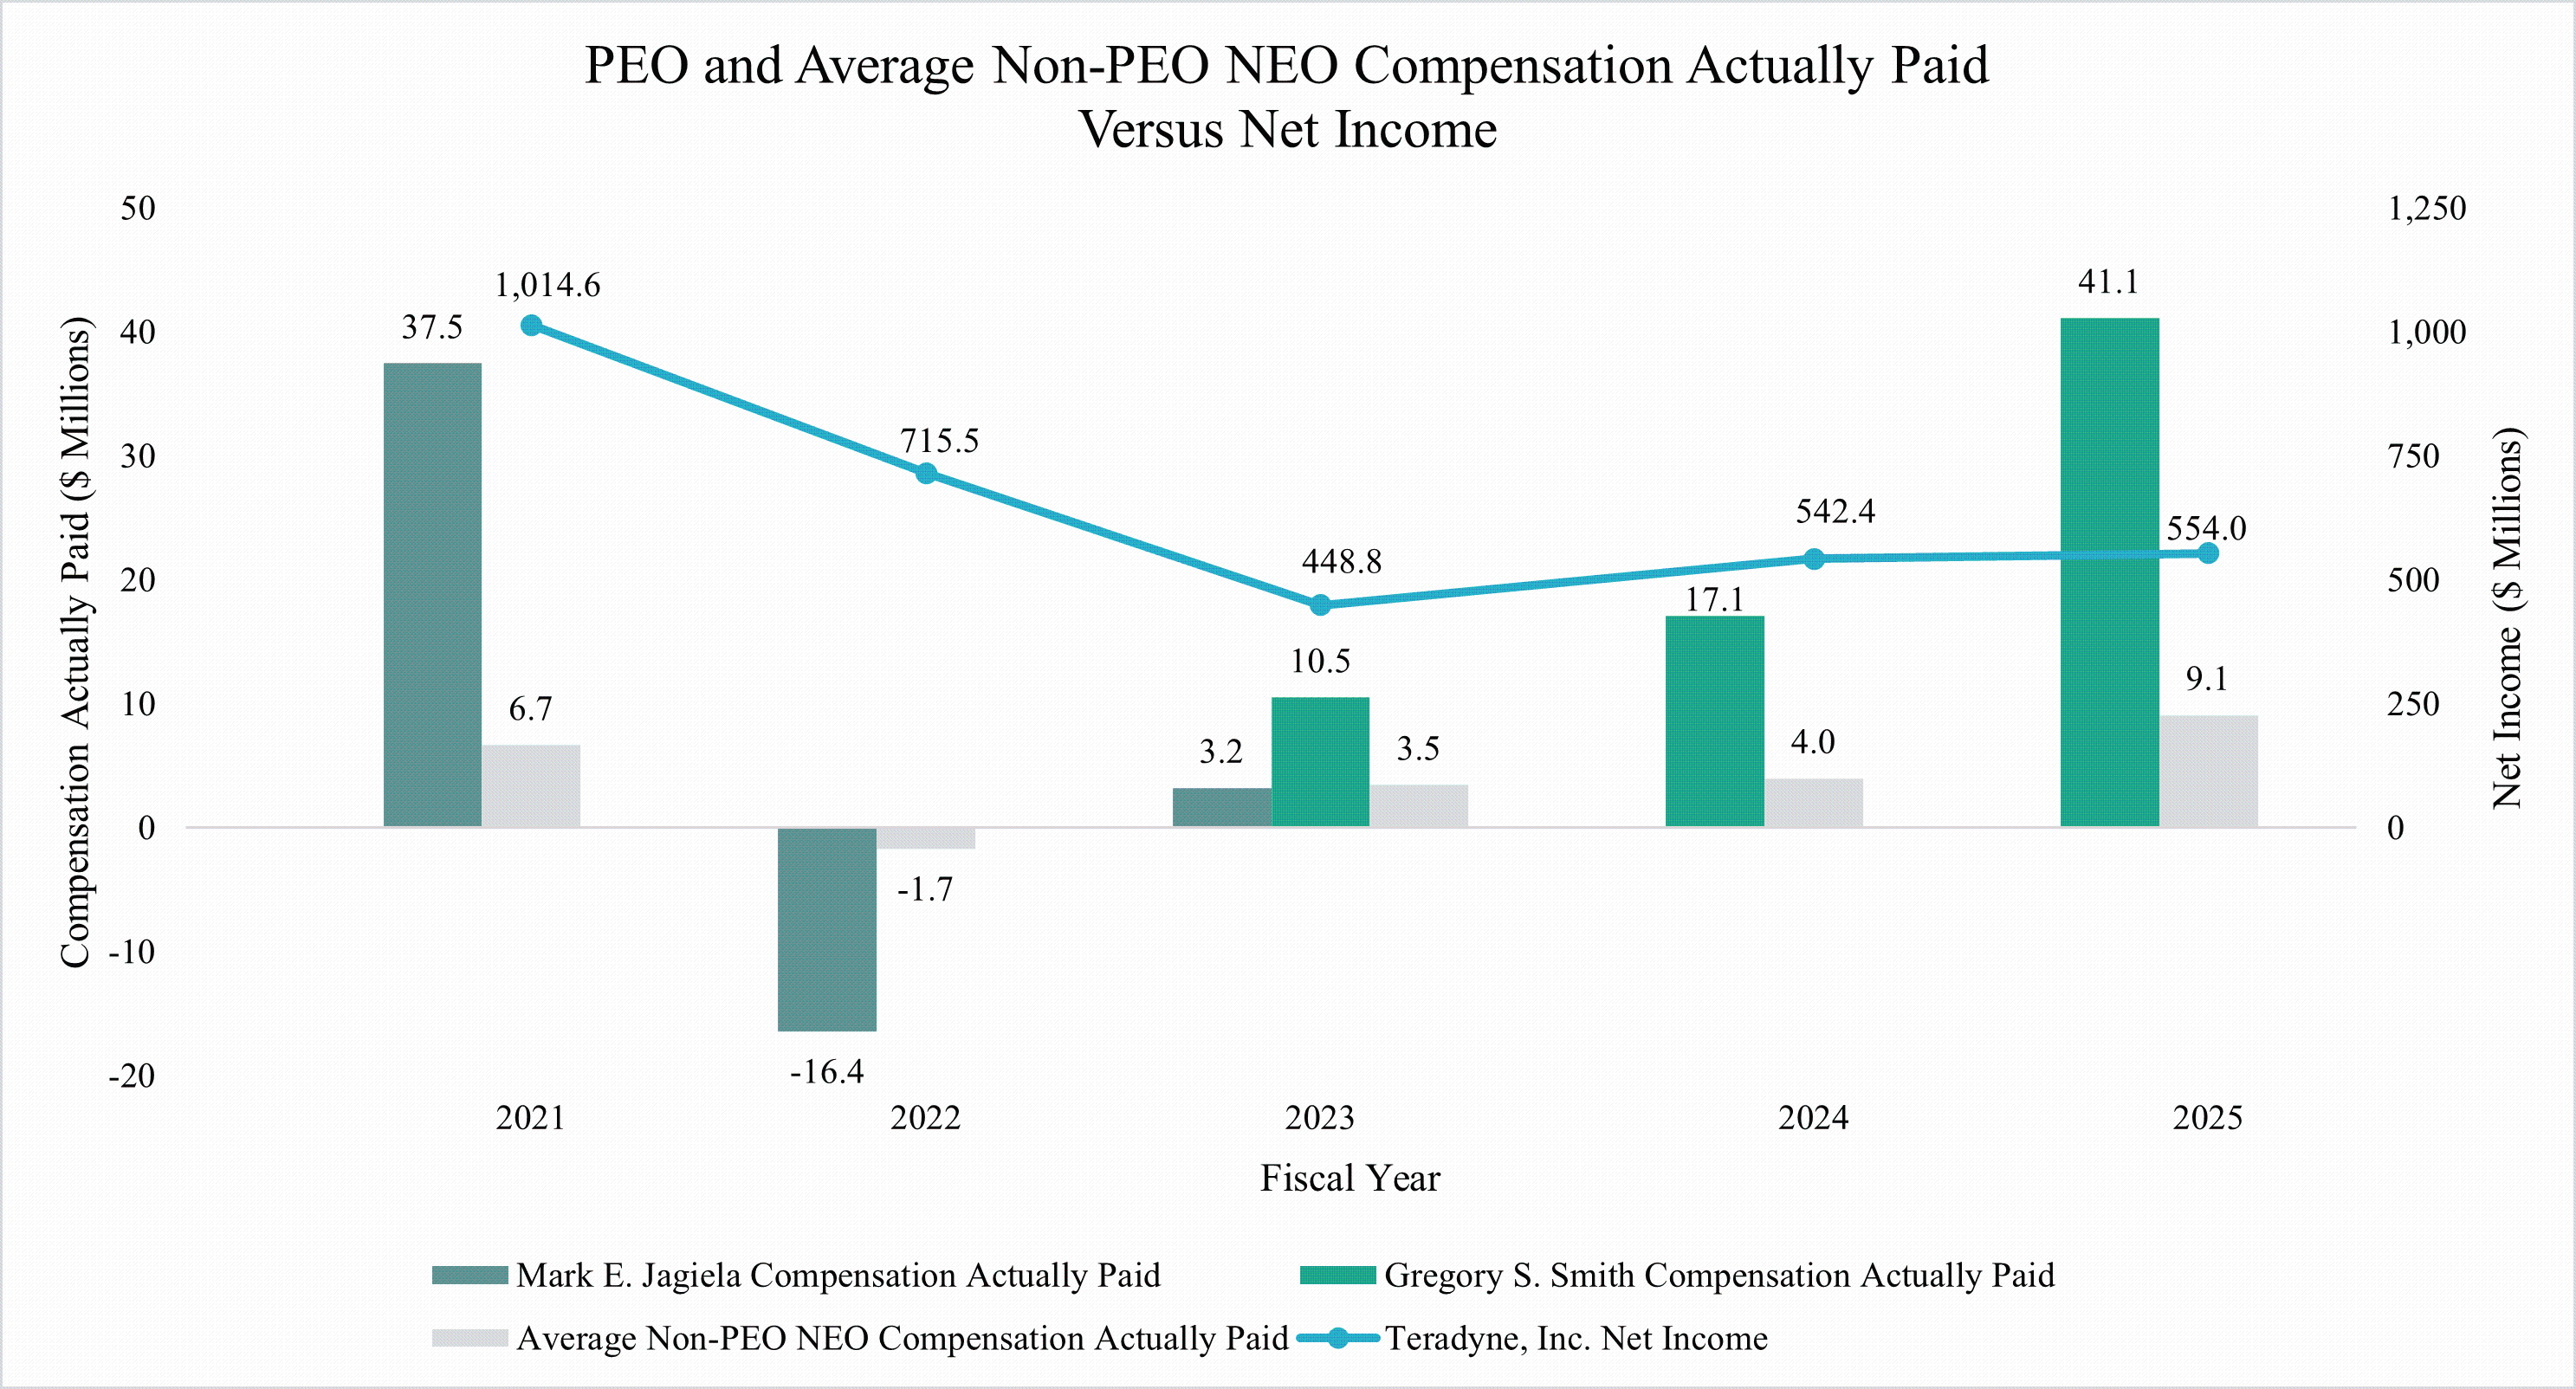
CEO compensation may appear higher than net income or TSR due to the timing and valuation of long-term incentive awards. The SEC’s definition of 'compensation actually paid' includes changes in the fair value of equity awards, which can fluctuate significantly based on stock price movements and vesting schedules.
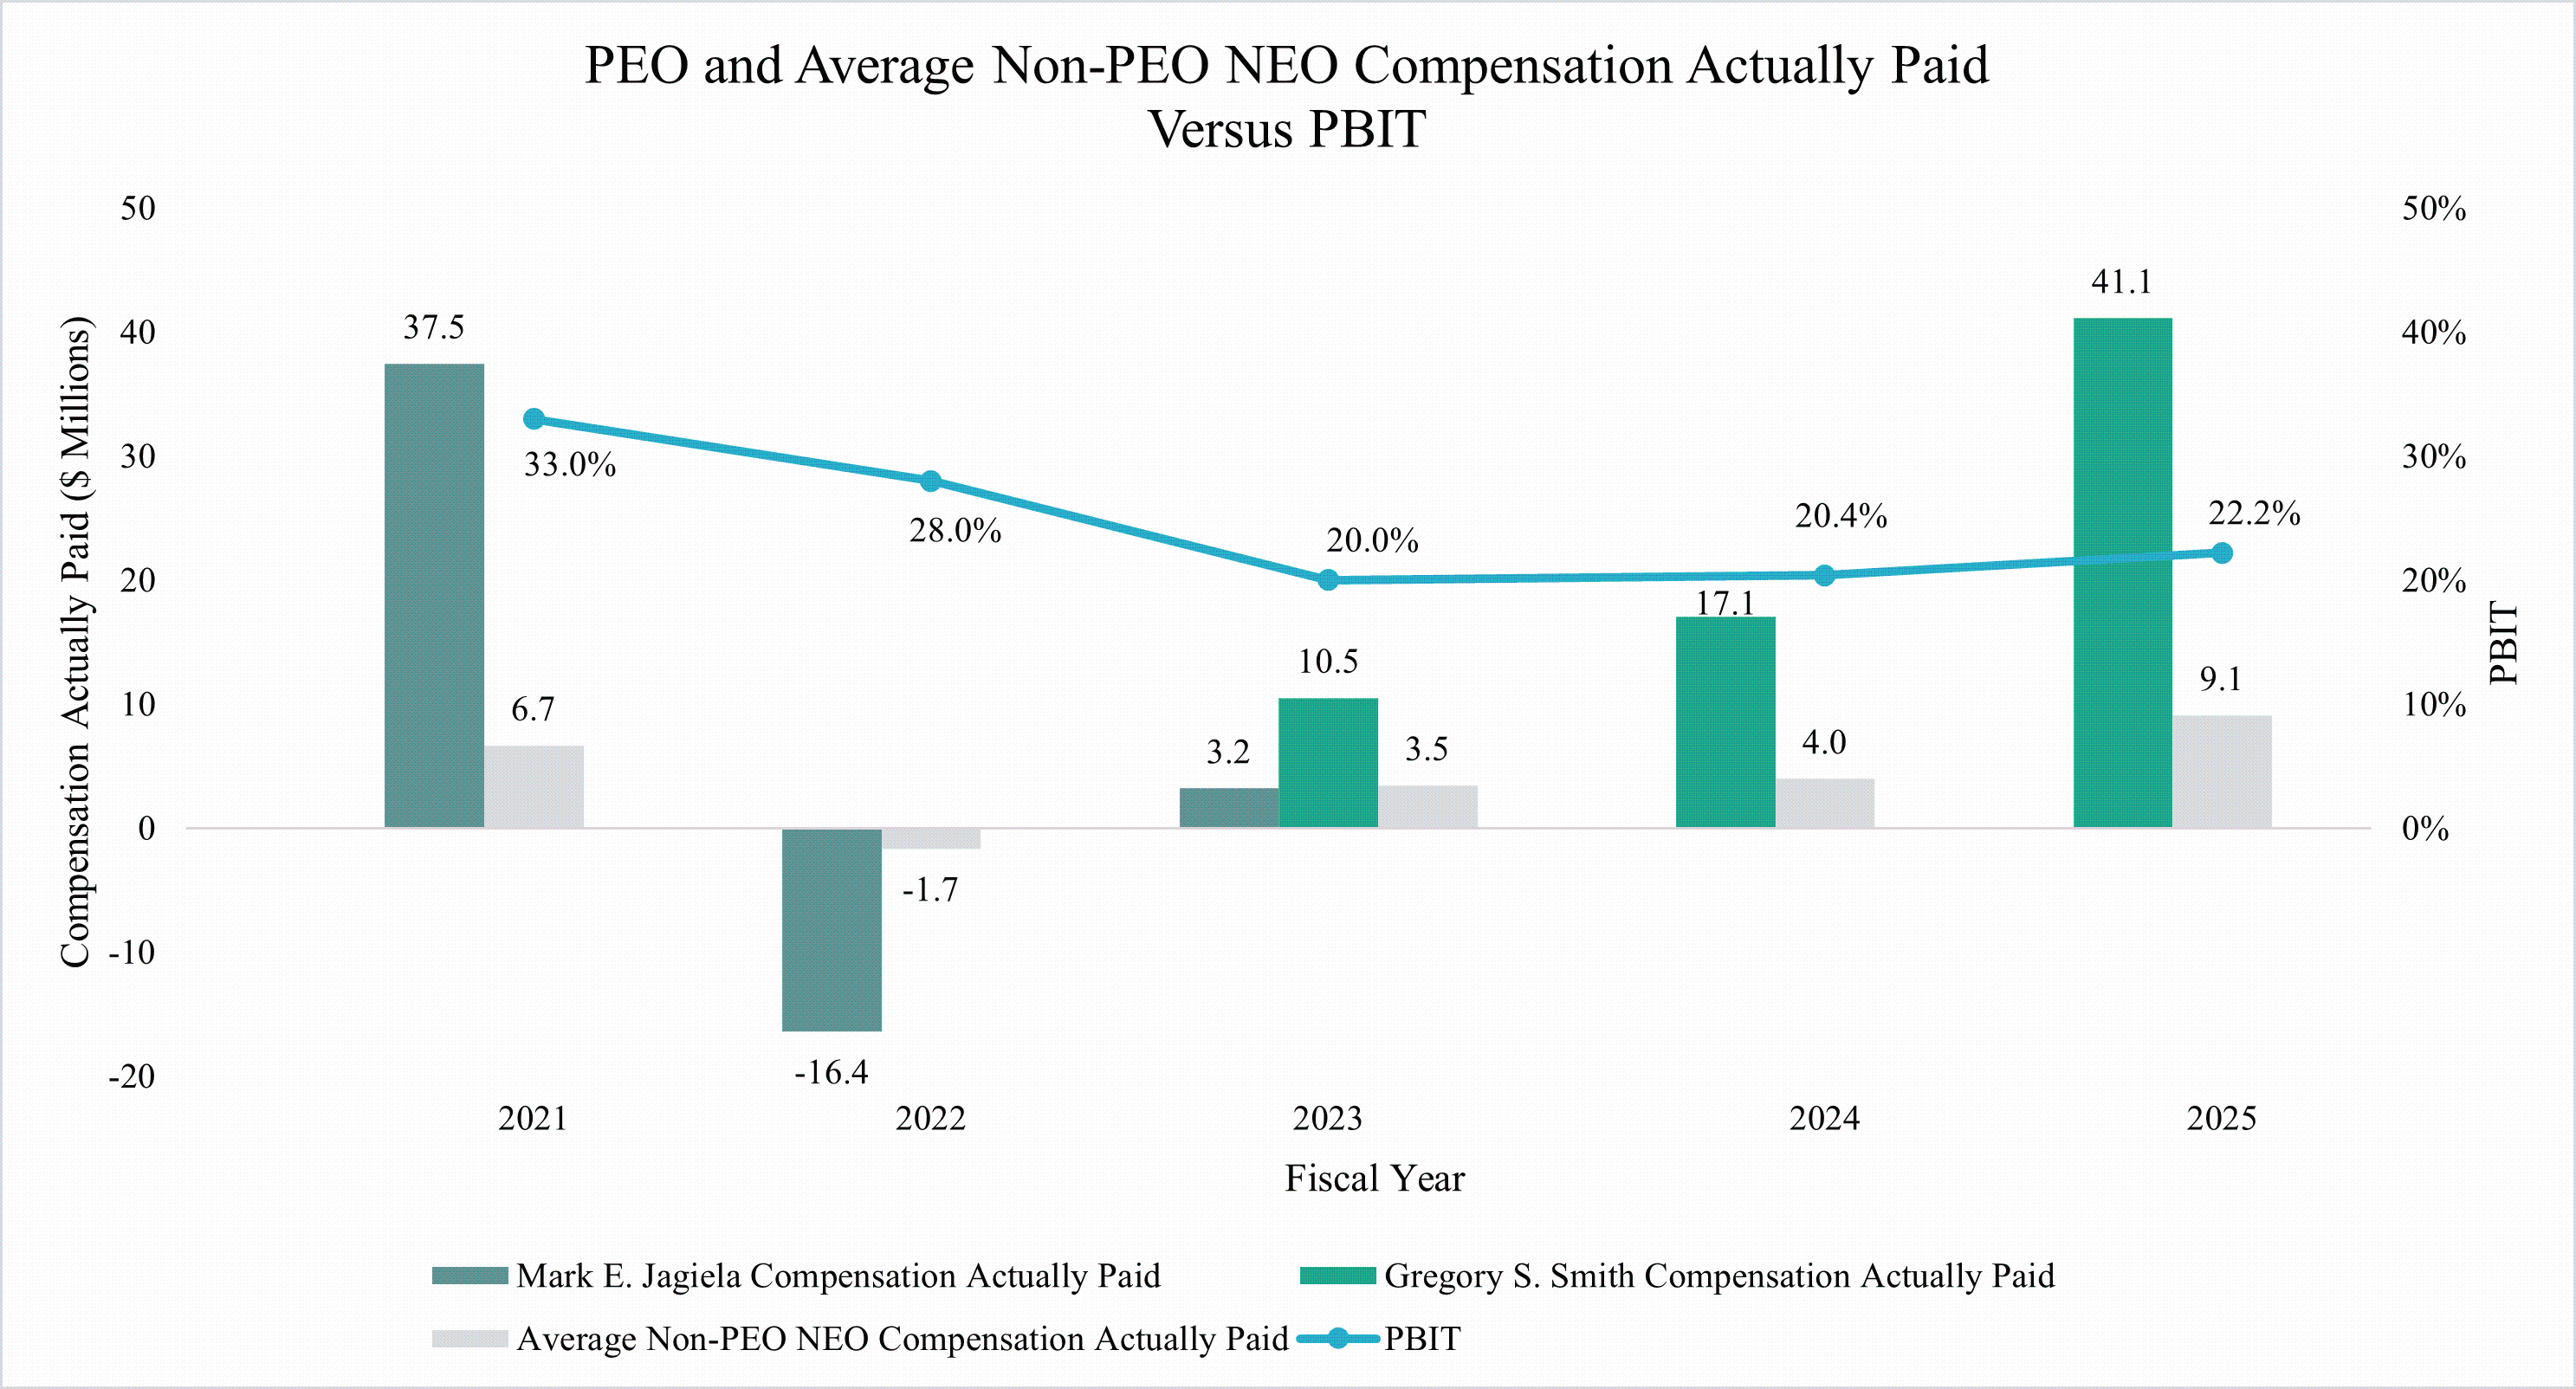
Relationship Between PEOs and Non-PEO NEO Compensation Actually Paid and PBIT
The following chart sets forth the relationship between Compensation Actually Paid to our PEOs, the average of Compensation Actually Paid to our Non-PEO NEOs and our PBIT during the five most recently completed fiscal years.
Tabular List of Most Important Financial Performance Measures
The following tabular list presents the financial performance measures that the Company considers to have been the most important in linking Compensation Actually Paid to our PEO and other Non-PEO NEOs for 2025 to Company performance. The measures in this list are not ranked.
Annual PBIT (component of NEO variable compensation) Two-year rolling revenue growth rate (component of NEO variable compensation) Three-year cumulative PBIT (component of NEO performance-based RSU awards) Three-year TSR (component of NEO performance-based RSU awards) |
2021 |
2022 |
2023 |
2024 |
2025 |
Gregory S. Smith |
Gregory S. Smith |
Sanjay Mehta |
Sanjay Mehta |
Sanjay Mehta |
Sanjay Mehta |
Sanjay Mehta |
Charles J. Gray |
Ryan Driscoll |
Ryan Driscoll |
Charles J. Gray |
Charles J. Gray |
Richard J. Burns |
Richard J. Burns |
Michelle Turner |
Bradford B. Robbins |
Richard J. Burns |
Ujjwal Kumar |
Ujjwal Kumar |
Regan Mills |
|
|
|
|
Shannon Poulin |
Year |
Summary |
|
Exclusion of Change in Pension Value for Second PEO |
|
Exclusion of |
|
Inclusion of Pension Service Cost for Second PEO |
|
Inclusion of |
|
Compensation |
|
||||||
2025 |
|
14,107,588 |
|
|
— |
|
|
(11,219,848 |
) |
|
— |
|
|
38,248,737 |
|
|
41,136,477 |
|
Year |
Average |
|
Average Exclusion of Change in Pension Value for Non-PEO NEOs |
|
Average |
|
Average Inclusion of Pension Service Cost for Non-PEO NEOs |
|
Average |
|
Average |
|
||||||
2025 |
|
4,891,214 |
|
|
(424 |
) |
|
(3,520,928 |
) |
|
— |
|
|
7,735,594 |
|
|
9,105,456 |
|
The amounts in the Inclusion of Equity Values in the tables above are derived from the amounts set forth in the following tables:
Year |
Year-End Fair |
|
Change in Fair |
|
Vesting-Date Fair |
|
Change in Fair |
|
Fair Value at Last |
|
Value of |
|
Total-Inclusion |
|
|||||||
2025 |
|
22,274,195 |
|
|
16,252,281 |
|
|
— |
|
|
(277,739 |
) |
|
— |
|
|
— |
|
|
38,248,737 |
|
Year |
Average Year |
|
Average Change |
|
Average Vesting- |
|
Average Change |
|
Average Fair |
|
Average Value of |
|
Total - Average |
|
|||||||
2025 |
|
6,173,591 |
|
|
1,597,732 |
|
|
— |
|
|
(35,729 |
) |
|
— |
|
|
— |
|
|
7,735,594 |
|
Year |
Summary |
|
Exclusion of Change in Pension Value for Second PEO |
|
Exclusion of |
|
Inclusion of Pension Service Cost for Second PEO |
|
Inclusion of |
|
Compensation |
|
||||||
2025 |
|
14,107,588 |
|
|
— |
|
|
(11,219,848 |
) |
|
— |
|
|
38,248,737 |
|
|
41,136,477 |
|
Year |
Average |
|
Average Exclusion of Change in Pension Value for Non-PEO NEOs |
|
Average |
|
Average Inclusion of Pension Service Cost for Non-PEO NEOs |
|
Average |
|
Average |
|
||||||
2025 |
|
4,891,214 |
|
|
(424 |
) |
|
(3,520,928 |
) |
|
— |
|
|
7,735,594 |
|
|
9,105,456 |
|
The amounts in the Inclusion of Equity Values in the tables above are derived from the amounts set forth in the following tables:
Year |
Year-End Fair |
|
Change in Fair |
|
Vesting-Date Fair |
|
Change in Fair |
|
Fair Value at Last |
|
Value of |
|
Total-Inclusion |
|
|||||||
2025 |
|
22,274,195 |
|
|
16,252,281 |
|
|
— |
|
|
(277,739 |
) |
|
— |
|
|
— |
|
|
38,248,737 |
|
Year |
Average Year |
|
Average Change |
|
Average Vesting- |
|
Average Change |
|
Average Fair |
|
Average Value of |
|
Total - Average |
|
|||||||
2025 |
|
6,173,591 |
|
|
1,597,732 |
|
|
— |
|
|
(35,729 |
) |
|
— |
|
|
— |
|
|
7,735,594 |
|
Relationship Between PEO and Non-PEO NEO Compensation Actually Paid and Company and Peer Group Total Shareholder Return
The following chart sets forth the relationship between Compensation Actually Paid to our PEOs, the average of Compensation Actually Paid to our Non-PEO NEOs, the Company’s cumulative TSR over the five most recently completed fiscal years, and the Peer Group’s TSR over the same period.
Relationship Between PEO and Non-PEO NEO Compensation Actually Paid and Net Income
The following chart sets forth the relationship between Compensation Actually Paid to our PEOs, the average of Compensation Actually Paid to our Non-PEO NEOs, and our net income during the five most recently completed fiscal years.
Relationship Between PEOs and Non-PEO NEO Compensation Actually Paid and PBIT
The following chart sets forth the relationship between Compensation Actually Paid to our PEOs, the average of Compensation Actually Paid to our Non-PEO NEOs and our PBIT during the five most recently completed fiscal years.
Relationship Between PEO and Non-PEO NEO Compensation Actually Paid and Company and Peer Group Total Shareholder Return
The following chart sets forth the relationship between Compensation Actually Paid to our PEOs, the average of Compensation Actually Paid to our Non-PEO NEOs, the Company’s cumulative TSR over the five most recently completed fiscal years, and the Peer Group’s TSR over the same period.
Tabular List of Most Important Financial Performance Measures
The following tabular list presents the financial performance measures that the Company considers to have been the most important in linking Compensation Actually Paid to our PEO and other Non-PEO NEOs for 2025 to Company performance. The measures in this list are not ranked.
Annual PBIT (component of NEO variable compensation) Two-year rolling revenue growth rate (component of NEO variable compensation) Three-year cumulative PBIT (component of NEO performance-based RSU awards) Three-year TSR (component of NEO performance-based RSU awards) |