Pay vs Performance Disclosure
|
12 Months Ended |
|
Dec. 31, 2025
USD ($)
|
Dec. 31, 2024
USD ($)
|
Dec. 31, 2023
USD ($)
|
Dec. 31, 2022
USD ($)
|
Dec. 31, 2021
USD ($)
|
| Pay vs Performance Disclosure |
|
|
|
|
|
| Pay vs Performance Disclosure, Table |
2025 Pay Versus Performance The following table and supporting narrative contain information regarding “compensation actually paid” to our NEOs and the relationship to company performance Pay Versus Performance Table
|
|
|
|
|
|
|
|
|
|
|
Year |
Summary Compensation Table Total for PEO 1 (Hess) ($) (1) |
Compensation Actually Paid to PEO 1 (Hess) ($) (1) (2) (8) |
Summary Compensation Table Total for PEO 2 (Haley) ($) (3) |
Compensation Actually Paid to PEO 2 (Haley) ($) (2) (3) (8) |
Average Summary Compensation Table Total for Non-PEO NEOs ($) (4) |
Average Compensation Actually Paid to Non-PEO NEOs ($) (2) (4) (8) |
Value of Initial Fixed $100 Investment on December 31, 2020 Based on: |
Net Income/ Loss ($) (6) |
Adjusted Operating Margin (7) |
|
|
|
|
|
|
|
Total Shareholder Return ($) |
Peer Group Total Shareholder Return ($) (5) |
|
|
2025 |
12,793,605 |
21,693,892 |
N/A |
N/A |
4,151,894 |
5,574,033 |
167 |
137 |
1,605 |
25.2% |
2024 |
12,502,090 |
22,045,479 |
N/A |
N/A |
4,474,450 |
5,846,853 |
157 |
158 |
(98) |
23.9% |
2023 |
12,668,832 |
17,266,044 |
N/A |
N/A |
3,186,370 |
3,309,249 |
119 |
128 |
1,055 |
22.0% |
2022 |
10,728,900 |
11,413,081 |
N/A |
N/A |
2,777,755 |
3,077,416 |
119 |
111 |
1,009 |
20.9% |
2021 |
N/A |
N/A |
20,337,292 |
14,552,522 |
3,678,933 |
2,107,221 |
114 |
123 |
4,222 |
19.9% |
|
|
|
|
|
|
|
|
|
|
|
(1)Reflects compensation for our Chief Executive Officer, Mr. Hess, who served as our Principal Executive Officer ("PEO") in 2022, 2023, 2024 and 2025. (2)“Compensation actually paid” has been calculated in accordance with the rules outlined under Item 402(v)(2) of Regulation S-K. Details of the adjustments made to reported Summary Compensation Table total compensation for 2025 to determine “compensation actually paid” are summarized below in footnote (8). (3)Reflects compensation for our former Chief Executive Officer, Mr. Haley, who served as our PEO in 2021. (4)Reflects compensation for the following non-PEO NEOs: •2025: Mr. Krasner, Ms. Gebauer, Ms. Clarke and Mr. Furman •2024: Mr. Krasner, Ms. Gebauer, Ms. Clarke, Mr. Furman and Mr. Garrard •2023 and 2022: Mr. Krasner, Ms. Gebauer, Mr. Garrard and Mr. Furman •2021: Mr. Krasner, Mr. Burwell, Mr. Hess, Ms. Gebauer and Mr. Furman (5)The peer group used for TSR comparisons reflects our compensation benchmarking peer group as disclosed in the CD&A for each year. The peer group comprises the following companies for each year: •2025: Aon plc, Arch Capital Group Ltd., Arthur J. Gallagher & Co., Automatic Data Processing, Inc., Booz Allen Hamilton Holding Corporation, Brown & Brown, Inc., Cognizant Technology Solutions Corporation, Fidelity National Financial, Inc., Fidelity National Information Services, Inc., First American Financial Corporation, Fiserv, Inc., Marsh & McLennan Companies, Inc., Principal Financial Group, Inc., Robert Half Inc., S&P Global Inc., Unum Group. •2024, 2023 and 2022: Aon plc, Arthur J. Gallagher & Co., Automatic Data Processing, Inc., Booz Allen Hamilton Holding Corporation, Cognizant Technology Solutions Corporation, Conduent Incorporated, Fidelity National Financial, Inc., Fidelity National Information Services, Inc., First American Financial Corporation, Fiserv, Inc., Marsh & McLennan Companies, Inc., Principal Financial Group, Inc., Robert Half Inc., S&P Global Inc., The Hartford Financial Services Group, Inc., Unum Group. •2021: Aon plc, Arthur J. Gallagher & Co., Automatic Data Processing, Inc., Booz Allen Hamilton Holding Corporation, Cognizant Technology Solutions Corporation, Conduent Incorporated, Fidelity National Financial, Inc., Fidelity National Information Services, Inc., First American Financial Corporation, Fiserv, Inc., Marsh & McLennan Companies, Inc., Nielsen Holdings plc, Principal Financial Group, Inc., Robert Half Inc., S&P Global Inc., The Hartford Financial Services Group, Inc., Unum Group. (6)Reflects WTW’s consolidated reported net income in millions, calculated on a GAAP basis, as reported in our Annual Report on Form 10-K for the relevant year. (7)For 2024 and 2025 we have designated Adjusted Operating Margin as our “Company-Selected Measure,” reflecting our view that it is the most important financial performance measure (not otherwise required to be disclosed in the table) linking “compensation actually paid” to Company performance, given its role in our LTIP. In 2023 and 2022, we identified Adjusted Net Revenue as our Company-Selected Measure. We may designate a different financial performance measure as our Company-Selected Measure in future years. (8)The following adjustments were made to Summary Compensation Table total compensation to determine “compensation actually paid” for our NEOs:
|
|
|
Adjustments |
2025 |
PEO ($) |
Non-PEO NEO Average ($) |
Summary Compensation Table Total |
12,793,605 |
4,151,894 |
Deduction for amount reported in “Share Awards” column of the Summary Compensation Table |
(9,182,185) |
(2,125,120) |
Addition of fair value at fiscal year (“FY”) end, of equity awards granted during the FY that remained outstanding (a) |
9,086,328 |
2,102,934 |
Addition of change in fair value at FY end versus prior FY end for awards granted in prior FY that remained outstanding (a) |
7,402,695 |
937,794 |
Addition of change in fair value at vesting date versus prior FY end for awards granted in prior FY that vested during the FY (a) |
1,040,942 |
165,385 |
Addition in respect of any dividends or other earnings paid during applicable FY prior to vesting date of underlying award |
553,405 |
344,505 |
Deduction for values reported in the“Change in Pension Value and Non-Qualified Deferred Compensation Earnings” column of the Summary Compensation Table |
(30,094) |
(16,690) |
Addition for the Service Cost attributable to services rendered during the FY (b) |
29,196 |
13,331 |
Compensation Actually Paid |
21,693,892 |
5,574,033 |
(a)The equity awards included above comprise PSUs and RSUs granted from 2020 through 2024. The fair values of the equity awards were calculated using valuation assumptions that materially differ from those disclosed at the time of grant, including: (1) the fair value of RSU awards was calculated using the closing price of our common shares as of the last day of the applicable year or on the date of vesting, as applicable; (2) the fair value of PSU awards was estimated using the closing price of our common shares as of the last day of the applicable year and adjusted for management’s estimate of performance as of the end of the year. (b)For disclosures of all significant assumptions used by the Willis Towers Watson Pension Plan for U.S. employees, please refer to our consolidated financial statements included in our Annual Report on Form 10-K for the year ended December 31, 2025. The table below provides a limited summary of the assumptions used to determine service costs for the purposes of “compensation actually paid”:
|
|
|
Year |
Effective Discount Rate |
Assumed Salary Increase Rate |
2025 |
5.79% |
4.00% |
|
|
|
|
|
| Company Selected Measure Name |
Adjusted Operating Margin
|
Adjusted Operating Margin
|
|
|
|
| Named Executive Officers, Footnote |
(4)Reflects compensation for the following non-PEO NEOs: •2025: Mr. Krasner, Ms. Gebauer, Ms. Clarke and Mr. Furman •2024: Mr. Krasner, Ms. Gebauer, Ms. Clarke, Mr. Furman and Mr. Garrard •2023 and 2022: Mr. Krasner, Ms. Gebauer, Mr. Garrard and Mr. Furman •2021: Mr. Krasner, Mr. Burwell, Mr. Hess, Ms. Gebauer and Mr. Furman
|
|
|
|
|
| Peer Group Issuers, Footnote |
(5)The peer group used for TSR comparisons reflects our compensation benchmarking peer group as disclosed in the CD&A for each year. The peer group comprises the following companies for each year: •2025: Aon plc, Arch Capital Group Ltd., Arthur J. Gallagher & Co., Automatic Data Processing, Inc., Booz Allen Hamilton Holding Corporation, Brown & Brown, Inc., Cognizant Technology Solutions Corporation, Fidelity National Financial, Inc., Fidelity National Information Services, Inc., First American Financial Corporation, Fiserv, Inc., Marsh & McLennan Companies, Inc., Principal Financial Group, Inc., Robert Half Inc., S&P Global Inc., Unum Group. •2024, 2023 and 2022: Aon plc, Arthur J. Gallagher & Co., Automatic Data Processing, Inc., Booz Allen Hamilton Holding Corporation, Cognizant Technology Solutions Corporation, Conduent Incorporated, Fidelity National Financial, Inc., Fidelity National Information Services, Inc., First American Financial Corporation, Fiserv, Inc., Marsh & McLennan Companies, Inc., Principal Financial Group, Inc., Robert Half Inc., S&P Global Inc., The Hartford Financial Services Group, Inc., Unum Group. •2021: Aon plc, Arthur J. Gallagher & Co., Automatic Data Processing, Inc., Booz Allen Hamilton Holding Corporation, Cognizant Technology Solutions Corporation, Conduent Incorporated, Fidelity National Financial, Inc., Fidelity National Information Services, Inc., First American Financial Corporation, Fiserv, Inc., Marsh & McLennan Companies, Inc., Nielsen Holdings plc, Principal Financial Group, Inc., Robert Half Inc., S&P Global Inc., The Hartford Financial Services Group, Inc., Unum Group.
|
|
|
|
|
| Adjustment To PEO Compensation, Footnote |
(8)The following adjustments were made to Summary Compensation Table total compensation to determine “compensation actually paid” for our NEOs:
|
|
|
Adjustments |
2025 |
PEO ($) |
Non-PEO NEO Average ($) |
Summary Compensation Table Total |
12,793,605 |
4,151,894 |
Deduction for amount reported in “Share Awards” column of the Summary Compensation Table |
(9,182,185) |
(2,125,120) |
Addition of fair value at fiscal year (“FY”) end, of equity awards granted during the FY that remained outstanding (a) |
9,086,328 |
2,102,934 |
Addition of change in fair value at FY end versus prior FY end for awards granted in prior FY that remained outstanding (a) |
7,402,695 |
937,794 |
Addition of change in fair value at vesting date versus prior FY end for awards granted in prior FY that vested during the FY (a) |
1,040,942 |
165,385 |
Addition in respect of any dividends or other earnings paid during applicable FY prior to vesting date of underlying award |
553,405 |
344,505 |
Deduction for values reported in the“Change in Pension Value and Non-Qualified Deferred Compensation Earnings” column of the Summary Compensation Table |
(30,094) |
(16,690) |
Addition for the Service Cost attributable to services rendered during the FY (b) |
29,196 |
13,331 |
Compensation Actually Paid |
21,693,892 |
5,574,033 |
(a)The equity awards included above comprise PSUs and RSUs granted from 2020 through 2024. The fair values of the equity awards were calculated using valuation assumptions that materially differ from those disclosed at the time of grant, including: (1) the fair value of RSU awards was calculated using the closing price of our common shares as of the last day of the applicable year or on the date of vesting, as applicable; (2) the fair value of PSU awards was estimated using the closing price of our common shares as of the last day of the applicable year and adjusted for management’s estimate of performance as of the end of the year. (b)For disclosures of all significant assumptions used by the Willis Towers Watson Pension Plan for U.S. employees, please refer to our consolidated financial statements included in our Annual Report on Form 10-K for the year ended December 31, 2025. The table below provides a limited summary of the assumptions used to determine service costs for the purposes of “compensation actually paid”:
|
|
|
Year |
Effective Discount Rate |
Assumed Salary Increase Rate |
2025 |
5.79% |
4.00% |
|
|
|
|
|
| Non-PEO NEO Average Total Compensation Amount |
$ 4,151,894
|
$ 4,474,450
|
$ 3,186,370
|
$ 2,777,755
|
$ 3,678,933
|
| Non-PEO NEO Average Compensation Actually Paid Amount |
$ 5,574,033
|
5,846,853
|
3,309,249
|
3,077,416
|
2,107,221
|
| Adjustment to Non-PEO NEO Compensation Footnote |
(8)The following adjustments were made to Summary Compensation Table total compensation to determine “compensation actually paid” for our NEOs:
|
|
|
Adjustments |
2025 |
PEO ($) |
Non-PEO NEO Average ($) |
Summary Compensation Table Total |
12,793,605 |
4,151,894 |
Deduction for amount reported in “Share Awards” column of the Summary Compensation Table |
(9,182,185) |
(2,125,120) |
Addition of fair value at fiscal year (“FY”) end, of equity awards granted during the FY that remained outstanding (a) |
9,086,328 |
2,102,934 |
Addition of change in fair value at FY end versus prior FY end for awards granted in prior FY that remained outstanding (a) |
7,402,695 |
937,794 |
Addition of change in fair value at vesting date versus prior FY end for awards granted in prior FY that vested during the FY (a) |
1,040,942 |
165,385 |
Addition in respect of any dividends or other earnings paid during applicable FY prior to vesting date of underlying award |
553,405 |
344,505 |
Deduction for values reported in the“Change in Pension Value and Non-Qualified Deferred Compensation Earnings” column of the Summary Compensation Table |
(30,094) |
(16,690) |
Addition for the Service Cost attributable to services rendered during the FY (b) |
29,196 |
13,331 |
Compensation Actually Paid |
21,693,892 |
5,574,033 |
(a)The equity awards included above comprise PSUs and RSUs granted from 2020 through 2024. The fair values of the equity awards were calculated using valuation assumptions that materially differ from those disclosed at the time of grant, including: (1) the fair value of RSU awards was calculated using the closing price of our common shares as of the last day of the applicable year or on the date of vesting, as applicable; (2) the fair value of PSU awards was estimated using the closing price of our common shares as of the last day of the applicable year and adjusted for management’s estimate of performance as of the end of the year. (b)For disclosures of all significant assumptions used by the Willis Towers Watson Pension Plan for U.S. employees, please refer to our consolidated financial statements included in our Annual Report on Form 10-K for the year ended December 31, 2025. The table below provides a limited summary of the assumptions used to determine service costs for the purposes of “compensation actually paid”:
|
|
|
Year |
Effective Discount Rate |
Assumed Salary Increase Rate |
2025 |
5.79% |
4.00% |
|
|
|
|
|
| Compensation Actually Paid vs. Total Shareholder Return |
Compensation Actually Paid Versus Company and Peer TSR 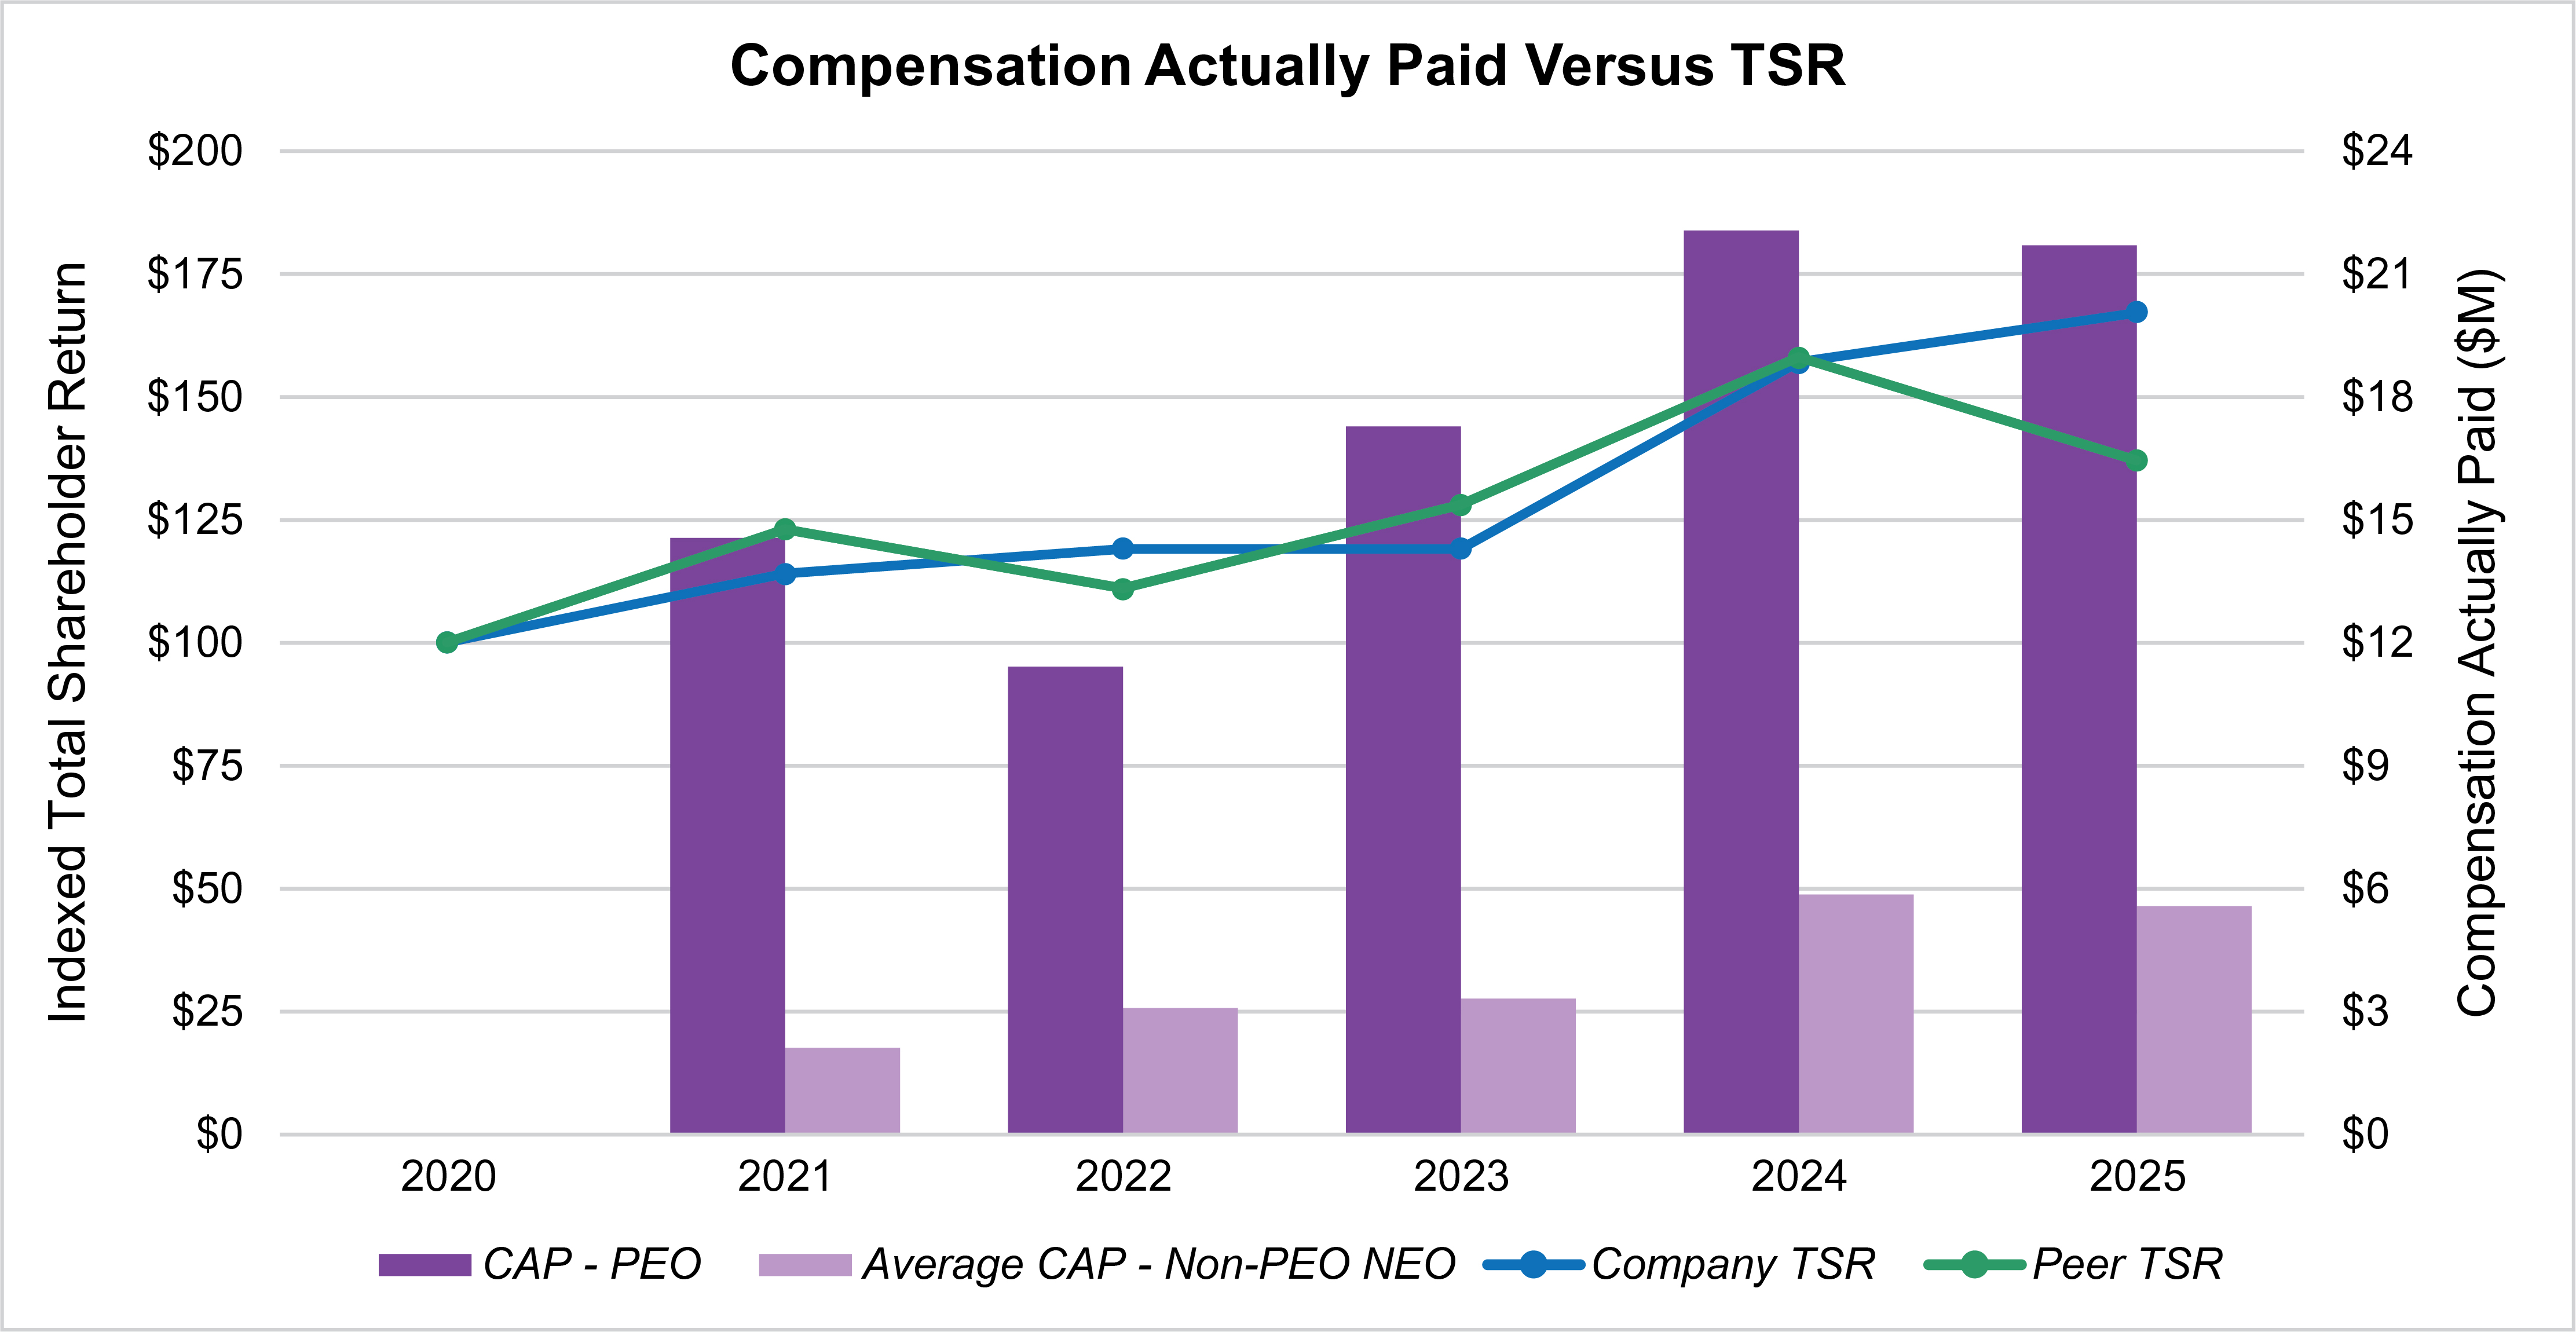
|
|
|
|
|
| Compensation Actually Paid vs. Net Income |
Compensation Actually Paid Versus GAAP Net Income 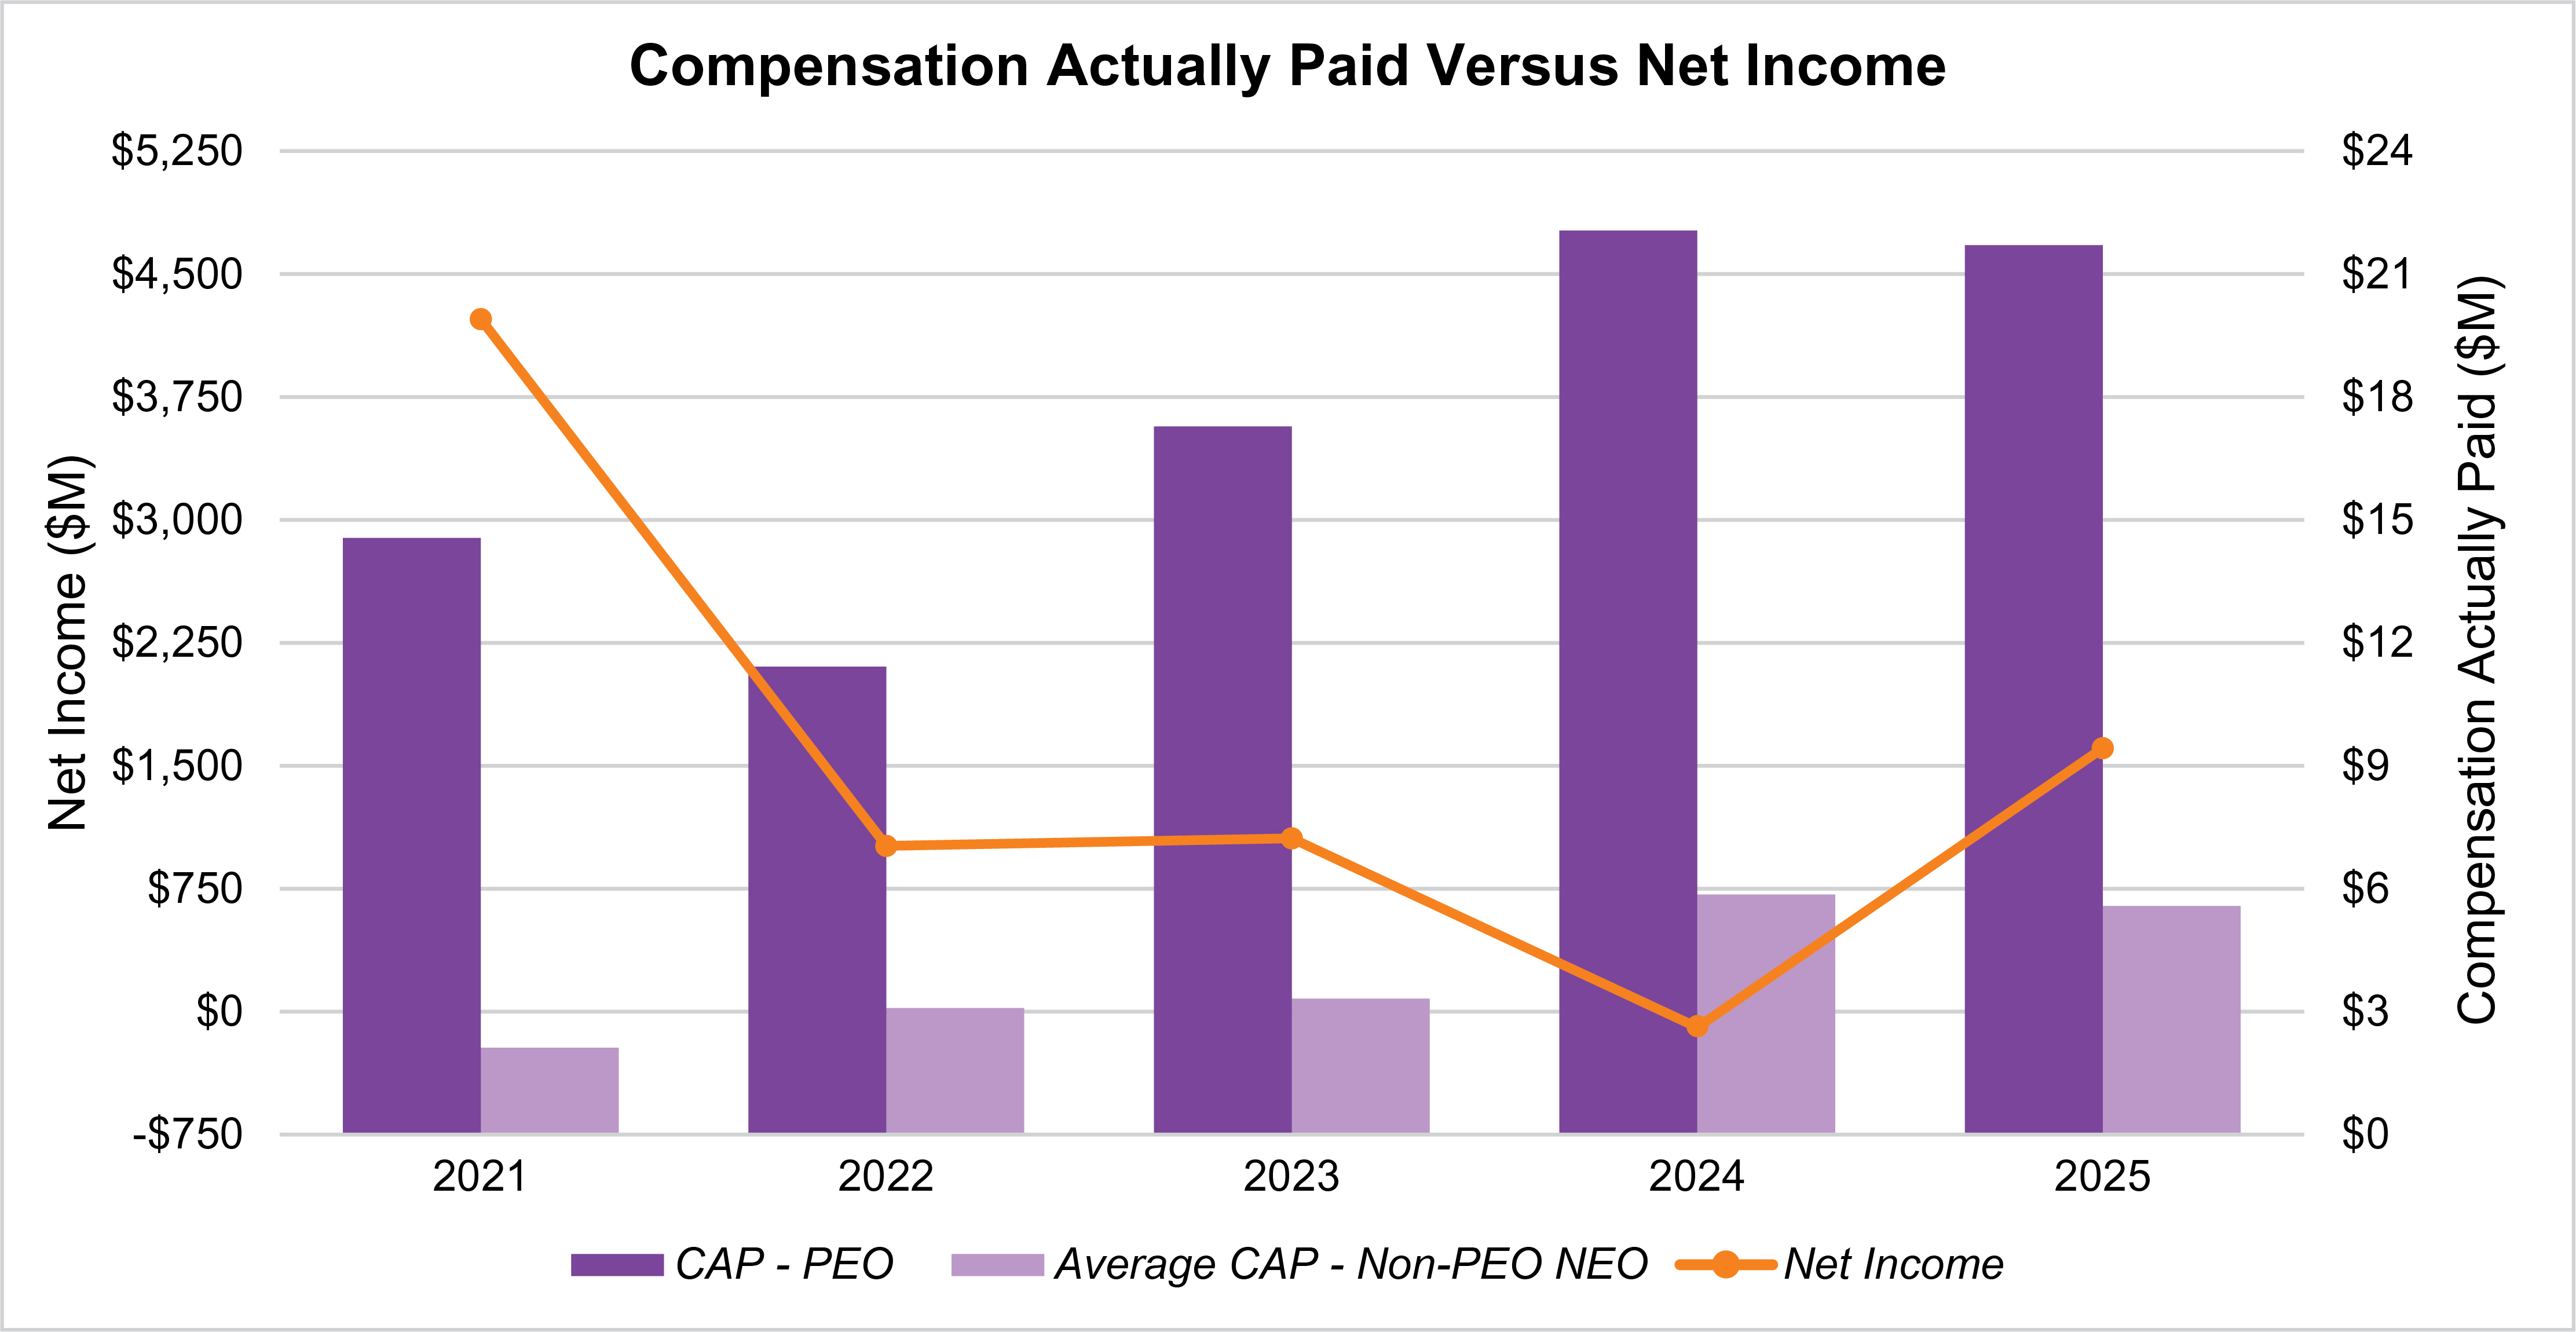
|
|
|
|
|
| Compensation Actually Paid vs. Company Selected Measure |
Compensation Actually Paid Versus Adjusted Operating Margin 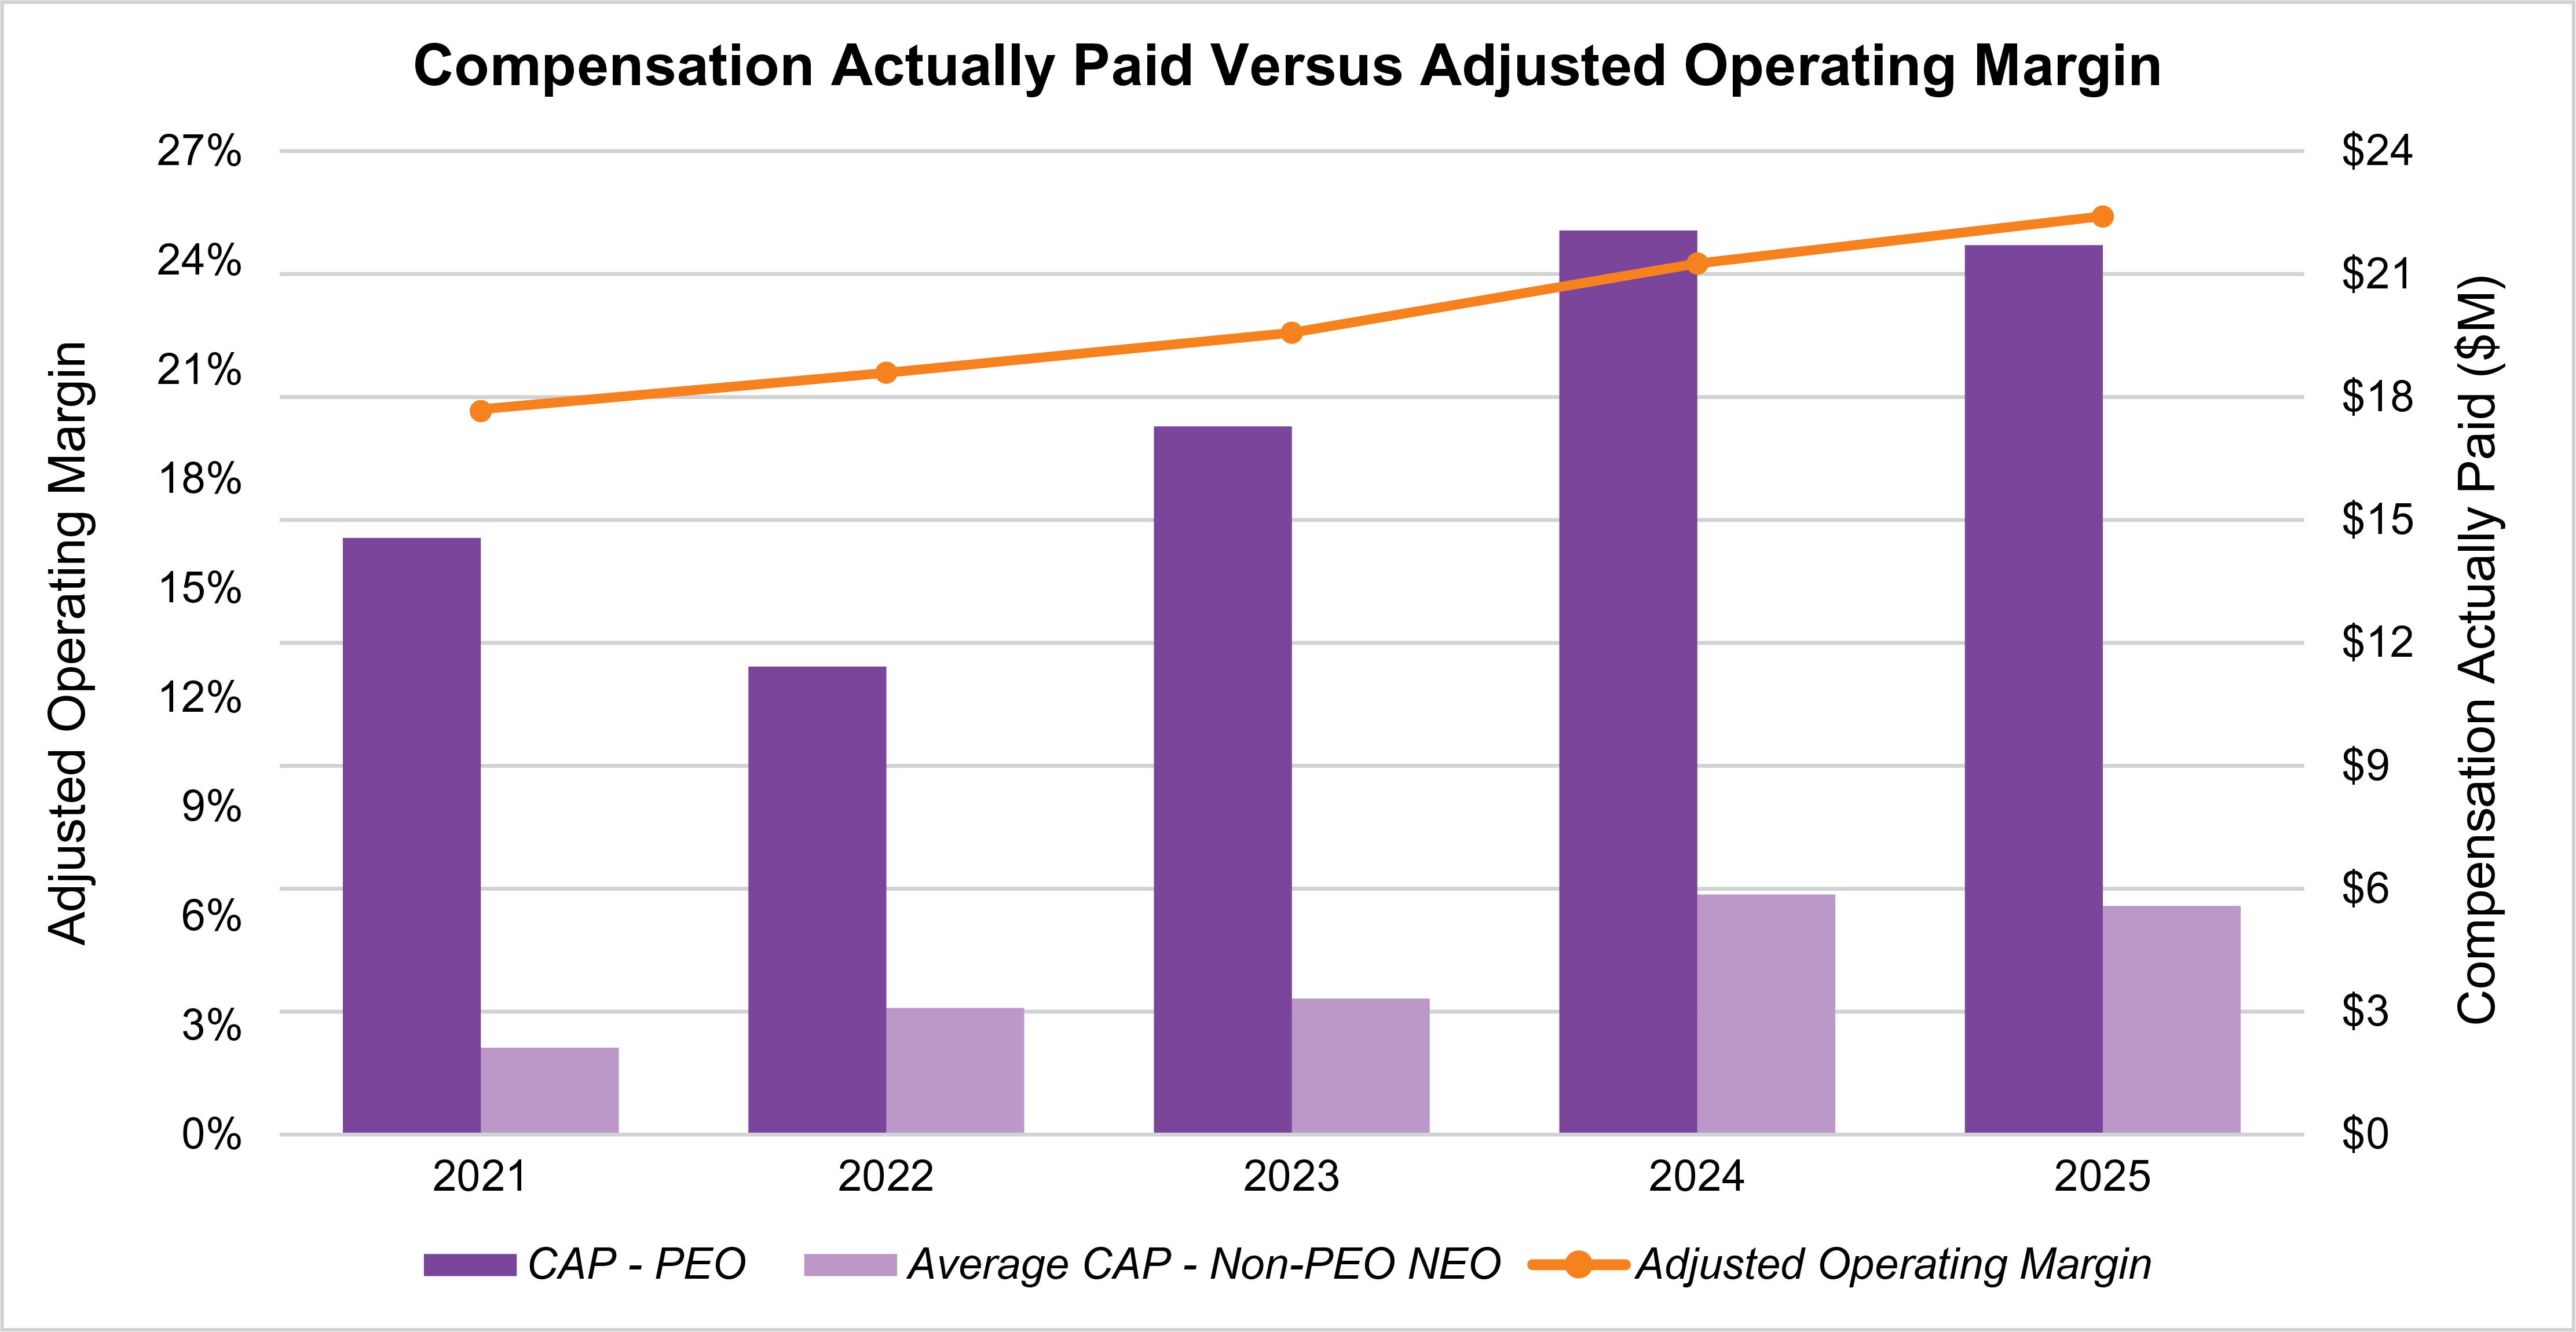
|
|
|
|
|
| Total Shareholder Return Vs Peer Group |
Compensation Actually Paid Versus Company and Peer TSR
|
|
|
|
|
| Tabular List, Table |
Tabular List of Company Performance Measures The following table alphabetically lists the measures we believe are most important in linking compensation actually paid to company performance during 2025.
|
Tabular List of Most Important Measures |
(3)Adjusted Net Revenue Growth (4)Adjusted Operating Margin (5)Adjusted Operating Margin Improvement |
|
|
|
|
|
| Total Shareholder Return Amount |
$ 167
|
157
|
119
|
119
|
114
|
| Peer Group Total Shareholder Return Amount |
137
|
158
|
128
|
111
|
123
|
| Net Income (Loss) |
$ 1,605,000,000
|
$ (98,000,000)
|
$ 1,055,000,000
|
$ 1,009,000,000
|
$ 4,222,000,000
|
| Company Selected Measure Amount |
0.252
|
0.239
|
0.22
|
0.209
|
0.199
|
| PEO Name |
Mr. Hess
|
Mr. Hess
|
Mr. Hess
|
Mr. Hess
|
Mr. Haley
|
| Effective discount rate |
5.79%
|
|
|
|
|
| Assumed salary increase rate |
4.00%
|
|
|
|
|
| Measure:: 1 |
|
|
|
|
|
| Pay vs Performance Disclosure |
|
|
|
|
|
| Name |
Adjusted EPS Growth
|
|
|
|
|
| Measure:: 2 |
|
|
|
|
|
| Pay vs Performance Disclosure |
|
|
|
|
|
| Name |
Adjusted Net Revenue
|
|
|
|
|
| Measure:: 3 |
|
|
|
|
|
| Pay vs Performance Disclosure |
|
|
|
|
|
| Name |
Adjusted Net Revenue Growth
|
|
|
|
|
| Measure:: 4 |
|
|
|
|
|
| Pay vs Performance Disclosure |
|
|
|
|
|
| Name |
Adjusted Operating Margin
|
|
|
|
|
| Non-GAAP Measure Description |
(7)For 2024 and 2025 we have designated Adjusted Operating Margin as our “Company-Selected Measure,” reflecting our view that it is the most important financial performance measure (not otherwise required to be disclosed in the table) linking “compensation actually paid” to Company performance, given its role in our LTIP. In 2023 and 2022, we identified Adjusted Net Revenue as our Company-Selected Measure. We may designate a different financial performance measure as our Company-Selected Measure in future years.
|
|
|
|
|
| Measure:: 5 |
|
|
|
|
|
| Pay vs Performance Disclosure |
|
|
|
|
|
| Name |
Adjusted Operating Margin Improvement
|
|
|
|
|
| Measure:: 6 |
|
|
|
|
|
| Pay vs Performance Disclosure |
|
|
|
|
|
| Name |
Free Cash Flow Margin
|
|
|
|
|
| Measure:: 7 |
|
|
|
|
|
| Pay vs Performance Disclosure |
|
|
|
|
|
| Name |
Relative TSR
|
|
|
|
|
| Mr.Carl Hess [Member] |
|
|
|
|
|
| Pay vs Performance Disclosure |
|
|
|
|
|
| PEO Total Compensation Amount |
$ 12,793,605
|
$ 12,502,090
|
$ 12,668,832
|
$ 10,728,900
|
|
| PEO Actually Paid Compensation Amount |
21,693,892
|
$ 22,045,479
|
$ 17,266,044
|
$ 11,413,081
|
|
| Mr.Haley [Member] |
|
|
|
|
|
| Pay vs Performance Disclosure |
|
|
|
|
|
| PEO Total Compensation Amount |
|
|
|
|
$ 20,337,292
|
| PEO Actually Paid Compensation Amount |
|
|
|
|
$ 14,552,522
|
| PEO | Mr.Carl Hess [Member] | Aggregate Change in Present Value of Accumulated Benefit for All Pension Plans Reported in Summary Compensation Table |
|
|
|
|
|
| Pay vs Performance Disclosure |
|
|
|
|
|
| Adjustment to Compensation, Amount |
(30,094)
|
|
|
|
|
| PEO | Mr.Carl Hess [Member] | Pension Adjustments Service Cost |
|
|
|
|
|
| Pay vs Performance Disclosure |
|
|
|
|
|
| Adjustment to Compensation, Amount |
29,196
|
|
|
|
|
| PEO | Mr.Carl Hess [Member] | Aggregate Grant Date Fair Value of Equity Award Amounts Reported in Summary Compensation Table |
|
|
|
|
|
| Pay vs Performance Disclosure |
|
|
|
|
|
| Adjustment to Compensation, Amount |
(9,182,185)
|
|
|
|
|
| PEO | Mr.Carl Hess [Member] | Year-end Fair Value of Equity Awards Granted in Covered Year that are Outstanding and Unvested |
|
|
|
|
|
| Pay vs Performance Disclosure |
|
|
|
|
|
| Adjustment to Compensation, Amount |
9,086,328
|
|
|
|
|
| PEO | Mr.Carl Hess [Member] | Year-over-Year Change in Fair Value of Equity Awards Granted in Prior Years That are Outstanding and Unvested |
|
|
|
|
|
| Pay vs Performance Disclosure |
|
|
|
|
|
| Adjustment to Compensation, Amount |
7,402,695
|
|
|
|
|
| PEO | Mr.Carl Hess [Member] | Change in Fair Value as of Vesting Date of Prior Year Equity Awards Vested in Covered Year |
|
|
|
|
|
| Pay vs Performance Disclosure |
|
|
|
|
|
| Adjustment to Compensation, Amount |
1,040,942
|
|
|
|
|
| PEO | Mr.Carl Hess [Member] | Dividends or Other Earnings Paid on Equity Awards not Otherwise Reflected in Total Compensation for Covered Year |
|
|
|
|
|
| Pay vs Performance Disclosure |
|
|
|
|
|
| Adjustment to Compensation, Amount |
553,405
|
|
|
|
|
| Non-PEO NEO | Aggregate Change in Present Value of Accumulated Benefit for All Pension Plans Reported in Summary Compensation Table |
|
|
|
|
|
| Pay vs Performance Disclosure |
|
|
|
|
|
| Adjustment to Compensation, Amount |
(16,690)
|
|
|
|
|
| Non-PEO NEO | Pension Adjustments Service Cost |
|
|
|
|
|
| Pay vs Performance Disclosure |
|
|
|
|
|
| Adjustment to Compensation, Amount |
13,331
|
|
|
|
|
| Non-PEO NEO | Aggregate Grant Date Fair Value of Equity Award Amounts Reported in Summary Compensation Table |
|
|
|
|
|
| Pay vs Performance Disclosure |
|
|
|
|
|
| Adjustment to Compensation, Amount |
(2,125,120)
|
|
|
|
|
| Non-PEO NEO | Year-end Fair Value of Equity Awards Granted in Covered Year that are Outstanding and Unvested |
|
|
|
|
|
| Pay vs Performance Disclosure |
|
|
|
|
|
| Adjustment to Compensation, Amount |
2,102,934
|
|
|
|
|
| Non-PEO NEO | Year-over-Year Change in Fair Value of Equity Awards Granted in Prior Years That are Outstanding and Unvested |
|
|
|
|
|
| Pay vs Performance Disclosure |
|
|
|
|
|
| Adjustment to Compensation, Amount |
937,794
|
|
|
|
|
| Non-PEO NEO | Change in Fair Value as of Vesting Date of Prior Year Equity Awards Vested in Covered Year |
|
|
|
|
|
| Pay vs Performance Disclosure |
|
|
|
|
|
| Adjustment to Compensation, Amount |
165,385
|
|
|
|
|
| Non-PEO NEO | Dividends or Other Earnings Paid on Equity Awards not Otherwise Reflected in Total Compensation for Covered Year |
|
|
|
|
|
| Pay vs Performance Disclosure |
|
|
|
|
|
| Adjustment to Compensation, Amount |
$ 344,505
|
|
|
|
|