Pay vs Performance Disclosure - USD ($)
Dec. 31, 2023
Dec. 31, 2025
Jun. 27, 2025
Dec. 04, 2023
Dec. 31, 2025
Dec. 31, 2024
Dec. 31, 2023
Pay versus Performance
As required by Section 953(a) of the Dodd-Frank Wall Street Reform and Consumer Protection Act, and Item 402(v) of Regulation S-K, we are providing the following information about the relationship between executive compensation actually paid and certain financial performance of Gaia. For further information concerning our variable pay-for-performance philosophy and how we align executive compensation with our performance, refer to “Executive Compensation.”
Year | Summary Compensation Table Total for First Principal Executive Officer (“PEO”)(1) | Summary Compensation Table Total for Second PEO(2) | Summary Compensation Table Total for Third PEO(3) | Compensation Actually Paid to First PEO(4) | Compensation Actually Paid to Second PEO(5) | Compensation Actually Paid to Third PEO(6) | Average Summary Compensation Table Total for Non-PEO Named Executive Officers (“NEOs”)(7) | Average Compensation Actually Paid to Non-PEO NEOs(8) | Value of Initial Fixed $100 Investment Based on Total Shareholder Return(9) | Net Income (Loss) (thousands)(10) | ||||||||||||||||||||
(a) | (b) | (c) | (d) | (e) | (f) | (g) | (h) | (i) | (j) | (k) | ||||||||||||||||||||
2025 | $— | $964,438 | $1,681,398 | $— | $741,449 | $1,221,612 | $1,172,057 | $1,002,282 | $152.52 | $(5,388) | ||||||||||||||||||||
2024 | $— | $513,727 | $— | $— | $803,709 | $— | $511,533 | $867,142 | $188.66 | $(5,398) | ||||||||||||||||||||
2023 | $1,154,892 | $677,819 | $— | $1,120,309 | $715,222 | $— | $669,800 | $695,628 | $113.45 | $(5,595) | ||||||||||||||||||||
(1) | The dollar amounts reported in column (b) are the amounts of total compensation reported for Mr. Rysavy (our Chairman and former Chief Executive Officer) for each corresponding year in the “Total” column of the Summary Compensation Table. Refer to “Executive Compensation—Summary Compensation Table.” |
(2) | The dollar amounts reported in column (c) are the amounts of total compensation reported for Mr. Colquhoun (our Chief Executive Officer) for each corresponding year in the “Total” column of the Summary Compensation Table. Refer to “Executive Compensation—Summary Compensation Table.” |
(3) | The dollar amounts reported in column (d) are the amounts of total compensation reported for Ms. Medvedich (our Chief Executive Officer) for each corresponding year in the “Total” column of the Summary Compensation Table. Refer to “Executive Compensation— Summary Compensation Table.” |
(4) | The dollar amounts reported in column (e) represents the amount of “compensation actually paid” to Mr. Rysavy, as computed in accordance with Item 402(v) of Regulation S-K, for 2023, the year in which Mr. Rysavy served as our Chief Executive Officer. The dollar amounts do not reflect the actual amount of compensation earned by or paid to Mr. Rysavy during the applicable year. In accordance with the requirements of Item 402(v) of Regulation S-K, the following adjustments were made to Mr. Rysavy’s total compensation for each year to determine the compensation actually paid. |
Year | Reported Summary Compensation Table Total for PEO | Reported Value of Equity Awards(A) | Equity Award Adjustments(B) | Compensation Actually Paid to PEO | ||||||||
2023 | $1,154,892 | $524,064 | $489,481 | $1,120,309 | ||||||||
(A) | The reported value of equity awards represents the total of the amounts reported in the “Stock Awards” column in the Summary Compensation Table for the applicable year. The amount shown for 2023 has been corrected to include the grant date fair value of equity awards made during 2023 that were inadvertently omitted from the Summary Compensation Table and this disclosure in the Definitive Proxy Statement on Schedule 14A filed in 2024. |
(B) | The equity award adjustments for each applicable year include the addition (or subtraction, as applicable) of the following: (i) the year-end fair value of any equity awards granted in the applicable year that are outstanding and unvested as of the end of the year; (ii) the amount of change as of the end of the applicable year (from the end of the prior fiscal year) in fair value of any awards granted in prior years that are outstanding and unvested as of the end of the applicable year; (iii) for awards that are granted and vest in same applicable year, the fair value as of the vesting date; (iv) for awards granted in prior years that vest in the applicable year, the amount equal to the change as of the vesting date (from the end of the prior fiscal year) in fair value; (v) for awards granted in prior years that are determined to fail to meet the applicable vesting conditions during the applicable year, a deduction for the amount equal to the fair value at the end of the prior fiscal year; and (vi) the dollar value of any dividends or other earnings paid on stock or option awards in the applicable year prior to the vesting date that are not otherwise reflected in the fair value of such award or included in any other component of total compensation for the applicable year. The valuation assumptions used to calculate fair values did not materially differ from those disclosed at the time of grant. The amounts shown for 2023 have been corrected due to adjustments to (A) above. These amounts deducted or added in calculating the equity award adjustments are as follows: |
Year | Year End Fair Value of Equity Awards Granted During the Year | Year over Year Change in Fair Value of Outstanding and Unvested Equity Awards | Fair Value as of Vesting Date of Equity Awards Granted and Vested in the Year | Year over Year Change in Fair Value of Equity Awards Granted in Prior Years that Vested in the Year | Fair Value at the End of the Prior Year of Equity Awards that Failed to Meet Vesting Conditions in the Year | Value of Dividends or other Earnings Paid on Stock or Option Awards not Otherwise Reflected in Fair Value or Total Compensation | Total Equity Award Adjustments | ||||||||||||||
2023 | $447,776 | $41,705 | $ — | $ — | $ — | $ — | $489,481 | ||||||||||||||
(5) | The dollar amounts reported in column (f) represent the amount of “compensation actually paid” to Mr. Colquhoun, as computed in accordance with Item 402(v) of Regulation S-K for 2025, 2024 and 2023, the years in which Mr. Colquhoun served as our Chief Executive Officer. The dollar amounts do not reflect the actual amount of compensation earned by or paid to Mr. Colquhoun during the applicable year. In accordance with the requirements of Item 402(v) of Regulation S-K, the following adjustments were made to Mr. Colquhoun’s total compensation for each year to determine the compensation actually paid. |
Year | Reported Summary Compensation Table Total for Second PEO | Reported Value of Equity Awards(A) | Equity Award Adjustments(B) | Compensation Actually Paid to Second PEO | ||||||||
2025 | $964,438 | $270,001 | $47,012 | $741,449 | ||||||||
2024 | $513,727 | $— | $289,981 | $803,709 | ||||||||
2023 | $677,819 | $400,000 | $437,403 | $715,222 | ||||||||
(A) | The reported fair value of equity awards represents the total of the amounts reported in the “Stock Awards” column in the Summary Compensation Table for the applicable year. |
(B) | The equity award adjustments for each applicable year include the addition (or subtraction, as applicable) of the following: (i) the year-end fair value of any equity awards granted in the applicable year that are outstanding and unvested as of the end of the year; (ii) the amount of change as of the end of the applicable year (from the end of the prior fiscal year) in fair value of any awards granted in prior years that are outstanding and unvested as of the end of the applicable year; (iii) for awards that are granted and vest in same applicable year, the fair value as of the vesting date; (iv) for awards granted in prior years that vest in the applicable year, the amount equal to the change as of the vesting date (from the end of the prior fiscal year) in fair value; (v) for awards granted in prior years that are determined to fail to meet the applicable vesting conditions during the applicable year, a deduction for the amount equal to the fair value at the end of the prior fiscal year; and (vi) the dollar value of any dividends or other earnings paid on stock or option awards in the applicable year prior to the vesting date that are not otherwise reflected in the fair value of such award or included in any other component of total compensation for the applicable year. The valuation assumptions used to calculate fair values did not materially differ from those disclosed at the time of grant. The amounts deducted or added in calculating the equity award adjustments are as follows: |
Year | Year End Fair Value of Equity Awards Granted During the Year | Year over Year Change in Fair Value of Outstanding and Unvested Equity Awards | Fair Value as of Vesting Date of Equity Awards Granted and Vested in the Year | Year over Year Change in Fair Value of Equity Awards Granted in Prior Years that Vested in the Year | Fair Value at the End of the Prior Year of Equity Awards that Failed to Meet Vesting Conditions in the Year | Value of Dividends or other Earnings Paid on Stock or Option Awards not Otherwise Reflected in Fair Value or Total Compensation | Total Equity Award Adjustments | ||||||||||||||
2025 | $186,332 | $(139,320) | $— | $— | $— | $— | $47,012 | ||||||||||||||
2024 | $— | $289,981 | $— | $— | $— | $— | $289,981 | ||||||||||||||
2023 | $437,403 | $— | $ — | $ — | $ — | $ — | $437,403 | ||||||||||||||
(6) | The dollar amounts reported in column (g) represent the amount of “compensation actually paid” to Ms. Medvedich, as computed in accordance with Item 402(v) of Regulation S-K for 2025, the year in which Ms. Medvedich served as our Chief Executive Officer. The dollar amounts do not reflect the actual amount of compensation earned by or paid to Ms. Medvedich during the applicable year. In accordance with the requirements of Item 402(v) of Regulation S-K, the following adjustments were made to Ms. Medvedich’s total compensation for each year to determine the compensation actually paid. |
Year | Reported Summary Compensation Table Total for Third PEO | Reported Value of Equity Awards(A) | Equity Award Adjustments(B) | Compensation Actually Paid to Third PEO | ||||||||
2025 | $1,681,398 | $923,998 | $464,212 | $1,221,612 | ||||||||
(A) | The reported fair value of equity awards represents the total of the amounts reported in the “Stock Awards” column in the Summary Compensation Table for the applicable year. |
(B) | The equity award adjustments for each applicable year include the addition (or subtraction, as applicable) of the following: (i) the year-end fair value of any equity awards granted in the applicable year that are outstanding and unvested as of the end of the year; (ii) the amount of change as of the end of the applicable year (from the end of the prior fiscal year) in fair value of any awards granted in prior years that are outstanding and unvested as of the end of the applicable year; (iii) for awards that are granted and vest in same applicable year, the fair value as of the vesting date; (iv) for awards granted in prior years that vest in the applicable year, the amount equal to the change as of the vesting date (from the end of the prior fiscal year) in fair value; (v) for awards granted in prior years that are determined to fail to meet the applicable vesting conditions during the applicable year, a deduction for the amount equal to the fair value at the end of the prior fiscal year; and (vi) the dollar value of any dividends or other earnings paid on stock or |
option awards in the applicable year prior to the vesting date that are not otherwise reflected in the fair value of such award or included in any other component of total compensation for the applicable year. The valuation assumptions used to calculate fair values did not materially differ from those disclosed at the time of grant. The amounts deducted or added in calculating the equity award adjustments are as follows:
Year | Year End Fair Value of Equity Awards Granted During the Year | Year over Year Change in Fair Value of Outstanding and Unvested Equity Awards | Fair Value as of Vesting Date of Equity Awards Granted and Vested in the Year | Year over Year Change in Fair Value of Equity Awards Granted in Prior Years that Vested in the Year | Fair Value at the End of the Prior Year of Equity Awards that Failed to Meet Vesting Conditions in the Year | Value of Dividends or other Earnings Paid on Stock or Option Awards not Otherwise Reflected in Fair Value or Total Compensation | Total Equity Award Adjustments | ||||||||||||||
2025 | $585,214 | $(121,002) | $ — | $ — | $ — | $ — | $464,212 | ||||||||||||||
(7) | The dollar amounts reported in column (h) represent the average of the amounts reported for our non-PEO NEOs as a group (excluding Mr. Rysavy for 2023, when he served as our PEO, Mr. Colquhoun for 2025, 2024 and 2023, when he served as our PEO, and Kiersten Medvedich for 2025, the year she served as our PEO) in the “Total” column of the Summary Compensation Table in each applicable year. The NEOs included for purposes of calculating the average amounts in each applicable year were Mr. Rysavy and Mr. Preston for 2025, Ms. Medvedich and Mr. Preston for 2024, and Mr. Preston, Mr. Tarell and Ms. Medvedich for 2023. |
(8) | The dollar amounts reported in column (i) represent the average amount of “compensation actually paid” to our non-PEO NEOs as a group, as computed in accordance with Item 402(v) of Regulation S-K. The dollar amounts do not reflect the actual average amount of compensation earned by or paid to the non-PEO NEOs as a group during the applicable year. In accordance with the requirements of Item 402(v) of Regulation S-K, the following adjustments were made to average total compensation for the non-PEO NEOs as a group for each year to determine the compensation actually paid, using the same methodology described above in Notes 3 and 4: |
Year | Average Reported Summary Compensation Table Total for Non-PEO NEOs | Average Reported Value of Equity Awards(A) | Average Equity Award Adjustments(B) | Average Compensation Actually Paid to Non-PEO NEOs | ||||||||
2025 | $1,172,057 | $289,847 | $120,072 | $1,002,282 | ||||||||
2024 | $511,533 | $— | $355,609 | $867,142 | ||||||||
2023 | $669,800 | $205,793 | $231,620 | $695,628 | ||||||||
(A) | The average reported value of equity awards represents the average of the amounts reported in the “Stock Awards” column in the Summary Compensation Table for the applicable year. The amount shown for 2023 has been corrected to include the grant date fair value of equity awards made during 2023 that were inadvertently omitted from the Summary Compensation Table and this disclosure in the Definitive Proxy Statement on Schedule 14A filed in 2024. |
(B) | The average equity award adjustments for each applicable year include the addition (or subtraction, as applicable) of the following: (i) the average year-end fair value of any equity awards granted in the applicable year that are outstanding and unvested as of the end of the year; (ii) the average amount of change as of the end of the applicable year (from the end of the prior fiscal year) in fair value of any awards granted in prior years that are outstanding and unvested as of the end of the applicable year; (iii) for awards that are granted and vest in same applicable year, the average fair value as of the vesting date; (iv) for awards granted in prior years that vest in the applicable year, the amount equal to the average change as of the vesting date (from the end of the prior fiscal year) in fair value; (v) for awards granted in prior years that are determined to fail to meet the applicable vesting conditions during the applicable year, a deduction for the amount equal to the average fair value at the end of the prior fiscal year; and (vi) the average dollar value of any dividends or other earnings paid on stock or option awards in the applicable year prior to the vesting date that are not otherwise reflected in the fair value of such award or included in any other component of total compensation for the applicable year. The valuation assumptions used to calculate fair values did not materially differ from those disclosed at the time of grant. The amounts shown for 2023 have been corrected due to adjustments to (A) above. The amounts deducted or added in calculating the equity award adjustments are as follows: |
Year | Average Year End Fair Value of Equity Awards Granted During the Year | Year over Year Average Change in Fair Value of Outstanding and Unvested Equity Awards | Average Fair Value as of Vesting Date of Equity Awards Granted and Vested in the Year | Year over Year Average Change in Fair Value of Equity Awards Granted in Prior Years that Vested in the Year | Average Fair Value at the End of the Prior Year of Equity Awards that Failed to Meet Vesting Conditions in the Year | Average Value of Dividends or other Earnings Paid on Stock or Option Awards not Otherwise Reflected in Fair Value or Total Compensation | Total Average Equity Award Adjustments | ||||||||||||||
2025 | $289,847 | $(169,774) | $— | $— | $— | $— | $120,072 | ||||||||||||||
2024 | $— | $308,367 | $— | $47,242 | $— | $— | $355,609 | ||||||||||||||
2023 | $205,793 | $25,828 | $ — | $— | $ — | $ — | $231,620 | ||||||||||||||
(9) | Cumulative TSR is calculated assuming an initial investment of $100 in our Class A common stock as of December 31, 2022 and calculating the value of such investment at the end of each year shown in the table, assuming the reinvestment of any dividends. |
(10) | The dollar amounts reported represent the amount of net income (loss) reflected in our audited financial statements for the applicable year. |
(1) | The dollar amounts reported in column (b) are the amounts of total compensation reported for Mr. Rysavy (our Chairman and former Chief Executive Officer) for each corresponding year in the “Total” column of the Summary Compensation Table. Refer to “Executive Compensation—Summary Compensation Table.” |
(2) | The dollar amounts reported in column (c) are the amounts of total compensation reported for Mr. Colquhoun (our Chief Executive Officer) for each corresponding year in the “Total” column of the Summary Compensation Table. Refer to “Executive Compensation—Summary Compensation Table.” |
(3) | The dollar amounts reported in column (d) are the amounts of total compensation reported for Ms. Medvedich (our Chief Executive Officer) for each corresponding year in the “Total” column of the Summary Compensation Table. Refer to “Executive Compensation— Summary Compensation Table.” |
(7) | The dollar amounts reported in column (h) represent the average of the amounts reported for our non-PEO NEOs as a group (excluding Mr. Rysavy for 2023, when he served as our PEO, Mr. Colquhoun for 2025, 2024 and 2023, when he served as our PEO, and Kiersten Medvedich for 2025, the year she served as our PEO) in the “Total” column of the Summary Compensation Table in each applicable year. The NEOs included for purposes of calculating the average amounts in each applicable year were Mr. Rysavy and Mr. Preston for 2025, Ms. Medvedich and Mr. Preston for 2024, and Mr. Preston, Mr. Tarell and Ms. Medvedich for 2023. |
(4) | The dollar amounts reported in column (e) represents the amount of “compensation actually paid” to Mr. Rysavy, as computed in accordance with Item 402(v) of Regulation S-K, for 2023, the year in which Mr. Rysavy served as our Chief Executive Officer. The dollar amounts do not reflect the actual amount of compensation earned by or paid to Mr. Rysavy during the applicable year. In accordance with the requirements of Item 402(v) of Regulation S-K, the following adjustments were made to Mr. Rysavy’s total compensation for each year to determine the compensation actually paid. |
Year | Reported Summary Compensation Table Total for PEO | Reported Value of Equity Awards(A) | Equity Award Adjustments(B) | Compensation Actually Paid to PEO | ||||||||
2023 | $1,154,892 | $524,064 | $489,481 | $1,120,309 | ||||||||
(A) | The reported value of equity awards represents the total of the amounts reported in the “Stock Awards” column in the Summary Compensation Table for the applicable year. The amount shown for 2023 has been corrected to include the grant date fair value of equity awards made during 2023 that were inadvertently omitted from the Summary Compensation Table and this disclosure in the Definitive Proxy Statement on Schedule 14A filed in 2024. |
(B) | The equity award adjustments for each applicable year include the addition (or subtraction, as applicable) of the following: (i) the year-end fair value of any equity awards granted in the applicable year that are outstanding and unvested as of the end of the year; (ii) the amount of change as of the end of the applicable year (from the end of the prior fiscal year) in fair value of any awards granted in prior years that are outstanding and unvested as of the end of the applicable year; (iii) for awards that are granted and vest in same applicable year, the fair value as of the vesting date; (iv) for awards granted in prior years that vest in the applicable year, the amount equal to the change as of the vesting date (from the end of the prior fiscal year) in fair value; (v) for awards granted in prior years that are determined to fail to meet the applicable vesting conditions during the applicable year, a deduction for the amount equal to the fair value at the end of the prior fiscal year; and (vi) the dollar value of any dividends or other earnings paid on stock or option awards in the applicable year prior to the vesting date that are not otherwise reflected in the fair value of such award or included in any other component of total compensation for the applicable year. The valuation assumptions used to calculate fair values did not materially differ from those disclosed at the time of grant. The amounts shown for 2023 have been corrected due to adjustments to (A) above. These amounts deducted or added in calculating the equity award adjustments are as follows: |
Year | Year End Fair Value of Equity Awards Granted During the Year | Year over Year Change in Fair Value of Outstanding and Unvested Equity Awards | Fair Value as of Vesting Date of Equity Awards Granted and Vested in the Year | Year over Year Change in Fair Value of Equity Awards Granted in Prior Years that Vested in the Year | Fair Value at the End of the Prior Year of Equity Awards that Failed to Meet Vesting Conditions in the Year | Value of Dividends or other Earnings Paid on Stock or Option Awards not Otherwise Reflected in Fair Value or Total Compensation | Total Equity Award Adjustments | ||||||||||||||
2023 | $447,776 | $41,705 | $ — | $ — | $ — | $ — | $489,481 | ||||||||||||||
(5) | The dollar amounts reported in column (f) represent the amount of “compensation actually paid” to Mr. Colquhoun, as computed in accordance with Item 402(v) of Regulation S-K for 2025, 2024 and 2023, the years in which Mr. Colquhoun served as our Chief Executive Officer. The dollar amounts do not reflect the actual amount of compensation earned by or paid to Mr. Colquhoun during the applicable year. In accordance with the requirements of Item 402(v) of Regulation S-K, the following adjustments were made to Mr. Colquhoun’s total compensation for each year to determine the compensation actually paid. |
Year | Reported Summary Compensation Table Total for Second PEO | Reported Value of Equity Awards(A) | Equity Award Adjustments(B) | Compensation Actually Paid to Second PEO | ||||||||
2025 | $964,438 | $270,001 | $47,012 | $741,449 | ||||||||
2024 | $513,727 | $— | $289,981 | $803,709 | ||||||||
2023 | $677,819 | $400,000 | $437,403 | $715,222 | ||||||||
(A) | The reported fair value of equity awards represents the total of the amounts reported in the “Stock Awards” column in the Summary Compensation Table for the applicable year. |
(B) | The equity award adjustments for each applicable year include the addition (or subtraction, as applicable) of the following: (i) the year-end fair value of any equity awards granted in the applicable year that are outstanding and unvested as of the end of the year; (ii) the amount of change as of the end of the applicable year (from the end of the prior fiscal year) in fair value of any awards granted in prior years that are outstanding and unvested as of the end of the applicable year; (iii) for awards that are granted and vest in same applicable year, the fair value as of the vesting date; (iv) for awards granted in prior years that vest in the applicable year, the amount equal to the change as of the vesting date (from the end of the prior fiscal year) in fair value; (v) for awards granted in prior years that are determined to fail to meet the applicable vesting conditions during the applicable year, a deduction for the amount equal to the fair value at the end of the prior fiscal year; and (vi) the dollar value of any dividends or other earnings paid on stock or option awards in the applicable year prior to the vesting date that are not otherwise reflected in the fair value of such award or included in any other component of total compensation for the applicable year. The valuation assumptions used to calculate fair values did not materially differ from those disclosed at the time of grant. The amounts deducted or added in calculating the equity award adjustments are as follows: |
Year | Year End Fair Value of Equity Awards Granted During the Year | Year over Year Change in Fair Value of Outstanding and Unvested Equity Awards | Fair Value as of Vesting Date of Equity Awards Granted and Vested in the Year | Year over Year Change in Fair Value of Equity Awards Granted in Prior Years that Vested in the Year | Fair Value at the End of the Prior Year of Equity Awards that Failed to Meet Vesting Conditions in the Year | Value of Dividends or other Earnings Paid on Stock or Option Awards not Otherwise Reflected in Fair Value or Total Compensation | Total Equity Award Adjustments | ||||||||||||||
2025 | $186,332 | $(139,320) | $— | $— | $— | $— | $47,012 | ||||||||||||||
2024 | $— | $289,981 | $— | $— | $— | $— | $289,981 | ||||||||||||||
2023 | $437,403 | $— | $ — | $ — | $ — | $ — | $437,403 | ||||||||||||||
(6) | The dollar amounts reported in column (g) represent the amount of “compensation actually paid” to Ms. Medvedich, as computed in accordance with Item 402(v) of Regulation S-K for 2025, the year in which Ms. Medvedich served as our Chief Executive Officer. The dollar amounts do not reflect the actual amount of compensation earned by or paid to Ms. Medvedich during the applicable year. In accordance with the requirements of Item 402(v) of Regulation S-K, the following adjustments were made to Ms. Medvedich’s total compensation for each year to determine the compensation actually paid. |
Year | Reported Summary Compensation Table Total for Third PEO | Reported Value of Equity Awards(A) | Equity Award Adjustments(B) | Compensation Actually Paid to Third PEO | ||||||||
2025 | $1,681,398 | $923,998 | $464,212 | $1,221,612 | ||||||||
(A) | The reported fair value of equity awards represents the total of the amounts reported in the “Stock Awards” column in the Summary Compensation Table for the applicable year. |
(B) | The equity award adjustments for each applicable year include the addition (or subtraction, as applicable) of the following: (i) the year-end fair value of any equity awards granted in the applicable year that are outstanding and unvested as of the end of the year; (ii) the amount of change as of the end of the applicable year (from the end of the prior fiscal year) in fair value of any awards granted in prior years that are outstanding and unvested as of the end of the applicable year; (iii) for awards that are granted and vest in same applicable year, the fair value as of the vesting date; (iv) for awards granted in prior years that vest in the applicable year, the amount equal to the change as of the vesting date (from the end of the prior fiscal year) in fair value; (v) for awards granted in prior years that are determined to fail to meet the applicable vesting conditions during the applicable year, a deduction for the amount equal to the fair value at the end of the prior fiscal year; and (vi) the dollar value of any dividends or other earnings paid on stock or |
option awards in the applicable year prior to the vesting date that are not otherwise reflected in the fair value of such award or included in any other component of total compensation for the applicable year. The valuation assumptions used to calculate fair values did not materially differ from those disclosed at the time of grant. The amounts deducted or added in calculating the equity award adjustments are as follows:
Year | Year End Fair Value of Equity Awards Granted During the Year | Year over Year Change in Fair Value of Outstanding and Unvested Equity Awards | Fair Value as of Vesting Date of Equity Awards Granted and Vested in the Year | Year over Year Change in Fair Value of Equity Awards Granted in Prior Years that Vested in the Year | Fair Value at the End of the Prior Year of Equity Awards that Failed to Meet Vesting Conditions in the Year | Value of Dividends or other Earnings Paid on Stock or Option Awards not Otherwise Reflected in Fair Value or Total Compensation | Total Equity Award Adjustments | ||||||||||||||
2025 | $585,214 | $(121,002) | $ — | $ — | $ — | $ — | $464,212 | ||||||||||||||
(8) | The dollar amounts reported in column (i) represent the average amount of “compensation actually paid” to our non-PEO NEOs as a group, as computed in accordance with Item 402(v) of Regulation S-K. The dollar amounts do not reflect the actual average amount of compensation earned by or paid to the non-PEO NEOs as a group during the applicable year. In accordance with the requirements of Item 402(v) of Regulation S-K, the following adjustments were made to average total compensation for the non-PEO NEOs as a group for each year to determine the compensation actually paid, using the same methodology described above in Notes 3 and 4: |
Year | Average Reported Summary Compensation Table Total for Non-PEO NEOs | Average Reported Value of Equity Awards(A) | Average Equity Award Adjustments(B) | Average Compensation Actually Paid to Non-PEO NEOs | ||||||||
2025 | $1,172,057 | $289,847 | $120,072 | $1,002,282 | ||||||||
2024 | $511,533 | $— | $355,609 | $867,142 | ||||||||
2023 | $669,800 | $205,793 | $231,620 | $695,628 | ||||||||
(A) | The average reported value of equity awards represents the average of the amounts reported in the “Stock Awards” column in the Summary Compensation Table for the applicable year. The amount shown for 2023 has been corrected to include the grant date fair value of equity awards made during 2023 that were inadvertently omitted from the Summary Compensation Table and this disclosure in the Definitive Proxy Statement on Schedule 14A filed in 2024. |
(B) | The average equity award adjustments for each applicable year include the addition (or subtraction, as applicable) of the following: (i) the average year-end fair value of any equity awards granted in the applicable year that are outstanding and unvested as of the end of the year; (ii) the average amount of change as of the end of the applicable year (from the end of the prior fiscal year) in fair value of any awards granted in prior years that are outstanding and unvested as of the end of the applicable year; (iii) for awards that are granted and vest in same applicable year, the average fair value as of the vesting date; (iv) for awards granted in prior years that vest in the applicable year, the amount equal to the average change as of the vesting date (from the end of the prior fiscal year) in fair value; (v) for awards granted in prior years that are determined to fail to meet the applicable vesting conditions during the applicable year, a deduction for the amount equal to the average fair value at the end of the prior fiscal year; and (vi) the average dollar value of any dividends or other earnings paid on stock or option awards in the applicable year prior to the vesting date that are not otherwise reflected in the fair value of such award or included in any other component of total compensation for the applicable year. The valuation assumptions used to calculate fair values did not materially differ from those disclosed at the time of grant. The amounts shown for 2023 have been corrected due to adjustments to (A) above. The amounts deducted or added in calculating the equity award adjustments are as follows: |
Year | Average Year End Fair Value of Equity Awards Granted During the Year | Year over Year Average Change in Fair Value of Outstanding and Unvested Equity Awards | Average Fair Value as of Vesting Date of Equity Awards Granted and Vested in the Year | Year over Year Average Change in Fair Value of Equity Awards Granted in Prior Years that Vested in the Year | Average Fair Value at the End of the Prior Year of Equity Awards that Failed to Meet Vesting Conditions in the Year | Average Value of Dividends or other Earnings Paid on Stock or Option Awards not Otherwise Reflected in Fair Value or Total Compensation | Total Average Equity Award Adjustments | ||||||||||||||
2025 | $289,847 | $(169,774) | $— | $— | $— | $— | $120,072 | ||||||||||||||
2024 | $— | $308,367 | $— | $47,242 | $— | $— | $355,609 | ||||||||||||||
2023 | $205,793 | $25,828 | $ — | $— | $ — | $ — | $231,620 | ||||||||||||||
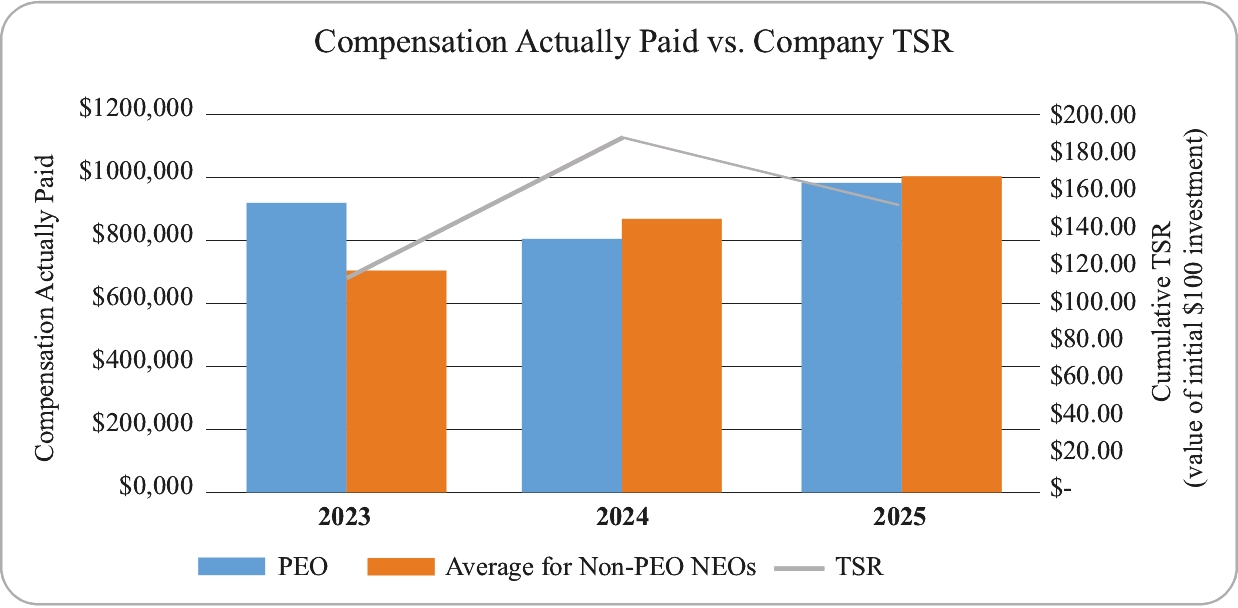
Compensation Actually Paid and Cumulative TSR
As demonstrated by the following graph, the amount of compensation actually paid to Ms. Medvedich, Mr. Colquhoun and Mr. Rysavy during the years in which they served as PEO and the average amount of compensation actually paid to our non-PEO NEOs as a group is aligned with our cumulative TSR over the three years presented in the table.
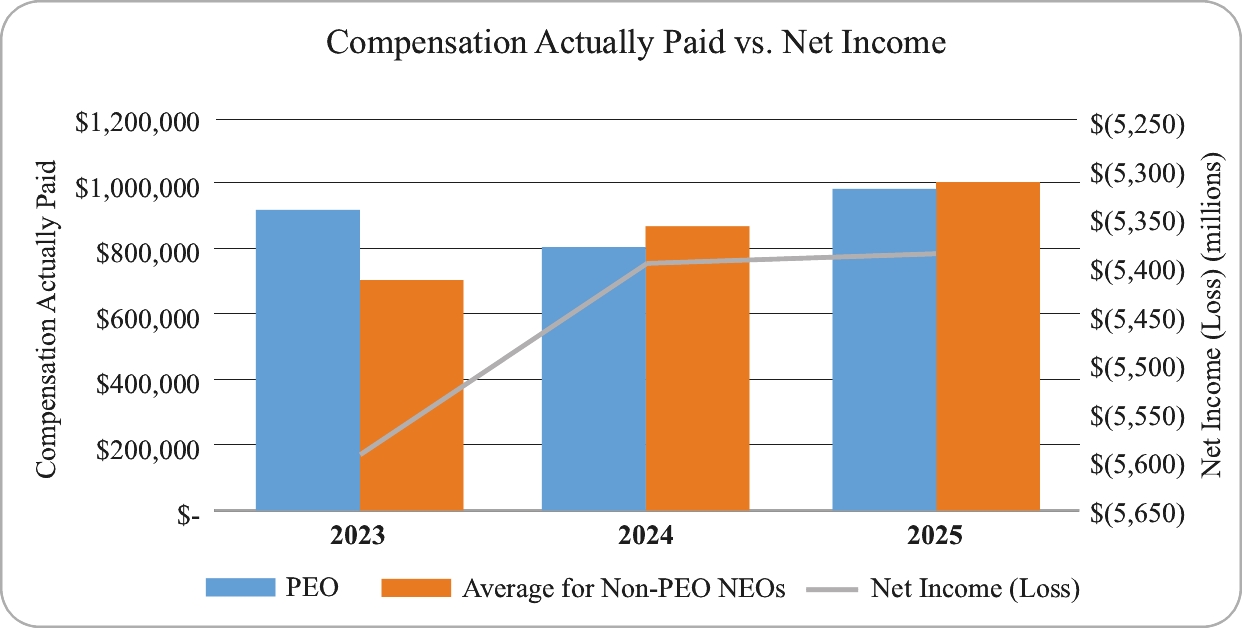
Compensation Actually Paid and Net Income (Loss)
As demonstrated by the following table, the amount of compensation actually paid to Ms. Medvedich, Mr. Colquhoun, and Mr. Rysavy during the years in which they served as PEO and the average amount of compensation actually paid to our non-PEO NEOs as a group is not aligned with the Company’s net income (loss) over the three years presented in the table. The Company does not solely use net income (loss) as a performance measure in setting compensation levels.
(B) | The equity award adjustments for each applicable year include the addition (or subtraction, as applicable) of the following: (i) the year-end fair value of any equity awards granted in the applicable year that are outstanding and unvested as of the end of the year; (ii) the amount of change as of the end of the applicable year (from the end of the prior fiscal year) in fair value of any awards granted in prior years that are outstanding and unvested as of the end of the applicable year; (iii) for awards that are granted and vest in same applicable year, the fair value as of the vesting date; (iv) for awards granted in prior years that vest in the applicable year, the amount equal to the change as of the vesting date (from the end of the prior fiscal year) in fair value; (v) for awards granted in prior years that are determined to fail to meet the applicable vesting conditions during the applicable year, a deduction for the amount equal to the fair value at the end of the prior fiscal year; and (vi) the dollar value of any dividends or other earnings paid on stock or option awards in the applicable year prior to the vesting date that are not otherwise reflected in the fair value of such award or included in any other component of total compensation for the applicable year. The valuation assumptions used to calculate fair values did not materially differ from those disclosed at the time of grant. The amounts shown for 2023 have been corrected due to adjustments to (A) above. These amounts deducted or added in calculating the equity award adjustments are as follows: |
Year | Year End Fair Value of Equity Awards Granted During the Year | Year over Year Change in Fair Value of Outstanding and Unvested Equity Awards | Fair Value as of Vesting Date of Equity Awards Granted and Vested in the Year | Year over Year Change in Fair Value of Equity Awards Granted in Prior Years that Vested in the Year | Fair Value at the End of the Prior Year of Equity Awards that Failed to Meet Vesting Conditions in the Year | Value of Dividends or other Earnings Paid on Stock or Option Awards not Otherwise Reflected in Fair Value or Total Compensation | Total Equity Award Adjustments | ||||||||||||||
2023 | $447,776 | $41,705 | $ — | $ — | $ — | $ — | $489,481 | ||||||||||||||
(B) | The equity award adjustments for each applicable year include the addition (or subtraction, as applicable) of the following: (i) the year-end fair value of any equity awards granted in the applicable year that are outstanding and unvested as of the end of the year; (ii) the amount of change as of the end of the applicable year (from the end of the prior fiscal year) in fair value of any awards granted in prior years that are outstanding and unvested as of the end of the applicable year; (iii) for awards that are granted and vest in same applicable year, the fair value as of the vesting date; (iv) for awards granted in prior years that vest in the applicable year, the amount equal to the change as of the vesting date (from the end of the prior fiscal year) in fair value; (v) for awards granted in prior years that are determined to fail to meet the applicable vesting conditions during the applicable year, a deduction for the amount equal to the fair value at the end of the prior fiscal year; and (vi) the dollar value of any dividends or other earnings paid on stock or option awards in the applicable year prior to the vesting date that are not otherwise reflected in the fair value of such award or included in any other component of total compensation for the applicable year. The valuation assumptions used to calculate fair values did not materially differ from those disclosed at the time of grant. The amounts deducted or added in calculating the equity award adjustments are as follows: |
Year | Year End Fair Value of Equity Awards Granted During the Year | Year over Year Change in Fair Value of Outstanding and Unvested Equity Awards | Fair Value as of Vesting Date of Equity Awards Granted and Vested in the Year | Year over Year Change in Fair Value of Equity Awards Granted in Prior Years that Vested in the Year | Fair Value at the End of the Prior Year of Equity Awards that Failed to Meet Vesting Conditions in the Year | Value of Dividends or other Earnings Paid on Stock or Option Awards not Otherwise Reflected in Fair Value or Total Compensation | Total Equity Award Adjustments | ||||||||||||||
2025 | $186,332 | $(139,320) | $— | $— | $— | $— | $47,012 | ||||||||||||||
2024 | $— | $289,981 | $— | $— | $— | $— | $289,981 | ||||||||||||||
2023 | $437,403 | $— | $ — | $ — | $ — | $ — | $437,403 | ||||||||||||||
(B) | The equity award adjustments for each applicable year include the addition (or subtraction, as applicable) of the following: (i) the year-end fair value of any equity awards granted in the applicable year that are outstanding and unvested as of the end of the year; (ii) the amount of change as of the end of the applicable year (from the end of the prior fiscal year) in fair value of any awards granted in prior years that are outstanding and unvested as of the end of the applicable year; (iii) for awards that are granted and vest in same applicable year, the fair value as of the vesting date; (iv) for awards granted in prior years that vest in the applicable year, the amount equal to the change as of the vesting date (from the end of the prior fiscal year) in fair value; (v) for awards granted in prior years that are determined to fail to meet the applicable vesting conditions during the applicable year, a deduction for the amount equal to the fair value at the end of the prior fiscal year; and (vi) the dollar value of any dividends or other earnings paid on stock or |
option awards in the applicable year prior to the vesting date that are not otherwise reflected in the fair value of such award or included in any other component of total compensation for the applicable year. The valuation assumptions used to calculate fair values did not materially differ from those disclosed at the time of grant. The amounts deducted or added in calculating the equity award adjustments are as follows:
Year | Year End Fair Value of Equity Awards Granted During the Year | Year over Year Change in Fair Value of Outstanding and Unvested Equity Awards | Fair Value as of Vesting Date of Equity Awards Granted and Vested in the Year | Year over Year Change in Fair Value of Equity Awards Granted in Prior Years that Vested in the Year | Fair Value at the End of the Prior Year of Equity Awards that Failed to Meet Vesting Conditions in the Year | Value of Dividends or other Earnings Paid on Stock or Option Awards not Otherwise Reflected in Fair Value or Total Compensation | Total Equity Award Adjustments | ||||||||||||||
2025 | $585,214 | $(121,002) | $ — | $ — | $ — | $ — | $464,212 | ||||||||||||||
(B) | The average equity award adjustments for each applicable year include the addition (or subtraction, as applicable) of the following: (i) the average year-end fair value of any equity awards granted in the applicable year that are outstanding and unvested as of the end of the year; (ii) the average amount of change as of the end of the applicable year (from the end of the prior fiscal year) in fair value of any awards granted in prior years that are outstanding and unvested as of the end of the applicable year; (iii) for awards that are granted and vest in same applicable year, the average fair value as of the vesting date; (iv) for awards granted in prior years that vest in the applicable year, the amount equal to the average change as of the vesting date (from the end of the prior fiscal year) in fair value; (v) for awards granted in prior years that are determined to fail to meet the applicable vesting conditions during the applicable year, a deduction for the amount equal to the average fair value at the end of the prior fiscal year; and (vi) the average dollar value of any dividends or other earnings paid on stock or option awards in the applicable year prior to the vesting date that are not otherwise reflected in the fair value of such award or included in any other component of total compensation for the applicable year. The valuation assumptions used to calculate fair values did not materially differ from those disclosed at the time of grant. The amounts shown for 2023 have been corrected due to adjustments to (A) above. The amounts deducted or added in calculating the equity award adjustments are as follows: |
Year | Average Year End Fair Value of Equity Awards Granted During the Year | Year over Year Average Change in Fair Value of Outstanding and Unvested Equity Awards | Average Fair Value as of Vesting Date of Equity Awards Granted and Vested in the Year | Year over Year Average Change in Fair Value of Equity Awards Granted in Prior Years that Vested in the Year | Average Fair Value at the End of the Prior Year of Equity Awards that Failed to Meet Vesting Conditions in the Year | Average Value of Dividends or other Earnings Paid on Stock or Option Awards not Otherwise Reflected in Fair Value or Total Compensation | Total Average Equity Award Adjustments | ||||||||||||||
2025 | $289,847 | $(169,774) | $— | $— | $— | $— | $120,072 | ||||||||||||||
2024 | $— | $308,367 | $— | $47,242 | $— | $— | $355,609 | ||||||||||||||
2023 | $205,793 | $25,828 | $ — | $— | $ — | $ — | $231,620 | ||||||||||||||