Pay vs Performance Disclosure
Dec. 31, 2025
USD ($)
Dec. 31, 2024
USD ($)
Dec. 31, 2023
USD ($)
Dec. 31, 2022
USD ($)
Dec. 31, 2021
USD ($)
PAY VERSUS PERFORMANCE
As required by Section 953(a) of the Dodd-Frank Wall Street Reform and Consumer Protection Act, and Item 402(v) of Regulation
S-K,
we are providing the following information about the relationship between executive “compensation actually paid” (“CAP”), and certain financial performance measurements with respect to the Company. The Human Capital and Compensation Committee does not utilize CAP as a basis for making compensation decisions. For further information concerning the Company’s pay for performance philosophy and how the Company aligns executive compensation with the Co
mpany’s performance, refer to “Executive Compensation – Compensation Discussion and Analysis” on page 37. PAY VS. PERFORMANCE TABLE
YEAR |
SUMMARY COMPENSATION TABLE TOTAL FOR PEO (MR. HORNBUCKLE) (A) |
COMPENSATION ACTUALLY PAID TO PEO (MR. HORNBUCKLE) (B) |
AVERAGE SUMMARY COMPENSATION TABLE TOTAL FOR NON-PEO NEOs(C) |
AVERAGE COMPENSATION ACTUALLY PAID TO NON-PEO NEOs(B)(C) |
VALUE OF INITIAL FIXED $100 INVESTMENT BASED ON: |
NET INCOME ($ THOUSANDS) (F) |
TSR (G) | |||||||||||||||||||||||||||||||||
TOTAL SHAREHOLDER RETURN (D) |
PEER GROUP TOTAL SHAREHOLDER RETURN (E) | |||||||||||||||||||||||||||||||||||||||
2025 |
$ | 25,329,156 | $ | 25,905,860 | $ | 6,664,584 | $ | 6,899,345 | $ | 115.86 | $ | 81.82 | $ | 520,872 | 59th percentile | |||||||||||||||||||||||||
2024(H) |
15,819,584 | 438,428 | 5,935,142 | 847,385 | 110.02 | 84.53 | 1,064,608 | 12t h percentile |
||||||||||||||||||||||||||||||||
2023 |
17,003,794 | 37,969,761 | 6,096,685 | 11,440,495 | 141.87 | 84.71 | 1,314,924 | 58th percentile | ||||||||||||||||||||||||||||||||
2022 |
16,238,075 | 6,386,343 | 5,467,867 | 2,842,563 | 106.47 | 65.00 | 206,731 | 35th percentile | ||||||||||||||||||||||||||||||||
2021 |
13,274,524 | 29,119,443 | 5,668,010 | 9,147,716 | 142.47 | 87.18 | 1,208,389 | 81st percentile | ||||||||||||||||||||||||||||||||
| (A) | Amounts represent total compensation as reported for Mr. Hornbuckle for each corresponding year in the “Total” column of the Summary Compensation Table. Refer to “Executive Compensation—Compensation Tables—Summary Compensation Table” in this and prior year reports. |
| (B) | Amounts represent CAP, as computed in accordance with Item 402(v) of Regulation S-K. Amounts do not reflect the actual amount of compensation earned by or paid to the PEOs or the NEOs during the applicable year. |
Reconciliation of compensation actually paid to Mr. Hornbuckle and the other NEOs to amounts shown in the Summary Compensation Table
MINUS |
PLUS |
PLUS/ (MINUS) |
PLUS |
PLUS/ (MINUS) |
MINUS |
EQUALS |
||||||||||||||||||||||||||||||
YEAR |
SUMMARY COMPENSATION TABLE TOTAL ($) |
REPORTED VALUE OF EQUITY AWARDS ($) |
YEAR END FAIR VALUE OF OUTSTANDING AND UNVESTED EQUITY AWARDS GRANTED DURING FISCAL YEAR ($) |
YEAR OVER YEAR CHANGE IN FAIR VALUE OF OUTSTANDING UNVESTED EQUITY AWARDS GRANTED IN PRIOR FISCAL YEARS ($) |
FAIR VALUE AT VESTING DATE OF EQUITY AWARDS GRANTED AND VESTED DURING THE FISCAL YEAR ($) |
YEAR OVER YEAR CHANGE IN FAIR VALUE AS OF THE VESTING DATE (FROM THE END OF THE PRIOR FISCAL YEAR) OF EQUITY AWARDS GRANTED IN PRIOR YEARS VESTING DURING THE FISCAL YEAR ($) |
FAIR VALUE AS OF END OF PRIOR FISCAL YEAR OF EQUITY AWARDS GRANTED IN PRIOR FISCAL YEAR THAT FAIL TO MEET THE APPLICABLE VESTING CONDITIONS DURING THE FISCAL YEAR ($) |
COMPENSATION ACTUALLY PAID ($) |
||||||||||||||||||||||||||||
PEO (Hornbuckle) |
||||||||||||||||||||||||||||||||||||
| 2025 | $ | 25,329,156 | $ | (10,052,751 | ) | $ | 11,277,356 | $ | (301,751 | ) | $ | — | $ | (346,150 | ) | $ | — | $ | 25,905,860 | |||||||||||||||||
| 2024 | (H) | 15,819,584 | (10,000,000 | ) | 7,883,536 | (10,799,864 | ) | — | (2,464,828 | ) | — | 438,428 | ||||||||||||||||||||||||
| 2023 | 17,003,794 | (10,000,000 | ) | 12,922,612 | 6,984,340 | — | 11,059,015 | — | 37,969,761 | |||||||||||||||||||||||||||
| 2022 | 16,238,075 | (10,000,000 | ) | 10,933,421 | (7,210,431 | ) | — | (3,574,722 | ) | — | 6,386,343 | |||||||||||||||||||||||||
| 2021 | 13,274,524 | (8,000,000 | ) | 8,065,872 | 12,016,295 | — | 3,762,752 | — | 29,119,443 | |||||||||||||||||||||||||||
Other Named Executive Officers (Average) |
||||||||||||||||||||||||||||||||||||
| 2025 | $ | 6,664,584 | $ | (3,703,574 | ) | $ | 4,131,283 | $ | (89,965 | ) | $ | — | $ | (102,983 | ) | $ | — | $ | 6,899,345 | |||||||||||||||||
| 2024 | (H) | 5,935,142 | (3,250,000 | ) | 2,586,043 | (3,407,574 | ) | — | (675,301 | ) | (340,925 | ) | 847,385 | |||||||||||||||||||||||
| 2023 | 6,096,685 | (3,125,000 | ) | 4,038,351 | 2,285,821 | — | 2,144,638 | — | 11,440,495 | |||||||||||||||||||||||||||
| 2022 | 5,467,867 | (3,125,000 | ) | 3,416,725 | (2,007,681 | ) | — | (909,348 | ) | — | 2,842,563 | |||||||||||||||||||||||||
| 2021 | 5,668,010 | (3,209,438 | ) | 3,489,191 | 1,883,198 | — | 1,316,755 | — | 9,147,716 | |||||||||||||||||||||||||||
The following information is relevant to the above table. The Reported Value of Equity Awards column includes the values originally reported in the Stock Awards column in the Summary Compensation Table (SCT). Fair value computations with respect to Absolute TSR PSUs and Relative TSR PSUs were computed in accordance with FASB ASC 718 using a Monte Carlo simulation. Fair value computations with respect to RSUs were computed based on the value of MGM stock on the date of computation, i.e., the end of the calendar year, the date of vesting, or the date of forfeiture, as the case may be. Footnote (C) below contains the names of the Named Executive Officers included in the
averages
. | (C) | Amounts represent the average of the amounts reported for the Company’s NEOs as a group (excluding Mr. Hornbuckle) in the “Total” column of the Summary Compensation Table in each applicable year. The names of each of the NEOs included for purposes of calculating the average amounts in each applicable year are as follows: for 2025, 2024, 2023 and 2022, Messrs. Halkyard, Sanders, Fritz, and McManus; and for 2021, Messrs. Halkyard, Sanders, Mandadi, and McManus. |
| (D) | Cumulative TSR is calculated by assuming a $100 hypothetical investment at December 31, 2020 and then for each measurement period multiplying the value at the start of the measurement period by the number obtained by dividing (1) the sum of (A) the cumulative amount of dividends for the measurement period beginning December 31, 2020 (assuming dividend reinvestment), and (B) the difference between the Company’s share price at the end and the beginning of the measurement period by (2) the Company’s share price at the beginning of the measurement period. |
| (E) | Represents the weighted peer group TSR of the companies included in the Dow Jones U.S. Gambling Index by tracking the performance of a $100 hypothetical investment in the common stock of the constituent companies (including dividend reinvestment) from December 31, 2020, through the end of each respective period presented in the table above. |
| (F) | Represents the amount of net income reflected in the Company’s audited financial statements for the applicable year. |
| (G) | Based on the S&P1500 Hotels, Restaurants and Leisure Index constituents, using the constituents in the index as of January 1, 2025. This change reflects the fact that in 2025 MGM changed to this index (from the S&P 500) for computing Relative TSR for its Relative TSR PSUs. |
| (H) | CAP for 2024 was revised due to the correction of an error in the calculation of the change in fair value as of the vesting date (from the end of the prior fiscal year) of equity awards granted in prior years vesting during the fiscal year. |
| (B) | Amounts represent CAP, as computed in accordance with Item 402(v) of Regulation S-K. Amounts do not reflect the actual amount of compensation earned by or paid to the PEOs or the NEOs during the applicable year. |
Reconciliation of compensation actually paid to Mr. Hornbuckle and the other NEOs to amounts shown in the Summary Compensation Table
MINUS |
PLUS |
PLUS/ (MINUS) |
PLUS |
PLUS/ (MINUS) |
MINUS |
EQUALS |
||||||||||||||||||||||||||||||
YEAR |
SUMMARY COMPENSATION TABLE TOTAL ($) |
REPORTED VALUE OF EQUITY AWARDS ($) |
YEAR END FAIR VALUE OF OUTSTANDING AND UNVESTED EQUITY AWARDS GRANTED DURING FISCAL YEAR ($) |
YEAR OVER YEAR CHANGE IN FAIR VALUE OF OUTSTANDING UNVESTED EQUITY AWARDS GRANTED IN PRIOR FISCAL YEARS ($) |
FAIR VALUE AT VESTING DATE OF EQUITY AWARDS GRANTED AND VESTED DURING THE FISCAL YEAR ($) |
YEAR OVER YEAR CHANGE IN FAIR VALUE AS OF THE VESTING DATE (FROM THE END OF THE PRIOR FISCAL YEAR) OF EQUITY AWARDS GRANTED IN PRIOR YEARS VESTING DURING THE FISCAL YEAR ($) |
FAIR VALUE AS OF END OF PRIOR FISCAL YEAR OF EQUITY AWARDS GRANTED IN PRIOR FISCAL YEAR THAT FAIL TO MEET THE APPLICABLE VESTING CONDITIONS DURING THE FISCAL YEAR ($) |
COMPENSATION ACTUALLY PAID ($) |
||||||||||||||||||||||||||||
PEO (Hornbuckle) |
||||||||||||||||||||||||||||||||||||
| 2025 | $ | 25,329,156 | $ | (10,052,751 | ) | $ | 11,277,356 | $ | (301,751 | ) | $ | — | $ | (346,150 | ) | $ | — | $ | 25,905,860 | |||||||||||||||||
| 2024 | (H) | 15,819,584 | (10,000,000 | ) | 7,883,536 | (10,799,864 | ) | — | (2,464,828 | ) | — | 438,428 | ||||||||||||||||||||||||
| 2023 | 17,003,794 | (10,000,000 | ) | 12,922,612 | 6,984,340 | — | 11,059,015 | — | 37,969,761 | |||||||||||||||||||||||||||
| 2022 | 16,238,075 | (10,000,000 | ) | 10,933,421 | (7,210,431 | ) | — | (3,574,722 | ) | — | 6,386,343 | |||||||||||||||||||||||||
| 2021 | 13,274,524 | (8,000,000 | ) | 8,065,872 | 12,016,295 | — | 3,762,752 | — | 29,119,443 | |||||||||||||||||||||||||||
Other Named Executive Officers (Average) |
||||||||||||||||||||||||||||||||||||
| 2025 | $ | 6,664,584 | $ | (3,703,574 | ) | $ | 4,131,283 | $ | (89,965 | ) | $ | — | $ | (102,983 | ) | $ | — | $ | 6,899,345 | |||||||||||||||||
| 2024 | (H) | 5,935,142 | (3,250,000 | ) | 2,586,043 | (3,407,574 | ) | — | (675,301 | ) | (340,925 | ) | 847,385 | |||||||||||||||||||||||
| 2023 | 6,096,685 | (3,125,000 | ) | 4,038,351 | 2,285,821 | — | 2,144,638 | — | 11,440,495 | |||||||||||||||||||||||||||
| 2022 | 5,467,867 | (3,125,000 | ) | 3,416,725 | (2,007,681 | ) | — | (909,348 | ) | — | 2,842,563 | |||||||||||||||||||||||||
| 2021 | 5,668,010 | (3,209,438 | ) | 3,489,191 | 1,883,198 | — | 1,316,755 | — | 9,147,716 | |||||||||||||||||||||||||||
The following information is relevant to the above table. The Reported Value of Equity Awards column includes the values originally reported in the Stock Awards column in the Summary Compensation Table (SCT). Fair value computations with respect to Absolute TSR PSUs and Relative TSR PSUs were computed in accordance with FASB ASC 718 using a Monte Carlo simulation. Fair value computations with respect to RSUs were computed based on the value of MGM stock on the date of computation, i.e., the end of the calendar year, the date of vesting, or the date of forfeiture, as the case may be. Footnote (C) below contains the names of the Named Executive Officers included in the
averages
. | (B) | Amounts represent CAP, as computed in accordance with Item 402(v) of Regulation S-K. Amounts do not reflect the actual amount of compensation earned by or paid to the PEOs or the NEOs during the applicable year. |
Reconciliation of compensation actually paid to Mr. Hornbuckle and the other NEOs to amounts shown in the Summary Compensation Table
MINUS |
PLUS |
PLUS/ (MINUS) |
PLUS |
PLUS/ (MINUS) |
MINUS |
EQUALS |
||||||||||||||||||||||||||||||
YEAR |
SUMMARY COMPENSATION TABLE TOTAL ($) |
REPORTED VALUE OF EQUITY AWARDS ($) |
YEAR END FAIR VALUE OF OUTSTANDING AND UNVESTED EQUITY AWARDS GRANTED DURING FISCAL YEAR ($) |
YEAR OVER YEAR CHANGE IN FAIR VALUE OF OUTSTANDING UNVESTED EQUITY AWARDS GRANTED IN PRIOR FISCAL YEARS ($) |
FAIR VALUE AT VESTING DATE OF EQUITY AWARDS GRANTED AND VESTED DURING THE FISCAL YEAR ($) |
YEAR OVER YEAR CHANGE IN FAIR VALUE AS OF THE VESTING DATE (FROM THE END OF THE PRIOR FISCAL YEAR) OF EQUITY AWARDS GRANTED IN PRIOR YEARS VESTING DURING THE FISCAL YEAR ($) |
FAIR VALUE AS OF END OF PRIOR FISCAL YEAR OF EQUITY AWARDS GRANTED IN PRIOR FISCAL YEAR THAT FAIL TO MEET THE APPLICABLE VESTING CONDITIONS DURING THE FISCAL YEAR ($) |
COMPENSATION ACTUALLY PAID ($) |
||||||||||||||||||||||||||||
PEO (Hornbuckle) |
||||||||||||||||||||||||||||||||||||
| 2025 | $ | 25,329,156 | $ | (10,052,751 | ) | $ | 11,277,356 | $ | (301,751 | ) | $ | — | $ | (346,150 | ) | $ | — | $ | 25,905,860 | |||||||||||||||||
| 2024 | (H) | 15,819,584 | (10,000,000 | ) | 7,883,536 | (10,799,864 | ) | — | (2,464,828 | ) | — | 438,428 | ||||||||||||||||||||||||
| 2023 | 17,003,794 | (10,000,000 | ) | 12,922,612 | 6,984,340 | — | 11,059,015 | — | 37,969,761 | |||||||||||||||||||||||||||
| 2022 | 16,238,075 | (10,000,000 | ) | 10,933,421 | (7,210,431 | ) | — | (3,574,722 | ) | — | 6,386,343 | |||||||||||||||||||||||||
| 2021 | 13,274,524 | (8,000,000 | ) | 8,065,872 | 12,016,295 | — | 3,762,752 | — | 29,119,443 | |||||||||||||||||||||||||||
Other Named Executive Officers (Average) |
||||||||||||||||||||||||||||||||||||
| 2025 | $ | 6,664,584 | $ | (3,703,574 | ) | $ | 4,131,283 | $ | (89,965 | ) | $ | — | $ | (102,983 | ) | $ | — | $ | 6,899,345 | |||||||||||||||||
| 2024 | (H) | 5,935,142 | (3,250,000 | ) | 2,586,043 | (3,407,574 | ) | — | (675,301 | ) | (340,925 | ) | 847,385 | |||||||||||||||||||||||
| 2023 | 6,096,685 | (3,125,000 | ) | 4,038,351 | 2,285,821 | — | 2,144,638 | — | 11,440,495 | |||||||||||||||||||||||||||
| 2022 | 5,467,867 | (3,125,000 | ) | 3,416,725 | (2,007,681 | ) | — | (909,348 | ) | — | 2,842,563 | |||||||||||||||||||||||||
| 2021 | 5,668,010 | (3,209,438 | ) | 3,489,191 | 1,883,198 | — | 1,316,755 | — | 9,147,716 | |||||||||||||||||||||||||||
The following information is relevant to the above table. The Reported Value of Equity Awards column includes the values originally reported in the Stock Awards column in the Summary Compensation Table (SCT). Fair value computations with respect to Absolute TSR PSUs and Relative TSR PSUs were computed in accordance with FASB ASC 718 using a Monte Carlo simulation. Fair value computations with respect to RSUs were computed based on the value of MGM stock on the date of computation, i.e., the end of the calendar year, the date of vesting, or the date of forfeiture, as the case may be. Footnote (C) below contains the names of the Named Executive Officers included in the
averages
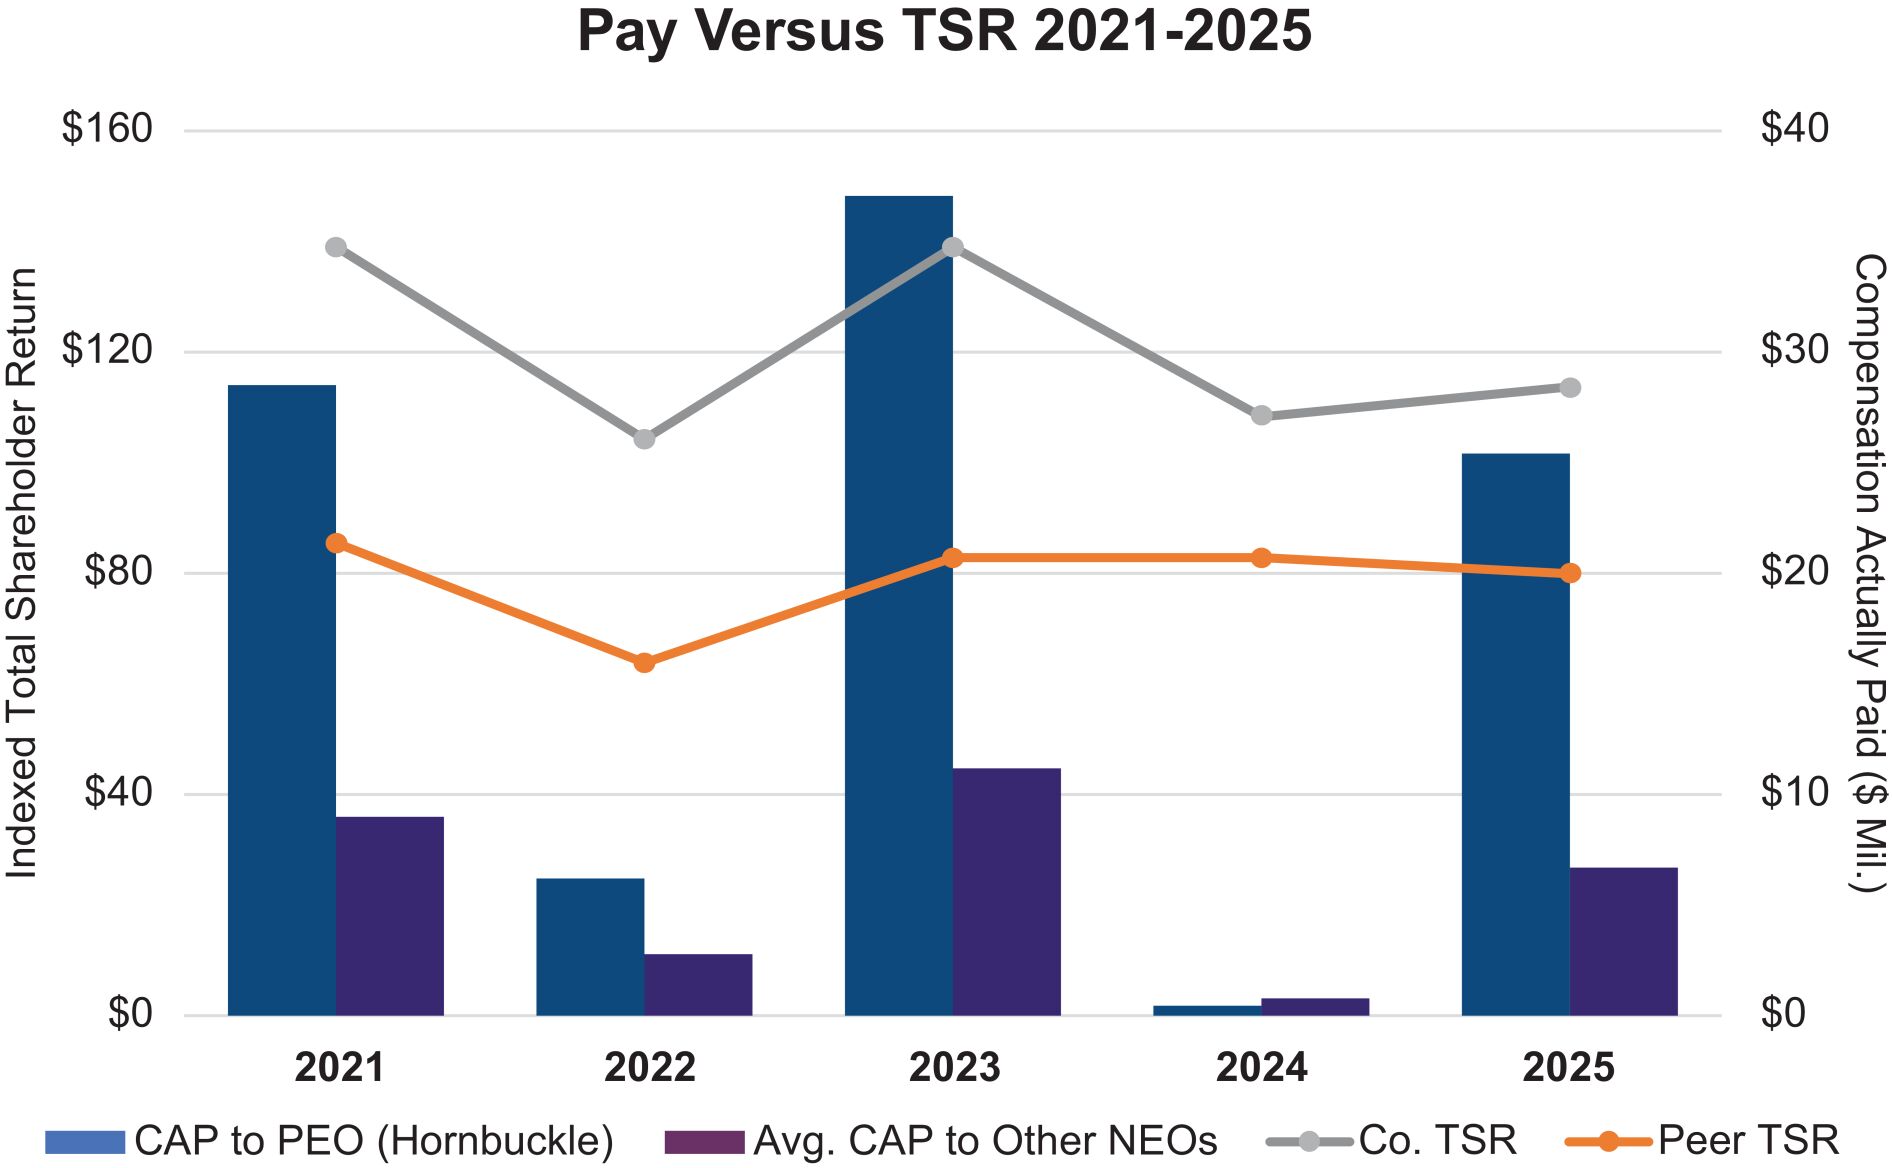
. Compensation Actually Paid Versus TSR 2021-2025
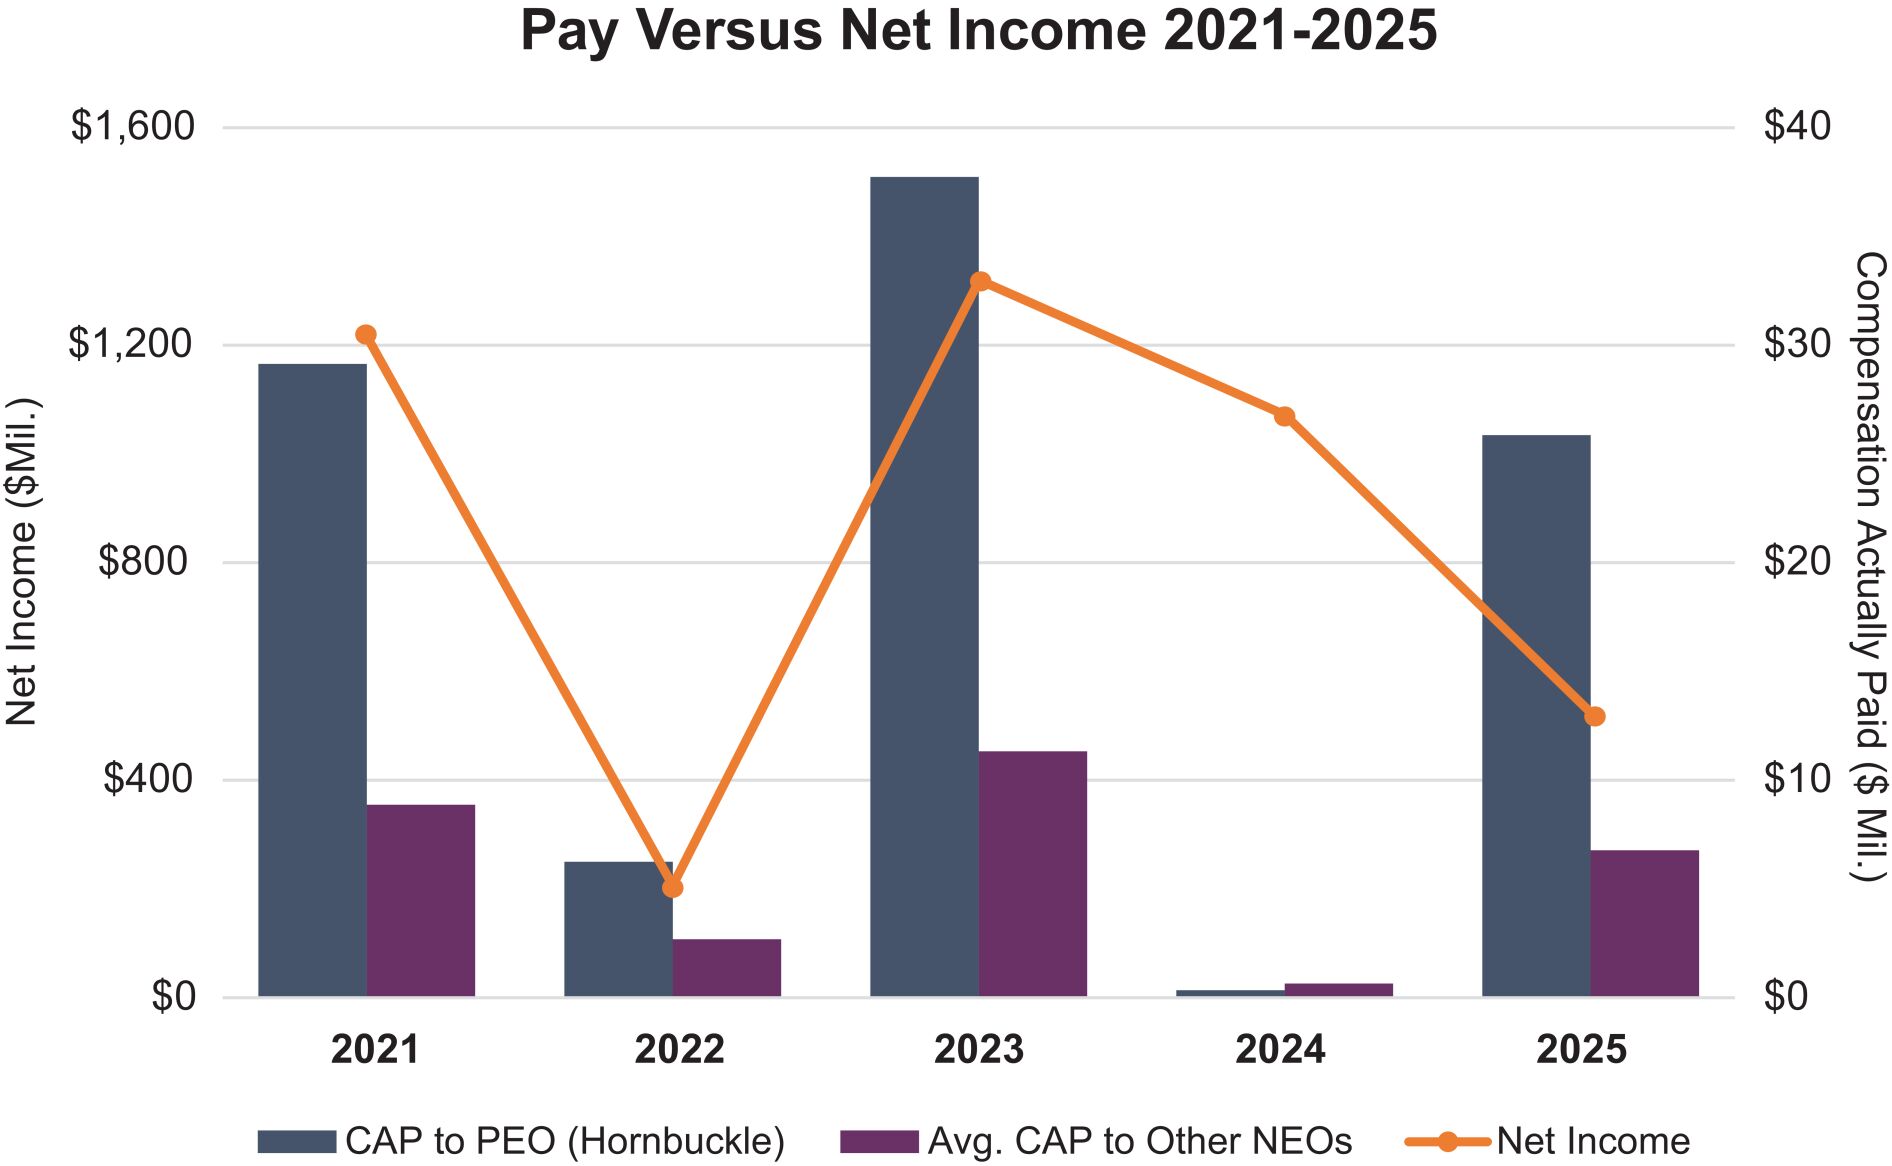
Compensation Actually Paid Versus Net Income 2021-2025
Compensation Actually Paid Versus
One-Year
Relative TSR vs. S&P 1500 Hotels, Restaurants and Leisure Index Constituents 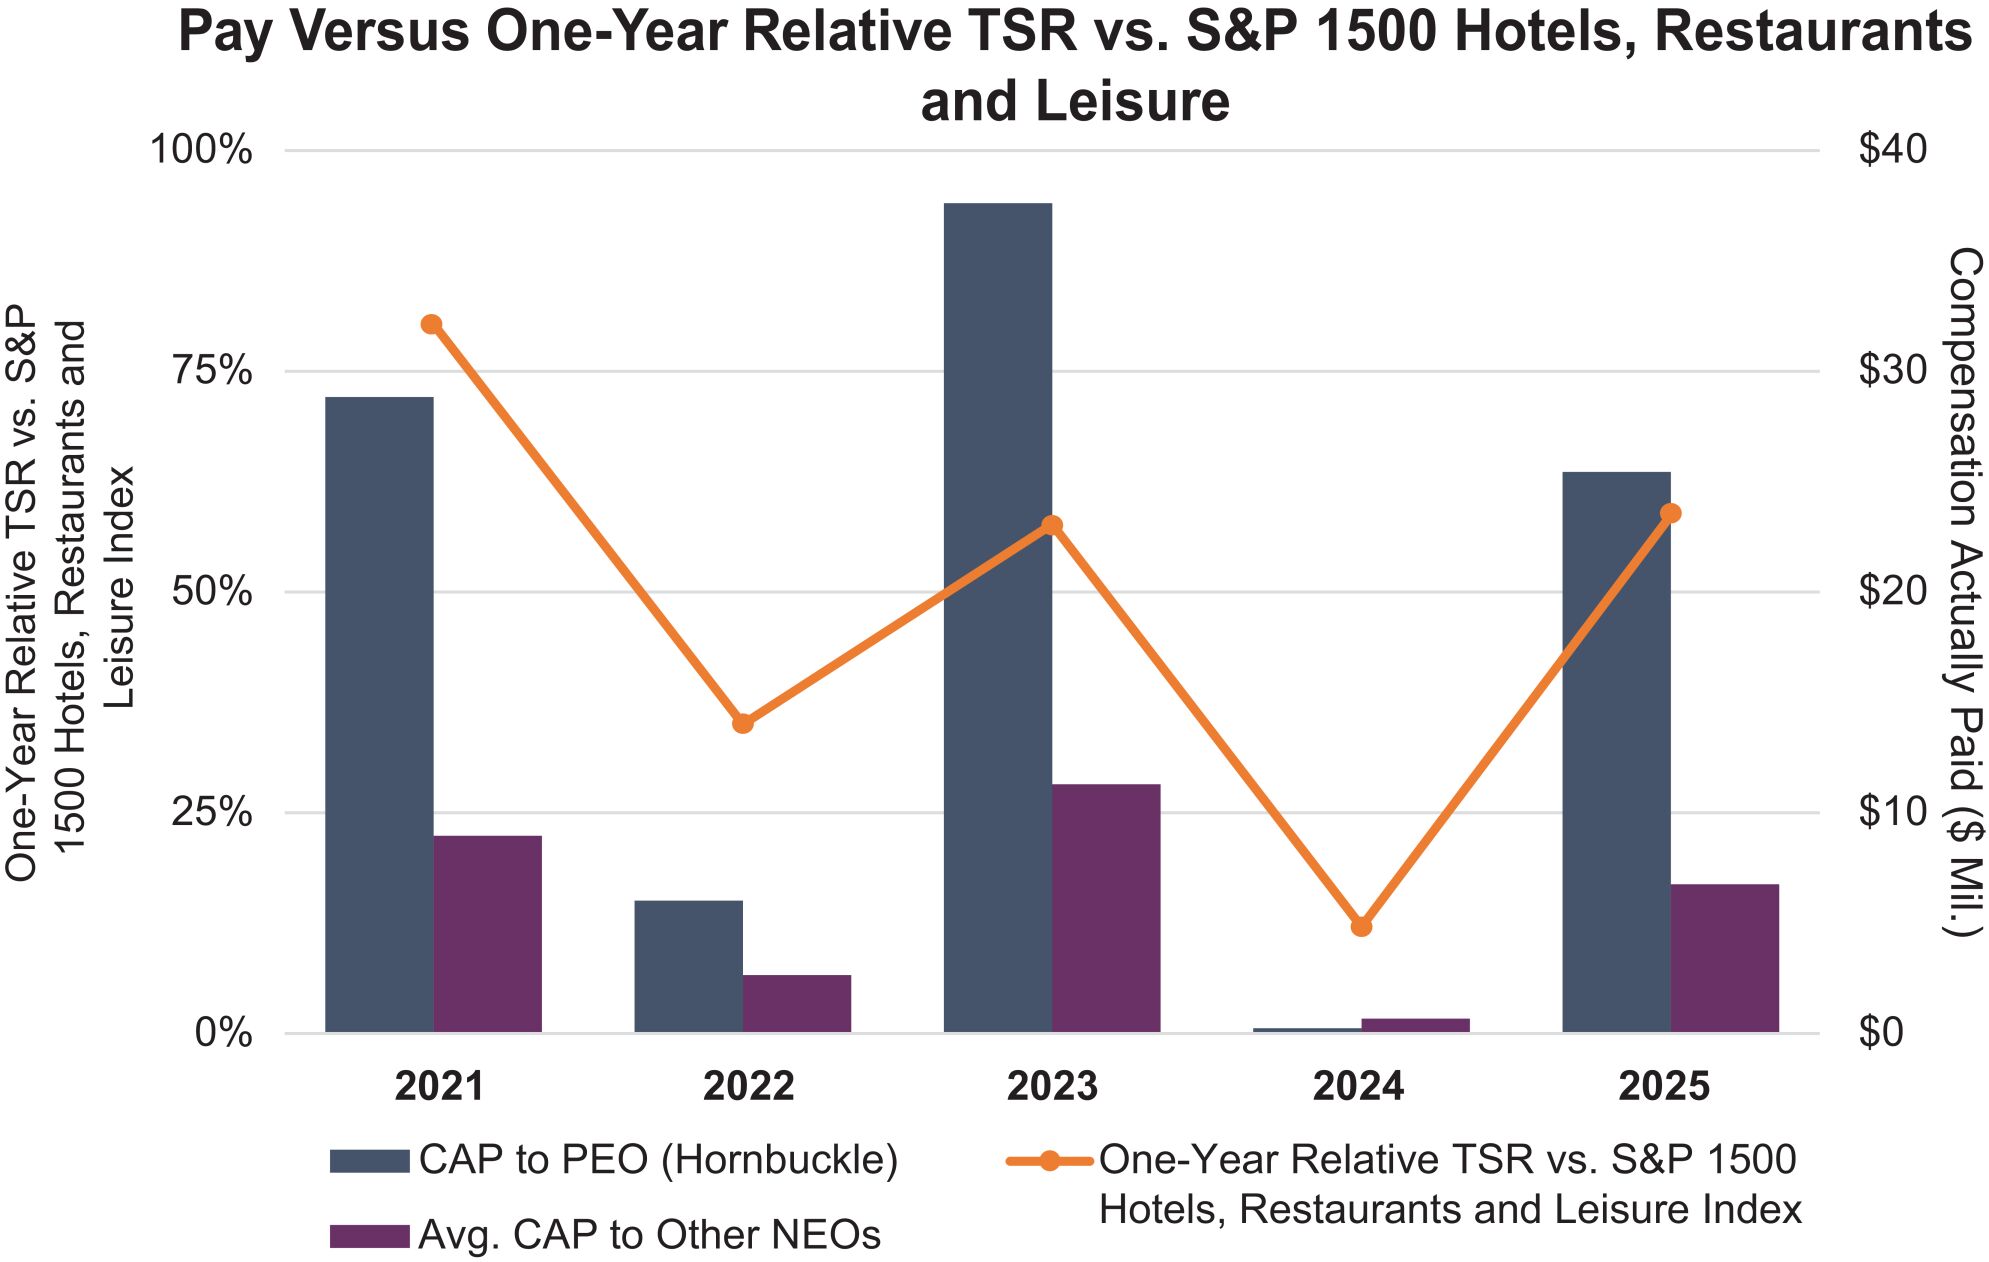
Compensation Actually Paid Versus TSR 2021-2025
Financial Performance Measures
The three most important financial performance measures used by the Company to link executive compensation actually paid to the Company’s NEOs, for the most recently completed fiscal year, to the Company’s performance are as follows:
| • | Total Shareholder Return (“TSR”). |
| • | Relative TSR, measured with respect to the S&P 1500 Hotels, Restaurants and Leisure Index. |
| • | Stock Price. |