v3.26.1
Pay vs Performance Disclosure
12 Months Ended
Dec. 31, 2025
USD ($)
Dec. 31, 2024
USD ($)
Dec. 31, 2023
USD ($)
Dec. 31, 2022
USD ($)
Dec. 31, 2021
USD ($)
Pay vs Performance Disclosure          
Pay vs Performance Disclosure, Table

PAY VERSUS PERFORMANCE TABLES

The following table sets forth information concerning the compensation paid to our CEO and to our other NEOs compared to Company performance for the years ended December 31, 2025, 2024, 2023, 2022, and 2021.


Summary Compensation Table Total Pay


Average Summary Compensation Table Total Pay for


Average CAP to


Value of Initial Fixed $100 Investment Based on:


GAAP Net


Core FFO


Year

for CEO(1)(2)


CAP to CEO(3)


Other NEOs(1)(2)


Other NEOs(3)


TSR


Peer TSR(4)


Income(5)


per share(6)


2025

$

9,909,777


$

2,398,542


$

4,493,229


$

531,437


$

139


$

127


$

1,797,032


$

16.97


2024


9,502,226


5,044,001


5,232,404


2,943,853


154


124


2,084,410


16.67


2023


8,776,291


11,147,987


3,753,576


4,390,198


151


118


2,160,120


16.89


2022


9,201,442


(1,902,305

)


4,844,366


(2,183,334

)


133


106


4,366,274


15.92


2021


10,358,153


41,035,570


5,944,502


25,331,675


167


141


1,959,639


12.93


(1)
The CEO for each year shown in the table was Joseph D. Russell, Jr. and the other NEOs were H. Thomas Boyle, Natalia N. Johnson, and Nathaniel A. Vitan. Chris C. Sambar, who joined the Company in October 2024, is included as an “other NEO” in 2024 and 2025 and David Lee, who resigned in August 2023, is included as an “other NEO” for 2023.
(2)
The 2021 values reflected in this column reflect both the grant date fair value of the 2021 performance-based RSU awards and the value attributable to COVID-19 related modifications made by the CHC Committee in 2021 to the 2020 performance-based RSU awards.
(3)
Compensation actually paid (“CAP”) is defined by the SEC and is computed in accordance with SEC rules by subtracting the amounts in the “Stock Awards” and “Option Awards” columns of the SCT for each year from the “Total” column of the SCT and then: (i) adding the fair value as of the end of the reported year of all awards granted during the reporting year that are outstanding and unvested as of the end of the reporting year; (ii) adding the amount equal to the change as of the end of the reporting year (from the end of the prior year) in fair value (whether positive or negative) of any awards granted in any prior year that are outstanding and unvested as of the end of the reporting year; (iii) adding, for awards that are granted and vest in the reporting year, the fair value as of the vesting date; (iv) adding the amount equal to the change as of the vesting date (from the end of the prior fiscal year) in fair value (whether positive or negative) of any awards granted in any prior year for which all applicable vesting conditions were satisfied at the end of or during the reporting year; (v) subtracting, for any awards granted in any prior year that are forfeited during the reporting year, the amount equal to the fair value at the end of the prior year; and (vi) adding the value of any dividends (or dividend equivalents) paid in the reporting year on unvested equity awards. The following tables reflect the adjustments made to SCT total compensation for 2025 to compute CAP for our CEO and average CAP for our other NEOs:


SCT Total Pay


Minus 
SCT Equity Awards


Plus
Value of New Unvested Awards


Plus
Change in Value of Prior Years Unvested Awards


Plus
Value of New Vested Awards


Plus
Change in Value of Prior Years Vested Awards


Minus
Value of Forfeited Prior Years Awards


Plus
Dividends on Unvested Awards/ Accrued Dividends


Equals 
CAP


CEO

$

9,909,777


$

6,889,954


$

4,398,949


$

(5,230,106

)

$


$

(516,305

)

$


$

726,181


$

2,398,542


Other NEOs
(Average)

$

4,493,229


$

2,942,799


$

1,878,849


$

(2,939,138

)

$


$

(282,105

)

$


$

323,401


$

531,437


(4)
Reflects the cumulative TSR of the Company and the NAREIT Equity Index for the year ended December 31, 2021, the two years ended December 31, 2022, the three years ended December 31, 2023, the four years ended December 31, 2024, and the five years ended December 31, 2025 assuming a $100 investment at the closing price on December 31, 2020 and the reinvestment of all dividends.
(5)
Amounts in thousands.
(6)
Core FFO per share is a non-GAAP measure. Refer to pages 26-27 of our 2025 Annual Report on Form 10-K filed on February 12, 2026 for information regarding Core FFO per share, including a reconciliation to GAAP earnings per share.

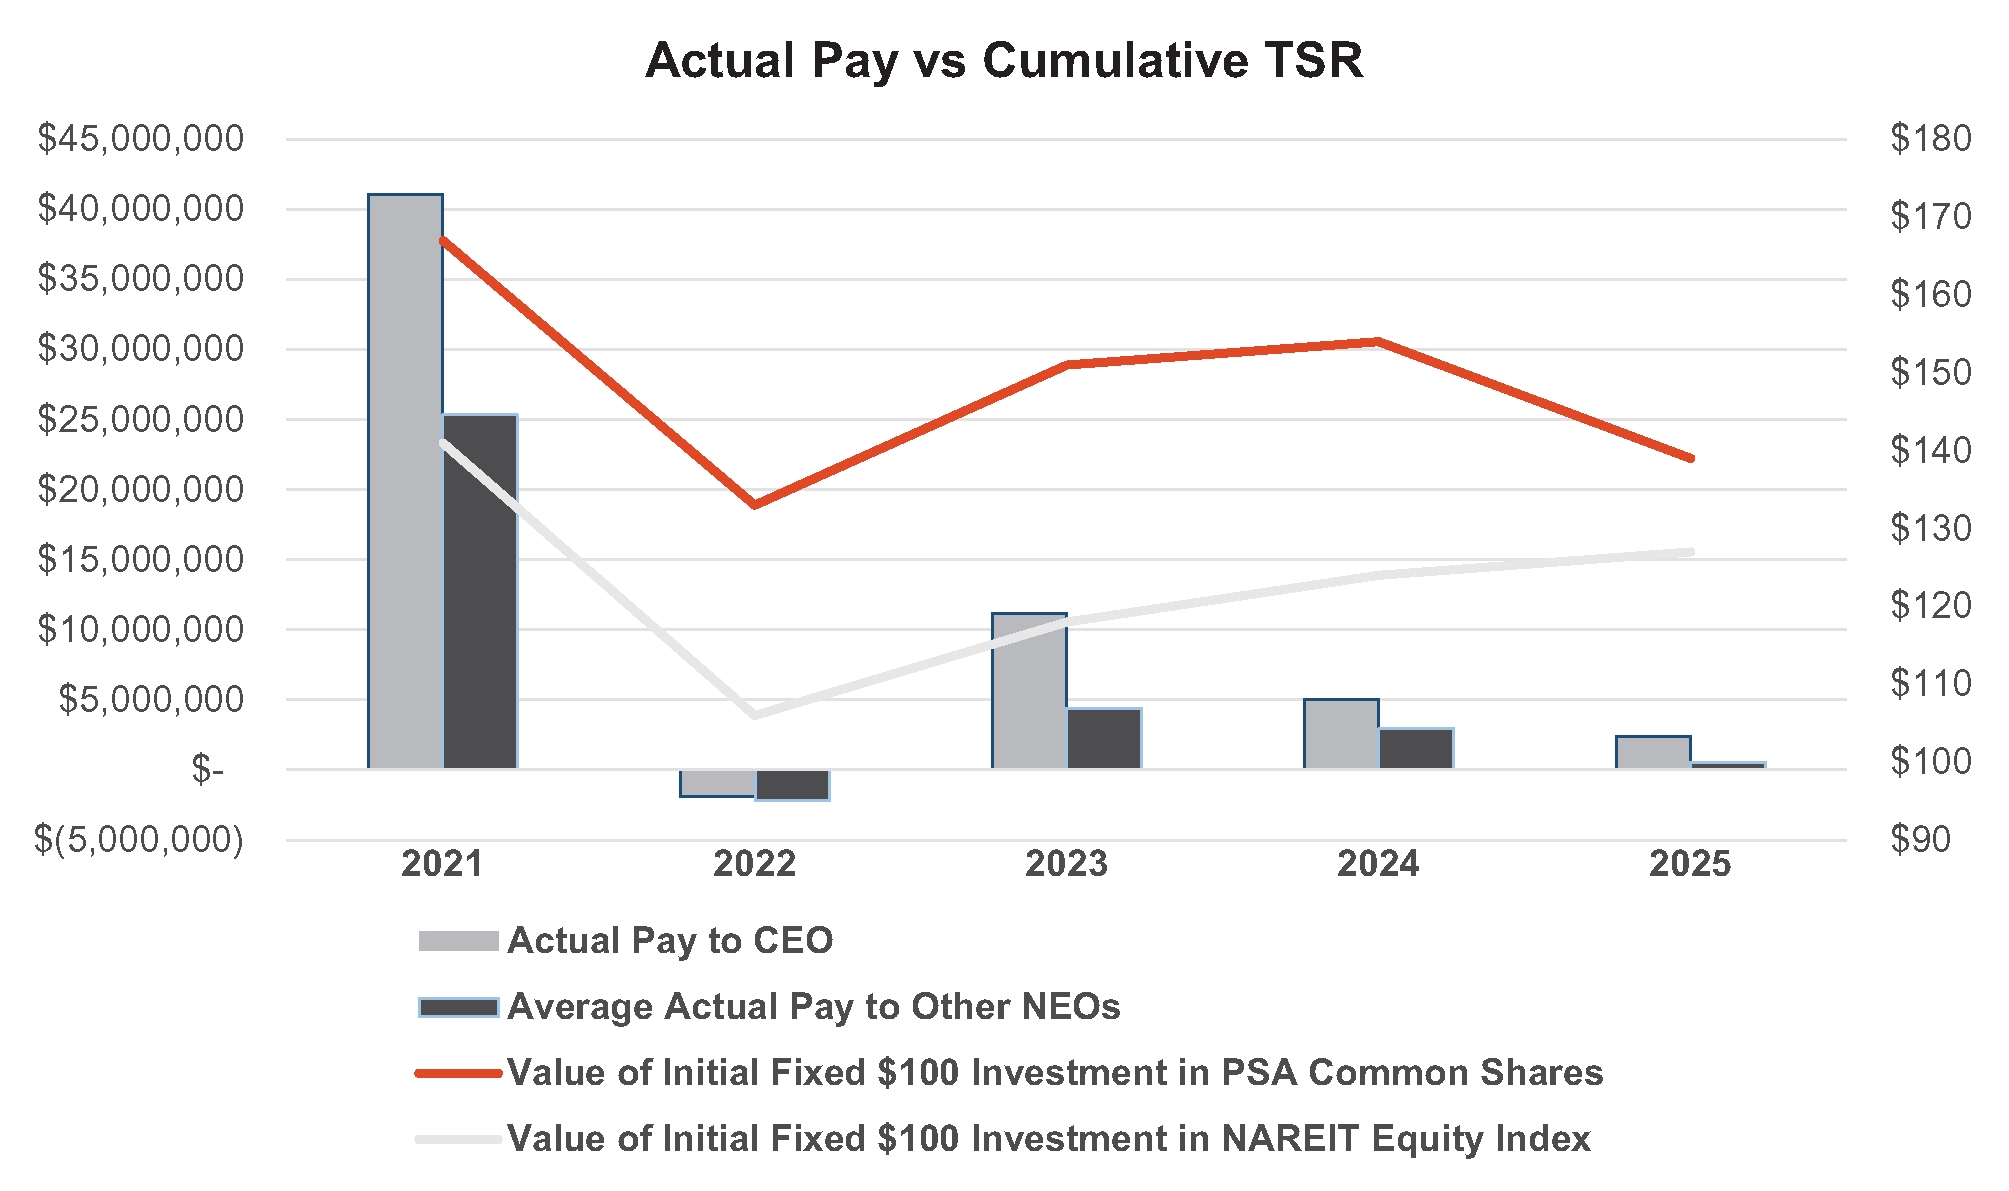
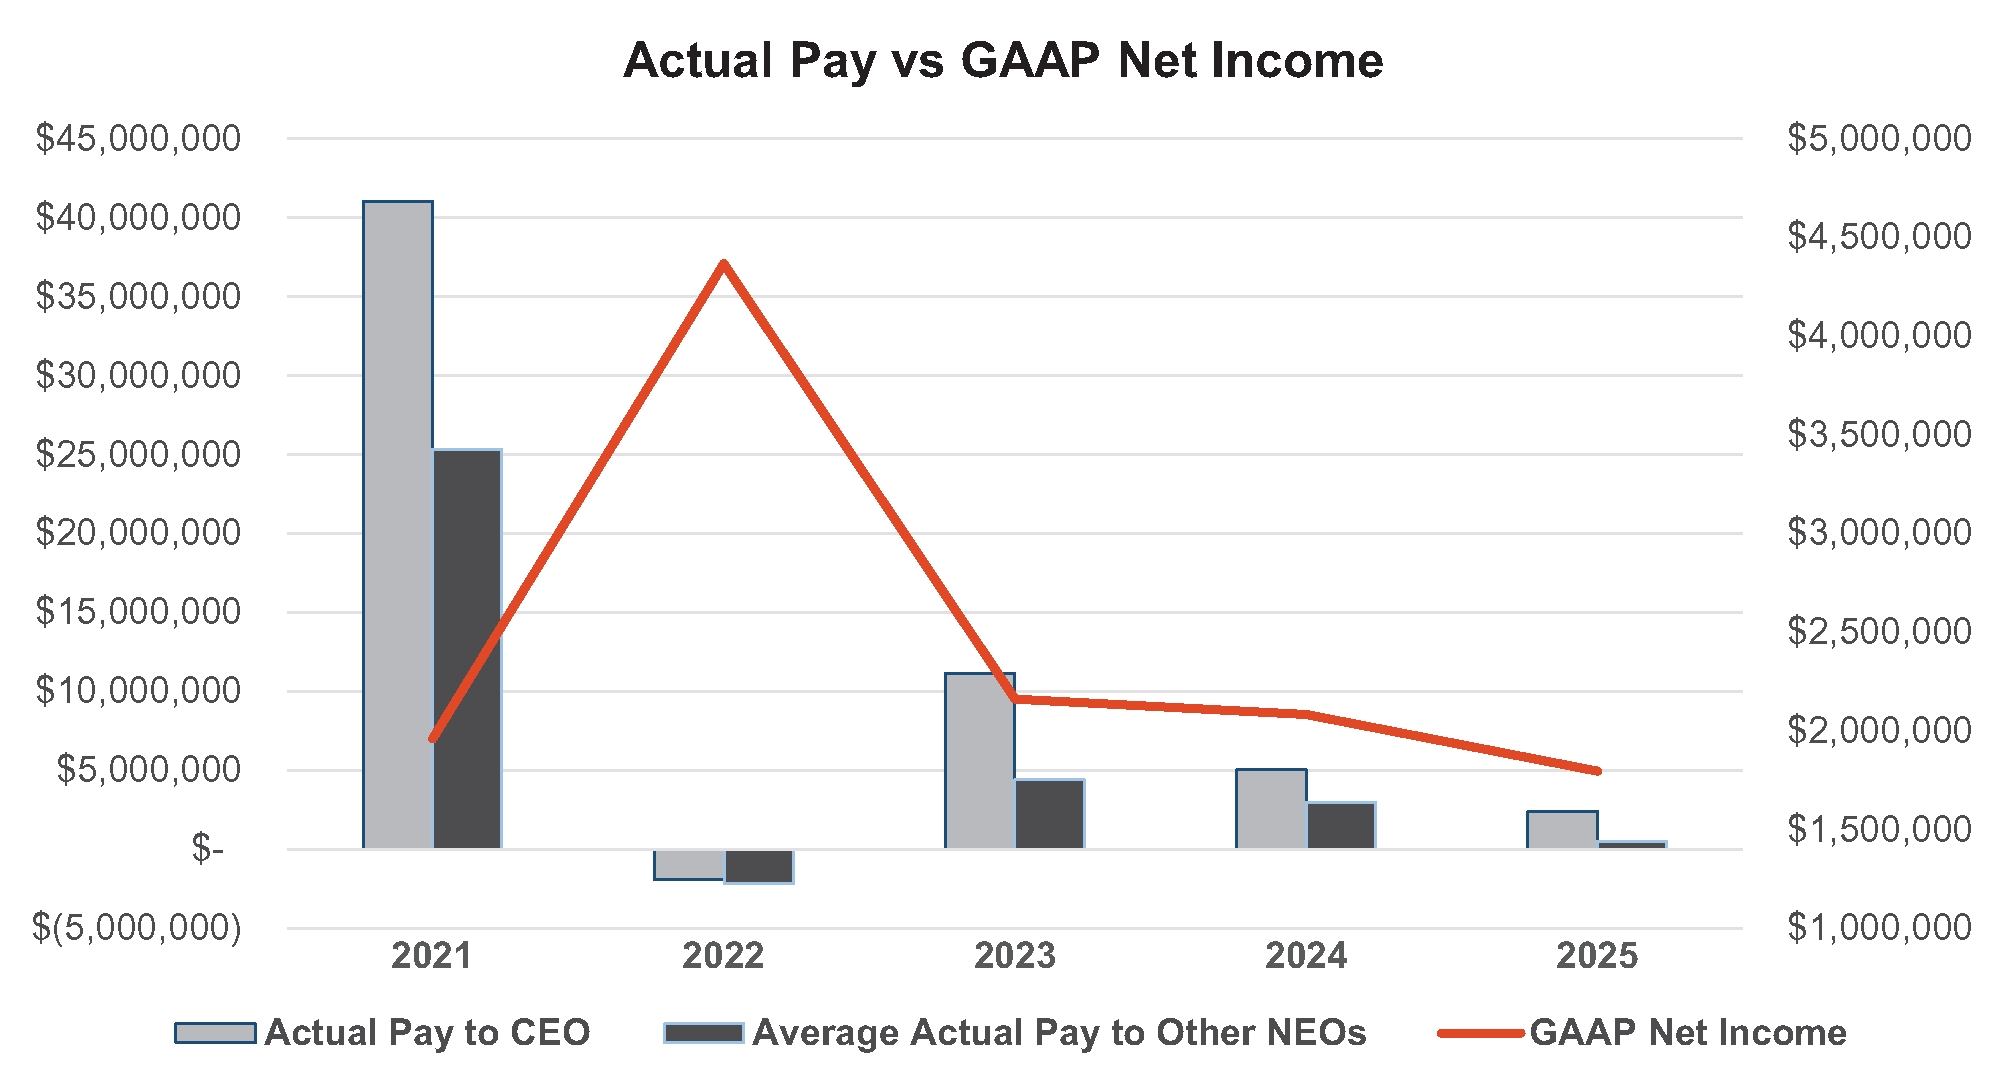
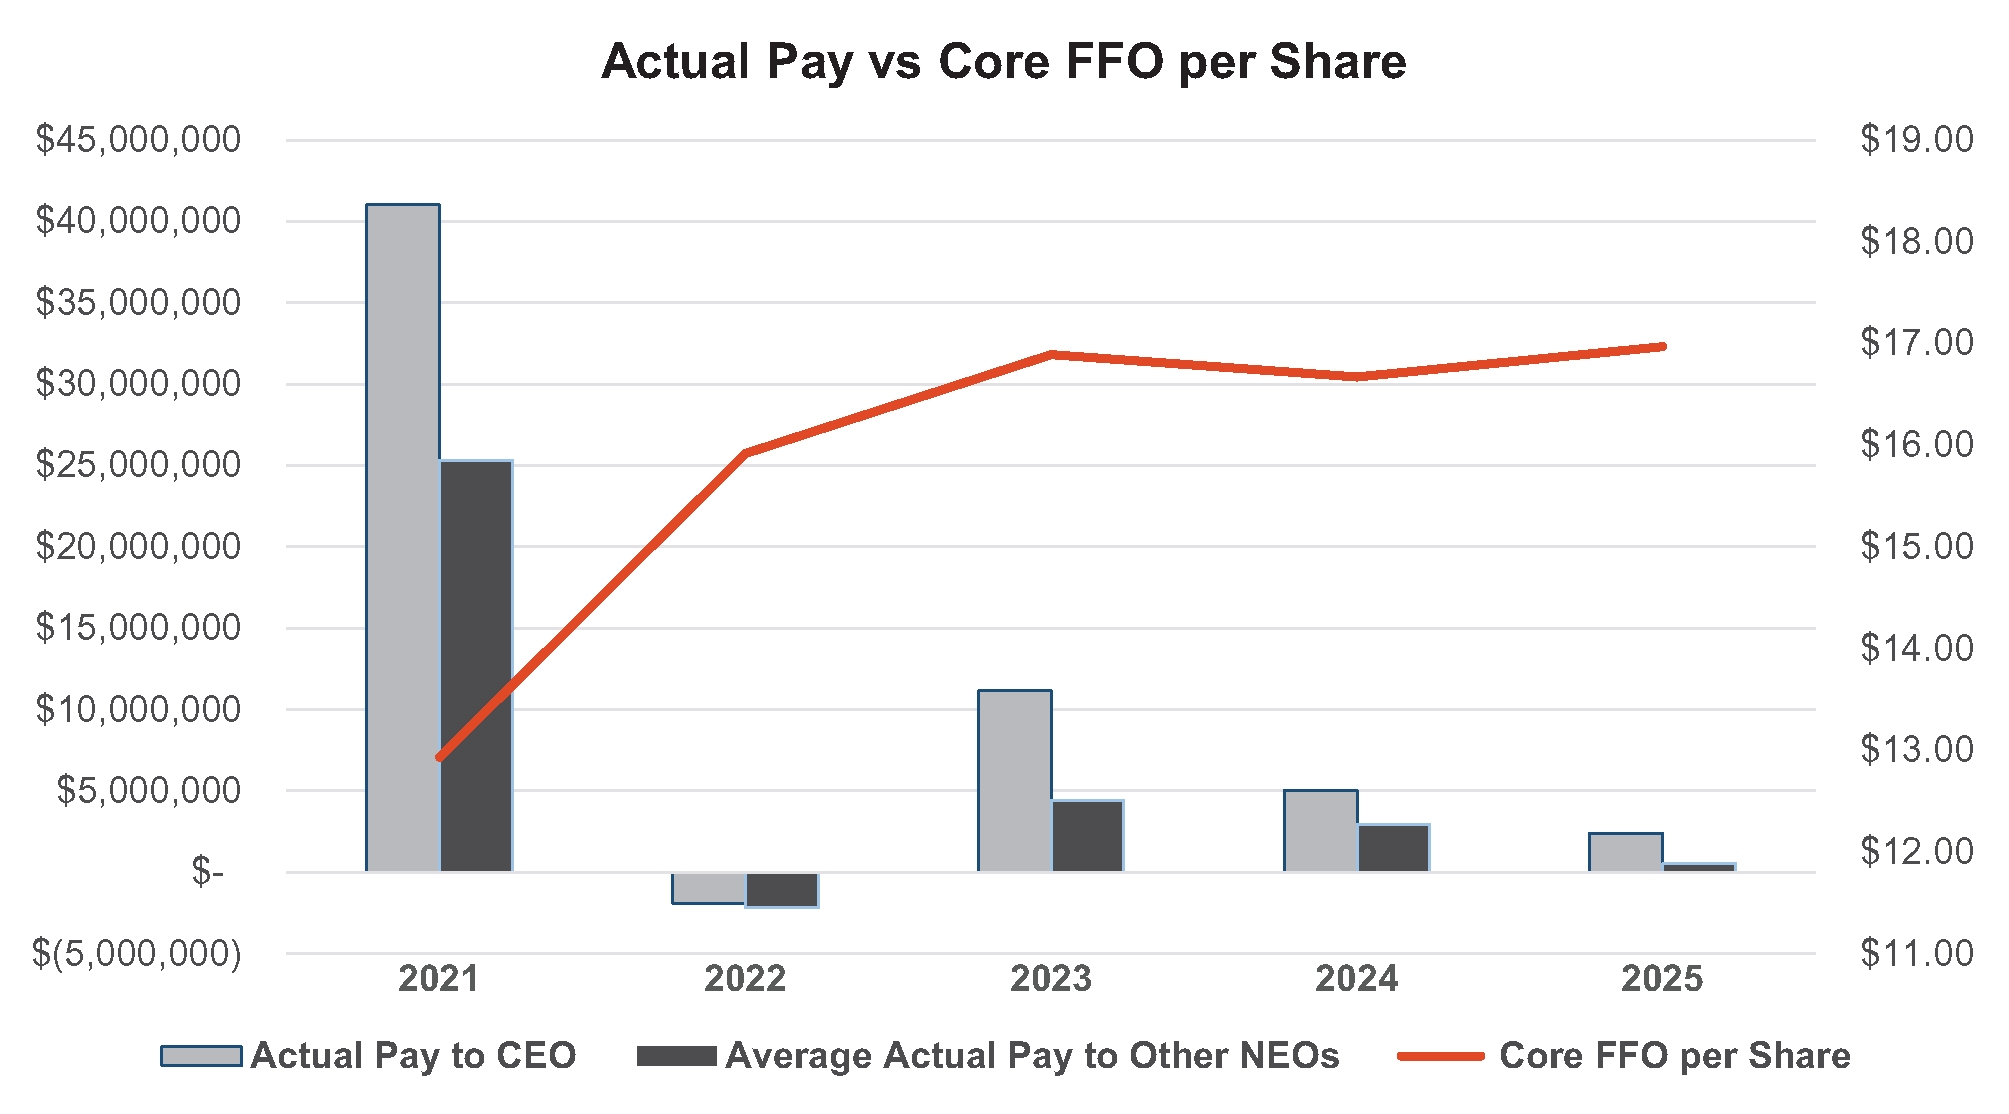
Relationship of CAP to Performance. The following graphs illustrate the relationship during 2021 to 2025 of the CAP for our CEO and the average CAP for our other NEOs (each as set forth in the table above), to (i) our cumulative TSR and the cumulative TSR of the constituent companies in the NAREIT Equity Index, (ii) our GAAP net income, and (iii) our Core FFO per share (in each case as set forth in the table above).


img70814762_25.jpg


img70814762_26.jpg


img70814762_27.jpg


Financial Performance Measures. The most important financial performance measures used by the Company in setting pay-for-performance compensation for the most recently completed year are described in the table below. The manner in which these measures, together with certain non-financial performance measures, determine the amounts of incentive compensation paid to our NEOs is described above in the “Compensation Discussion and Analysis” section of this proxy statement.

Significant Financial Performance Measures

Core FFO Per Share Growth

TSR Performance (versus the TSR of the S&P 500 Equity REITs)

TSR Performance (versus the Company’s Self-Storage REIT Competitors)

       
Company Selected Measure Name Core FFO        
Named Executive Officers, Footnote
(1)
The CEO for each year shown in the table was Joseph D. Russell, Jr. and the other NEOs were H. Thomas Boyle, Natalia N. Johnson, and Nathaniel A. Vitan. Chris C. Sambar, who joined the Company in October 2024, is included as an “other NEO” in 2024 and 2025 and David Lee, who resigned in August 2023, is included as an “other NEO” for 2023.
       
Peer Group Issuers, Footnote
(4)
Reflects the cumulative TSR of the Company and the NAREIT Equity Index for the year ended December 31, 2021, the two years ended December 31, 2022, the three years ended December 31, 2023, the four years ended December 31, 2024, and the five years ended December 31, 2025 assuming a $100 investment at the closing price on December 31, 2020 and the reinvestment of all dividends.
       
PEO Total Compensation Amount $ 9,909,777 $ 9,502,226 $ 8,776,291 $ 9,201,442 $ 10,358,153
PEO Actually Paid Compensation Amount $ 2,398,542 5,044,001 11,147,987 (1,902,305) 41,035,570
Adjustment To PEO Compensation, Footnote


SCT Total Pay


Minus 
SCT Equity Awards


Plus
Value of New Unvested Awards


Plus
Change in Value of Prior Years Unvested Awards


Plus
Value of New Vested Awards


Plus
Change in Value of Prior Years Vested Awards


Minus
Value of Forfeited Prior Years Awards


Plus
Dividends on Unvested Awards/ Accrued Dividends


Equals 
CAP


CEO

$

9,909,777


$

6,889,954


$

4,398,949


$

(5,230,106

)

$


$

(516,305

)

$


$

726,181


$

2,398,542


Other NEOs
(Average)

$

4,493,229


$

2,942,799


$

1,878,849


$

(2,939,138

)

$


$

(282,105

)

$


$

323,401


$

531,437


Non-PEO NEO Average Total Compensation Amount $ 4,493,229 5,232,404 3,753,576 4,844,366 5,944,502
Non-PEO NEO Average Compensation Actually Paid Amount $ 531,437 2,943,853 4,390,198 (2,183,334) 25,331,675
Adjustment to Non-PEO NEO Compensation Footnote


SCT Total Pay


Minus 
SCT Equity Awards


Plus
Value of New Unvested Awards


Plus
Change in Value of Prior Years Unvested Awards


Plus
Value of New Vested Awards


Plus
Change in Value of Prior Years Vested Awards


Minus
Value of Forfeited Prior Years Awards


Plus
Dividends on Unvested Awards/ Accrued Dividends


Equals 
CAP


CEO

$

9,909,777


$

6,889,954


$

4,398,949


$

(5,230,106

)

$


$

(516,305

)

$


$

726,181


$

2,398,542


Other NEOs
(Average)

$

4,493,229


$

2,942,799


$

1,878,849


$

(2,939,138

)

$


$

(282,105

)

$


$

323,401


$

531,437


Compensation Actually Paid vs. Total Shareholder Return

img70814762_25.jpg

       
Compensation Actually Paid vs. Net Income

img70814762_26.jpg

       
Compensation Actually Paid vs. Company Selected Measure

img70814762_27.jpg

       
Tabular List, Table

Financial Performance Measures. The most important financial performance measures used by the Company in setting pay-for-performance compensation for the most recently completed year are described in the table below. The manner in which these measures, together with certain non-financial performance measures, determine the amounts of incentive compensation paid to our NEOs is described above in the “Compensation Discussion and Analysis” section of this proxy statement.

Significant Financial Performance Measures

Core FFO Per Share Growth

TSR Performance (versus the TSR of the S&P 500 Equity REITs)

TSR Performance (versus the Company’s Self-Storage REIT Competitors)

       
Total Shareholder Return Amount $ 139 154 151 133 167
Peer Group Total Shareholder Return Amount $ 127 $ 124 $ 118 $ 106 $ 141
Company Selected Measure Amount 16.97 16.67 16.89 15.92 12.93
PEO Name Joseph D. Russell, Jr.        
Net Income $ 1,797,032,000 $ 2,084,410,000 $ 2,160,120,000 $ 4,366,274,000 $ 1,959,639,000
Measure:: 1          
Pay vs Performance Disclosure          
Name Core FFO Per Share Growth        
Measure:: 2          
Pay vs Performance Disclosure          
Name TSR Performance (versus the TSR of the S&P 500 Equity REITs)        
Measure:: 3          
Pay vs Performance Disclosure          
Name TSR Performance (versus the Company’s Self-Storage REIT Competitors)        
PEO          
Pay vs Performance Disclosure          
RealizedPay $ 11,644,163 11,255,379 11,298,478 5,431,540 3,845,336
PEO | Aggregate Grant Date Fair Value of Equity Award Amounts Reported in Summary Compensation Table          
Pay vs Performance Disclosure          
Adjustment to Compensation, Amount (6,889,954)        
PEO | Year-end Fair Value of Equity Awards Granted in Covered Year that are Outstanding and Unvested          
Pay vs Performance Disclosure          
Adjustment to Compensation, Amount 4,398,949        
PEO | Year-over-Year Change in Fair Value of Equity Awards Granted in Prior Years That are Outstanding and Unvested          
Pay vs Performance Disclosure          
Adjustment to Compensation, Amount (5,230,106)        
PEO | Vesting Date Fair Value of Equity Awards Granted and Vested in Covered Year          
Pay vs Performance Disclosure          
Adjustment to Compensation, Amount 0        
PEO | Change in Fair Value as of Vesting Date of Prior Year Equity Awards Vested in Covered Year          
Pay vs Performance Disclosure          
Adjustment to Compensation, Amount (516,305)        
PEO | Prior Year End Fair Value of Equity Awards Granted in Any Prior Year that Fail to Meet Applicable Vesting Conditions During Covered Year          
Pay vs Performance Disclosure          
Adjustment to Compensation, Amount 0        
PEO | Dividends or Other Earnings Paid on Equity Awards not Otherwise Reflected in Total Compensation for Covered Year          
Pay vs Performance Disclosure          
Adjustment to Compensation, Amount 726,181        
Non-PEO NEO          
Pay vs Performance Disclosure          
RealizedPay 5,714,037 $ 5,848,573 $ 4,775,273 $ 2,590,905 $ 2,231,378
Non-PEO NEO | Aggregate Grant Date Fair Value of Equity Award Amounts Reported in Summary Compensation Table          
Pay vs Performance Disclosure          
Adjustment to Compensation, Amount (2,942,799)        
Non-PEO NEO | Year-end Fair Value of Equity Awards Granted in Covered Year that are Outstanding and Unvested          
Pay vs Performance Disclosure          
Adjustment to Compensation, Amount 1,878,849        
Non-PEO NEO | Year-over-Year Change in Fair Value of Equity Awards Granted in Prior Years That are Outstanding and Unvested          
Pay vs Performance Disclosure          
Adjustment to Compensation, Amount (2,939,138)        
Non-PEO NEO | Vesting Date Fair Value of Equity Awards Granted and Vested in Covered Year          
Pay vs Performance Disclosure          
Adjustment to Compensation, Amount 0        
Non-PEO NEO | Change in Fair Value as of Vesting Date of Prior Year Equity Awards Vested in Covered Year          
Pay vs Performance Disclosure          
Adjustment to Compensation, Amount (282,105)        
Non-PEO NEO | Prior Year End Fair Value of Equity Awards Granted in Any Prior Year that Fail to Meet Applicable Vesting Conditions During Covered Year          
Pay vs Performance Disclosure          
Adjustment to Compensation, Amount 0        
Non-PEO NEO | Dividends or Other Earnings Paid on Equity Awards not Otherwise Reflected in Total Compensation for Covered Year          
Pay vs Performance Disclosure          
Adjustment to Compensation, Amount $ 323,401