Pay vs Performance Disclosure - USD ($)
Dec. 31, 2025
Dec. 31, 2024
Dec. 31, 2023
Dec. 31, 2022
Dec. 31, 2021
Pay Versus Performance
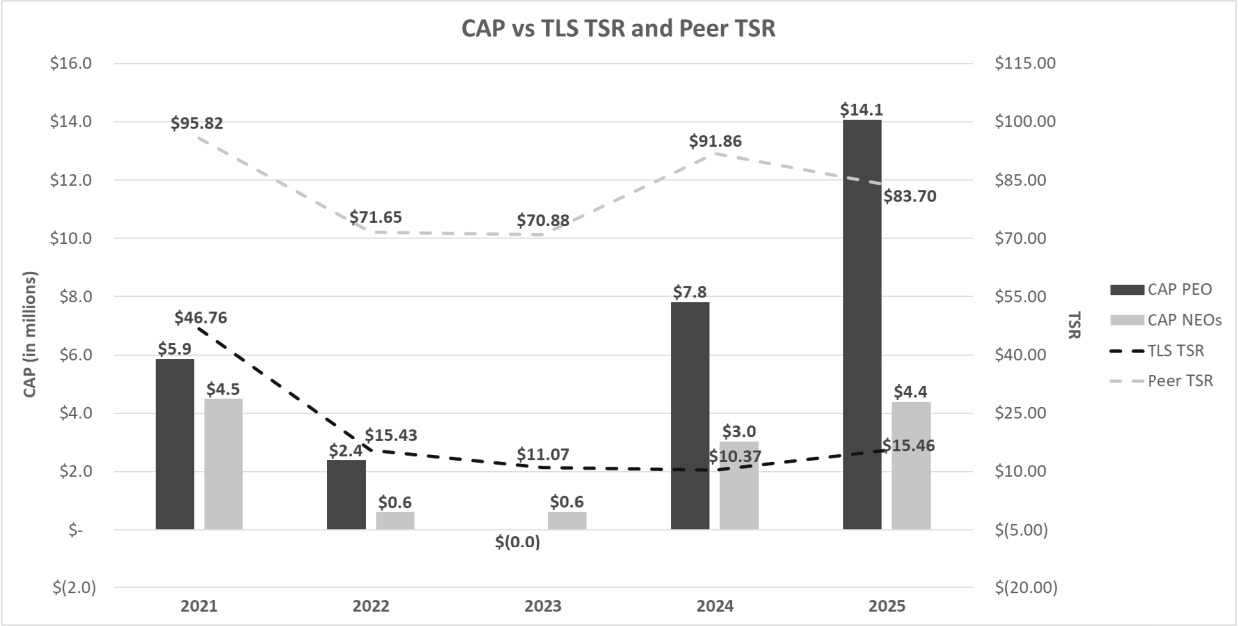
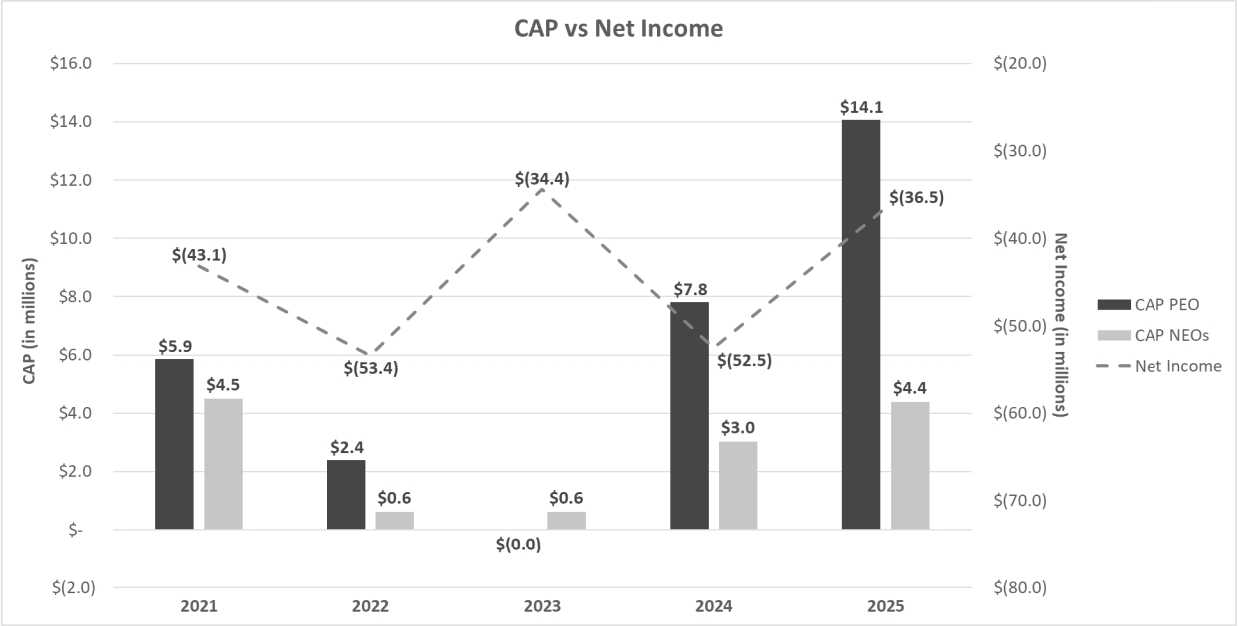
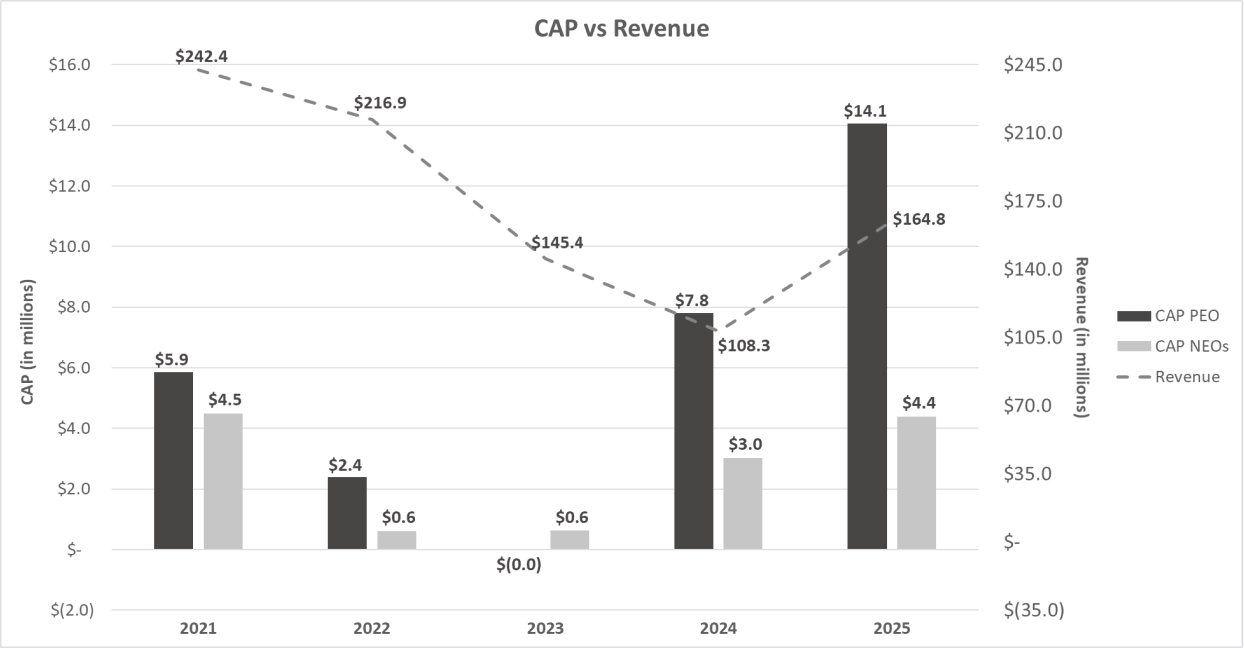
Summary Compensation Table Total for PEO(1) | Compensation Actually Paid to PEO(2) | Average Summary Compensation Table Total for Non-PEO Named Executive Officers(3) | Average Compensation Actually Paid to Non-PEO Named Executive Officers(4) | Value of Initial Fixed $100 Investment Based on: | Net Income | Total Revenue | ||||||||||||||||||
Year | Total Shareholder Return | Peer Group(5) Total Shareholder Return | ||||||||||||||||||||||
2025 | $2,848,275 | $14,066,083 | $1,127,793 | $4,384,842 | $15.46 | $83.70 | $(36,546,000) | $164,805,000 | ||||||||||||||||
2024 | 18,082,345 | 7,805,464 | 5,688,559 | 3,023,164 | 10.37 | 91.86 | (52,520,000) | 108,272,000 | ||||||||||||||||
2023 | 1,249,826 | (12,929) | 1,009,950 | 622,506 | 11.07 | 70.88 | (34,473,000) | 145,378,000 | ||||||||||||||||
2022 | 10,727,344 | 2,383,319 | 4,645,884 | 605,348 | 15.43 | 71.65 | (53,428,000) | 216,887,000 | ||||||||||||||||
2021 | 12,197,174 | 5,857,632 | 8,744,031 | 4,489,920 | 46.76 | 95.82 | (43,134,000) | 242,433,000 | ||||||||||||||||
(1) | The Principal Executive Officer (PEO) for the reporting periods is Mr. John B. Wood, Chairman and Chief Executive Officer. |
(2) | The calculations for compensation actually paid (for both PEO and NEOs) are set forth below the footnotes to this table. The year-end fair value of certain equity awards subject to performance conditions granted in a prior year and outstanding and unvested at the end of the year contained a materially different assumption regarding the probability (as of year-end) of meeting the performance conditions. On December 31, 2024, the Company assumed it was not probable that the conditions would be met. During the following fiscal year the performance conditions were amended, and on December 31, 2025, the assumption had changed to probable. |
(3) | The Named Executive Officers (NEOs), other than the PEO, for 2025 and 2024 were Messrs. Bendza, Griffin, Robbins, and Cooke. For 2023, the NEOs were Messrs. Bendza, Griffin, and Robbins. For 2022, the NEOs were: Messrs. Bendza, Robbins, Griffin and Brendan Malloy. For 2021, the NEOs were: Messrs. Bendza, Malloy, Griffin, Edward Williams, Jefferson Wright, and Ms. Michele Nakazawa. |
(4) | Average compensation actually paid to non-PEO NEOs in 2021 and 2022 is significantly impacted by a one-time equity award to Mark Griffin in 2021, valued at $29 million at the time of grant. Mr. Griffin’s award was granted to reflect his role in the creation of value in Telos ID as reflected in its purchase price in connection with our IPO, and to align his compensation with similarly-situated Company executives. |
(5) | For 2025, the Peer Group consists of: Red Violet, Inc.; Domo, Inc.; Digimarc Corp.; Agilysys, Inc.; Mitek Systems, Inc.; OneSpan, Inc.; SoundThinking, Inc.; A10 Networks, Inc.; Veritone, Inc.; Crexendo, Inc.; eGain Corp.; and Synchronoss Technologies, Inc. For 2024, the Peer Group consisted of Agilysys, Inc., A10 Networks, Inc., Qualys, Inc., Tenable Holdings, Inc., Varonis Systems, Inc., OneSpan, Inc., Mitek Systems, Inc., PagerDuty, Inc., Rapid7, Inc., LiveRamp Holdings, Inc., and Veritone, Inc. The Total Shareholder Return, by year, for the 2024 Proxy Peers was: 2021 - $99.52; 2022 - $62.48; 2023 - $86.80; 2024 - $77.73; and 2025 - $61.11. At page 23 of this Proxy Statement, we discuss the changes made to our compensation peer group and the rationale therefore, and incorporate that discussion herein. In addition, one company that was included in the peer group for TSR calculation in the prior fiscal year (PROS Holdings, Inc.) was not included in the 2024 Proxy Peers because it is no longer a public company and therefore was not included as a result of the application of pre-established objective criteria (the requirement to be a publicly-traded company). Two companies that were compensation peers in 2025 (PROS Holdings, Inc. and Couchbase, Inc.) were not used to calculate TSR for the same reason, and a third (Backblaze, Inc.) was not used to calculate TSR because it was not a public company and did not meet the pre-established objective criteria for the full fiscal years 2021-2025. |
Compensation actually paid or “CAP” is an amount calculated in accordance with applicable SEC rules and does not necessarily correlate to the total amount of cash or equity compensation that the executive actually realized or was paid during any fiscal year. The CAP is a calculation that includes, for example, the increase (or decrease) in value of certain elements of compensation (i.e., equity compensation) over the fiscal year, even if granted in a prior year. The amounts that the executive will ultimately receive with respect to these types of compensation (i.e., when and if the equity awards vest) are likely to be different from the amounts disclosed in this Pay versus Performance disclosure.
PEO | Non-PEO NEO | |||||
2025 | 2025 | |||||
Summary Compensation Table Total | $2,848,275 | $1,127,793 | ||||
Reported Value of Equity Awards | (2,200,075) | (733,358) | ||||
Year End Fair Value of Equity Awards Granted during the Year that are Outstanding and Unvested at End of Year | 4,240,393 | 1,413,464 | ||||
Change in Fair Value of Equity Awards Granted in Prior Years that are Outstanding and Unvested at End of Year | 5,200,680 | 1,745,469 | ||||
Fair Value as of Vesting Date of Equity Awards Granted and Vested in the Year | — | — | ||||
Change in Fair Value of Equity Awards Granted in Prior Years that Vested in the Year | 3,976,810 | 831,473 | ||||
Fair Value at the End of the Prior Year of Equity Awards that Failed to Meet Vesting Conditions in the Covered Fiscal Year | — | — | ||||
Value of Dividends or Other Earnings Paid on Stock or Option Awards Not Otherwise Reflected in Fair Value or Total Compensation | — | — | ||||
Total Equity Award Adjustments | 11,217,809 | 3,257,049 | ||||
Reported Change in the Actuarial Present Value of Pension Benefits | — | — | ||||
Pension Benefit Adjustments | — | — | ||||
Compensation Actually Paid | 14,066,083 | 4,384,842 | ||||
(1) | The Principal Executive Officer (PEO) for the reporting periods is Mr. John B. Wood, Chairman and Chief Executive Officer. |
(3) | The Named Executive Officers (NEOs), other than the PEO, for 2025 and 2024 were Messrs. Bendza, Griffin, Robbins, and Cooke. For 2023, the NEOs were Messrs. Bendza, Griffin, and Robbins. For 2022, the NEOs were: Messrs. Bendza, Robbins, Griffin and Brendan Malloy. For 2021, the NEOs were: Messrs. Bendza, Malloy, Griffin, Edward Williams, Jefferson Wright, and Ms. Michele Nakazawa. |
(5) | For 2025, the Peer Group consists of: Red Violet, Inc.; Domo, Inc.; Digimarc Corp.; Agilysys, Inc.; Mitek Systems, Inc.; OneSpan, Inc.; SoundThinking, Inc.; A10 Networks, Inc.; Veritone, Inc.; Crexendo, Inc.; eGain Corp.; and Synchronoss Technologies, Inc. For 2024, the Peer Group consisted of Agilysys, Inc., A10 Networks, Inc., Qualys, Inc., Tenable Holdings, Inc., Varonis Systems, Inc., OneSpan, Inc., Mitek Systems, Inc., PagerDuty, Inc., Rapid7, Inc., LiveRamp Holdings, Inc., and Veritone, Inc. The Total Shareholder Return, by year, for the 2024 Proxy Peers was: 2021 - $99.52; 2022 - $62.48; 2023 - $86.80; 2024 - $77.73; and 2025 - $61.11. At page 23 of this Proxy Statement, we discuss the changes made to our compensation peer group and the rationale therefore, and incorporate that discussion herein. In addition, one company that was included in the peer group for TSR calculation in the prior fiscal year (PROS Holdings, Inc.) was not included in the 2024 Proxy Peers because it is no longer a public company and therefore was not included as a result of the application of pre-established objective criteria (the requirement to be a publicly-traded company). Two companies that were compensation peers in 2025 (PROS Holdings, Inc. and Couchbase, Inc.) were not used to calculate TSR for the same reason, and a third (Backblaze, Inc.) was not used to calculate TSR because it was not a public company and did not meet the pre-established objective criteria for the full fiscal years 2021-2025. |
(5) | For 2025, the Peer Group consists of: Red Violet, Inc.; Domo, Inc.; Digimarc Corp.; Agilysys, Inc.; Mitek Systems, Inc.; OneSpan, Inc.; SoundThinking, Inc.; A10 Networks, Inc.; Veritone, Inc.; Crexendo, Inc.; eGain Corp.; and Synchronoss Technologies, Inc. For 2024, the Peer Group consisted of Agilysys, Inc., A10 Networks, Inc., Qualys, Inc., Tenable Holdings, Inc., Varonis Systems, Inc., OneSpan, Inc., Mitek Systems, Inc., PagerDuty, Inc., Rapid7, Inc., LiveRamp Holdings, Inc., and Veritone, Inc. The Total Shareholder Return, by year, for the 2024 Proxy Peers was: 2021 - $99.52; 2022 - $62.48; 2023 - $86.80; 2024 - $77.73; and 2025 - $61.11. At page 23 of this Proxy Statement, we discuss the changes made to our compensation peer group and the rationale therefore, and incorporate that discussion herein. In addition, one company that was included in the peer group for TSR calculation in the prior fiscal year (PROS Holdings, Inc.) was not included in the 2024 Proxy Peers because it is no longer a public company and therefore was not included as a result of the application of pre-established objective criteria (the requirement to be a publicly-traded company). Two companies that were compensation peers in 2025 (PROS Holdings, Inc. and Couchbase, Inc.) were not used to calculate TSR for the same reason, and a third (Backblaze, Inc.) was not used to calculate TSR because it was not a public company and did not meet the pre-established objective criteria for the full fiscal years 2021-2025. |
Compensation actually paid or “CAP” is an amount calculated in accordance with applicable SEC rules and does not necessarily correlate to the total amount of cash or equity compensation that the executive actually realized or was paid during any fiscal year. The CAP is a calculation that includes, for example, the increase (or decrease) in value of certain elements of compensation (i.e., equity compensation) over the fiscal year, even if granted in a prior year. The amounts that the executive will ultimately receive with respect to these types of compensation (i.e., when and if the equity awards vest) are likely to be different from the amounts disclosed in this Pay versus Performance disclosure.
PEO | Non-PEO NEO | |||||
2025 | 2025 | |||||
Summary Compensation Table Total | $2,848,275 | $1,127,793 | ||||
Reported Value of Equity Awards | (2,200,075) | (733,358) | ||||
Year End Fair Value of Equity Awards Granted during the Year that are Outstanding and Unvested at End of Year | 4,240,393 | 1,413,464 | ||||
Change in Fair Value of Equity Awards Granted in Prior Years that are Outstanding and Unvested at End of Year | 5,200,680 | 1,745,469 | ||||
Fair Value as of Vesting Date of Equity Awards Granted and Vested in the Year | — | — | ||||
Change in Fair Value of Equity Awards Granted in Prior Years that Vested in the Year | 3,976,810 | 831,473 | ||||
Fair Value at the End of the Prior Year of Equity Awards that Failed to Meet Vesting Conditions in the Covered Fiscal Year | — | — | ||||
Value of Dividends or Other Earnings Paid on Stock or Option Awards Not Otherwise Reflected in Fair Value or Total Compensation | — | — | ||||
Total Equity Award Adjustments | 11,217,809 | 3,257,049 | ||||
Reported Change in the Actuarial Present Value of Pension Benefits | — | — | ||||
Pension Benefit Adjustments | — | — | ||||
Compensation Actually Paid | 14,066,083 | 4,384,842 | ||||
Most Important Financial Performance Measures for Linking Executive Pay to Company Performance
• | Total Revenue |
• | Adjusted EBITDA(1) |
• | Stock Price |
(1) | Both EBITDA and Adjusted EBITDA are supplemental measures of operating performance that are not made under GAAP and do not represent, and should not be considered as, an alternative to net loss as determined by GAAP. We define EBITDA as net (loss) income attributable to Telos, adjusted for net (loss) income attributable to non-controlling interest, non-operating (income) expense, interest expense, provision for (benefit from) income taxes, and depreciation and amortization. We define Adjusted EBITDA as net income (loss), adjusted for non-operating expense/(income), interest expense, provision for/(benefit from) income taxes, depreciation and amortization, restructuring expenses and stock-based compensation expense. Item 7. Management’s Discussion and Analysis of Financial Condition and Results of Operations – Non-GAAP Financial Measures”, beginning on page 34 of the Company’s Annual Report on Form 10-K for the fiscal year ending December 31, 2025, provides information about these measures and how they are calculated and is incorporated by reference herein. |
In the Company’s opinion, Total Revenue is the single most important financial performance measure for linking executive pay to company performance, and is therefore the company-selected measure in the Pay versus Performance table above.
(1) | Both EBITDA and Adjusted EBITDA are supplemental measures of operating performance that are not made under GAAP and do not represent, and should not be considered as, an alternative to net loss as determined by GAAP. We define EBITDA as net (loss) income attributable to Telos, adjusted for net (loss) income attributable to non-controlling interest, non-operating (income) expense, interest expense, provision for (benefit from) income taxes, and depreciation and amortization. We define Adjusted EBITDA as net income (loss), adjusted for non-operating expense/(income), interest expense, provision for/(benefit from) income taxes, depreciation and amortization, restructuring expenses and stock-based compensation expense. Item 7. Management’s Discussion and Analysis of Financial Condition and Results of Operations – Non-GAAP Financial Measures”, beginning on page 34 of the Company’s Annual Report on Form 10-K for the fiscal year ending December 31, 2025, provides information about these measures and how they are calculated and is incorporated by reference herein. |