| (a) | (b) | (d) | (f) | (g) | (h) | (i) | (j) | |||
| Value of Initial Fixed | ||||||||||
| $100 Investment | ||||||||||
| Average Summary | Based On: | |||||||||
| Summary | Compensation | Average CAP to | Peer Group | |||||||
| Compensation | Table Total for | Non-PEO | Total | Total | ||||||
| Table Total for | CAP | Non-PEO | Named | Shareholder | Shareholder | Company Adjusted EBIT Margin3 | ||||
| PEO | to PEO4 | Named Executives1 | Executives1,4 | Return | Return2 | Net Income | ||||
| Year | ($) | ($) | ($) | ($) | ($) | ($) | (in $M) | (%) | ||
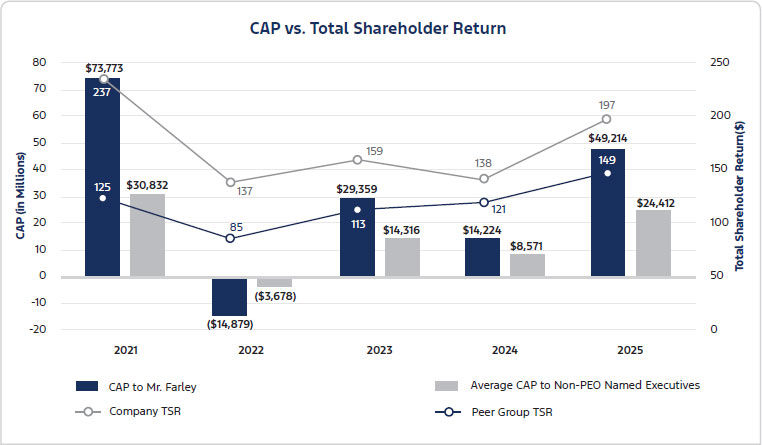
| 2025 | 27,519,558 | 49,214,346 | 14,932,140 | 24,411,746 | 197 | 149 | (8,182) | 3.6 | ||
| 2024 | 24,861,866 | 14,223,664 | 14,027,714 | 8,570,838 | 138 | 121 | 5,879 | 5.5 | ||
| 2023 | 26,470,033 | 29,358,700 | 13,582,049 | 14,315,576 | 159 | 113 | 4,347 | 5.9 | ||
| 2022 | 20,996,146 | (14,879,370) | 12,379,576 | (3,677,839) | 137 | 85 | (1,981) | 6.6 | ||
| 2021 | 22,813,174 | 73,772,804 | 12,948,787 | 30,831,937 | 237 | 125 | 17,937 | 7.3 | ||
| 1. | The Non-PEO Named Executives for 2021 were John T. Lawler, William Clay Ford, Jr., Michael Amend, and J. Doug Field; for 2022 were John T. Lawler, William Clay Ford, Jr., J. Doug Field, and Kumar Galhotra; for 2023 and 2024 were John T. Lawler, William Clay Ford, Jr., J. Doug Field, and Peter C. Stern; and for 2025 were John T. Lawler, William Clay Ford, Jr., J. Doug Field, Sherry A. House, and Alicia Boler Davis. |
| 2. | The “Peer Group” referenced in this column is the Dow Jones Automobiles & Parts Titans 30 Index. This is the same index used to prepare the Company’s “Stock Performance Graph” included in our Annual Report on Form 10-K for the year ended December 31, 2025. |
| 3. | Company adjusted EBIT Margin is a non-GAAP financial measure most comparable to U.S. GAAP’s “Company Net Income/(Loss) Margin.” Company adjusted EBIT Margin is Company adjusted EBIT divided by Company revenue. In turn, Company adjusted EBIT is a non-GAAP financial measure most comparable to U.S. GAAP’s “Net Income/(Loss). Company adjusted EBIT excludes interest on debt (excluding Ford Credit Debt), taxes, and pre-tax special items. Our management excludes special items from its review of the results of the operating segments for purposes of measuring segment profitability and allocating resources. Our categories of pre-tax special items and the applicable significance guideline for each item (which may consist of a group of items related to a single event or action) are as follows: |
| Pre-Tax Special Item | Significance Guideline | |||
| • | Pension and OPEB remeasurement gains and losses | • | No minimum | |
| • | Personnel expenses, supplier- and dealer-related costs, and facility-related charges stemming from our efforts to match production capacity and cost structure to market demand and changing model mix | • | Generally $100 million or more | |
| • | Other items that we do not necessarily consider to be indicative of earnings from ongoing operating activities | • | $500 million or more for individual field service actions; generally $100 million or more for other items | |
Company adjusted EBIT Margin is useful to management and investors because it allows users to evaluate our operating results aligned with industry reporting. Company adjusted EBIT is useful to management and investors because it focuses on underlying operating results and trends, and improves comparability of our period-over-period results. Please refer to Appendix III to this Proxy Statement for a reconciliation of Company Net Income/(Loss) Margin to Company adjusted EBIT Margin and the underlying reconciliation of Net Income/(Loss) to Company adjusted EBIT.
| 4. | As noted above, the values reported in these columns represent CAP, calculated in accordance with SEC rules. The values do not reflect the actual amount of compensation earned by or paid to our Named Executives during the applicable year. Numbers in the above table and the tables below may not sum due to rounding. To calculate CAP in accordance with SEC rules, the amounts shown in the tables below were added to, or deducted from, the applicable SCT Totals. For additional information on how the CAP values for 2021, 2022, 2023, and 2024 were calculated, please see Footnote 4 to the Pay versus Performance Table beginning on page 81 of our Proxy Statement for Ford’s Annual Meeting of Shareholders held May 8, 2025, filed with the SEC on March 28, 2025, Footnote 4 to the Pay versus Performance Table beginning on page 78 of our Proxy Statement for Ford’s |
Annual Meeting of Shareholders held May 9, 2024, filed with the SEC on March 29, 2024, and Footnote 4 to the Pay versus Performance Table beginning on page 78 of our Proxy Statement for Ford’s Annual Meeting of Shareholders held May 11, 2023, filed with the SEC on March 31, 2023:
PEO 2025 SCT Total Compensation to CAP Reconciliation:
| Year | SCT
Total Compensation ($) |
Less
Grant Date Fair Value Of Equity-Based Awards ($) |
Plus
Value of Equity-Based Awards Calculated According to SEC Specified Methodology ($)i |
CAP ($)ii |
| 2025 | 27,519,558 | 18,868,309 | 40,563,097 | 49,214,346 |
Average Non-PEO Named Executive 2025 SCT Total Compensation to CAP Reconciliation:
| Year | SCT
Total Compensation ($) |
Less
Grant Date Fair Value of Equity-Based Awards and Aggregate Change in Present Value of Pension Benefit ($) |
Plus
Value of Equity- Based Awards Calculated According to SEC Specified Methodology ($)i |
Plus
Actuarially Determined Pension Service Cost and Prior Service Cost ($)ii, iii |
CAP ($) |
| 2025 | 14,932,140 | 11,455,713 | 20,918,162 | 17,157 | 24,411,746 |
| i | Reflects the change in value of equity-based awards calculated in accordance with the SEC specified methodology for determining CAP for 2025. With respect to dividend equivalents that accrue on our equity awards, the value of such dividend equivalents is included in the values in this column. For more on how dividend equivalents accrue on our equity awards, see Policy on Dividend Equivalents on Equity Grants on page 58. |
Supplemental Detail of PEO Equity-Based Awards Change in Value for 2025:
| Year | Type of Award | Fair
Value of Reported Year’s Awards at Fiscal Year End (a) ($) |
Change
in Value of Prior Years’ Awards Unvested at Fiscal Year End (b) ($) |
Change
in Value of Prior Years’ Awards that Vested in Year Reported (c) ($) |
Value
of Awards Included in CAP for Year Reported (d) = (a) + (b) + (c) ($) |
| 2025 | RSUs | 9,716,488 | 2,380,066 | (187,677) | 11,908,877 |
| PSUs | 20,705,999 | 9,729,415 | (1,781,194) | 28,654,220 | |
| Options | |||||
| Total | 30,422,487 | 12,109,481 | (1,968,871) | 40,563,097 |
Supplemental Detail of Average Non-PEO Named Executive Equity-Based Awards Change in Value for 2025:
| Fair Value of Reported | Change
in Value of Prior Years’ |
Change
in Value of Prior Years’ Awards |
Value
of Awards Included in CAP | ||
| Year | Type of Award | Year’s
Awards at Fiscal Year End (a) ($) |
Awards
Unvested at Fiscal Year End (b) ($) |
that
Vested in Year Reported (c) ($) |
for
Year Reported (d) = (a) + (b) + (c) ($) |
| 2025 | RSUs | 5,687,336 | 1,056,341 | 141,270 | 6,884,948 |
| PSUs | 11,164,668 | 3,497,496 | (628,950) | 14,033,214 | |
| Options | |||||
| Total | 16,852,004 | 4,553,837 | (487,680) | 20,918,162 |
| ii | We do not report a change in pension value for Mr. Farley because he does not participate in any of our pension benefit plans. |
| iii | This column is included to show the addition of the actuarial present value of our Non-PEO Named Executives’ average service cost under pension plans attributable to services rendered during the noted year. |
PEO 2025 SCT Total Compensation to CAP Reconciliation:
| Year | SCT
Total Compensation ($) |
Less
Grant Date Fair Value Of Equity-Based Awards ($) |
Plus
Value of Equity-Based Awards Calculated According to SEC Specified Methodology ($)i |
CAP ($)ii |
| 2025 | 27,519,558 | 18,868,309 | 40,563,097 | 49,214,346 |
Supplemental Detail of PEO Equity-Based Awards Change in Value for 2025:
| Year | Type of Award | Fair
Value of Reported Year’s Awards at Fiscal Year End (a) ($) |
Change
in Value of Prior Years’ Awards Unvested at Fiscal Year End (b) ($) |
Change
in Value of Prior Years’ Awards that Vested in Year Reported (c) ($) |
Value
of Awards Included in CAP for Year Reported (d) = (a) + (b) + (c) ($) |
| 2025 | RSUs | 9,716,488 | 2,380,066 | (187,677) | 11,908,877 |
| PSUs | 20,705,999 | 9,729,415 | (1,781,194) | 28,654,220 | |
| Options | |||||
| Total | 30,422,487 | 12,109,481 | (1,968,871) | 40,563,097 |
Average Non-PEO Named Executive 2025 SCT Total Compensation to CAP Reconciliation:
| Year | SCT
Total Compensation ($) |
Less
Grant Date Fair Value of Equity-Based Awards and Aggregate Change in Present Value of Pension Benefit ($) |
Plus
Value of Equity- Based Awards Calculated According to SEC Specified Methodology ($)i |
Plus
Actuarially Determined Pension Service Cost and Prior Service Cost ($)ii, iii |
CAP ($) |
| 2025 | 14,932,140 | 11,455,713 | 20,918,162 | 17,157 | 24,411,746 |
Supplemental Detail of Average Non-PEO Named Executive Equity-Based Awards Change in Value for 2025:
| Fair Value of Reported | Change
in Value of Prior Years’ |
Change
in Value of Prior Years’ Awards |
Value
of Awards Included in CAP | ||
| Year | Type of Award | Year’s
Awards at Fiscal Year End (a) ($) |
Awards
Unvested at Fiscal Year End (b) ($) |
that
Vested in Year Reported (c) ($) |
for
Year Reported (d) = (a) + (b) + (c) ($) |
| 2025 | RSUs | 5,687,336 | 1,056,341 | 141,270 | 6,884,948 |
| PSUs | 11,164,668 | 3,497,496 | (628,950) | 14,033,214 | |
| Options | |||||
| Total | 16,852,004 | 4,553,837 | (487,680) | 20,918,162 |
| ii | We do not report a change in pension value for Mr. Farley because he does not participate in any of our pension benefit plans. |
| iii | This column is included to show the addition of the actuarial present value of our Non-PEO Named Executives’ average service cost under pension plans attributable to services rendered during the noted year. |
Critical Performance Measures
The seven measures listed below represent the most important financial and non-financial performance measures used to tie 2025 executive compensation to Company performance. The measures in this table are not ranked.
For a discussion of each of these performance measures and how they tie to our performance-based compensation practices, refer to the CD&A, beginning on page 41.
| Most Important Financial and Non-Financial |
| Performance Measures |
| Company Adjusted EBIT Margin |
| Company Adjusted EBIT |
| Company Adjusted Free Cash Flow |
| Adjusted Return on Invested Capital |
| Company Revenue |
| Quality |
| rTSR of 2025 PSU TSR Peer Group |
* See Long-Term Incentive Plan, beginning on page 47, for more information about the structure of our PSU grants and the peer group used for measuring rTSR for PSUs.
| 3. | Company adjusted EBIT Margin is a non-GAAP financial measure most comparable to U.S. GAAP’s “Company Net Income/(Loss) Margin.” Company adjusted EBIT Margin is Company adjusted EBIT divided by Company revenue. In turn, Company adjusted EBIT is a non-GAAP financial measure most comparable to U.S. GAAP’s “Net Income/(Loss). Company adjusted EBIT excludes interest on debt (excluding Ford Credit Debt), taxes, and pre-tax special items. Our management excludes special items from its review of the results of the operating segments for purposes of measuring segment profitability and allocating resources. Our categories of pre-tax special items and the applicable significance guideline for each item (which may consist of a group of items related to a single event or action) are as follows: |
| Pre-Tax Special Item | Significance Guideline | |||
| • | Pension and OPEB remeasurement gains and losses | • | No minimum | |
| • | Personnel expenses, supplier- and dealer-related costs, and facility-related charges stemming from our efforts to match production capacity and cost structure to market demand and changing model mix | • | Generally $100 million or more | |
| • | Other items that we do not necessarily consider to be indicative of earnings from ongoing operating activities | • | $500 million or more for individual field service actions; generally $100 million or more for other items | |
Company adjusted EBIT Margin is useful to management and investors because it allows users to evaluate our operating results aligned with industry reporting. Company adjusted EBIT is useful to management and investors because it focuses on underlying operating results and trends, and improves comparability of our period-over-period results. Please refer to Appendix III to this Proxy Statement for a reconciliation of Company Net Income/(Loss) Margin to Company adjusted EBIT Margin and the underlying reconciliation of Net Income/(Loss) to Company adjusted EBIT.
| [1] | As noted above, the values reported in these columns represent CAP, calculated in accordance with SEC rules. The values do not reflect the actual amount of compensation earned by or paid to our Named Executives during the applicable year. Numbers in the above table and the tables below may not sum due to rounding. To calculate CAP in accordance with SEC rules, the amounts shown in the tables below were added to, or deducted from, the applicable SCT Totals. For additional information on how the CAP values for 2021, 2022, 2023, and 2024 were calculated, please see Footnote 4 to the Pay versus Performance Table beginning on page 81 of our Proxy Statement for Ford’s Annual Meeting of Shareholders held May 8, 2025, filed with the SEC on March 28, 2025, Footnote 4 to the Pay versus Performance Table beginning on page 78 of our Proxy Statement for Ford’s |
| [2] | The Non-PEO Named Executives for 2021 were John T. Lawler, William Clay Ford, Jr., Michael Amend, and J. Doug Field; for 2022 were John T. Lawler, William Clay Ford, Jr., J. Doug Field, and Kumar Galhotra; for 2023 and 2024 were John T. Lawler, William Clay Ford, Jr., J. Doug Field, and Peter C. Stern; and for 2025 were John T. Lawler, William Clay Ford, Jr., J. Doug Field, Sherry A. House, and Alicia Boler Davis. |
| [3] | The “Peer Group” referenced in this column is the Dow Jones Automobiles & Parts Titans 30 Index. This is the same index used to prepare the Company’s “Stock Performance Graph” included in our Annual Report on Form 10-K for the year ended December 31, 2025. |
| [4] | Company adjusted EBIT Margin is a non-GAAP financial measure most comparable to U.S. GAAP’s “Company Net Income/(Loss) Margin.” Company adjusted EBIT Margin is Company adjusted EBIT divided by Company revenue. In turn, Company adjusted EBIT is a non-GAAP financial measure most comparable to U.S. GAAP’s “Net Income/(Loss). Company adjusted EBIT excludes interest on debt (excluding Ford Credit Debt), taxes, and pre-tax special items. Our management excludes special items from its review of the results of the operating segments for purposes of measuring segment profitability and allocating resources. Our categories of pre-tax special items and the applicable significance guideline for each item (which may consist of a group of items related to a single event or action) are as follows: |
| [5] | Reflects the change in value of equity-based awards calculated in accordance with the SEC specified methodology for determining CAP for 2025. With respect to dividend equivalents that accrue on our equity awards, the value of such dividend equivalents is included in the values in this column. For more on how dividend equivalents accrue on our equity awards, see Policy on Dividend Equivalents on Equity Grants on page 58. |
| [6] | This column is included to show the addition of the actuarial present value of our Non-PEO Named Executives’ average service cost under pension plans attributable to services rendered during the noted year. |
| [7] | We do not report a change in pension value for Mr. Farley because he does not participate in any of our pension benefit plans. |