Pay vs Performance Disclosure - USD ($)
|
12 Months Ended |
Dec. 31, 2025 |
Dec. 31, 2024 |
Dec. 31, 2023 |
| Pay vs Performance Disclosure |
|
|
|
| Pay vs Performance Disclosure, Table |
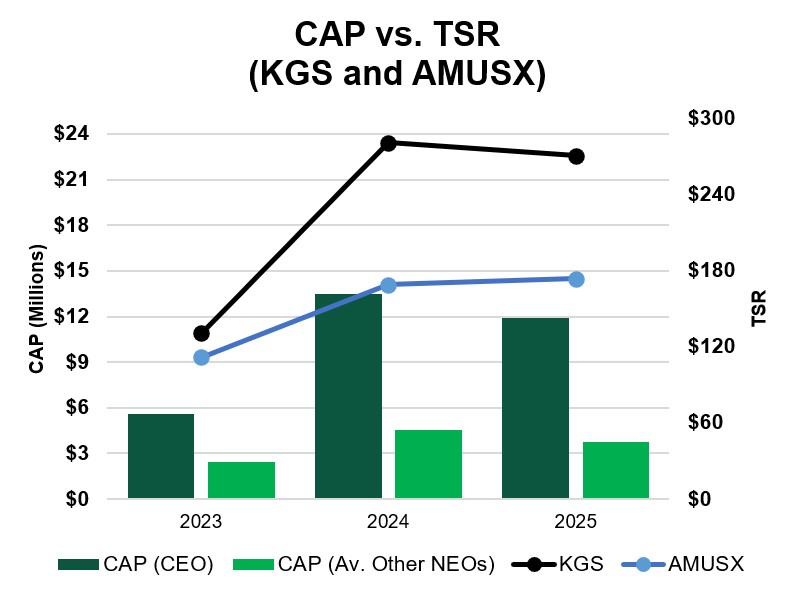
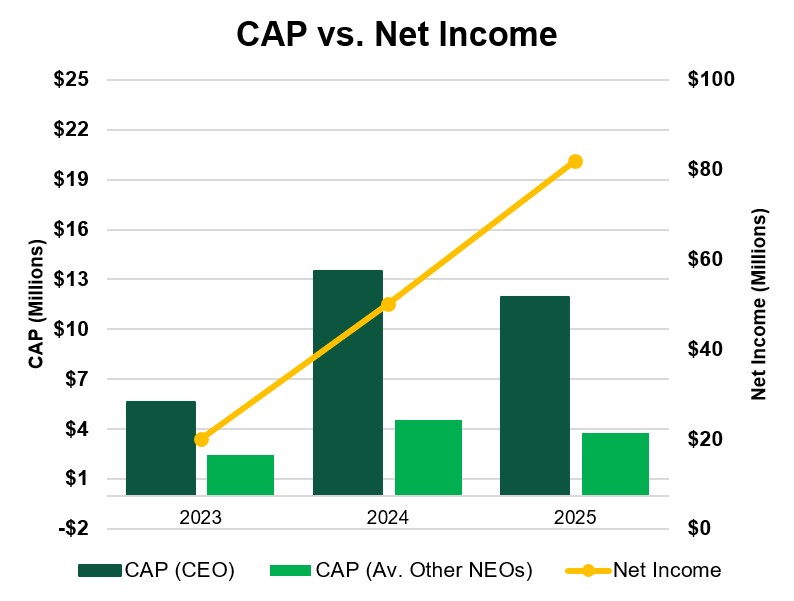
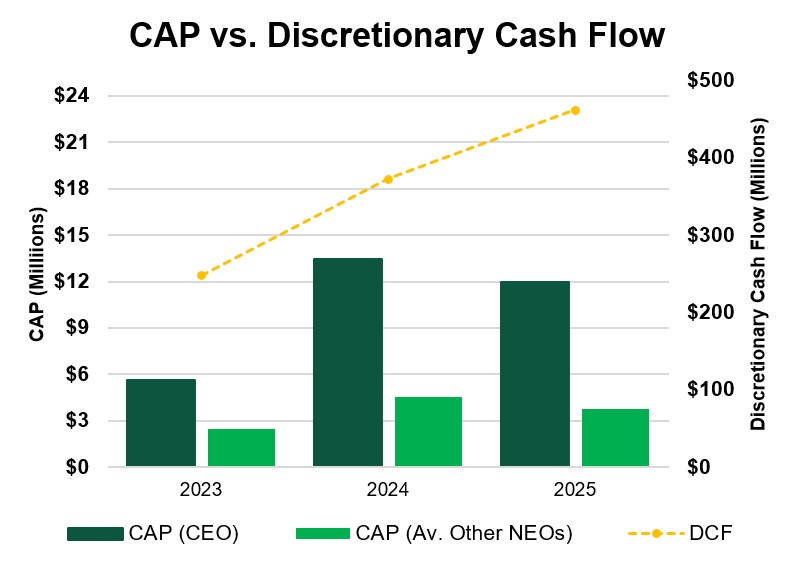
| | | | | | | | | | | | | | | | | | | | | | | | | | | | | | | | | | | | | | | | | | | | | | | | | | | | Year | | CEO Pay(1) | | Other NEO Pay(1) | | Value of Initial Fixed $100 Investment Based On:(4) | | Other Performance Measures(5) | | Summary Compensation Table Total Compensation(2) | | Compensation “Actually Paid”(3) | | Average Summary Compensation Table Total Compensation(2) | | Average Compensation “Actually Paid”(3) | | Total Shareholder Return | | Peer Group Total Shareholder Return | | Net Income (thousands) | | Discretionary Cash Flow (thousands) | | 2025 | | $ | 6,568,143 | | | $ | 11,934,445 | | | $ | 2,415,807 | | | $ | 3,738,464 | | | $ | 271.00 | | | $ | 174.00 | | | $ | 81,588 | | | $ | 461,684 | | | 2024 | | $ | 6,136,261 | | | $ | 13,456,315 | | | $ | 2,225,260 | | | $ | 4,519,549 | | | $ | 281.00 | | | $ | 169.00 | | | $ | 50,334 | | | $ | 373,281 | | | 2023 | | $ | 4,882,768 | | | $ | 5,614,761 | | | $ | 2,084,345 | | | $ | 2,452,231 | | | $ | 131.00 | | | $ | 112.00 | | | $ | 20,066 | | | $ | 248,149 | |
|
|
|
| Company Selected Measure Name |
Discretionary Cash Flow
|
|
|
| Named Executive Officers, Footnote |
Our Chief Executive Officer for each of the fiscal years indicated was Mr. McKee. Our other Named Executive Officers in each of the fiscal years indicated were Messrs. Griggs and Lenamon (collectively referred to herein as the “Other NEOs”).
|
|
|
| Peer Group Issuers, Footnote |
The values disclosed in the “Total Shareholder Return” column represent the value of an investment of $100 in each of (i) our Common Stock and (ii) the Alerian US Midstream Energy Index (“AMUSX”) as of June 29, 2023, measured over each of the periods ending on December 31, 2023, 2024 and 2025. It is assumed that dividends, if any, are reinvested. The AMUSX is the published industry or line-of-business index that we selected for purposes of Item 201(e) of Regulation S-K under the Exchange Act in our Annual Report on Form 10-K for the year ended December 31, 2025.
|
|
|
| PEO Total Compensation Amount |
$ 6,568,143
|
$ 6,136,261
|
$ 4,882,768
|
| PEO Actually Paid Compensation Amount |
$ 11,934,445
|
13,456,315
|
5,614,761
|
| Adjustment To PEO Compensation, Footnote |
Reflects the CAP to the Chief Executive Officer and the Other NEOs as computed in accordance with Item 402(v) of Regulation S-K and may not reflect the actual amount of compensation earned by or paid to the Chief Executive Officer during the fiscal year indicated. Such amounts are calculated by deducting the amounts reported in the “Stock Awards” column of the Summary Compensation Table from the “Total” column of the Summary Compensation Table for the Chief Executive Officer, and by deducting the average of the amounts reported in the “Stock Awards” column of the Summary Compensation Table from the average of the amounts reported in the “Total” Column of the Summary Compensation Table for the Other NEOs, in each case, in the fiscal years indicated and making certain adjustments as set forth below. | | | | | | | | | | | | | | | | | | | | | | | | CEO
Year | Summary Compensation Table Total | Stock Awards as Reported in Summary Compensation Table(A) | Other Adjustments | Total Compensation “Actually Paid”(F) | Fair Value as of Year End of Awards Granted During Year that Remain Outstanding as of Year End(B) | Year-over-Year Change in Fair Value of Awards Granted in Prior Year that Remain Outstanding as of Year End(C) | Fair Value as of Vesting Date of Awards Granted During Year that Vest During Year(D) | Year-over-Year Change in Fair Value of Awards Granted in Prior Year that Vest During Year(E) | | 2025 | $ | 6,568,143 | | $ | (4,489,726) | | $ | 4,933,710 | | $ | 3,371,191 | | $ | — | | $ | 1,551,127 | | $ | 11,934,445 | | | 2024 | $ | 6,136,261 | | $ | (4,358,153) | | $ | 7,316,490 | | $ | 3,664,217 | | $ | — | | $ | 697,500 | | $ | 13,456,315 | | | 2023 | $ | 4,882,768 | | $ | (3,111,375) | | $ | 3,843,368 | | $ | — | | $ | — | | $ | — | | $ | 5,614,761 | |
(A) Reflects either (i) the grant date fair value, with respect to the Chief Executive Officer, or (ii) the average grant date fair value, with respect to the Other NEOs, as reported in the “Stock Awards” column of the Summary Compensation Table. (B) Reflects either (i) the fair value, with respect to the Chief Executive Officer, or (ii) the average of the fair value, with respect to the Other NEOs, as of the end of the covered fiscal year of any awards granted to the applicable individuals during the covered fiscal year that are outstanding and unvested as of the end of the covered fiscal year. (C) Reflects either (i) the amount, with respect to the Chief Executive Officer, or (ii) the average amount, with respect to the Other NEOs, equal to the change in fair value as of the end of the covered fiscal year (from the end of the prior fiscal year) of any portion of any awards granted in a prior fiscal year that remained outstanding and unvested as of the end of the covered fiscal year. (D) Reflects either (i) the fair value, with respect to the Chief Executive Officer, or (ii) the average of the fair value, with respect to the Other NEOs, as of the vesting date of the portion of awards granted during the covered fiscal year that vested during the covered fiscal year. (E) Reflects either (i) the amount, with respect to the Chief Executive Officer, or (ii) the average amount, with respect to the Other NEOs, equal to the fair value as of the vesting date (from the end of the prior fiscal year) of the portion of any awards granted in a prior fiscal year that vested during the covered fiscal year. (F) Dividend equivalent amounts were paid on awards during each of the covered fiscal years.
|
|
|
| Non-PEO NEO Average Total Compensation Amount |
$ 2,415,807
|
2,225,260
|
2,084,345
|
| Non-PEO NEO Average Compensation Actually Paid Amount |
$ 3,738,464
|
4,519,549
|
2,452,231
|
| Adjustment to Non-PEO NEO Compensation Footnote |
Reflects the CAP to the Chief Executive Officer and the Other NEOs as computed in accordance with Item 402(v) of Regulation S-K and may not reflect the actual amount of compensation earned by or paid to the Chief Executive Officer during the fiscal year indicated. Such amounts are calculated by deducting the amounts reported in the “Stock Awards” column of the Summary Compensation Table from the “Total” column of the Summary Compensation Table for the Chief Executive Officer, and by deducting the average of the amounts reported in the “Stock Awards” column of the Summary Compensation Table from the average of the amounts reported in the “Total” Column of the Summary Compensation Table for the Other NEOs, in each case, in the fiscal years indicated and making certain adjustments as set forth below. | | | | | | | | | | | | | | | | | | | | | | | | Other NEOs
Year | Summary Compensation Table Total | Stock Awards as Reported in Summary Compensation Table(A) | Other Adjustments | Total Compensation “Actually Paid”(F) | Fair Value as of Year End of Awards Granted During Year that Remain Outstanding as of Year End(B) | Year-over-Year Change in Fair Value of Awards Granted in Prior Year that Remain Outstanding as of Year End(C) | Fair Value as of Vesting Date of Awards Granted During Year that Vest During Year(D) | Year-over-Year Change in Fair Value of Awards Granted in Prior Year that Vest During Year(E) | | 2025 | $ | 2,415,807 | | $ | (1,297,185) | | $ | 1,137,120 | | $ | 413,248 | | $ | 126,152 | | $ | 943,322 | | $ | 3,738,464 | | | 2024 | $ | 2,225,260 | | $ | (1,225,729) | | $ | 2,057,787 | | $ | 1,183,193 | | $ | — | | $ | 279,038 | | $ | 4,519,549 | | | 2023 | $ | 2,084,345 | | $ | (931,557) | | $ | 1,299,443 | | $ | — | | $ | — | | $ | — | | $ | 2,452,231 | |
(A) Reflects either (i) the grant date fair value, with respect to the Chief Executive Officer, or (ii) the average grant date fair value, with respect to the Other NEOs, as reported in the “Stock Awards” column of the Summary Compensation Table. (B) Reflects either (i) the fair value, with respect to the Chief Executive Officer, or (ii) the average of the fair value, with respect to the Other NEOs, as of the end of the covered fiscal year of any awards granted to the applicable individuals during the covered fiscal year that are outstanding and unvested as of the end of the covered fiscal year. (C) Reflects either (i) the amount, with respect to the Chief Executive Officer, or (ii) the average amount, with respect to the Other NEOs, equal to the change in fair value as of the end of the covered fiscal year (from the end of the prior fiscal year) of any portion of any awards granted in a prior fiscal year that remained outstanding and unvested as of the end of the covered fiscal year. (D) Reflects either (i) the fair value, with respect to the Chief Executive Officer, or (ii) the average of the fair value, with respect to the Other NEOs, as of the vesting date of the portion of awards granted during the covered fiscal year that vested during the covered fiscal year. (E) Reflects either (i) the amount, with respect to the Chief Executive Officer, or (ii) the average amount, with respect to the Other NEOs, equal to the fair value as of the vesting date (from the end of the prior fiscal year) of the portion of any awards granted in a prior fiscal year that vested during the covered fiscal year. (F) Dividend equivalent amounts were paid on awards during each of the covered fiscal years.
|
|
|
| Compensation Actually Paid vs. Total Shareholder Return |
|
|
|
| Compensation Actually Paid vs. Net Income |
|
|
|
| Compensation Actually Paid vs. Company Selected Measure |
|
|
|
| Total Shareholder Return Vs Peer Group |
|
|
|
| Tabular List, Table |
| | | | Key Performance Measures | | Discretionary Cash Flow | | Consolidated Net Leverage Ratio | | Absolute Total Shareholder Return | | Adjusted EBITDA |
|
|
|
| Total Shareholder Return Amount |
$ 271.00
|
281.00
|
131.00
|
| Peer Group Total Shareholder Return Amount |
174.00
|
169.00
|
112.00
|
| Net Income (Loss), Including Portion Attributable to Noncontrolling Interest |
$ 81,588,000
|
$ 50,334,000
|
$ 20,066,000
|
| Company Selected Measure Amount |
461,684,000
|
373,281,000
|
248,149,000
|
| PEO Name |
Mr. McKee
|
|
|
| Additional 402(v) Disclosure |
Reflects the amount reported in the “Total” column of the Summary Compensation Table above for the Chief Executive Officer and the average of the amounts reported in the “Total” column of the Summary Compensation Table for the Other NEOs for each of the fiscal years indicated.
|
|
|
| Measure:: 1 |
|
|
|
| Pay vs Performance Disclosure |
|
|
|
| Name |
Discretionary Cash Flow
|
|
|
| Non-GAAP Measure Description |
“Discretionary Cash Flow” means the net cash provided by operating activities less (i) maintenance capital expenditures; (ii) certain changes in operating assets and liabilities; and (iii) certain other expenses; plus (w) severance expenses; (x) transaction expenses; and (y) sales tax reserve, all as reported in the financial statement reconciliations provided in the Company’s public filings.
|
|
|
| Measure:: 2 |
|
|
|
| Pay vs Performance Disclosure |
|
|
|
| Name |
Consolidated Net Leverage Ratio
|
|
|
| Measure:: 3 |
|
|
|
| Pay vs Performance Disclosure |
|
|
|
| Name |
Absolute Total Shareholder Return
|
|
|
| Measure:: 4 |
|
|
|
| Pay vs Performance Disclosure |
|
|
|
| Name |
Adjusted EBITDA
|
|
|
| PEO | Aggregate Grant Date Fair Value of Equity Award Amounts Reported in Summary Compensation Table |
|
|
|
| Pay vs Performance Disclosure |
|
|
|
| Adjustment to Compensation, Amount |
$ (4,489,726)
|
$ (4,358,153)
|
$ (3,111,375)
|
| PEO | Year-end Fair Value of Equity Awards Granted in Covered Year that are Outstanding and Unvested |
|
|
|
| Pay vs Performance Disclosure |
|
|
|
| Adjustment to Compensation, Amount |
4,933,710
|
7,316,490
|
3,843,368
|
| PEO | Year-over-Year Change in Fair Value of Equity Awards Granted in Prior Years That are Outstanding and Unvested |
|
|
|
| Pay vs Performance Disclosure |
|
|
|
| Adjustment to Compensation, Amount |
3,371,191
|
3,664,217
|
0
|
| PEO | Vesting Date Fair Value of Equity Awards Granted and Vested in Covered Year |
|
|
|
| Pay vs Performance Disclosure |
|
|
|
| Adjustment to Compensation, Amount |
0
|
0
|
0
|
| PEO | Change in Fair Value as of Vesting Date of Prior Year Equity Awards Vested in Covered Year |
|
|
|
| Pay vs Performance Disclosure |
|
|
|
| Adjustment to Compensation, Amount |
1,551,127
|
697,500
|
0
|
| Non-PEO NEO | Aggregate Grant Date Fair Value of Equity Award Amounts Reported in Summary Compensation Table |
|
|
|
| Pay vs Performance Disclosure |
|
|
|
| Adjustment to Compensation, Amount |
(1,297,185)
|
(1,225,729)
|
(931,557)
|
| Non-PEO NEO | Year-end Fair Value of Equity Awards Granted in Covered Year that are Outstanding and Unvested |
|
|
|
| Pay vs Performance Disclosure |
|
|
|
| Adjustment to Compensation, Amount |
1,137,120
|
2,057,787
|
1,299,443
|
| Non-PEO NEO | Year-over-Year Change in Fair Value of Equity Awards Granted in Prior Years That are Outstanding and Unvested |
|
|
|
| Pay vs Performance Disclosure |
|
|
|
| Adjustment to Compensation, Amount |
413,248
|
1,183,193
|
0
|
| Non-PEO NEO | Vesting Date Fair Value of Equity Awards Granted and Vested in Covered Year |
|
|
|
| Pay vs Performance Disclosure |
|
|
|
| Adjustment to Compensation, Amount |
126,152
|
0
|
0
|
| Non-PEO NEO | Change in Fair Value as of Vesting Date of Prior Year Equity Awards Vested in Covered Year |
|
|
|
| Pay vs Performance Disclosure |
|
|
|
| Adjustment to Compensation, Amount |
$ 943,322
|
$ 279,038
|
$ 0
|