Pay vs Performance Disclosure - USD ($)
|
11 Months Ended |
12 Months Ended |
37 Months Ended |
Nov. 27, 2022 |
Dec. 31, 2025 |
Dec. 31, 2024 |
Dec. 31, 2023 |
Dec. 31, 2022 |
Dec. 31, 2021 |
Dec. 31, 2025 |
| Pay vs Performance Disclosure |
|
|
|
|
|
|
|
| Pay vs Performance Disclosure, Table |
|
| | | | | | | | | | | | | | | | | | | | | | | | | | | | | | | | | | | | | | | | | | | | | Year
(a) | Summary Compensation Table Total for Michael Burkland
(b) | Compensation Actually Paid to Michael Burkland (c)(1)(8) | Summary Compensation Table Total
for Rowan Trollope
(b) | Compensation Actually Paid to Rowan Trollope (c)(2)(8) | Average Summary Compensation Table Total for Other NEOs
(d) | Average Compensation Actually Paid to Other NEOs (e)(3)(8) | Value of Initial Fixed $100 Investment Based On: | | (in thousands) | | | | Peer Group Total Shareholder Return (g)(4) | | | | | | Total Shareholder Return
(f) | Nasdaq Computer Index | | | | Net Income (Loss) (h)(5) | CSM Revenue (i)(6) | | | | | | | | | | | | | | | | | | | | | | | | | | 2025 | 17,403,709 | | (721,880) | | — | | — | | 5,316,520 | | 2,266,906 | | 11 | | 233 | | | | | 39,416 | | 1,149,088 | | | | | | | | 2024 | 12,003,120 | | (12,590,917) | | — | | — | | 4,125,695 | | (671,426) | | 23 | | 181 | | | | | (12,795) | | 1,041,938 | | | | | | | | 2023 | 1,204,757 | | 3,146,084 | | — | | — | | 4,516,341 | | 4,918,272 | | 45 | | 135 | | | | | (81,764) | | 910,488 | | | | | | | | 2022 | 38,226,944 | | 35,346,014 | | 11,134,881 | | (7,181,551) | | 7,856,459 | | 1,668,273 | | 39 | | 83 | | | | | (94,650) | | 778,846 | | | | | | | | 2021 | — | | — | | 10,825,159 | | 4,461,362 | | 4,618,633 | | 1,271,633 | | 79 | | 127 | | | | | (53,000) | | 609,591 | | | | | | | | | | | | | | | | | | | | | | | | | |
|
|
|
|
|
|
| Named Executive Officers, Footnote |
|
Michael Burkland served as our CEO beginning on November 28, 2022 and for all of 2023 through 2025. Amounts previously disclosed in columns (b) and (c) for Mr. Burkland have been revised slightly in this table to reflect de minimis adjustments correcting the amounts included for health and insurance benefits in 2022, 2023, and 2024 and which adjustments are illustrated for 2023 and 2024 in footnote 4 to the Summary Compensation Table. 2.Mr. Rowan Trollope served as our CEO for the entirety of 2021 and through November 28, 2022. Amounts previously disclosed in columns (b) and (c) for Mr. Trollope have been revised slightly in this table to reflect de minimis under-reporting of employer contributions to our 401(k) plan and over-reporting of group health insurance and other non-discriminatory benefits. 3.The NEOs included in this calculation for each year are: a.2025 - Bryan Lee, Barry Zwarenstein, Andy Dignan, Tiffany Meriweather and Panos Kozanian. b.2024 - Barry Zwarenstein, Daniel Burkland, Andy Dignan and Panos Kozanian. c.2023 - Barry Zwarenstein, Daniel Burkland, Andy Dignan and Panos Kozanian. d.2022 - Barry Zwarenstein, Daniel Burkland, Scott Welch and Panos Kozanian. e.2021 - Barry Zwarenstein, Daniel Burkland and Scott Welch. The amounts previously disclosed in columns (d) and (e) have been revised slightly in this table to reflect the correction of: (i) minor calculation errors for the value of NEOs' PRSUs in 2023, and (ii) de minimis under-reporting of employer contributions to our 401(k) plan and over-reporting of group health insurance and other non-discriminatory benefits. The above minor revisions are illustrated for 2023 and 2024 in footnotes 2 and 4 to the Summary Compensation Table.
|
|
|
|
|
|
| Peer Group Issuers, Footnote |
|
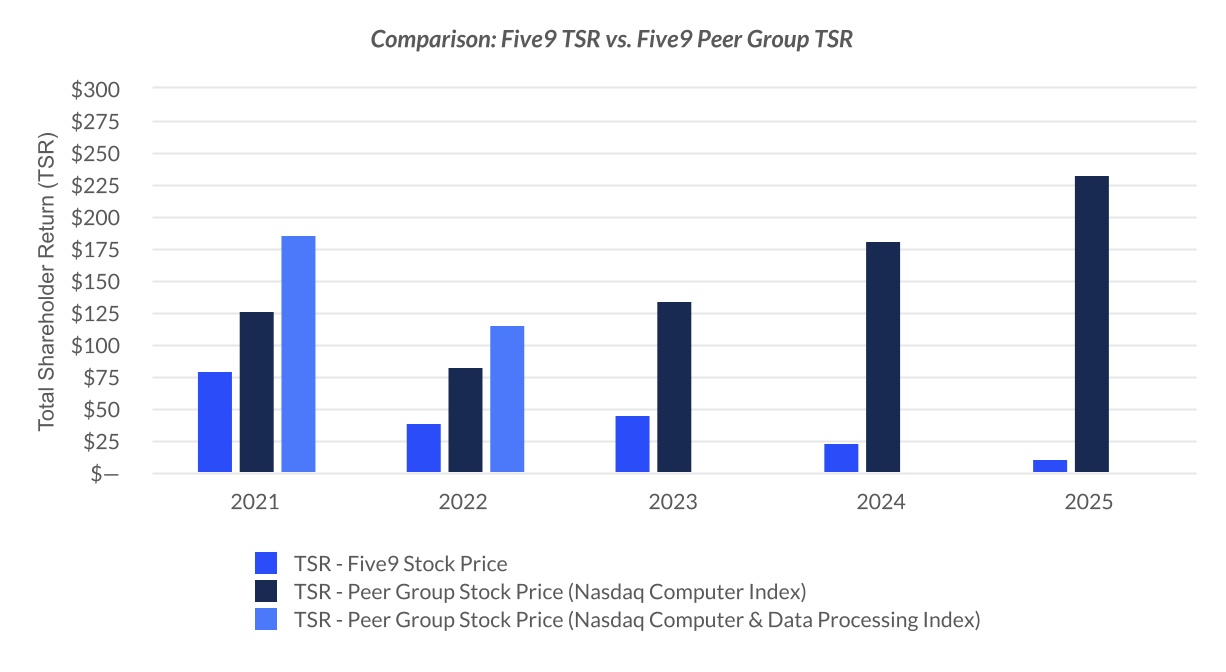
For each of 2025, 2024, 2023, 2022, and 2021, total shareholder return for the Company and the peer group was calculated as the yearly percentage change in cumulative total shareholder return based on a deemed fixed investment of $100 at market close on December 31, 2020. The yearly percentage change in cumulative total shareholder return was measured as the quotient of (a) the difference between stock price per share at the end and the beginning of the Measurement Period, divided by (b) stock price per share at the beginning of the Measurement Period. For purposes of this pay versus performance disclosure, our peer group is the NASDAQ Computer Index (the "Peer Group"). Beginning in 2023, we started to compare our Common Stock to the NASDAQ Computer Index and ceased using the NASDAQ Computer and Data Processing Index as that index is no longer available. Because fiscal years are presented in the table in reverse chronological order (from top to bottom), the table should be read from bottom to top for purposes of understanding cumulative returns over time.
|
|
|
|
|
|
| Adjustment To PEO Compensation, Footnote |
|
The additional table below sets forth each of the amounts required by Item 402(v) of Regulation S-K to be deducted from and added to the amount of total compensation as reflected in the applicable Summary Compensation Table, to calculate Compensation Actually Paid. | | | | | | | | | | | | | | | | | | | | | | | | | | | | | | | | | 2025 | | | | | | | | | | | | | | | Michael Burkland | Other NEOs Average | | | | | | | | | | | | | | | | | | | | | | | | | | | | | | | | | | | | | | | | Total Compensation for covered fiscal year (FY) from Summary Compensation Table (SCT) | $ | 17,403,709 | | $ | 5,316,520 | | | | | | | | | | | | | | | | | | | - | Grant date fair value (GDFV) of equity awards granted during FY | (16,186,638) | | (4,656,810) | | | | | | | | | | | | | | | | | | | | + | Fair value (FV) as of FY-end of equity awards granted during the year that are outstanding and unvested as of FY-end | 4,402,840 | | 2,297,355 | | | | | | | | | | | | | | | | | | | | + | Change as of end of FY in FV of awards granted in any prior year that are outstanding and unvested as of FY-end | (1,483,461) | | (492,188) | | | | | | | | | | | | | | | | | | | | + | Vesting date FV for any equity awards granted during the year that vested at the end of or during FY | 820,112 | | 474,111 | | | | | | | | | | | | | | | | | | | | + | Change as of the vesting date (from end of prior FY) in FV for any equity awards granted in any prior year that vested at the end of or during FY | (1,293,819) | | (267,511) | | | | | | | | | | | | | | | | | | | - | FV at the end of the prior FY for awards granted in any prior year that failed to meet applicable vesting conditions during FY | (4,384,623) | | (404,571) | | | | | | | | | | | | | | | | | | | | | | | | | | | | | | | | | | | | | | | | | = | Compensation Actually Paid (as defined by SEC rule) | $ | (721,880) | | $ | 2,266,906 | | | | | | | | | | | | | | | | | | | | | | | | | | | | | | | | | | | | | | | |
|
|
|
|
|
|
| Non-PEO NEO Average Total Compensation Amount |
|
$ 5,316,520
|
$ 4,125,695
|
$ 4,516,341
|
$ 7,856,459
|
$ 4,618,633
|
|
| Non-PEO NEO Average Compensation Actually Paid Amount |
|
$ 2,266,906
|
(671,426)
|
4,918,272
|
1,668,273
|
1,271,633
|
|
| Adjustment to Non-PEO NEO Compensation Footnote |
|
The additional table below sets forth each of the amounts required by Item 402(v) of Regulation S-K to be deducted from and added to the amount of total compensation as reflected in the applicable Summary Compensation Table, to calculate Compensation Actually Paid. | | | | | | | | | | | | | | | | | | | | | | | | | | | | | | | | | 2025 | | | | | | | | | | | | | | | Michael Burkland | Other NEOs Average | | | | | | | | | | | | | | | | | | | | | | | | | | | | | | | | | | | | | | | | Total Compensation for covered fiscal year (FY) from Summary Compensation Table (SCT) | $ | 17,403,709 | | $ | 5,316,520 | | | | | | | | | | | | | | | | | | | - | Grant date fair value (GDFV) of equity awards granted during FY | (16,186,638) | | (4,656,810) | | | | | | | | | | | | | | | | | | | | + | Fair value (FV) as of FY-end of equity awards granted during the year that are outstanding and unvested as of FY-end | 4,402,840 | | 2,297,355 | | | | | | | | | | | | | | | | | | | | + | Change as of end of FY in FV of awards granted in any prior year that are outstanding and unvested as of FY-end | (1,483,461) | | (492,188) | | | | | | | | | | | | | | | | | | | | + | Vesting date FV for any equity awards granted during the year that vested at the end of or during FY | 820,112 | | 474,111 | | | | | | | | | | | | | | | | | | | | + | Change as of the vesting date (from end of prior FY) in FV for any equity awards granted in any prior year that vested at the end of or during FY | (1,293,819) | | (267,511) | | | | | | | | | | | | | | | | | | | - | FV at the end of the prior FY for awards granted in any prior year that failed to meet applicable vesting conditions during FY | (4,384,623) | | (404,571) | | | | | | | | | | | | | | | | | | | | | | | | | | | | | | | | | | | | | | | | | = | Compensation Actually Paid (as defined by SEC rule) | $ | (721,880) | | $ | 2,266,906 | | | | | | | | | | | | | | | | | | | | | | | | | | | | | | | | | | | | | | | |
|
|
|
|
|
|
| Compensation Actually Paid vs. Total Shareholder Return |
|
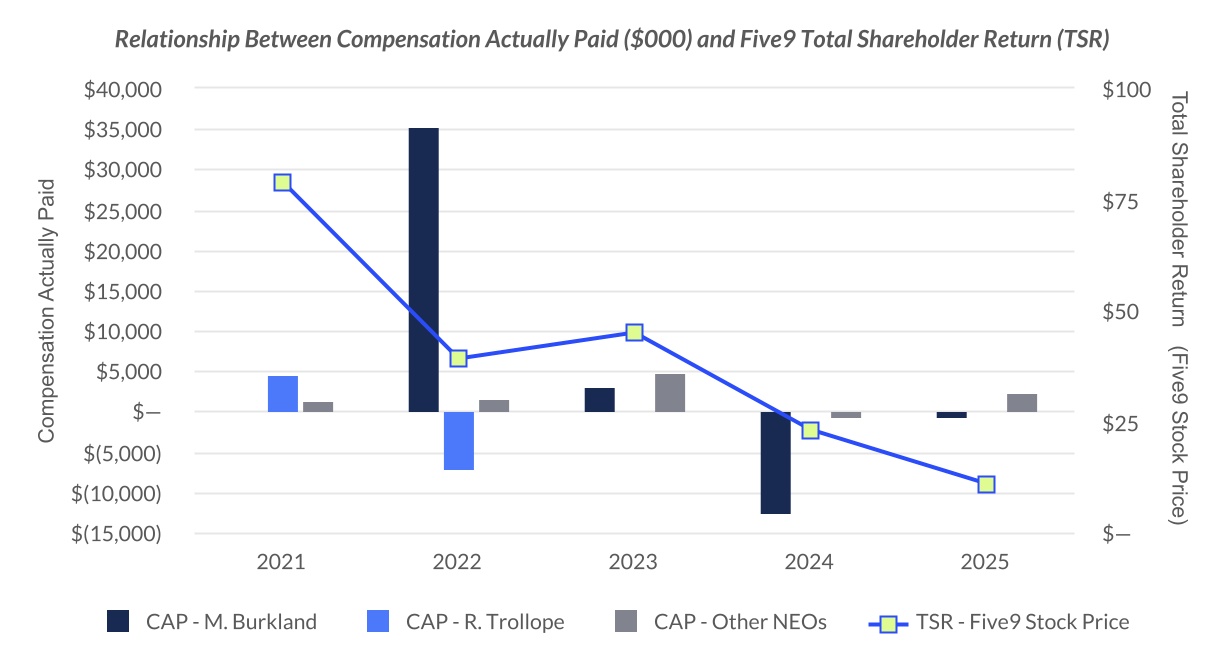
The graphs below shows the relationship between (i) "compensation actually paid" ("CAP") to each of our CEOs and the average of the CAP to our other NEOs and the total shareholder return of Five9, Inc. and (ii) the total shareholder return of Five9, Inc. and our Peer Group over the five fiscal years ending December 31, 2025, based on a hypothetical investment of $100 on December 31, 2020.
|
|
|
|
|
|
| Compensation Actually Paid vs. Net Income |
|
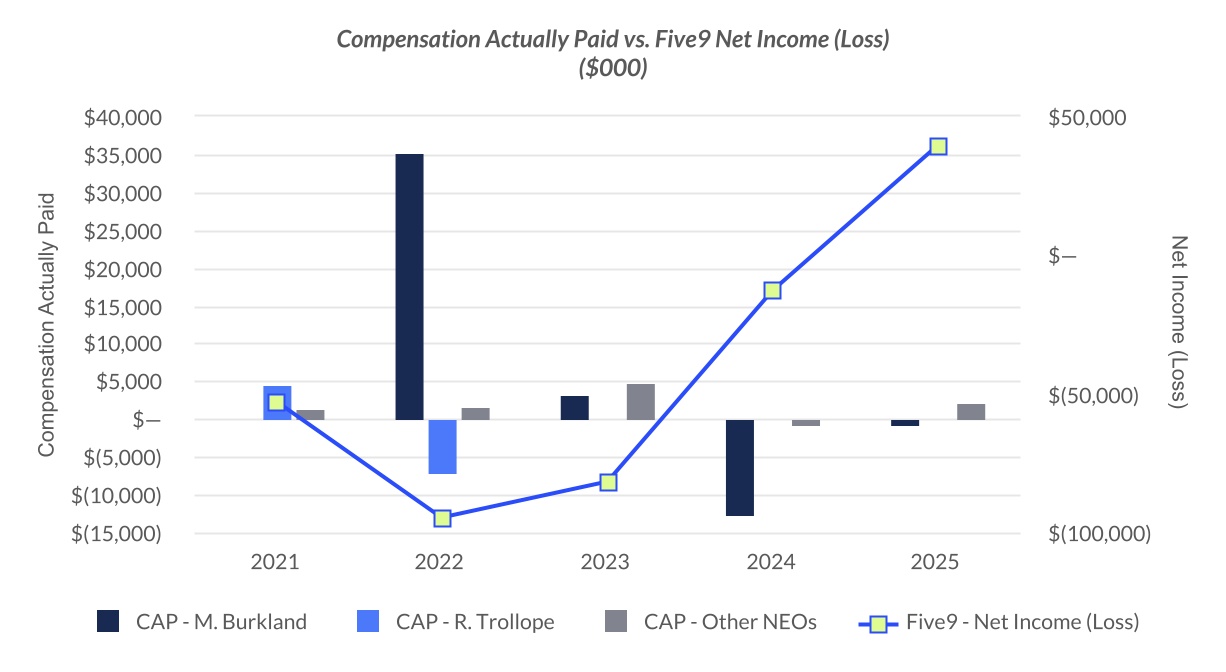
The graph below shows the relationship between CAP to each of our CEOs and the average of the CAP to our other NEOs and net income (loss) attributable to Five9, Inc. over the five fiscal years ending December 31, 2025, as reported in the Company’s consolidated financial statements.
|
|
|
|
|
|
| Total Shareholder Return Vs Peer Group |
|
|
|
|
|
|
|
| Tabular List, Table |
|
| | | •Revenue | •Levered Free Cash Flow (LFCF) | | | •Relative total shareholder return |
|
|
|
|
|
|
| Total Shareholder Return Amount |
|
$ 11
|
23
|
45
|
39
|
79
|
|
| Net Income (Loss) |
|
$ 39,416,000
|
$ (12,795,000)
|
$ (81,764,000)
|
$ (94,650,000)
|
$ (53,000,000)
|
|
| Company Selected Measure Amount |
|
1,149,088,000
|
1,041,938,000
|
910,488,000
|
778,846,000
|
609,591,000
|
|
| PEO Name |
|
|
|
|
|
|
Michael Burkland
|
| Additional 402(v) Disclosure |
|
Net income (loss) attributable to Five9, Inc. as reported in the consolidated financial statements included in our Annual Report on Form 10-K for the year ended December 31, 2025 filed with the SEC on February 19, 2026. 6.Revenue as reported in the consolidated financial statements included in our Annual Report on Form 10-K for the year ended December 31, 2025.
|
|
|
|
|
|
| Measure:: 1 |
|
|
|
|
|
|
|
| Pay vs Performance Disclosure |
|
|
|
|
|
|
|
| Compensation Actually Paid vs. Other Measure |
|
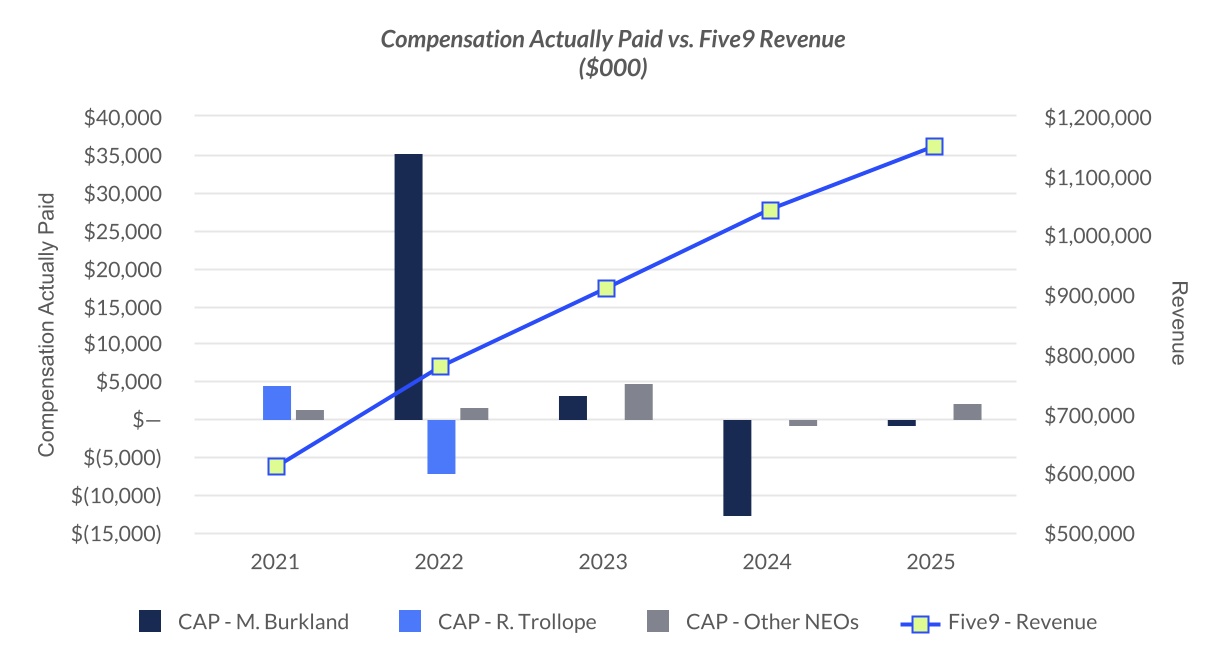
Revenue is the CSM for 2025, which is a key performance indicator used by us in managing our business, and is linked to our growth and profitability and the creation of long-term stockholder value. The graph below shows the relationship between CAP to each of our CEOs and the average of the CAP to our other NEOs and our revenue over the five fiscal years ending December 31, 2025.
|
|
|
|
|
|
| Name |
|
•Revenue
|
|
|
|
|
|
| Measure:: 2 |
|
|
|
|
|
|
|
| Pay vs Performance Disclosure |
|
|
|
|
|
|
|
| Compensation Actually Paid vs. Other Measure |
|
|
|
|
|
|
|
| Name |
|
•Levered Free Cash Flow (LFCF)
|
|
|
|
|
|
| Measure:: 3 |
|
|
|
|
|
|
|
| Pay vs Performance Disclosure |
|
|
|
|
|
|
|
| Name |
|
•Relative total shareholder return
|
|
|
|
|
|
| Michael Burkland [Member] |
|
|
|
|
|
|
|
| Pay vs Performance Disclosure |
|
|
|
|
|
|
|
| PEO Total Compensation Amount |
|
$ 17,403,709
|
$ 12,003,120
|
$ 1,204,757
|
$ 38,226,944
|
|
|
| PEO Actually Paid Compensation Amount |
|
(721,880)
|
(12,590,917)
|
3,146,084
|
35,346,014
|
|
|
| Rowan Trollope [Member] |
|
|
|
|
|
|
|
| Pay vs Performance Disclosure |
|
|
|
|
|
|
|
| PEO Total Compensation Amount |
|
0
|
0
|
0
|
11,134,881
|
$ 10,825,159
|
|
| PEO Actually Paid Compensation Amount |
|
0
|
0
|
0
|
$ (7,181,551)
|
$ 4,461,362
|
|
| PEO Name |
Mr. Rowan Trollope
|
|
|
|
Mr. Rowan Trollope
|
Mr. Rowan Trollope
|
|
| Nasdaq Computer Index [Member] |
|
|
|
|
|
|
|
| Pay vs Performance Disclosure |
|
|
|
|
|
|
|
| Peer Group Total Shareholder Return Amount |
|
233
|
$ 181
|
$ 135
|
$ 83
|
$ 127
|
|
| Other NEOs Average [Member] |
|
|
|
|
|
|
|
| Pay vs Performance Disclosure |
|
|
|
|
|
|
|
| PEO Total Compensation Amount |
|
5,316,520
|
|
|
|
|
|
| PEO Actually Paid Compensation Amount |
|
2,266,906
|
|
|
|
|
|
| PEO | Michael Burkland [Member] | Aggregate Grant Date Fair Value of Equity Award Amounts Reported in Summary Compensation Table |
|
|
|
|
|
|
|
| Pay vs Performance Disclosure |
|
|
|
|
|
|
|
| Adjustment to Compensation, Amount |
|
820,112
|
|
|
|
|
|
| PEO | Michael Burkland [Member] | Year-end Fair Value of Equity Awards Granted in Covered Year that are Outstanding and Unvested |
|
|
|
|
|
|
|
| Pay vs Performance Disclosure |
|
|
|
|
|
|
|
| Adjustment to Compensation, Amount |
|
(16,186,638)
|
|
|
|
|
|
| PEO | Michael Burkland [Member] | Year-over-Year Change in Fair Value of Equity Awards Granted in Prior Years That are Outstanding and Unvested |
|
|
|
|
|
|
|
| Pay vs Performance Disclosure |
|
|
|
|
|
|
|
| Adjustment to Compensation, Amount |
|
4,402,840
|
|
|
|
|
|
| PEO | Michael Burkland [Member] | Change in Fair Value as of Vesting Date of Prior Year Equity Awards Vested in Covered Year |
|
|
|
|
|
|
|
| Pay vs Performance Disclosure |
|
|
|
|
|
|
|
| Adjustment to Compensation, Amount |
|
(1,293,819)
|
|
|
|
|
|
| PEO | Michael Burkland [Member] | Prior Year End Fair Value of Equity Awards Granted in Any Prior Year that Fail to Meet Applicable Vesting Conditions During Covered Year |
|
|
|
|
|
|
|
| Pay vs Performance Disclosure |
|
|
|
|
|
|
|
| Adjustment to Compensation, Amount |
|
(4,384,623)
|
|
|
|
|
|
| PEO | Michael Burkland [Member] | Change in Fair Value, Awards Granted in any Prior Year That Are Outstanding And Unvested as of Fiscal Year End [Member] |
|
|
|
|
|
|
|
| Pay vs Performance Disclosure |
|
|
|
|
|
|
|
| Adjustment to Compensation, Amount |
|
(1,483,461)
|
|
|
|
|
|
| PEO | Other NEOs Average [Member] | Aggregate Grant Date Fair Value of Equity Award Amounts Reported in Summary Compensation Table |
|
|
|
|
|
|
|
| Pay vs Performance Disclosure |
|
|
|
|
|
|
|
| Adjustment to Compensation, Amount |
|
474,111
|
|
|
|
|
|
| PEO | Other NEOs Average [Member] | Year-end Fair Value of Equity Awards Granted in Covered Year that are Outstanding and Unvested |
|
|
|
|
|
|
|
| Pay vs Performance Disclosure |
|
|
|
|
|
|
|
| Adjustment to Compensation, Amount |
|
(4,656,810)
|
|
|
|
|
|
| PEO | Other NEOs Average [Member] | Year-over-Year Change in Fair Value of Equity Awards Granted in Prior Years That are Outstanding and Unvested |
|
|
|
|
|
|
|
| Pay vs Performance Disclosure |
|
|
|
|
|
|
|
| Adjustment to Compensation, Amount |
|
2,297,355
|
|
|
|
|
|
| PEO | Other NEOs Average [Member] | Change in Fair Value as of Vesting Date of Prior Year Equity Awards Vested in Covered Year |
|
|
|
|
|
|
|
| Pay vs Performance Disclosure |
|
|
|
|
|
|
|
| Adjustment to Compensation, Amount |
|
(267,511)
|
|
|
|
|
|
| PEO | Other NEOs Average [Member] | Prior Year End Fair Value of Equity Awards Granted in Any Prior Year that Fail to Meet Applicable Vesting Conditions During Covered Year |
|
|
|
|
|
|
|
| Pay vs Performance Disclosure |
|
|
|
|
|
|
|
| Adjustment to Compensation, Amount |
|
(404,571)
|
|
|
|
|
|
| PEO | Other NEOs Average [Member] | Change in Fair Value, Awards Granted in any Prior Year That Are Outstanding And Unvested as of Fiscal Year End [Member] |
|
|
|
|
|
|
|
| Pay vs Performance Disclosure |
|
|
|
|
|
|
|
| Adjustment to Compensation, Amount |
|
$ (492,188)
|
|
|
|
|
|