Pay Versus Performance
The following table sets forth compensation information and financial performance measures for the three most recent fiscal years. We have elected to follow the scaled disclosure requirements applicable to Smaller Reporting Companies with respect to the Pay Versus Performance Table. For further information concerning the Company’s variable pay-for-performance philosophy and how the Company’s aligns executive compensation with the Company’s performance, refer to “Executive Compensation – Compensation Discussion and Analysis.” Fair value amounts below are computed in a manner consistent with the fair value methodology used to account for share-based payments in our financial statements under generally accepted accounting principles. Total shareholder return has been calculated in a manner consistent with Item 402(v) of Regulation S-K.
| Value of Initial Fixed $100 Investment Based On: | ||||||||||||||||||||||||
|
Year |
Summary Compensation Table Total for PEO(1) | Compensation Actually Paid to PEO(1)(2) |
Average Summary Compensation Table Total for Non-PEO NEOs |
Average Compensation Actually Paid to Non-PEO NEOs | Total Shareholder Return |
Net Income (Loss) |
||||||||||||||||||
|
(a) |
(b) |
(c) |
(d) |
(e) |
(f) |
(h) |
||||||||||||||||||
|
2025 |
$ | 1,196,495 | $ | 830,495 | $ | 1,408,986 | $ | 539,621 | $ | 126.07 | $ | (12,040,000 | ) | |||||||||||
|
2024 |
$ | 1,471,241 | $ | 1,419,065 | $ | 917,401 | $ | 904,071 | $ | 192.95 | $ | (3,841,000 | ) | |||||||||||
|
2023 |
$ | 1,445,392 | $ | 1,439,624 | $ | 871,608 | $ | 866,818 | $ | 365.70 | $ | (263,000 | ) | |||||||||||
|
(1) |
For all years in question, our Principal Executive Officer (PEO) was the Company's President and Chief Executive Officer, Brian C. Faith. |
|
(2) |
Compensation Actually Paid to PEO reflects the exclusions and inclusions related to timing variations. Equity values are calculated in accordance with FASB ASC Topic 718. Amounts in the Exclusion of Equity Awards column are the totals from the Stock Awards column set forth in the Summary Compensation Table. |
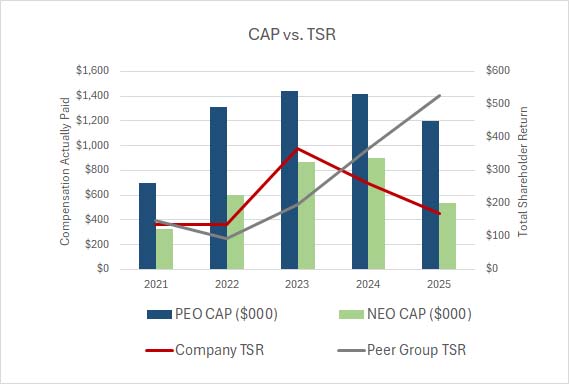
Compensation Actually Paid v. Total Shareholder Return
Narrative Disclosure to Pay Versus Performance Table
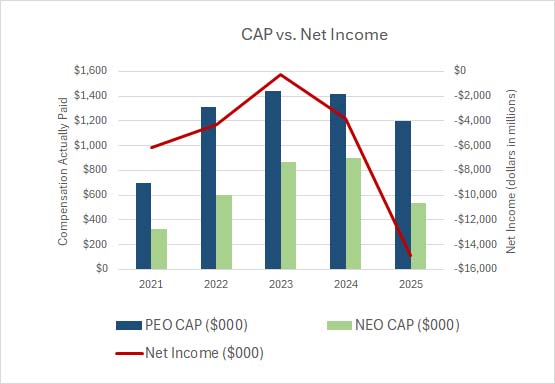
The line graphs below compare (i) the compensation actually paid to our PEO and the average of the compensation actually paid to our remaining NEOs, with (ii) our cumulative TSR and (iii) our Net Income, in each case, for each of the last five years.
TSR amounts reported in the graph assume an initial fixed investment of $100, and that all dividends, if any, were reinvested.
Compensation Actually Paid v. Net Income (Loss)