Average | |||||||||||||||||||
Summary | Average | Value of Initial Fixed $100 | |||||||||||||||||
Compensation | Compensation | Investment Based on: | |||||||||||||||||
Summary | Table Total for | Actually Paid to | Total | Peer Group | SG&A | ||||||||||||||
Compensation | Compensation | Non-PEO Named | Non-PEO Named | Shareholder | Total | Adjusted | Percentage | ||||||||||||
Table Total | Actually Paid | Executive | Executive | Return | Shareholder | Net | Net | of | |||||||||||
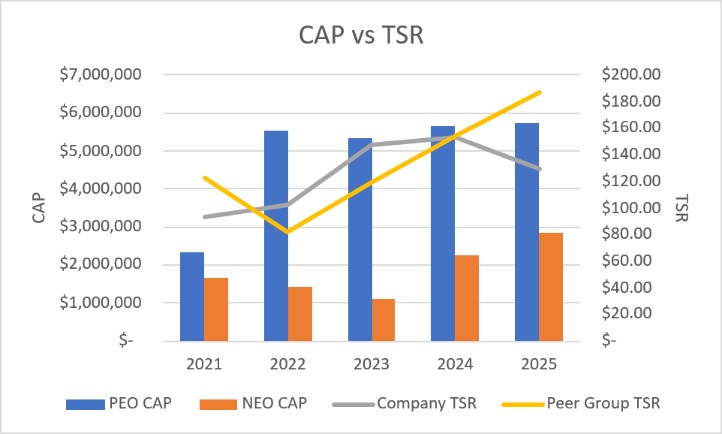
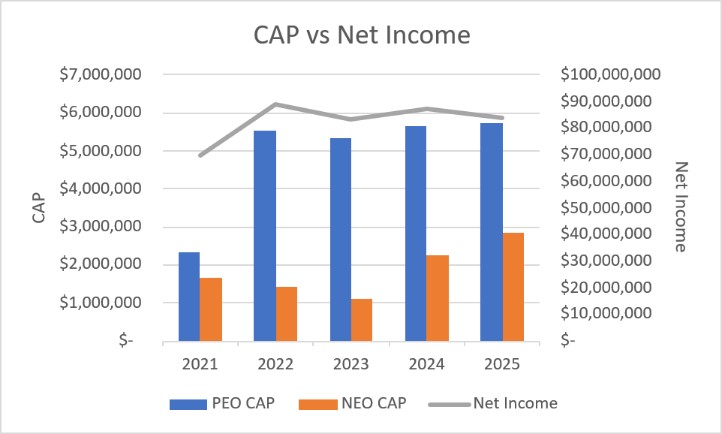
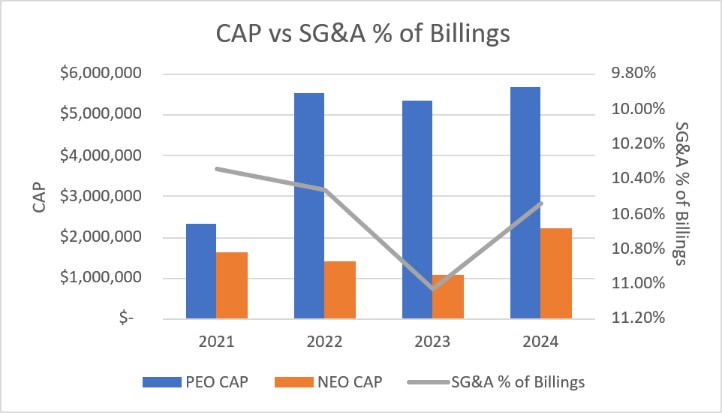
Year | for PEO(1) ($) | to PEO(2) ($) | Officers(1) ($) | Officers(2) ($) | (TSR) ($) | Return(3) ($) | Income ($) | Income(4) ($) | Billings(5) | ||||||||||
2025 | 7,502,050 | 5,738,500 | 3,379,430 | 2,848,822 | 129.07 | 187.14 | 83,722,000 | 88,149,000 | |||||||||||
2024 | 5,075,653 | 5,661,803 | 2,078,325 | 2,238,376 | 153.36 | 154.48 | 87,095,000 | 10.54 | % | ||||||||||
2023 | 1,915,864 | 5,357,164 | 603,320 | 1,096,862 | 147.95 | 119.22 | 83,271,000 | 11.03 | % | ||||||||||
2022 | 4,787,929 | 5,547,279 | 1,338,317 | 1,416,376 | 102.57 | 82.43 | 89,219,000 | 10.46 | % | ||||||||||
2021 | 3,209,550 | 2,339,350 | 1,802,672 | 1,649,422 | 93.75 | 122.18 | 69,906,000 | 10.34 | % | ||||||||||
| (1) | Our PEO was Timothy McGrath for all years presented in the table. Our NEOs other than our PEO were Thomas Baker and Patricia Gallup for all years presented in the table. |
| (2) | The following table describes the adjustments, each of which is prescribed by SEC rule, to calculate the CAP Amounts from the SCT Amounts. The SCT Amounts and the CAP Amounts do not reflect the actual amount of compensation earned by or paid to our executives during the applicable years, but rather are amounts determined in accordance with Item 402 of Regulation S-K under the Exchange Act. |
PEO | |||||||||||||||
| 2025 | | 2024 | | 2023 | | 2022 | | 2021 | ||||||
Total Compensation from SCT | $ | 7,502,050 | $ | 5,075,653 | $ | 1,915,864 | $ | 4,787,929 | $ | 3,209,550 | |||||
Decrease for aggregate value for stock awards and option awards included in SCT for the covered fiscal year | (5,037,600) | (2,569,200) | — | (2,165,200) | (887,200) | ||||||||||
Increase for fair value at year end of awards granted during the covered fiscal year that were outstanding and unvested at the covered fiscal year end | 4,620,800 | 2,770,800 | — | 1,876,000 | 862,600 | ||||||||||
Increase (decrease) in year-over-year change in fair value at covered fiscal year end of awards granted in any prior fiscal year that were outstanding and unvested at the covered fiscal year end | (920,800) | 195,700 | 2,944,950 | 603,200 | (790,400) | ||||||||||
Increase for vesting date fair value of awards granted and vested during the covered fiscal year | — | — | — | — | — | ||||||||||
Increase (decrease) in change as of the vesting date (from the end of the prior fiscal year) in fair value of awards granted in any prior fiscal year for which vesting conditions were satisfied during the covered fiscal year | (425,950) | 188,850 | 496,350 | 445,350 | (55,200) | ||||||||||
Decrease for fair value at end of prior fiscal year of awards granted in any prior fiscal year that failed to meet the applicable vesting conditions during the covered fiscal year | — | — | — | — | — | ||||||||||
Increase for dividends or other earnings paid on stock or option awards in the covered fiscal year prior to vesting if not otherwise included in the total compensation for the covered fiscal year | — | — | — | — | — | ||||||||||
Compensation Actually Paid | $ | 5,738,500 | $ | 5,661,803 | $ | 5,357,164 | $ | 5,547,279 | $ | 2,339,350 | |||||
Average of NEO's | |||||||||||||||
2025 | | 2024 | | 2023 | | 2022 | | 2021 | |||||||
Total Compensation from SCT | $ | 3,379,430 | $ | 2,078,325 | $ | 603,320 | $ | 1,338,317 | $ | 1,802,672 | |||||
Decrease for aggregate value for stock awards and option awards included in SCT for the covered fiscal year | (2,595,025) | (1,284,600) | — | (541,300) | (1,074,200) | ||||||||||
Increase for fair value at year end of awards granted during the covered fiscal year that were outstanding and unvested at the covered fiscal year end | 2,382,600 | 1,385,400 | — | 469,000 | 970,425 | ||||||||||
Increase (decrease) in year-over-year change in fair value at covered fiscal year end of awards granted in any prior fiscal year that were outstanding and unvested at the covered fiscal year end | (207,180) | 23,433 | 401,123 | 84,825 | (42,640) | ||||||||||
Increase for vesting date fair value of awards granted and vested during the covered fiscal year | — | — | — | — | — | ||||||||||
Increase (decrease) in change as of the vesting date (from the end of the prior fiscal year) in fair value of awards granted in any prior fiscal year for which vesting conditions were satisfied during the covered fiscal year | (111,003) | 35,818 | 92,419 | 65,534 | (6,835) | ||||||||||
Decrease for fair value at end of prior fiscal year of awards granted in any prior fiscal year that failed to meet the applicable vesting conditions during the covered fiscal year | — | — | — | — | — | ||||||||||
Increase for dividends or other earnings paid on stock or option awards in the covered fiscal year prior to vesting if not otherwise included in the total compensation for the covered fiscal year | — | — | — | — | — | ||||||||||
Compensation Actually Paid | $ | 2,848,822 | $ | 2,238,376 | $ | 1,096,862 | $ | 1,416,376 | $ | 1,649,422 | |||||
| (3) | Our peer group for the calculation of Total Shareholder Return, or TSR, is the NASDAQ Composite-Total Return. |
| (4) | Adjusted net income, a non-GAAP financial measure, is calculated as net income plus the after-tax amount of severance expenses in 2025. |
| (5) | SG&A percentage of billings, a non-GAAP financial measure, is calculated as total SG&A expenses (less any exclusions approved by the subcommittee that administered our cash performance awards, or the Subcommittee) divided by total billings of products and services delivered to customers. For 2024, we defined total billings delivered to customers as net sales plus the amounts we are required to net for sales of software and extended service plans under ASC 606. For 2023, 2022, and 2021, we defined total billings delivered to customers as net sales plus the amounts we are required to net for sales of software under ASC |
| 606. In 2021, the Subcommittee approved $5 million of uncontrolled medical expenses to be excluded from total SG&A expenses. |
| (1) | Our PEO was Timothy McGrath for all years presented in the table. Our NEOs other than our PEO were Thomas Baker and Patricia Gallup for all years presented in the table. |
| (3) | Our peer group for the calculation of Total Shareholder Return, or TSR, is the NASDAQ Composite-Total Return. |
| (2) | The following table describes the adjustments, each of which is prescribed by SEC rule, to calculate the CAP Amounts from the SCT Amounts. The SCT Amounts and the CAP Amounts do not reflect the actual amount of compensation earned by or paid to our executives during the applicable years, but rather are amounts determined in accordance with Item 402 of Regulation S-K under the Exchange Act. |
PEO | |||||||||||||||
| 2025 | | 2024 | | 2023 | | 2022 | | 2021 | ||||||
Total Compensation from SCT | $ | 7,502,050 | $ | 5,075,653 | $ | 1,915,864 | $ | 4,787,929 | $ | 3,209,550 | |||||
Decrease for aggregate value for stock awards and option awards included in SCT for the covered fiscal year | (5,037,600) | (2,569,200) | — | (2,165,200) | (887,200) | ||||||||||
Increase for fair value at year end of awards granted during the covered fiscal year that were outstanding and unvested at the covered fiscal year end | 4,620,800 | 2,770,800 | — | 1,876,000 | 862,600 | ||||||||||
Increase (decrease) in year-over-year change in fair value at covered fiscal year end of awards granted in any prior fiscal year that were outstanding and unvested at the covered fiscal year end | (920,800) | 195,700 | 2,944,950 | 603,200 | (790,400) | ||||||||||
Increase for vesting date fair value of awards granted and vested during the covered fiscal year | — | — | — | — | — | ||||||||||
Increase (decrease) in change as of the vesting date (from the end of the prior fiscal year) in fair value of awards granted in any prior fiscal year for which vesting conditions were satisfied during the covered fiscal year | (425,950) | 188,850 | 496,350 | 445,350 | (55,200) | ||||||||||
Decrease for fair value at end of prior fiscal year of awards granted in any prior fiscal year that failed to meet the applicable vesting conditions during the covered fiscal year | — | — | — | — | — | ||||||||||
Increase for dividends or other earnings paid on stock or option awards in the covered fiscal year prior to vesting if not otherwise included in the total compensation for the covered fiscal year | — | — | — | — | — | ||||||||||
Compensation Actually Paid | $ | 5,738,500 | $ | 5,661,803 | $ | 5,357,164 | $ | 5,547,279 | $ | 2,339,350 | |||||
| (2) | The following table describes the adjustments, each of which is prescribed by SEC rule, to calculate the CAP Amounts from the SCT Amounts. The SCT Amounts and the CAP Amounts do not reflect the actual amount of compensation earned by or paid to our executives during the applicable years, but rather are amounts determined in accordance with Item 402 of Regulation S-K under the Exchange Act. |
Average of NEO's | |||||||||||||||
2025 | | 2024 | | 2023 | | 2022 | | 2021 | |||||||
Total Compensation from SCT | $ | 3,379,430 | $ | 2,078,325 | $ | 603,320 | $ | 1,338,317 | $ | 1,802,672 | |||||
Decrease for aggregate value for stock awards and option awards included in SCT for the covered fiscal year | (2,595,025) | (1,284,600) | — | (541,300) | (1,074,200) | ||||||||||
Increase for fair value at year end of awards granted during the covered fiscal year that were outstanding and unvested at the covered fiscal year end | 2,382,600 | 1,385,400 | — | 469,000 | 970,425 | ||||||||||
Increase (decrease) in year-over-year change in fair value at covered fiscal year end of awards granted in any prior fiscal year that were outstanding and unvested at the covered fiscal year end | (207,180) | 23,433 | 401,123 | 84,825 | (42,640) | ||||||||||
Increase for vesting date fair value of awards granted and vested during the covered fiscal year | — | — | — | — | — | ||||||||||
Increase (decrease) in change as of the vesting date (from the end of the prior fiscal year) in fair value of awards granted in any prior fiscal year for which vesting conditions were satisfied during the covered fiscal year | (111,003) | 35,818 | 92,419 | 65,534 | (6,835) | ||||||||||
Decrease for fair value at end of prior fiscal year of awards granted in any prior fiscal year that failed to meet the applicable vesting conditions during the covered fiscal year | — | — | — | — | — | ||||||||||
Increase for dividends or other earnings paid on stock or option awards in the covered fiscal year prior to vesting if not otherwise included in the total compensation for the covered fiscal year | — | — | — | — | — | ||||||||||
Compensation Actually Paid | $ | 2,848,822 | $ | 2,238,376 | $ | 1,096,862 | $ | 1,416,376 | $ | 1,649,422 | |||||
The following lists the financial performance measures that, in our assessment, represent the most important performance measures we use to link the CAP Amounts for our named executive officers for 2025 (our most recently completed fiscal year), to company performance:
Company Performance Measures
Adjusted net income |
SG&A percentage of billings |
Of these measures, we have identified adjusted net income as the most important of our financial performance measures used to link CAP Amounts for our executives for 2025 to company performance.
| (5) | SG&A percentage of billings, a non-GAAP financial measure, is calculated as total SG&A expenses (less any exclusions approved by the subcommittee that administered our cash performance awards, or the Subcommittee) divided by total billings of products and services delivered to customers. For 2024, we defined total billings delivered to customers as net sales plus the amounts we are required to net for sales of software and extended service plans under ASC 606. For 2023, 2022, and 2021, we defined total billings delivered to customers as net sales plus the amounts we are required to net for sales of software under ASC |
| 606. In 2021, the Subcommittee approved $5 million of uncontrolled medical expenses to be excluded from total SG&A expenses. |