Exhibit 13.0

Quaint Oak Bancorp, Inc.
Fueling the Growth of Business
CEO’S LETTER TO SHAREHOLDERS
To Our Valued Shareholders:
On behalf of the Board of Directors, Senior Management and Team Members of the Quaint Oak Family of Companies, I am pleased to present our 2025 Annual Report to Shareholders.
The year 2025 was defined by disciplined execution, strategic expansion, and a continued commitment to building the future of Quaint Oak. In an operating environment that has remained dynamic and competitive, our team delivered steady performance while advancing the core initiatives that position us for long term, sustainable growth.
Throughout the year, we strengthened our foundation as a diversified financial services company—one that balances the stability of traditional community banking with the additional reach and capabilities of our specialty platforms. Our SBA initiative continued to scale, supported by expanding production capacity and deepening referral networks. Specialty real estate financing remained a key contributor, and our international correspondent banking platform was further enhanced to serve customers with speed, expertise, and tailored solutions going forward.
We continued investing in our talent, technology, and risk management infrastructure—areas that are essential to maintaining the strong internal controls and regulatory compliance our shareholders expect. These investments ensure that as we grow, we do so with financial resilience, efficiency, and a clear focus on regulatory expectations and best practices.
As we look ahead, we remain focused on executing the strategic priorities that will drive value creation: expanding our specialty capabilities, enhancing operational efficiency, strengthening core banking performance, and fostering a culture rooted in teamwork, transparency, and excellence. While the financial services industry continues to evolve in correspondent banking, our overall strategy is built for consistency and adaptability—qualities that define who we are and how we operate.
This progress is made possible by the dedication of our employees, the trust of our customers, and the continued support of our shareholders. I remain deeply proud of our team and confident in the opportunities before us.
As always, our current and continued business strategy focuses on long-term profitability, sound credit quality, and maintaining healthy capital ratios, reflecting our strong commitment to shareholder value. Thank you for your continued confidence in Quaint Oak Bancorp, Inc. I look forward to the year ahead and to building, together, on the momentum we have created.
Sincerely,

Robert T. Strong
Chief Executive Officer
TABLE OF CONTENTS
| Page |
|
| Management’s Discussion and Analysis of Financial Condition and Results of Operations |
|
| Reports of Independent Registered Public Accounting Firm |
|
| Consolidated Balance Sheets |
|
| Consolidated Statements of Income |
|
| Consolidated Statements of Comprehensive Income |
|
| Consolidated Statements of Stockholders’ Equity |
|
| Consolidated Statements of Cash Flows |
|
| Notes to Consolidated Financial Statements |
|
| General Information |
|
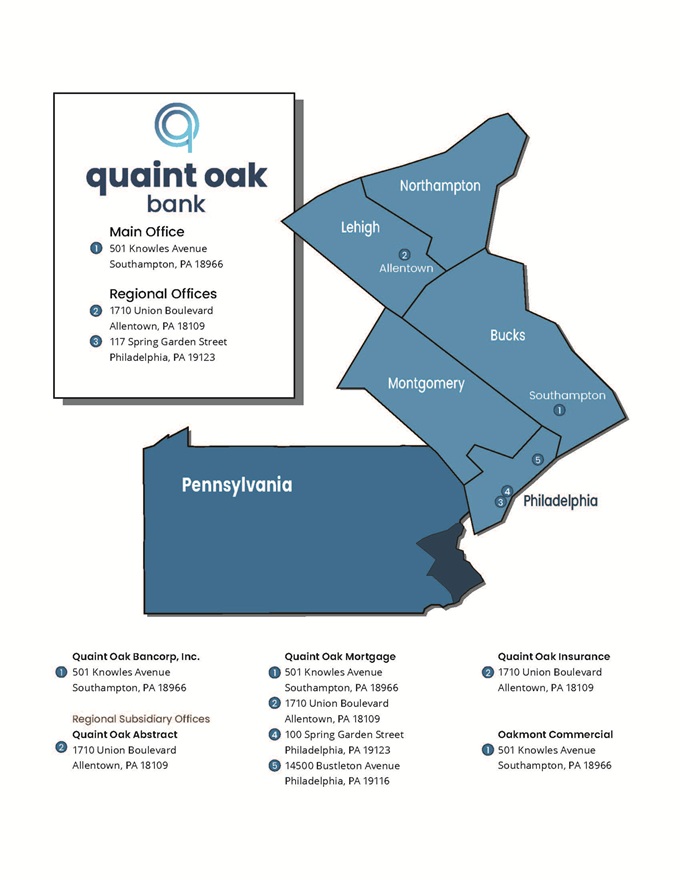
| Locations |
Quaint Oak Bancorp, Inc.
Management’s Discussion and Analysis of Financial Condition and Results of Operations
General
Quaint Oak Bancorp, Inc. (the “Company”) was formed in connection with Quaint Oak Bank’s (the “Bank”) conversion to a stock savings bank completed on July 3, 2007. The Company’s results of operations are dependent primarily on the results of Quaint Oak Bank, a wholly owned subsidiary of the Company, along with the Bank’s wholly owned subsidiaries. The Bank, a Pennsylvania-chartered stock savings bank, is headquartered in Southampton, Pennsylvania and conducts business through three regional offices located in the Delaware Valley, Lehigh Valley and Philadelphia markets. At December 31, 2025, the Bank has five active wholly-owned subsidiaries, Quaint Oak Mortgage, LLC, Quaint Oak Abstract, LLC, QOB Properties, LLC, Quaint Oak Insurance Agency, LLC, and Oakmont Commercial, LLC, each a Pennsylvania limited liability company. On March 29, 2024, Quaint Oak Bank sold its 51% interest in Oakmont Capital Holdings, LLC (“OCH”), a multi-state equipment finance company based in West Chester, Pennsylvania. The decision was based on a number of strategic priorities and other factors. As a result of this action, Quaint Oak Bancorp classified the operations of OCH as discontinued operations under ASC 205-20. Also on March 29, 2024, the Company discontinued the operations of Quaint Oak Real Estate, LLC, a 100% wholly owned subsidiary of the Bank engaged in the real estate brokerage business. All significant intercompany balances and transactions have been eliminated.
Quaint Oak Mortgage offers mortgage banking services in the Lehigh Valley, Delaware Valley and Philadelphia County region of Pennsylvania, including conventional, FHA, VA, and USDA loans, almost all of which are underwritten to GSE-guidelines for sale in the secondary market. In February 2019, Quaint Oak Mortgage opened a mortgage banking office in Philadelphia, Pennsylvania. Oakmont Commercial, LLC began operations in October 2021 and operates as a multi-state specialty commercial real estate financing company, providing loans for commercial real estate purchases, refinancing, and development projects to small businesses primarily on the East Coast and generally in the Mid-Atlantic and Southeast. Oakmont Commercial focuses on originations of low loan-to-value, high yield, primarily owner-occupied commercial real estate collateralized loans to be sold in the secondary market to institutional and bank buyers. Quaint Oak Abstract began operation in July 2009 offering title insurance, primarily in the Lehigh Valley and Bucks County regions of Pennsylvania. QOB Properties, LLC began operations in July 2012 and holds Bank properties acquired through a foreclosure proceeding or acceptance of a deed in lieu of foreclosure. Quaint Oak Insurance Agency, LLC, located in Southampton, Pennsylvania, began operations in August 2016 and offers comprehensive coverage, including home, auto, life, and business insurance. Quaint Oak Mortgage cross-sells products from Quaint Oak Bank’s title and insurance businesses, Quaint Oak Abstract and Quaint Oak Insurance, to its mortgage customers.
Quaint Oak Bank established international correspondent banking operations in March 2022 and maintains a partnership with one international banking entity based in Puerto Rico that utilizes Quaint Oak Bank to help facilitate U.S. dollar payments. As of December 31, 2025, the international correspondent banking division had $4.4 million, or 0.7%, of deposits.
Quaint Oak Bank’s profitability depends, to a large extent, on net interest income, which is the difference between the income earned on its loan and investment portfolios and the cost of funds, consisting of the interest paid on deposits and borrowings. Results of operations are also affected by provisions for credit losses, fee income and other non-interest income and non-interest expense. Non-interest expense principally consists of compensation, directors’ fees and expenses, office occupancy and equipment expense, data processing expense, professional fees, advertising expense, FDIC deposit insurance assessment, and other expenses.
Quaint Oak Bancorp, Inc.
Management’s Discussion and Analysis of Financial Condition and Results of Operations
Quaint Oak Bank’s business consists primarily of originating commercial real estate loans, commercial business loans, one-to-four family residential owner occupied loans and multi-family residential loans, generally within its market area. The market for our deposit customers is generated primarily through local market certificates of deposit and business checking and money market accounts. At December 31, 2025, approximately 42.0% of Quaint Oak Bank’s total deposits were held by customers outside the Commonwealth of Pennsylvania. Our branch offices are primarily cashless. Cash transactions at our branch offices are facilitated through a correspondent banking relationship with another Pennsylvania-based national commercial bank. Our real estate loans are primarily secured by properties in the mid-Atlantic region and are originated through Quaint Oak Mortgage and our subsidiary, Oakmont Commercial, although we have originated loans throughout the continental United States through other relationships we have with brokers. At December 31, 2025, commercial real estate loans and commercial business loans comprise the largest percentage of Quaint Oak Bank’s loan portfolio, before net items, at 56.7% and 17.6%, respectively. Quaint Oak Bank’s loans are primarily funded by certificates of deposit, money market accounts and business checking. At December 31, 2025, certificates of deposit amounted to 59.4% of total deposits compared to 51.1% of total deposits at December 31, 2024. At December 31, 2025, interest bearing checking accounts amounted to 17.7% of total deposits compared to 8.6% at December 31, 2024. At December 31, 2025, money market accounts amounted to 11.8% of total deposits compared to 29.3% of total deposits at December 31, 2024. At December 31, 2025, non-interest bearing checking accounts amounted to 11.0% of total deposits compared to 10.8% of total deposits at December 31, 2024. Management anticipates that certificates of deposit, money market accounts, interest bearing checking, and business checking will continue to be the primary sources of funding for Quaint Oak Bank’s assets.
Our results of operations are significantly affected by general economic and competitive conditions, particularly with respect to changes in interest rates, government policies and actions of regulatory authorities as well as other factors beyond our control. Future changes in applicable law, regulations or government policies may materially affect our financial condition and results of operations.
Forward-Looking Statements Are Subject to Change
This Annual Report contains certain forward-looking statements (as defined in the Securities Exchange Act of 1934 and the regulations thereunder). Forward-looking statements are not historical facts but instead represent only the beliefs, expectations or opinions of the Company and its management regarding future events, many of which, by their nature, are inherently uncertain. Forward-looking statements may be identified by the use of such words as: “believe”, “expect”, “anticipate”, “intend”, “plan”, “estimate”, or words of similar meaning, or future or conditional terms such as “will”, “would”, “should”, “could”, “may”, “likely”, “probably”, or “possibly.” Forward-looking statements include, but are not limited to, financial projections and estimates and their underlying assumptions; statements regarding plans, objectives and expectations with respect to future operations, products and services; and statements regarding future performance. Such statements are subject to certain risks, uncertainties and assumptions, many of which are difficult to predict and generally are beyond the control of and its management, that could cause actual results to differ materially from those expressed in, or implied or projected by, forward-looking statements. The following factors, among others, could cause actual results to differ materially from the anticipated results or other expectations expressed in the forward-looking statements: (1) economic and competitive conditions which could affect the volume of loan originations, deposit flows and real estate values; (2) the levels of non-interest income and expense and the amount of credit losses; (3) competitive pressure among depository institutions increasing significantly; (4) changes in the interest rate environment causing reduced interest margins; (5) general economic conditions, either nationally or in the markets in which the Company is or will be doing business, being less favorable than expected;(6) political and social unrest, including acts of war or terrorism; or (7) legislation or changes in regulatory requirements adversely affecting the business in which the Company is or will be engaged. The Company undertakes no obligation to update these forward-looking statements to reflect events or circumstances that occur after the date on which such statements were made.
Critical Accounting Estimates
In reviewing and understanding financial information for the Company, you are encouraged to read and understand the significant accounting policies used in preparing our financial statements. These policies are described in Note 2 of the notes to our financial statements. The accounting and financial reporting policies of the Company conform to accounting principles generally accepted in the United States of America and to general practices within the banking industry. Accordingly, the consolidated financial statements require certain estimates, judgments, and assumptions, which are believed to be reasonable, based upon the information available. These estimates and assumptions affect the reported amounts of assets and liabilities at the date of the financial statements and the reported amounts of income and expenses during the periods presented. The following accounting estimates comprise those that management believes are the most critical to aid in fully understanding and evaluating our reported financial results. These policies require numerous estimates or economic assumptions that may prove inaccurate or may be subject to variations which may significantly affect our reported results and financial condition for the period or in future periods.
Management evaluates the credit quality of the Company’s loan portfolio on an ongoing basis and performs a formal review of the adequacy of the allowance for credit losses (“ACL”) on a quarterly basis. The ACL is established through a provision for credit losses charged to earnings and is maintained at a level that management considers to be an estimate of the lifetime expected credit losses of the portfolio as of the evaluation date. Loans, or portions of loans, determined by management to be uncollectible are charged off against the ACL, while recoveries of amounts previously charged off are credited to the ACL.
Determining the amount of the ACL is considered a critical accounting estimate because it requires significant judgment and the use of estimates related to the amount and timing of expected future cash flows, estimated losses on pools of homogeneous loans based on historical loss experience and reasonable and supportable forecasts, as well as consideration of current economic trends and conditions, all of which may be susceptible to significant change. Banking regulators, as an integral part of their examination of the Company, also review the ACL, and may require, based on information available to them at the time of their examination, that management make the necessary adjustments to bring the ACL balance to an appropriate level. Additionally, the ACL is determined, in part, by the composition and size of the loan portfolio.
Quaint Oak Bancorp, Inc.
Management’s Discussion and Analysis of Financial Condition and Results of Operations
Selected Consolidated Financial and Other Data. Set forth below is selected financial and other data of Quaint Oak Bancorp, Inc. You should read the financial statements and related notes contained in this Annual Report which provide more detailed information.
| At or For the Years Ended December 31, |
||||||||
| 2025 |
2024 |
|||||||
| (Dollars in Thousands) |
||||||||
| Selected Financial and Other Data: |
||||||||
| Total assets |
$ | 675,853 | $ | 685,168 | ||||
| Cash and cash equivalents |
53,547 | 62,989 | ||||||
| Investment in interest-earning time deposits |
912 | 912 | ||||||
| Investment securities available for sale at fair value |
882 | 1,666 | ||||||
| Loans held for sale |
60,956 | 64,281 | ||||||
| Loans receivable, net |
540,698 | 534,693 | ||||||
| Investment in Federal Home Loan Bank stock, at cost |
291 | 2,214 | ||||||
| Premises and equipment, net |
1,540 | 1,626 | ||||||
| Deposits |
597,278 | 553,252 | ||||||
| Federal Home Loan Bank borrowings |
- | 47,855 | ||||||
| Senior debt, net of amortized costs |
9,619 | - | ||||||
| Subordinated debt |
8,000 | 22,000 | ||||||
| Total Stockholders’ Equity |
52,329 | 52,617 | ||||||
| Selected Operating Data: |
||||||||
| Total interest income |
$ | 40,629 | $ | 43,437 | ||||
| Total interest expense |
22,726 | 25,620 | ||||||
| Net interest income |
17,903 | 17,817 | ||||||
| Provision for credit losses |
1,217 | 1,534 | ||||||
| Net interest income after provision for credit losses |
16,686 | 16,283 | ||||||
| Total non-interest income |
7,159 | 8,156 | ||||||
| Total non-interest expense |
23,201 | 21,018 | ||||||
| Income before income taxes |
644 | 3,421 | ||||||
| Income taxes |
322 | 1,032 | ||||||
| Net income |
$ | 322 | $ | 2,389 | ||||
| Net income from discontinued operations |
$ | - | $ | 406 | ||||
| Net income attributable to Quaint Oak Bancorp, Inc. |
$ | 322 | $ | 2,795 | ||||
| Selected Operating Ratios (1): |
||||||||
| Average yield on interest-earning assets |
6.41 | % | 6.32 | % | ||||
| Average rate on interest-bearing liabilities |
4.06 | 4.48 | ||||||
| Average interest rate spread (2) |
2.35 | 1.84 | ||||||
| Net interest margin (2) |
2.83 | 2.59 | ||||||
| Average interest-earning assets to average interest-bearing liabilities |
113.19 | 120.08 | ||||||
| Net interest income after provision for credit losses to non-interest expense |
71.92 | 77.47 | ||||||
| Total non-interest expense to average assets |
3.55 | 2.99 | ||||||
| Efficiency ratio (3) |
92.58 | 80.93 | ||||||
| Return on average assets |
0.07 | 0.40 | ||||||
| Return on average equity |
0.82 | 5.53 | ||||||
| Asset Quality Ratios (4): |
||||||||
| Non-performing loans as a percent of loans receivable, net (5) |
1.36 | % | 1.18 | % | ||||
| Non-performing assets as a percent of total assets(5) |
1.14 | 0.92 | ||||||
| Allowance for credit losses as a percent of non-performing loans |
84.01 | 102.45 | ||||||
| Allowance for credit losses as a percent of total loans receivable |
1.13 | 1.20 | ||||||
| Net charge-offs to average loans receivable |
0.27 | 0.29 | ||||||
Quaint Oak Bancorp, Inc.
Management’s Discussion and Analysis of Financial Condition and Results of Operations
| At or For the Years Ended December 31, |
||||||||
| 2025 |
2024 |
|||||||
| Capital Ratios (4): |
||||||||
| Tier 1 leverage ratio |
10.26 | % | 10.80 | % | ||||
| Common Tier 1 capital ratio |
12.36 | 13.09 | ||||||
| Tier 1 risk-based capital ratio |
12.36 | 13.09 | ||||||
| Total risk-based capital ratio |
13.55 | 14.34 | ||||||
___________________
| (1) |
With the exception of end of period ratios, all ratios are based on average daily balances during the indicated periods. |
| (2) |
Average interest rate spread represents the difference between the average yield on interest-earning assets and the average rate paid on interest-bearing liabilities, and net interest margin represents net interest income as a percentage of average interest-earning assets. |
| (3) |
The efficiency ratio represents the ratio of non-interest expense divided by the sum of net interest income and non-interest income. |
| (4) |
Asset quality ratios and capital ratios are end of period ratios, except for net charge-offs to average loans receivable. |
| (5) |
Non-performing assets consist of non-performing loans at December 31, 2025 and 2024. Non-performing loans consist of non-accruing loans plus accruing loans 90 days or more past due. |
Comparison of Financial Condition at December 31, 2025 and December 31, 2024
General. The Company’s total assets at December 31, 2025 were $675.9 million, a decrease of $9.3 million, or 1.4%, from $685.2 million at December 31, 2024. This decrease in total assets was primarily due to a $9.4 million, or 15.0%, decrease in cash and cash equivalents, a $3.3 million, or 5.2%, decrease in loans held for sale, a $1.9 million, or 86.9%, decrease in investment in Federal Home Loan Bank stock, at cost, and a $784,000, or 47.1%, decrease in investment securities available for sale. Partially offsetting the decrease in total assets was a $6.0 million, or 1.1%, increase in loans receivable, net of allowance for credit losses.
Cash and Cash Equivalents. Cash and cash equivalents decreased $9.4 million, or 15.0%, from $63.0 million at December 31, 2024 to $53.5 million at December 31, 2025. Cash and cash equivalents decreased as excess liquidity was used to fund the repayment of FHLB borrowings.
Investment Securities Available for Sale. Investment securities available for sale decreased $784,000, or 47.1%, from $1.7 million at December 31, 2024 to $882,000 at December 31, 2025 due primarily to the principal repayments on these securities during the year ended December 31, 2025.
Loans Held for Sale. Loans held for sale decreased $3.3 million, or 5.2%, from $64.3 million at December 31, 2024 to $61.0 million at December 31, 2025 as the Bank’s commercial real estate subsidiary, Oakmont Commercial, LLC, originated $52.0 million of commercial real estate loans during the year ended December 31, 2025 and sold $49.5 million of loans in the secondary market during this same period. The Bank’s mortgage banking subsidiary, Quaint Oak Mortgage, LLC, originated $112.3 million of one-to-four family residential loans during the year ended December 31, 2025 and sold $113.9 million of loans in the secondary market. Additionally, the Bank originated $14.7 million of SBA loans for sale and sold $18.9 million of SBA loans in the secondary market in the same period.
Loans Receivable, Net. Loans receivable, net, increased $6.0 million, or 1.1% from $534.7 million at December 31, 2024 to $540.7 million at December 31, 2025. The largest increases within the loan portfolio occurred in one-to-four family owner occupied loans which increased $15.7 million, or 60.6%, commercial real estate loans, which increased $12.1 million, or 4.1%, and construction loans which increased $5.1 million, or 28.1%. Partially offsetting these increases were commercial business loans which decreased $18.6 million, or 16.2%, one-to-four family non-owner occupied loans which decreased $4.7 million, or 14.0%, multi-family residential loans which decreased $4.6 million, or 10.2%, and home equity loans which decreased $365,000, or 6.4%. The Company continues its strategy of diversifying its loan portfolio with higher yielding and shorter-term loan products and selling substantially all its newly originated one-to-four family owner-occupied loans into the secondary market.
Quaint Oak Bancorp, Inc.
Management’s Discussion and Analysis of Financial Condition and Results of Operations
The following table summarizes the industry concentrations within the multi-family and commercial real estate portfolios:
| December 31, |
||||||||
| 2025 |
2024 |
|||||||
| (in Thousands) |
||||||||
| Real Estate Rental and Leasing |
$ | 126,316 | $ | 135,874 | ||||
| Health Care and Social Assistance |
37,681 | 35,864 | ||||||
| Accommodation and food services |
33,665 | 33,811 | ||||||
| Construction |
28,131 | 25,087 | ||||||
| Manufacturing |
22,404 | 16,515 | ||||||
| Other services (except public administration) |
21,558 | 21,321 | ||||||
| Retail trade |
16,340 | 24,657 | ||||||
| Arts, entertainment, and recreation |
14,354 | 14,497 | ||||||
| Wholesale trade |
14,166 | 8,349 | ||||||
| Administrative and Support and Waste Services |
9,516 | 4,703 | ||||||
| Finance and insurance |
9,106 | 6,162 | ||||||
| Professional, scientific and technical services |
7,297 | 5,686 | ||||||
| Transportation and warehousing |
4,202 | 5,901 | ||||||
| Other |
5,781 | 4,612 | ||||||
| Total |
$ | 350,517 | $ | 343,039 | ||||
The commercial real estate and multi-family portfolio consists of 57% owner occupied commercial real estate loans and 43% of non-owner occupied commercial real estate loans as of December 31, 2025. The following table summarizes the non-owner occupied commercial real estate portfolio and the percent of total loans receivable, net.
| December 31, |
||||||||||||||||
| 2025 |
2024 |
|||||||||||||||
| Balance |
Percent of Total Loans Receivable, net |
Balance |
Percent of Total Loans Receivable, net |
|||||||||||||
| (Dollars in Thousands) |
||||||||||||||||
| Real estate rental and leasing |
$ | 115,747 | 21.4 | % | $ | 123,103 | 23.0 | % | ||||||||
| Construction |
11,002 | 2.0 | 14,987 | 2.8 | ||||||||||||
| Health care and social assistance |
5,002 | 0.9 | 8,345 | 1.6 | ||||||||||||
| Finance and insurance |
4,792 | 0.9 | 4,948 | 0.9 | ||||||||||||
| Other services (except public administration) |
4,135 | 0.8 | 4,347 | 0.8 | ||||||||||||
| Arts, entertainment, and recreation |
3,069 | 0.6 | 72 | 0.0 | ||||||||||||
| Other |
6,110 | 1.1 | 5,986 | 1.2 | ||||||||||||
| Total |
$ | 149,857 | 27.7 | % | $ | 161,788 | 30.3 | % | ||||||||
Quaint Oak Bancorp, Inc.
Management’s Discussion and Analysis of Financial Condition and Results of Operations
The following table summarizes the commercial real estate rental and leasing non-owner occupied loan portfolio outstanding balance, total commitment and loan to value (“LTV”) ratio by geographic location:
| 2025 |
2024 |
|||||||||||||||||||||||
| Balance |
Total Commitment |
Weighted Average LTV |
Balance |
Total Commitment |
Weighted Average LTV |
|||||||||||||||||||
| (Dollars in Thousands) |
||||||||||||||||||||||||
| Pennsylvania (1) |
$ | 38,515 | $ | 78,601 | 49.0 | % | $ | 44,959 | $ | 86,035 | 52.3 | % | ||||||||||||
| Philadelphia |
36,598 | 76,095 | 48.1 | 36,142 | 77,810 | 46.4 | ||||||||||||||||||
| Delaware |
15,187 | 32,125 | 47.3 | 15,583 | 32,125 | 48.5 | ||||||||||||||||||
| New Jersey |
9,156 | 19,145 | 47.8 | 9,705 | 19,315 | 50.2 | ||||||||||||||||||
| Ohio |
6,719 | 10,100 | 66.5 | 6,914 | 10,100 | 68.5 | ||||||||||||||||||
| Other |
9,572 | 16,430 | 58.3 | 9,800 | 16,430 | 59.6 | ||||||||||||||||||
| Total |
$ | 115,747 | $ | 232,496 | 49.8 | % | $ | 123,103 | $ | 241,815 | 50.9 | % | ||||||||||||
| (1) |
Pennsylvania excluding Philadelphia. |
The following table summarizes the commercial real estate construction non-owner occupied loan portfolio outstanding balance, total commitment and LTV ratio by geographic location:
| 2025 |
2024 | |||||||||||||||||||||||
| Balance |
Total Commitment |
Weighted Average LTV |
Balance |
Total Commitment |
Weighted Average LTV |
|||||||||||||||||||
| (Dollars in Thousands) |
||||||||||||||||||||||||
| Pennsylvania (1) |
$ | 6,351 | $ | 11,567 | 54.9 | % | $ | 7,477 | $ | 13,996 | 53.4 | % | ||||||||||||
| Philadelphia |
4,651 | 9,685 | 48.0 | 4,782 | 9,685 | 49.4 | ||||||||||||||||||
| New Jersey |
- | - | - | 2,728 | 8,200 | 33.3 | ||||||||||||||||||
| Total |
$ | 11,002 | $ | 21,252 | 51.8 | % | $ | 14,987 | $ | 31,881 | 47.0 | % | ||||||||||||
| (1) |
Pennsylvania excluding Philadelphia. |
Investment in Federal Home Loan Bank Stock. The Company’s investment in Federal Home Loan Bank stock decreased $1.9 million, or 86.9%, from $2.2 million at December 31, 2024 to $291,000 at December 31, 2025 as the Bank decreased its level of FHLB borrowings.
Bank-Owned Life Insurance. The Company holds bank-owned life insurance (BOLI) as a mechanism for funding various employee benefit costs. The Company is the beneficiary of these policies that insure the lives of certain officers of its subsidiaries. The cash surrender value of the insurance policies amounted to $4.6 million and $4.4 million at December 31, 2025 and 2024, respectively.
Premises and Equipment, Net. Premises and equipment, net, decreased $86,000, or 5.3%, to $1.5 million at December 31, 2025 from $1.6 million at December 31, 2024.
Goodwill and Other Intangible, Net. The Bank recognized $2.1 million of goodwill as part of the acquisition of Oakmont Capital Holdings, LLC in January 2021. The Bank sold its 51% interest in OCH on March 29, 2024. See Note 3 – Discontinued Operations. Goodwill and other intangible assets, net of accumulated amortization, is also related to the acquisition by Quaint Oak Insurance Agency of the renewal rights to a book of business on August 1, 2016 at a total cost of $1.0 million, a portion of which is being amortized. The balance of other intangible assets at December 31, 2025 was $28,000, net of accumulated amortization of $457,000.
Other Real Estate Owned, Net. At December 31, 2025, other real estate owned (OREO) amounted to $360,000, consisting of one property that was collateral for a non-performing construction loan. There was no other real estate owned as of December 31, 2024.
Quaint Oak Bancorp, Inc.
Management’s Discussion and Analysis of Financial Condition and Results of Operations
Prepaid Expenses and Other Assets. Prepaid expenses and other assets decreased $27,000, or 0.3%, to $7.76 million at December 31, 2025 from $7.79 million at December 31, 2024.
Deposits. Total deposits increased $44.0 million, or 8.0%, to $597.3 million at December 31, 2025 from $553.3 million at December 31, 2024. This increase in deposits was primarily attributable to an increase of $71.8 million, or 25.4%, in certificates of deposit, an increase of $57.9 million, or 121.1%, in interest bearing checking accounts, an increase of $5.9 million, or 9.8%, in non-interest bearing checking accounts, and a $207,000, or 42.1%, increase in savings accounts. These increases in deposits were partially offset by a decrease of $91.8 million, or 56.6%, in money market accounts due to the discontinuation of a deposit placement agreement. The decrease in business checking deposits was a result of a strategic exit from a correspondent banking relationship. The increase in certificates of deposits was primarily due to the Bank’s competitive rate offerings in our market area.
Borrowings. Total Federal Home Loan Bank (FHLB) borrowings decreased $47.9 million, or 100.0%, to none at December 31, 2025 from $47.9 million at December 31, 2024 as the Bank paid down the $47.9 million of borrowings.
Senior Debt. Senior debt, net of unamortized debt issuance costs, increased $9.6 million from none at December 31, 2024 as the Company entered into a Senior Unsecured Note Purchase Agreement with certain institutional accredited investors pursuant to which the Company issued an aggregate of $9.75 million in aggregate principal amount of Fixed Rate Unsecured Senior Notes due March 1, 2028 (the “Senior Debt Notes”) in a private placement. The Company issued to an accredited individual investor an additional $250,000 in principal amount of the Senior Debt Notes as of March 4, 2025 for a total of $10.0 million in aggregate principal amount. The Senior Debt Notes bear interest at a fixed annual rate of 11.00%, payable semi-annually in arrears on March 1 and September 1 of each year, beginning September 1, 2025. The maturity date of the Senior Debt Notes is March 1, 2028.
Subordinated Debt. Subordinated debt, net of unamortized debt issuance costs, decreased $14.0 million, or 63.6%, to $8.0 million at December 31, 2025 from $22.0 million at December 31, 2024 as the Company used the net proceeds from the sale of the Senior Debt Notes to repay a portion of the outstanding $14.0 million aggregate principal amount of its 8.5% Fixed Rate Subordinated Notes upon their maturity on March 15, 2025. The remaining $8.0 million of subordinated debt matures on December 31, 2028.
Stockholders’ Equity. Total stockholders’ equity from continuing operations decreased $288,000, or 0.6%, to $52.3 million at December 31, 2025 from $52.6 million at December 31, 2024. Contributing to the decrease were dividends paid of $894,000, and purchase of treasury stock of $44,000. The decrease in stockholders’ equity was partially offset by net income for the year ended December 31, 2025 of $322,000, amortization of stock awards and options under our stock compensation plans of $251,000, the reissuance of treasury stock under the Bank’s 401(k) Plan of $74,000, and other comprehensive income, net of $3,000.
Quaint Oak Bancorp, Inc.
Management’s Discussion and Analysis of Financial Condition and Results of Operations
Comparison of Operating Results for the Years Ended December 31, 2025 and 2024
General. Net income amounted to $322,000 for the year ended December 31, 2025, a decrease of $2.5 million, or 88.5%, compared to net income of $2.8 million for the year ended December 31, 2024. The decrease in net income on a comparative year basis was primarily the result of a decrease in interest and dividend income of $2.8 million, an increase in non-interest expense of $2.2 million, a decrease in non-interest income of $997,000, and a decrease in net income from discontinued operations of $406,000, partially offset by a decrease in interest expense of $2.9 million, a decrease in the net provision for income taxes from continuing operations of $710,000, and a decrease in the provision for credit losses of $317,000.
Net Interest Income. Net interest income increased $86,000, or 0.5%, to $17.9 million for the year ended December 31, 2025 from $17.8 million for the year ended December 31, 2024. The increase in net interest income was driven by a $2.9 million, or 11.3%, decrease in interest expense, partially offset by a $2.8 million, or 6.5%, decrease in interest income.
Interest Expense. Interest expense decreased $2.9 million, or 11.3%, to $22.7 million for the year ended December 31, 2025 from $25.6 million for the year ended December 31, 2024. The decrease in interest expense was driven by a $4.2 million, or 18.0%, decrease in interest expense on deposits, which was primarily attributable to an $82.0 million decrease in the average balances of money market deposits which decreased from $211.0 million for the year ended December 31, 2024 to $129.0 million for the year ended December 31, 2025 and had the effect of decreasing interest expense by $3.6 million, and a 108 basis point decrease in average rate of money markets which decreased from 4.44% for the year ended December 31, 2024, to 3.36% for the year ended December 31, 2025. Also contributing to the decrease was a $39.0 million decrease in the average balances of business checking accounts which decreased from $93.3 million for the year ended December 31, 2024 to $54.3 million for the year ended December 31, 2025 and had the effect of decreasing interest expense by $1.8 million, and a 216 basis point decrease in the average yield on business checking accounts which decreased from 4.50% for the year ended December 31, 2024 to 2.34% for the year ended December 31, 2025 and had the effect of decreasing interest expense by $1.2 million. The decrease in average balances of interest-bearing deposits was a result of a strategic exit of a correspondent banking relationship for business checking deposits and reduction in a money market deposits through a deposit placement agreement. These decreases in interest expense were partially offset by $3.5 million increase in the interest expense on certificates of deposit due to an $85.5 million increase in the average balance of certificates of deposit which increased from $230.5 million for the year ended December 31, 2024 to $316.0 million for the year ended December 31, 2025. These decreases in interest expense were also partially offset by a $1.3 million, or 240.9% increase in the interest expense on Federal Home Loan Bank borrowings due to a $25.1 million, or 171.0%, increase in the average balance of Federal Home Loan Bank borrowings which increased from $14.6 million for the year ended December 31, 2024 to $39.7 million for the year ended December 31, 2025, and had the effect of increasing interest expense $941,000, and a 94 basis point increase on the rate on Federal Home Loan borrowings which increased from 3.74% for the year ended December 31, 2024, to 4.68% for the year ended December 31, 2025, and had the effect of increasing interest expense by $373,000. The $85.5 million increase in the average balance of certificates of deposits was primarily due to the Bank’s competitive rate offerings in our market area. The average interest rate spread increased from 1.84% for the year ended December 31, 2024 to 2.35% for the year ended December 31, 2025 while the net interest margin increased from 2.59% for the year ended December 31, 2024 to 2.83% for the year ended December 31, 2025.
Interest and Dividend Income. Interest and dividend income decreased $2.8 million, or 6.5%, to $40.6 million for the year ended December 31, 2025 from $43.4 million for the year ended December 31, 2024. The decrease in interest and dividend income for the year ended December 31, 2025 over the year ended December 31, 2024 was primarily driven by a decrease in the average balance of loans receivable, net, including loans held for sale, which decreased $23.8 million from $621.0 million for the year ended December 31, 2024 to $597.2 million for the year ended December 31, 2025 and had the effect of decreasing interest income $1.5 million. Also contributing to the decrease in interest and dividend income was a $29.6 million decrease in the average balance of due from banks – interest earning, which decreased from $61.9 million for the year ended December 31, 2024 to $32.3 million for the year ended December 31, 2025, and had the effect of decreasing interest income $1.5 million, and a 108 basis point decrease in the average yield on due from banks - interest earning from 4.96% for the year ended December 31, 2024 to 3.88% for the year ended December 31, 2025, and had the effect of decreasing interest income $348,000. Partially offsetting this decrease in interest and dividend income was a nine basis point increase in the average yield on loans receivable, net from 6.45% for the year ended December 31, 2024 to 6.54% for the year ended December 31, 2025, and had the effect of increasing interest income $518,000. The $29.6 million decrease in the average balance of due from banks – interest earning was due to a higher level of balances during 2024 due to proceeds from the sale of the Bank’s 51% ownership of Oakmont Capital Holdings, LLC on March 29, 2024.
Quaint Oak Bancorp, Inc.
Management’s Discussion and Analysis of Financial Condition and Results of Operations
Average Balances, Net Interest Income, Yields Earned and Rates Paid. The following table shows for the periods indicated the total dollar amount of interest from average interest-earning assets and the resulting yields, as well as the interest expense on average interest-bearing liabilities, expressed both in dollars and rates, and the net interest margin. All average balances are based on daily balances.
| Year Ended December 31, |
||||||||||||||||||||||||
| 2025 |
2024 |
|||||||||||||||||||||||
| Average Balance |
Interest |
Average Yield/ Rate |
Average Balance |
Interest |
Average Yield/ Rate |
|||||||||||||||||||
| (Dollars in thousands) |
||||||||||||||||||||||||
| Interest-earning assets: |
||||||||||||||||||||||||
| Due from banks, interest-earning |
$ | 32,328 | $ | 1,255 | 3.88 | % | $ | 61,901 | $ | 3,070 | 4.96 | % | ||||||||||||
| Investment in interest-earning time deposits |
912 | 52 | 5.70 | 1,034 | 44 | 4.26 | ||||||||||||||||||
| Investment securities available for sale |
1,292 | 125 | 9.67 | 2,042 | 152 | 7.44 | ||||||||||||||||||
| Loans receivable, net (1) (2) |
597,184 | 39,039 | 6.54 | 621,015 | 40,058 | 6.45 | ||||||||||||||||||
| Investment in FHLB stock |
1,996 | 158 | 7.92 | 968 | 113 | 11.67 | ||||||||||||||||||
| Total interest-earning assets |
633,712 | 40,629 | 6.41 | % | 686,960 | 43,437 | 6.32 | % | ||||||||||||||||
| Non-interest-earning assets |
19,156 | 17,148 | ||||||||||||||||||||||
| Total assets |
$ | 652,868 | $ | 704,108 | ||||||||||||||||||||
| Interest-bearing liabilities: |
||||||||||||||||||||||||
| Savings accounts |
$ | 632 | $ | 1 | 0.16 | % | $ | 730 | $ | 1 | 0.14 | % | ||||||||||||
| Money market accounts |
128,977 | 4,330 | 3.36 | 210,977 | 9,372 | 4.44 | ||||||||||||||||||
| Business checking accounts |
54,280 | 1,271 | 2.34 | 93,328 | 4,200 | 4.50 | ||||||||||||||||||
| Certificate of deposit accounts |
316,026 | 13,364 | 4.23 | 230,499 | 9,568 | 4.15 | ||||||||||||||||||
| Total deposits |
499,915 | 18,966 | 3.79 | 535,534 | 23,141 | 4.32 | ||||||||||||||||||
| FHLB borrowings |
39,720 | 1,858 | 4.68 | 14,564 | 545 | 3.74 | ||||||||||||||||||
| FRB borrowings |
12 | 1 | 8.33 | - | - | - | ||||||||||||||||||
| Senior debt |
9,586 | 947 | 9.88 | - | - | - | ||||||||||||||||||
| Subordinated debt |
10,615 | 954 | 8.99 | 21,997 | 1,934 | 8.79 | ||||||||||||||||||
| Total interest-bearing liabilities |
559,848 | 22,726 | 4.06 | % | 572,095 | 25,620 | 4.48 | % | ||||||||||||||||
| Non-interest-bearing liabilities |
40,795 | 81,436 | ||||||||||||||||||||||
| Total liabilities |
600,643 | 653,531 | ||||||||||||||||||||||
| Stockholders’ Equity |
52,225 | 50,577 | ||||||||||||||||||||||
| Total liabilities and Stockholders’ Equity |
$ | 652,868 | $ | 704,108 | ||||||||||||||||||||
| Net interest-earning assets |
$ | 73,864 | $ | 114,865 | ||||||||||||||||||||
| Net interest income; average interest rate spread |
$ | 17,903 | 2.35 | % | $ | 17,817 | 1.84 | % | ||||||||||||||||
| Net interest margin (3) |
2.83 | % | 2.59 | % | ||||||||||||||||||||
| Average interest-earning assets to average interest-bearing liabilities |
113.19 | % | 120.08 | % | ||||||||||||||||||||
___________________
| (1) |
Includes loans held for sale. |
| (2) |
Includes non-accrual loans during the respective periods. Calculated net of deferred fees and discounts, loans in process and allowance for credit losses. |
| (3) |
Equals net interest income divided by average interest-earning assets. |
Quaint Oak Bancorp, Inc.
Management’s Discussion and Analysis of Financial Condition and Results of Operations
Rate/Volume Analysis. The following table shows the extent to which changes in interest rates and changes in volume of interest-earning assets and interest-bearing liabilities affected our interest income and expense during the periods indicated. For each category of interest-earning assets and interest-bearing liabilities, information is provided on changes attributable to (1) changes in rate, which is the change in rate multiplied by prior year volume, (2) changes in volume, which is the change in volume multiplied by prior year rate, and (3) changes in rate/volume, which is the change in rate multiplied by the change in volume.
| 2025 vs. 2024 |
2024 vs. 2023 |
|||||||||||||||||||||||||||||||
| Increase (Decrease) Due to |
Total Increase (Decrease) |
Increase (Decrease) Due to |
Total Increase (Decrease) |
|||||||||||||||||||||||||||||
| Rate |
Volume |
Rate/ Volume |
Rate |
Volume |
Rate/ Volume |
|||||||||||||||||||||||||||
| (In Thousands) |
||||||||||||||||||||||||||||||||
| Interest income: |
||||||||||||||||||||||||||||||||
| Due from banks, interest-bearing |
$ | (666 | ) | $ | (1,466 | ) | $ | 318 | $ | (1,814 | ) | $ | 2,085 | $ | 484 | $ | 94 | $ | 2,663 | |||||||||||||
| Investment in interest-earning time deposits |
16 | (5 | ) | (2 | ) | 9 | (59 | ) | (5 | ) | 9 | (55 | ) | |||||||||||||||||||
| Investment securities available for sale |
45 | (55 | ) | (17 | ) | (27 | ) | (36 | ) | (12 | ) | 48 | - | |||||||||||||||||||
| Loans receivable, net (1) (2) |
538 | (1,536 | ) | (21 | ) | (1,019 | ) | (6,895 | ) | (587 | ) | 3,728 | (3,754 | ) | ||||||||||||||||||
| Investment in FHLB stock |
(38 | ) | 121 | (40 | ) | 43 | (365 | ) | (112 | ) | 139 | (338 | ) | |||||||||||||||||||
| Total interest-earning assets |
(105 | ) | (2,941 | ) | 238 | (2,808 | ) | (5,270 | ) | (232 | ) | 4,018 | (1,484 | ) | ||||||||||||||||||
| Interest expense: |
||||||||||||||||||||||||||||||||
| Savings |
- | - | - | - | - | (1 | ) | - | (1 | ) | ||||||||||||||||||||||
| Money market accounts |
(2,290 | ) | (3,644 | ) | 890 | (5,044 | ) | (62 | ) | (901 | ) | 665 | (298 | ) | ||||||||||||||||||
| Business checking accounts |
(2,015 | ) | (1,757 | ) | 843 | (2,929 | ) | (227 | ) | 2,190 | (259 | ) | 1,704 | |||||||||||||||||||
| Certificate of deposit accounts |
180 | 3,551 | 67 | 3,798 | 163 | 470 | 2,292 | 2,925 | ||||||||||||||||||||||||
| Total deposits |
(4,125 | ) | (1,850 | ) | 1,800 | (4,175 | ) | (126 | ) | 1,758 | 2,698 | 4,330 | ||||||||||||||||||||
| FHLB short-term borrowings |
136 | 941 | 236 | 1,313 | 133 | (4,753 | ) | (68 | ) | (4,688 | ) | |||||||||||||||||||||
| FRB short-term borrowings |
- | - | 1 | 1 | 34 | (34 | ) | (34 | ) | (34 | ) | |||||||||||||||||||||
| Senior debt |
- | - | 947 | 947 | - | - | - | - | ||||||||||||||||||||||||
| Subordinated debt |
42 | (1,001 | ) | (21 | ) | (980 | ) | 34 | 187 | 264 | 485 | |||||||||||||||||||||
| Total interest-bearing liabilities |
(3,947 | ) | (1,910 | ) | 2,963 | (2,894 | ) | 75 | (2,842 | ) | 2,860 | 93 | ||||||||||||||||||||
| Increase (decrease) in net interest Income |
$ | 3,842 | $ | (1,031 | ) | $ | (2,725 | ) | $ | 86 | $ | (5,345 | ) | $ | 2,610 | $ | 1,158 | $ | (1,577 | ) | ||||||||||||
_______________________
| (1) |
Includes loans held for sale. |
| (2) |
Includes non-accrual loans during the respective periods. Calculated net of deferred fees and discounts, loans in process and allowance for credit losses. |
Provision for Credit Losses. The $317,000, or 20.7%, decrease in the provision for credit losses for the year ended December 31, 2025 over the year ended December 31, 2024 was primarily due to a decrease in the commercial business loan category, and a decrease in charge-offs during the year ended December 31, 2025.
Non-performing loans at December 31, 2025 totaled $7.3 million, or 1.36%, of total loans receivable, net of allowance for credit losses, consisting of $5.8 million of loans on non-accrual status and $1.5 million of accruing loans 90-days or more delinquent. Non-accrual loans consist of two one-to-four family residential owner occupied loans, 14 commercial real estate loans, and 15 commercial business loans. Included in the 15 commercial business loans is one pool of equipment loans. Accruing loans 90-days or more past due include one one-to-four family residential owner occupied loan, one one-to-four family residential non-owner occupied loan, one commercial real estate loan, and one commercial business loan, all of which are still accruing. All non-performing loans are either well-collateralized or adequately reserved for. During the year ended December 31, 2025, one commercial real estate loan, and 11 commercial business loans totaling $1.6 million that were previously on non-accrual were charged-off through the allowance for credit losses. Non-performing loans at December 31, 2024 totaled $6.3 million, or 1.18%, of total loans receivable, net of allowance for credit losses, consisting of $5.6 million of loans on non-accrual status and $726,000 of accruing loans 90-days or more delinquent. Non-accrual loans consist of one one-to-four family residential owner occupied loan, four commercial real estate loans, and ten commercial business loans. Included in the ten commercial business loans is one pool of equipment loans. Loans 90-days or more past due include one one-to-four family residential owner occupied loan, two commercial real estate loans, and four commercial business loans, all of which are still accruing. All non-performing loans are either well-collateralized or adequately reserved for. During the year ended December 31, 2024, 19 commercial business loans totaling $1.6 million, and one construction loan of $187,000, that were previously on non-accrual were charged-off through the allowance for credit losses.
Quaint Oak Bancorp, Inc.
Management’s Discussion and Analysis of Financial Condition and Results of Operations
Non-Interest Income. Non-interest income decreased $997,000, or 12.2%, from $8.2 million for the year ended December 31, 2024 to $7.2 million for the year ended December 31, 2025. The decrease was primarily attributable to the $1.5 million gain on the sale and leaseback of the Company’s office building at 1710 Union Boulevard in Allentown, Pennsylvania in October, 2024, a $640,000, or 87.9%, decrease in other fees and service charges, and a $20,000, or 100.0%, decrease in real estate sales commissions, net. These decreases were partially offset by a $978,000, or 215.9%, increase in gain on sale of SBA loans, a $76,000, or 10.2%, increase in insurance commissions, a $38,000, or 4.2%, increase in mortgage banking, equipment lending and title abstract fees, and a $10,000, or 8.5%, increase in income from bank-owned life insurance. The increase in gain on sale of SBA loans was due to increased sales of SBA loans. The reduction in other fees and service charges is attributable to reduced correspondent banking activities.
Non-Interest Expense. Non-interest expense increased $2.2 million, or 10.4%, from $21.0 million for the year ended December 31, 2024 to $23.2 million for the year ended December 31, 2025. The increase in non-interest expense for the year ended December 31, 2025 over the comparable period in 2024 was primarily due to a $761,000, or 70.0%, increase in professional fees, a $522,000, or 3.6%, increase in salaries and employee benefits expense, a $462,000, or 35.6%, increase in data processing expense, a $381,000, or 26.9%, increase in occupancy and equipment expense, an $88,000, or 6.2%, increase in other expense, and a $62,000, or 30.8%, increase in directors’ fees and expenses. These increases were partially offset by an $84,000, or 13.7%, decrease in FDIC deposit insurance assessment, and an $8,000, or 2.6%, decrease in advertising expense. The increase in salaries and employee benefits expense, professional fees, occupancy and equipment expense, data processing expense, and other expense was primarily due to the implementation of international correspondent banking software and compliance related activities and expense.
Provision for Income Tax. The provision for income tax from continuing operations decreased $710,000, or 68.8%, from $1.0 million for the year ended December 31, 2024 to $322,000 for the year ended December 31, 2025 due primarily to a decrease in pre-tax income.
Operating Segments
The Company’s operations consist of two reportable operating segments: Banking and Oakmont Commercial. Our Banking Segment generates revenues primarily from its lending, deposit gathering and fee business activities. Our Oakmont Commercial Segment originates commercial real estate loans which are sold into the secondary market along with the loans’ servicing rights. The profitability of this segment’s operations depends primarily on the gains realized from the sale of loans, processing fees, and service fees. Detailed segment information appears in Note 21 in the Notes to Consolidated Financial Statements.
Quaint Oak Bancorp, Inc.
Management’s Discussion and Analysis of Financial Condition and Results of Operations
Our Banking Segment reported a pre-tax segment loss for the year ended December 31, 2025 of $(844,000), a $3.0 million, or 139.2%, decrease from the year ended December 31, 2024. This increase in pretax segment loss was due to a $2.3 million, or 11.7%, increase in non-interest expense, a $1.2 million, or 17.8%, decrease in non-interest income, and a $308,000, or 1.8%, decrease in net interest income, partially offset by a $752,000, or 38.2%, decrease in the provision for credit losses. The decrease in non-interest income was primarily due to a $1.5 million gain on the sale-leaseback of 1710 Union Boulevard in October 2024, and a $604,000, or 101.9%, decrease in other fees and service charges, partially offset by a $978,000, or 215.9%, increase in gain on the sale of SBA loans.
The increase in non-interest expense was due primarily to a $703,000, or 69.9%, increase in professional fees, a $687,000, or 5.2%, increase in salaries and benefits expense, a $462,000, or 35.6%, increase in data processing expense, a $378,000, or 26.7%, increase in occupancy and equipment expense, and an $83,000, or 6.0%, increase in other expense, partially offset by an $84,000, or 13.7%, decrease in FDIC deposit insurance assessment.
Quaint Oak Bancorp, Inc.
Management’s Discussion and Analysis of Financial Condition and Results of Operations
Our Oakmont Commercial Segment reported a pre-tax segment profit (“PTSP”) for the year ended December 31, 2025 of $1.5 million, a $218,000, or 17.2%, increase from the year ended December 31, 2024. The increase in PTSP was primarily due to a $394,000, or 51.0%, increase in net interest income, a $159,000, or 9.7%, increase in non-interest income, and a $100,000, or 6.3%, decrease in non-interest expense, partially offset by a $435,000, or 100.0%, increase in the recovery of credit losses. The increase in non-interest income was due to a $195,000, or 12.9%, increase in net gain on loans held for sale, partially offset by a $36,000, or 26.7%, decrease in other fees and services charges. The decrease in non-interest expense was primarily due to a $165,000, or 11.5%, decrease in salaries and employee benefits expense, partially offset by a $58,000, or 71.6%, increase in professional fees, a $5,000, or 13.5%, increase in other expenses, and a $3,000, or 100.0%, increase in occupancy and equipment expense.
Exposure to Changes in Interest Rates
The Company’s ability to maintain net interest income depends upon its ability to earn a higher yield on assets than the rates it pays on deposits and borrowings. The Company’s interest-earning assets consist primarily of loans collateralized by real estate which have longer maturities than our liabilities, consisting primarily of certificates of deposit, money market accounts, checking accounts, and to a lesser extent borrowings. Consequently, the Company’s ability to maintain a positive spread between the interest earned on assets and the interest paid on deposits and borrowings can be adversely affected by the movement of market rates of interest.
Gap Analysis. The matching of assets and liabilities may be analyzed by examining the extent to which such assets and liabilities are "interest rate sensitive" and by monitoring the Bank's interest rate sensitivity "gap." An asset or liability is said to be interest rate sensitive within a specific time period if it will mature or reprice within that time period. The interest rate sensitivity gap is defined as the difference between the amount of interest-earning assets maturing or repricing within a specific time period and the amount of interest-bearing liabilities maturing or repricing within that same time period. A gap is considered positive when the amount of interest rate sensitive assets exceeds the amount of interest rate-sensitive liabilities. A gap is considered negative when the amount of interest rate sensitive liabilities exceeds the amount of interest rate sensitive assets. During a period of rising interest rates, a negative gap would tend to affect adversely net interest income while a positive gap would tend to result in an increase in net interest income. Conversely, during a period of falling interest rates, a negative gap would tend to result in an increase in net interest income while a positive gap would tend to affect adversely net interest income.
The table below sets forth the amounts of our interest-earning assets and interest-bearing liabilities outstanding at December 31, 2025, which we expect, based upon certain assumptions, to reprice or mature in each of the future time periods shown (the "GAP Table"). Except as stated below, the amounts of assets and liabilities shown which reprice or mature during a particular period were determined in accordance with the earlier of term to repricing or the contractual maturity of the asset or liability. The table sets forth an approximation of the projected repricing of assets and liabilities at December 31, 2025, on the basis of contractual maturities, anticipated prepayments, and scheduled rate adjustments period and subsequent selected time intervals. The loan amounts in the table reflect principal balances expected to be redeployed and/or repriced as a result of contractual amortization and anticipated prepayments of adjustable-rate loans and fixed-rate loans, and as a result of contractual rate adjustments on adjustable-rate loans.
Certain shortcomings are inherent in the method of analysis presented in the following table. For example, although certain assets and liabilities may have similar maturities or periods to repricing, they may react in different degrees to changes in market interest rates. Also, the interest rates on certain types of assets and liabilities may fluctuate in advance of changes in market interest rates, while interest rates on other types may lag behind changes in market rates. Additionally, certain assets, such as adjustable-rate loans, have features which restrict changes in interest rates both on a short-term basis and over the life of the asset. Further, in the event of a change in interest rates, prepayment and early withdrawal levels would likely deviate significantly from those assumed in calculating the table. Finally, the ability of many borrowers to service their adjustable-rate loans may decrease in the event of an interest rate increase.
Quaint Oak Bancorp, Inc.
Management’s Discussion and Analysis of Financial Condition and Results of Operations
| 3 Months or Less |
More than 3 Months to 1 Year |
More than 1 Year to 3 Years |
More than 3 Years to 5 Years |
More than 5 Years |
Total Amount |
|||||||||||||||||||
| (Dollars In Thousands) |
||||||||||||||||||||||||
| Interest-earning assets (1): |
||||||||||||||||||||||||
| Due from banks, interest-bearing |
$ | 51,569 | $ | - | $ | - | $ | - | $ | - | $ | 51,569 | ||||||||||||
| Investment in interest-earning time deposits |
- | - | 912 | - | - | 912 | ||||||||||||||||||
| Investment securities available for sale |
882 | - | - | - | - | 882 | ||||||||||||||||||
| Loans held for sale |
60,956 | - | - | - | - | 60,956 | ||||||||||||||||||
| Loans receivable (2) |
141,544 | 152,714 | 145,788 | 42,778 | 57,874 | 540,698 | ||||||||||||||||||
| Investment in Federal Home Loan Bank stock |
- | - | - | - | 291 | 291 | ||||||||||||||||||
| Total interest-earning assets |
$ | 254,951 | $ | 152,714 | $ | 146,700 | $ | 42,778 | $ | 58,165 | $ | 655,308 | ||||||||||||
| Interest-bearing liabilities: |
||||||||||||||||||||||||
| Checking accounts |
$ | 105,713 | $ | - | $ | - | $ | - | $ | - | $ | 105,713 | ||||||||||||
| Money market and savings accounts |
13,044 | - | 58,138 | - | - | 71,182 | ||||||||||||||||||
| Certificate accounts |
51,805 | 193,324 | 90,750 | 18,839 | - | 354,718 | ||||||||||||||||||
| Senior debt |
- | - | 9,619 | - | - | 9,619 | ||||||||||||||||||
| Subordinated debt |
- | - | 8,000 | - | - | 8,000 | ||||||||||||||||||
| Total interest-bearing liabilities |
$ | 170,562 | $ | 193,324 | $ | 166,507 | $ | 18,839 | $ | - | $ | 549,232 | ||||||||||||
| Interest-earning assets less interest-bearing liabilities |
$ | 84,389 | $ | (40,610 | ) | $ | (19,807 | ) | $ | 23,939 | $ | 58,165 | ||||||||||||
| Cumulative interest-rate sensitivity gap (3) |
$ | 84,389 | $ | 43,779 | $ | 23,972 | $ | 47,911 | $ | 106,076 | ||||||||||||||
| Cumulative interest-rate gap as a percentage of total assets at December 31, 2025 |
12.5 | % | 6.5 | % | 3.5 | % | 7.1 | % | 15.7 | % | ||||||||||||||
| Cumulative interest-earning assets as a percentage of cumulative interest-bearing liabilities at December 31, 2025 |
149.5 | % | 112.0 | % | 104.5 | % | 108.7 | % | 119.3 | % | ||||||||||||||
_____________________
| (1) |
Interest-earning assets are included in the period in which the balances are expected to be redeployed and/or repriced as a result of anticipated prepayments, scheduled rate adjustments and contractual maturities. |
| (2) |
For purposes of the gap analysis, loans receivable includes non-performing loans gross of the allowance for credit losses and deferred loan fees. |
| (3) |
Interest-rate sensitivity gap represents the difference between net interest-earning assets and interest-bearing liabilities. |
Qualitative Analysis. Our ability to maintain a positive “spread” between the interest earned on assets and the interest paid on deposits and borrowings is affected by changes in interest rates. The Company’s fixed-rate loans generally are profitable if interest rates are stable or declining since these loans have yields that exceed its cost of funds. If interest rates increase, however, the Company would have to pay more on its deposits and new borrowings, which would adversely affect its interest rate spread. In order to counter the potential effects of dramatic increases in market rates of interest, the Company intends to continue to originate more variable rate loans and increase core deposits. The Company also intends to continue to place a greater emphasis on commercial business loans.
Liquidity and Capital Resources
The Company’s primary sources of funds are deposits, amortization and prepayment of loans and to a lesser extent, loan sales and other funds provided from operations. While scheduled principal and interest payments on loans are a relatively predictable source of funds, deposit flows and loan prepayments are greatly influenced by general interest rates, economic conditions and competition. The Company sets the interest rates on its deposits to maintain a desired level of total deposits. In addition, the Company invests excess funds in short-term interest-earning assets that provide additional liquidity. At December 31, 2025, the Company’s cash and cash equivalents amounted to $53.5 million. At such date, the Company also had no investment in interest-earning time deposits maturing in one year or less.
The Company uses its liquidity to fund existing and future loan commitments, to fund deposit outflows, to invest in other interest-earning assets, and to meet operating expenses.
Quaint Oak Bancorp, Inc.
Management’s Discussion and Analysis of Financial Condition and Results of Operations
At December 31, 2025, certificates of deposit scheduled to mature in one year or less totaled $245.4 million. Based on prior experience, management believes that a significant portion of such deposits will remain with us, although there can be no assurance that this will be the case.
In addition to cash flow from loan payments and prepayments and deposits, the Company has a significant borrowing capacity available to fund liquidity needs. If the Company requires funds beyond its ability to generate them internally, borrowing agreements exist with the Federal Home Loan Bank of Pittsburgh (FHLB), which provide an additional source of funds. As of December 31, 2025, the Company had no outstanding borrowings from the FHLB and had $269.3 million in borrowing capacity. Under terms of the collateral agreement with the FHLB of Pittsburgh, we pledge residential mortgage loans as well as Quaint Oak Bank’s FHLB stock as collateral for such advances. In addition, as of December 31, 2025 Quaint Oak Bank had $24.2 million in borrowing capacity with the Federal Reserve Bank of Philadelphia (FRB). The Company had no outstanding FRB borrowings as of December 31, 2025.
Total stockholders’ equity from continuing operations decreased $288,000, or 0.6%, to $52.3 million at December 31, 2025 from $52.6 million at December 31, 2024. Contributing to the decrease were dividends paid of $894,000, and purchase of treasury stock of $44,000. The decrease in stockholders’ equity was partially offset by net income for the year ended December 31, 2025 of $322,000, amortization of stock awards and options under our stock compensation plans of $251,000, the reissuance of treasury stock under the Bank’s 401(k) Plan of $74,000, and other comprehensive income, net of $3,000.
Quaint Oak Bank is required to maintain regulatory capital sufficient to meet tier 1 leverage, common equity tier 1 capital, tier 1 risk-based and total risk-based capital ratios of at least 4.00%, 4.50%, 6.00%, and 8.00%, respectively. At December 31, 2025, Quaint Oak Bank exceeded each of its capital requirements with ratios of 10.26%, 12.36%, 12.36% and 13.55%, respectively. As a small savings and loan holding company, the Company is not currently subject to any regulatory capital requirements. For further discussion of the Bank’s regulatory capital requirements, see Note 19 in the Notes to Consolidated Financial Statements contained elsewhere herein.
Off-Balance Sheet Arrangements
In the normal course of operations, we engage in a variety of financial transactions that, in accordance with generally accepted accounting principles, are not recorded in our financial statements. These transactions involve, to varying degrees, elements of credit, interest rate, and liquidity risk. Such transactions are used primarily to manage customers’ requests for funding and take the form of loan commitments and lines of credit. Our exposure to credit loss from non-performance by the other party to the above-mentioned financial instruments is represented by the contractual amount of those instruments. We use the same credit policies in making commitments and conditional obligations as we do for on-balance sheet instruments. In general, we do not require collateral or other security to support financial instruments with off–balance sheet credit risk.
Commitments. At December 31, 2025, we had unfunded commitments under lines of credit of $45.4 million, $21.1 million of commitments to originate loans, and $1.1 million under standby letters of credit. We had no commitments to advance additional amounts pursuant to outstanding lines of credit or undisbursed construction loans.
Quaint Oak Bancorp, Inc.
Management’s Discussion and Analysis of Financial Condition and Results of Operations
Contractual Cash Obligations
The following table summarizes our contractual cash obligations at December 31, 2025. The balances in the table do not reflect interest due on these obligations.
| Payments Due by Period |
||||||||||||||||||||
| Total |
To 1 Year |
1-3 Years |
4-5 Years |
After 5 Years |
||||||||||||||||
| (In Thousands) |
||||||||||||||||||||
| Operating leases |
$ | 6,344 | $ | 492 | $ | 841 | $ | 839 | $ | 4,172 | ||||||||||
| Certificates of deposit |
354,718 | 245,378 | 105,344 | 3,996 | - | |||||||||||||||
| Total contractual obligations |
$ | 361,062 | $ | 245,870 | $ | 106,185 | $ | 4,835 | $ | 4,172 | ||||||||||
Impact of Inflation and Changing Prices
The consolidated financial statements and related financial data presented herein have been prepared in accordance with accounting principles generally accepted in the United States of America which generally require the measurement of financial position and operating results in terms of historical dollars, without considering changes in relative purchasing power over time due to inflation. Unlike most industrial companies, virtually all of the Company’s assets and liabilities are monetary in nature. As a result, interest rates generally have a more significant impact on the Company’s performance than does the effect of inflation. Interest rates do not necessarily move in the same direction or in the same magnitude as the prices of goods and services, since such prices are affected by inflation to a larger extent than interest rates.
Quaint Oak Bancorp, Inc.

REPORT OF INDEPENDENT REGISTERED PUBLIC ACCOUNTING FIRM
To the Stockholders and the Board of Directors of Quaint Oak Bancorp, Inc.
Opinion on the Financial Statements
We have audited the accompanying consolidated balance sheets of Quaint Oak Bancorp, Inc. and subsidiary (the “Company”) as of December 31, 2025 and 2024; the related consolidated statements of income, comprehensive income, stockholders’ equity, and cash flows for the years then ended; and the related notes to the consolidated financial statements (collectively, the financial statements). In our opinion, the financial statements present fairly, in all material respects, the financial position of the Company as of December 31, 2025 and 2024, and the results of its operations and its cash flows for the years then ended, in conformity with accounting principles generally accepted in the United States of America.
Basis for Opinion
These financial statements are the responsibility of the Company’s management. Our responsibility is to express an opinion on the Company’s financial statements based on our audits. We are a public accounting firm registered with the Public Company Accounting Oversight Board (United States) (PCAOB) and are required to be independent, with respect to the Company, in accordance with U.S. federal securities laws and the applicable rules and regulations of the Securities and Exchange Commission and the PCAOB.
We conducted our audits in accordance with the standards of the PCAOB. Those standards require that we plan and perform the audit to obtain reasonable assurance about whether the financial statements are free of material misstatement, whether due to error or fraud. The Company is not required to have, nor were we engaged to perform, an audit of its internal control over financial reporting. As part of our audits, we are required to obtain an understanding of internal control over financial reporting but not for the purpose of expressing an opinion on the effectiveness of the Company’s internal control over financial reporting. Accordingly, we express no such opinion.
Our audits included performing procedures to assess the risks of material misstatement of the financial statements, whether due to error or fraud, and performing procedures that respond to those risks. Such procedures included examining, on a test basis, evidence regarding the amounts and disclosures in the financial statements. Our audits also included evaluating the accounting principles used and significant estimates made by management, as well as evaluating the overall presentation of the financial statements. We believe that our audits provide a reasonable basis for our opinion.
| PITTSBURGH, PA |
PHILADELPHIA, PA |
WHEELING, WV |
STEUBENVILLE, OH |
| 2009 Mackenzie Way • Suite 340 |
161 Washington Street • Suite 200 |
980 National Road |
511 N. Fourth Street |
| Cranberry Township, PA 16066 |
Conshohocken, PA 19428 |
Wheeling, WV 26003 |
Steubenville, OH 43952 |
| (724) 934-0344 |
(610) 278-9800 |
(304) 233-5030 |
(304) 233-5030 |
S.R. Snodgrass, P.C. d/b/a S.R. Snodgrass, A.C. in West Virginia
Quaint Oak Bancorp, Inc.

Critical Audit Matters
The critical audit matters communicated below are matters arising from the current period audit of the financial statements that were communicated or required to be communicated to the Audit Committee and that: (1) relate to accounts or disclosures that are material to the financial statements; and (2) involve our especially challenging, subjective, or complex judgments. The communication of critical audit matters does not alter, in any way, our opinion on the financial statements, taken as a whole, and we are not, by communicating the critical audit matters below, providing separate opinions on the critical audit matters or on the accounts or disclosures to which they relate.
Allowance for Credit Losses (ACL) – Qualitative Factor
The Company’s loan portfolio totaled $546.9 million as of December 31, 2025, and the associated ACL was $6.2 million. As discussed in Note 1 to the consolidated financial statements, determining the amount of the ACL requires significant judgment about the expected future losses, which is based on establishing portfolio segments utilizing inherent risk characteristics to capture baseline historical lifetime loss rates using a weighted average maturity method (WARM) for each segment. The loans in each individual segment are tracked over their remaining lives for loss and recovery events to identify events impacting losses and quantifying the impact of changing current and forecasted environment, both internal and external, that are different from the conditions that existed during the baseline historical loss calculation period. Management applies these qualitative adjustments to the baseline lifetime loss rate to reflect changes in the current and forecasted environment, both internal and external, that are different from the conditions that existed during the historical loss calculation period.
We identified these qualitative adjustments within the ACL as critical audit matters because they involve a high degree of subjectivity. While the determination of these qualitative adjustments includes analysis of observable data over the historical loss period, the judgments required to assess the directionality and magnitude of adjustments are highly subjective. Auditing these complex judgments and assumptions involved especially challenging auditor judgment due to the nature of audit evidence and the nature and extent of effort required to address these matters.
The primary procedures we performed to address this critical audit matter included:
| ● |
Testing the design, implementation, and operating effectiveness of internal controls over the calculation of the allowance for credit losses, including the qualitative factor adjustments. |
| ● |
Testing the completeness and accuracy of the significant data points that management uses in their evaluation of the qualitative adjustments. |
| ● |
Testing the anchoring calculation that management completes to properly align the magnitude of the adjustments with the Company’s historical loss data. |
| ● |
Evaluating the directional consistency and reasonableness of management’s conclusions regarding basis points applied (whether positive or negative) based on the trends identified in the underlying data. |
| ● |
Testing the mathematical accuracy of the application of the qualitative adjustments to the loan segments within the ACL calculation. |
We have served as the Company’s auditor since 2013.

Cranberry Township, Pennsylvania
March 27, 2026
Quaint Oak Bancorp, Inc.
| At December 31, | ||||||||
| 2025 | 2024 | |||||||
|
| (In thousands, except share and per share data) | |||||||
| Assets | ||||||||
| Due from banks, non-interest-bearing | $ | $ | ||||||
| Due from banks, interest-bearing | ||||||||
| Cash and cash equivalents | ||||||||
| Investment in interest-earning time deposits | ||||||||
| Investment securities available for sale | ||||||||
| Loans held for sale | ||||||||
| Loans receivable, net of allowance for credit losses (2025 $; 2024 $) | ||||||||
| Accrued interest receivable | ||||||||
| Investment in Federal Home Loan Bank stock, at cost | ||||||||
| Bank-owned life insurance | ||||||||
| Premises and equipment, net | ||||||||
| Goodwill | ||||||||
| Other intangible, net of accumulated amortization | ||||||||
| Other real estate owned, net | ||||||||
| Prepaid expenses and other assets | ||||||||
| Total Assets | $ | $ | ||||||
| Liabilities and Stockholders’ Equity | ||||||||
| Liabilities | ||||||||
| Deposits: | ||||||||
| Non-interest bearing | $ | $ | ||||||
| Interest-bearing | ||||||||
| Total deposits | ||||||||
| Federal Home Loan Bank borrowings | ||||||||
| Senior debt, net of amortized costs | ||||||||
| Subordinated debt | ||||||||
| Accrued interest payable | ||||||||
| Advances from borrowers for taxes and insurance | ||||||||
| Accrued expenses and other liabilities | ||||||||
| Total Liabilities | ||||||||
| Stockholders’ Equity | ||||||||
| Preferred stock – $ par value, shares authorized; issued or outstanding | ||||||||
| Common stock – $ par value; shares authorized; issued as of both December 31, 2025 and 2024; and outstanding at December 31, 2025 and 2024, respectively | ||||||||
| Additional paid-in capital | ||||||||
| Treasury stock, at cost: and shares at and December 31, 2025 and 2024, respectively | ( | ) | ( | ) | ||||
| Accumulated other comprehensive income | ||||||||
| Retained earnings | ||||||||
| Total Stockholders’ Equity | ||||||||
| Total Liabilities and Stockholders’ Equity | $ | $ | ||||||
See accompanying notes to consolidated financial statements.
Quaint Oak Bancorp, Inc.
Consolidated Statements of Income
| Year Ended December 31, | ||||||||
| 2025 | 2024 | |||||||
| (In thousands, except share | ||||||||
| and per share data) | ||||||||
| Interest and Dividend Income | ||||||||
| Interest on loans, including fees | $ | $ | ||||||
| Interest and dividends on investment securities, interest-bearing deposits with others, and Federal Home Loan Bank stock | ||||||||
| Total Interest and Dividend Income | ||||||||
| Interest Expense | ||||||||
| Interest on deposits | ||||||||
| Interest on Federal Home Loan Bank borrowings | ||||||||
| Interest on Federal Reserve Bank borrowings | ||||||||
| Interest on senior debt | ||||||||
| Interest on subordinated debt | ||||||||
| Total Interest Expense | ||||||||
| Net Interest Income | ||||||||
| Provision for Credit Losses | ||||||||
| Provision for Off-Balance Sheet Credit Exposures | ||||||||
| Total Provision for Credit Losses | ||||||||
| Net Interest Income after Provision for Credit Losses | ||||||||
| Non-Interest Income | ||||||||
| Mortgage banking, equipment lending and title abstract fees | ||||||||
| Real estate sales commissions, net | ||||||||
| Insurance commissions | ||||||||
| Other fees and services charges | ||||||||
| Income from bank-owned life insurance | ||||||||
| Net gain on loans held for sale | ||||||||
| Gain on the sale of SBA loans | ||||||||
| Gain on sale-leaseback transaction | ||||||||
| Total Non-Interest Income, net | ||||||||
| Non-Interest Expense | ||||||||
| Salaries and employee benefits | ||||||||
| Directors’ fees and expenses | ||||||||
| Occupancy and equipment | ||||||||
| Data processing | ||||||||
| Professional fees | ||||||||
| FDIC deposit insurance assessment | ||||||||
| Advertising | ||||||||
| Amortization of other intangible | ||||||||
| Other | ||||||||
| Total Non-Interest Expense | ||||||||
See accompanying notes to consolidated financial statements.
Quaint Oak Bancorp, Inc.
Consolidated Statements of Income (Continued)
| Year Ended December 31, | ||||||||
| 2025 | 2024 | |||||||
| (In thousands, except share and per share data) | ||||||||
| Income from continuing operations before income taxes | $ | $ | ||||||
| Income taxes from continuing operations | $ | $ | ||||||
| Net income from continuing operations | $ | $ | ||||||
| Income from discontinued operations | $ | $ | ||||||
| Income tax from discontinued operations | $ | $ | ||||||
| Net income from discontinued operations | $ | $ | ||||||
| Net income | $ | $ | ||||||
| Earnings per share from continuing operations – basic | $ | $ | ||||||
| Earnings per share from discontinued operations – basic | $ | $ | ||||||
| Earnings per share, net – basic | $ | $ | ||||||
| Average shares outstanding - basic | ||||||||
| Earnings per share from continuing operations - diluted | $ | $ | ||||||
| Earnings per share from discontinued operations - diluted | $ | $ | ||||||
| Earnings per share, net - diluted | $ | $ | ||||||
| Average shares outstanding - diluted | ||||||||
See accompanying notes to consolidated financial statements.
Quaint Oak Bancorp, Inc.
Consolidated Statements of Comprehensive Income
| Year Ended December 31, | ||||||||
| 2025 | 2024 | |||||||
| (In Thousands) | ||||||||
| Net Income from Continuing Operations | $ | $ | ||||||
| Other Comprehensive Income: | ||||||||
| Unrealized gains on investment securities available for sale | ||||||||
| Income tax effect | ( | ) | ( | ) | ||||
| Net other comprehensive income | ||||||||
| Total Comprehensive Income | $ | $ | ||||||
| Comprehensive Income from Discontinued Operations | $ | $ | ||||||
| Comprehensive Income Attributable to Quaint Oak Bancorp, Inc. | $ | $ | ||||||
See accompanying notes to consolidated financial statements.
Quaint Oak Bancorp, Inc.
Consolidated Statements of Stockholders’ Equity
| Number of Shares Outstanding | Amount | Additional Paid-in Capital | Treasury Stock | Accumulated Other Comprehensive Income (Loss) | Retained Earnings | Total Stockholders’ Equity | ||||||||||||||||||||||
| BALANCE – DECEMBER 31, 2023 | $ | $ | $ | ( | ) | $ | ( | ) | $ | $ | ||||||||||||||||||
| Issuance of stock for capital raise | ||||||||||||||||||||||||||||
| Treasury stock purchased | ( | ) | ( | ) | ( | ) | ||||||||||||||||||||||
| Reissuance of treasury stock under 401(k) Plan | ||||||||||||||||||||||||||||
| Reissuance of treasury stock under stock incentive plan | ( | ) | ||||||||||||||||||||||||||
| Stock based compensation expense | ||||||||||||||||||||||||||||
| Cash dividends declared ($ per share) | ( | ) | ( | ) | ||||||||||||||||||||||||
| Net income | ||||||||||||||||||||||||||||
| Other comprehensive income, net | ||||||||||||||||||||||||||||
| BALANCE –DECEMBER 31, 2024 | $ | $ | $ | ( | ) | $ | $ | $ | ||||||||||||||||||||
| Treasury stock purchased | ( | ) | ( | ) | ( | ) | ||||||||||||||||||||||
| Reissuance of treasury stock under 401(k) Plan | ||||||||||||||||||||||||||||
| Reissuance of treasury stock under stock incentive plan | ( | ) | - | |||||||||||||||||||||||||
| Stock based compensation expense | ||||||||||||||||||||||||||||
| Cash dividends declared ($ per share) | ( | ) | ( | ) | ||||||||||||||||||||||||
| Net income | ||||||||||||||||||||||||||||
| Other comprehensive income, net | ||||||||||||||||||||||||||||
| BALANCE –DECEMBER 31, 2025 | $ | $ | $ | ( | ) | $ | $ | $ | ||||||||||||||||||||
See accompanying notes to consolidated financial statements.
Quaint Oak Bancorp, Inc.
| Year Ended December 31, | ||||||||
| 2025 | 2024 | |||||||
| (In Thousands) | ||||||||
| Cash Flows from Operating Activities | ||||||||
| Net income from continuing operations | $ | $ | ||||||
| Net income from discontinued operations | ||||||||
| Net income | ||||||||
| Adjustments to reconcile net income to net cash provided by operating activities: | ||||||||
| Provision for credit losses | ||||||||
| Depreciation expense | ||||||||
| Amortization, net | ||||||||
| Accretion of deferred loan fees and costs, net | ( | ) | ( | ) | ||||
| Deferred income taxes | ||||||||
| Stock-based compensation expense | ||||||||
| Net gain on loans sold | ( | ) | ( | ) | ||||
| Loans held for sale-originations | ( | ) | ( | ) | ||||
| Loans held for sale-proceeds | ||||||||
| Gain on the sale of SBA loans | ( | ) | ( | ) | ||||
| Increase in the cash surrender value of bank-owned life insurance | ( | ) | ( | ) | ||||
| Gain on sale - leaseback transaction | ( | ) | ||||||
| Changes in assets and liabilities which provided (used) cash: | ||||||||
| Accrued interest receivable | ( | ) | ||||||
| Prepaid expenses and other assets | ( | ) | ( | ) | ||||
| Accrued interest payable | ||||||||
| Accrued expenses and other liabilities | ( | ) | ||||||
| Net Cash Provided by Operating Activities of Continuing Operations | ||||||||
| Net Cash Provided by Operating Activities of Discontinued Operations | ||||||||
| Net Cash Provided by Operating Activities | ||||||||
| Cash Flows from Investing Activities | ||||||||
| Redemption of interest-earning time deposits | ||||||||
| Principal repayments on investment securities available for sale | ||||||||
| Net (increase) decrease in loans receivable | ( | ) | ||||||
| Proceeds from the sale of Oakmont Capital Holdings, LLC | ||||||||
| Purchase of Federal Home Loan Bank stock | ( | ) | ( | ) | ||||
| Redemption of Federal Home Loan Bank stock | ||||||||
| Purchase of premises and equipment | ( | ) | ( | ) | ||||
| Sale of premises and equipment | ||||||||
| Net Cash (Used in) Provided by Investing Activities | ( | ) | ||||||
| Cash Flows from Financing Activities | ||||||||
| Net decrease in demand deposits, money markets, and savings accounts | ( | ) | ( | ) | ||||
| Net increase in certificate accounts | ||||||||
| Decrease in advances from borrowers for taxes and insurance | ( | ) | ( | ) | ||||
| (Repayment of) proceeds from Federal Home Loan Bank borrowings | ( | ) | ||||||
| Net proceeds from senior debt | ||||||||
| Net (repayment of) proceeds from subordinated debt | ( | ) | ||||||
| Proceeds from issuance of unallocated shares from authorized shares | ||||||||
| Purchase of treasury stock | ( | ) | ( | ) | ||||
| Proceeds from the reissuance of treasury stock under 401(k) plan | ||||||||
| Dividends paid | ( | ) | ( | ) | ||||
| Net Cash Used in Financing Activities | ( | ) | ( | ) | ||||
| Net (Decrease) Increase in Cash and Cash Equivalents | ( | ) | ||||||
| Cash and Cash Equivalents – Beginning of Year | ||||||||
| Cash and Cash Equivalents – End of Year | $ | $ | ||||||
See accompanying notes to consolidated financial statements.
Quaint Oak Bancorp, Inc.
| Year Ended December 31, | ||||||||
| 2025 | 2024 | |||||||
| (In Thousands) | ||||||||
| Supplementary Disclosure of Cash Flow and Non-Cash Information: | ||||||||
| Cash payments for interest | $ | $ | ||||||
| Cash payments for federal income taxes | $ | $ | ||||||
| Cash payments for state income taxes | $ | $ | ||||||
| Transfer of loans into other real estate owned | $ | $ | ||||||
| Initial recognition of operating lease right-of use assets | $ | $ | ||||||
| Initial recognition of operating lease obligations | $ | $ | ||||||
| Transfer of loans held for investment to loans held for sale | $ | ( | ) | $ | ( | ) | ||
| Net increase in loans receivable from transfer of loans held for investment to loans held for sale | $ | $ | ||||||
| Transfer of loans from Oakmont Capital Holdings, LLC | $ | $ | ||||||
See accompanying notes to consolidated financial statements.
Quaint Oak Bancorp, Inc.
Notes to Consolidated Financial Statements
Note 1 - Nature of Operations
The consolidated financial statements include the accounts of Quaint Oak Bancorp, Inc., a Pennsylvania chartered corporation (the “Company” or “Quaint Oak Bancorp”) and its wholly owned subsidiary, Quaint Oak Bank, a Pennsylvania chartered stock savings bank (the “Bank”), along with its wholly owned subsidiaries. At December 31, 2025, the Bank has wholly-owned subsidiaries, Quaint Oak Mortgage, LLC, Quaint Oak Abstract, LLC, QOB Properties, LLC, Quaint Oak Insurance Agency, LLC, and Oakmont Commercial, LLC, each a Pennsylvania limited liability company. Quaint Oak Mortgage offers mortgage banking in the Lehigh Valley, Delaware Valley and Philadelphia County regions of Pennsylvania. In February, 2019, Quaint Oak Mortgage opened a mortgage banking office in Philadelphia, Pennsylvania. Quaint Oak Abstract offers title abstract services primarily in the Lehigh Valley region of Pennsylvania and began operation in July 2009. QOB Properties, LLC began operations in July 2012 and holds Bank properties acquired through a foreclosure proceeding or acceptance of a deed in lieu of foreclosure. Quaint Oak Insurance Agency, LLC began operations in August 2016 and provides a broad range of personal and commercial insurance coverage solutions. Oakmont Commercial, LLC was formed in October 2021 and operates as a multi-state specialty commercial real estate financing company. On March 29, 2024, Quaint Oak Bank sold its
The Bank is subject to regulation by the Pennsylvania Department of Banking and Securities and the Federal Deposit Insurance Corporation. Pursuant to the Bank’s election under Section 10(l) of the Home Owners’ Loan Act, the Company is a savings and loan holding company regulated by the Board of Governors of the Federal Reserve System. The market area served by the Bank is principally Bucks, Montgomery and Philadelphia Counties in Pennsylvania and the Lehigh Valley area in Pennsylvania. The Bank has three regional offices located in the Delaware Valley, Lehigh Valley and Philadelphia markets. The principal deposit products offered by the Bank are money market accounts, certificates of deposit, non-interest bearing checking accounts for businesses and consumers, and savings accounts. The principal loan products offered by the Bank are fixed and adjustable rate residential and commercial mortgages, construction loans, commercial business loans, home equity loans, and lines of credit.
Note 2 - Summary of Significant Accounting Policies
Use of Estimates
The preparation of the financial statements in conformity with accounting principles generally accepted in the United States of America requires management to make estimates and assumptions that affect the reported amounts of assets and liabilities and disclosure of contingent assets and liabilities at the date of the financial statements and the reported amounts of income and expenses during the reporting period. Actual results could differ from those estimates. The Company’s most significant estimates are the determination of the allowance for credit losses and valuation of deferred tax assets.
Significant Group Concentrations of Credit Risk
The Bank has a significant concentration of loans in Philadelphia County, Pennsylvania. The concentration of credit by type of loan is set forth in Note 8. Although the Bank has a diversified loan portfolio, its debtors’ ability to honor their contracts is influenced by the region’s economy. During the year ended December 31, 2025,
Quaint Oak Bancorp, Inc.
Notes to Consolidated Financial Statements (Continued)
Note 2 - Summary of Significant Accounting Policies (Continued)
Cash and Cash Equivalents
For purposes of reporting cash flows, cash and cash equivalents include non-interest earning and interest-earning demand deposits and money market accounts with various financial institutions, all of which mature within ninety days of acquisition.
Investment Securities
Management determines the appropriate classification of debt securities at the time of purchase and reevaluates such designation as of each balance sheet date.
Securities classified as available for sale are those securities that the Company intends to hold for an indefinite period of time but not necessarily to maturity. Any decision to sell a security classified as available for sale would be based on various factors, including significant movement in interest rates, changes in maturity mix of the Company’s assets and liabilities, liquidity needs, regulatory capital requirements, and other similar factors. Securities available for sale are carried at fair value. Unrealized gains and losses are reported in other comprehensive income, net of related deferred tax effects. Realized gains and losses, determined on the basis of the cost of the specific securities sold, are included in earnings. Premiums and discounts are recognized in interest income using the interest method over the terms of the securities.
Securities classified as held to maturity are those debt securities the Company has both the intent and ability to hold to maturity regardless of the changes in market conditions, liquidity needs, or changes in general economic conditions. These securities are carried at cost adjusted for amortization of premium and accretion of discount, which are recognized in interest income using the interest method over the terms of the securities.
The Bank measures expected credit losses on available-for-sale debt securities when the Bank does not intend to sell, or when it is not more likely than not that it will be required to sell, the security before recovery of its amortized cost basis. If either of the criteria regarding intent or requirement to sell is met, the security's amortized cost basis is written down to fair value through income. For available-for-sale debt securities that do not meet the aforementioned criteria, the Bank evaluates whether the decline in fair value has resulted from credit losses or other factors. Any impairment that has not been recorded through an allowance for credit losses is recognized in other comprehensive income.
The allowance for credit losses on available-for-sale debt securities is included within Investment securities available for sale on the consolidated balance sheets. Changes in the allowance for credit losses are recorded within Provision for credit losses on the consolidated statements of income. Losses are charged against the allowance when the Bank believes the collectability of an available-for-sale security is in jeopardy or when either of the criteria regarding intent or requirement to sell is met.
Accrued interest receivable on available-for-sale debt securities totaled $
Quaint Oak Bancorp, Inc.
Notes to Consolidated Financial Statements (Continued)
Note 2 - Summary of Significant Accounting Policies (Continued)
Federal Home Loan Bank Stock
Federal law requires a member institution of the Federal Home Loan Bank (FHLB) system to hold restricted stock of its district Federal Home Loan Bank according to a predetermined formula. FHLB stock is carried at cost and evaluated for impairment. When evaluating FHLB stock for impairment, its value is determined based on the ultimate recoverability of the par value of the stock. We evaluate our holdings of FHLB stock for impairment each reporting period. impairment charges were recognized on FHLB stock during the years ended December 31, 2025 and 2024.
Loans Receivable
Loans receivable that management has the intent and ability to hold for the foreseeable future or until maturity or payoff are stated at their outstanding unpaid principal balances, net of an allowance for credit losses and any deferred fees. Interest income is accrued on the unpaid principal balance. Loan origination fees and costs are deferred and recognized as an adjustment of the yield (interest income) of the related loans. The Bank is generally amortizing these amounts over the contractual life of the loan.
The loans receivable portfolio is segmented into residential loans, commercial real estate loans, construction loans, commercial business, and consumer loans. The residential loan segment has two classes: one-to-four family residential owner occupied loans and one-to-four family residential non-owner occupied loans. The commercial real estate loan segment consists of the following classes: multi-family (five or more) residential, commercial real estate and commercial lines of credit. Construction loans are generally granted for the purpose of building a single residential home. Commercial business loans are loans to businesses primarily for purchase of business essential equipment. Business essential equipment is equipment necessary for a business to support or assist with the day-to-day operation or profitability of the business. The consumer loan segment consists of the following classes: home equity loans and other consumer loans. Included in the home equity class are home equity loans and home equity lines of credit. Included in the other consumer are loans secured by saving accounts.
Loans are stated at their principal amount outstanding, except for loans held for sale, which are carried at fair value. Interest income on loans is accrued as earned.
In general, loans are placed on non-accrual status once they become 90 days delinquent as to principal or interest. In certain cases, a loan may be placed on nonaccrual status prior to being 90 days delinquent if there is an indication that the borrower is having difficulty making payments, or the Company believes it is probable that all amounts will not be collected according to the contractual terms of the loan agreement. When interest accruals are discontinued, unpaid interest previously credited to income is reversed. Non-accrual loans may be restored to accrual status when all delinquent principal and interest has been paid currently for six consecutive months or the loan is considered secured and in the process of collection. The Company generally applies payments received on non-accruing loans to principal until such time as the principal is paid off, after which time any payments received are recognized as interest income. If the Company believes that all amounts outstanding on a non-accrual loan will ultimately be collected, payments received subsequent to its classification as a non-accrual loan are allocated between interest income and principal.
A loan that is 90 days delinquent may continue to accrue interest if the loan is both adequately secured and is in the process of collection. Past due status is determined based on contractual due dates for loan payments. An adequately secured loan is one that has collateral with a supported fair value that is sufficient to discharge the debt, and/or has an enforceable guarantee from a financially responsible party. A loan is considered to be in the process of collection if collection is proceeding through legal action or through other activities that are reasonably expected to result in repayment of the debt or restoration to current status in the near future.
Quaint Oak Bancorp, Inc.
Notes to Consolidated Financial Statements (Continued)
Note 2 - Summary of Significant Accounting Policies (Continued)
Loans Receivable (Continued)
Loans deemed to be a loss are written off through a charge against the allowance for credit losses (ACL). All loans are evaluated for possible charge-off when it is probable that the balance will not be collected, based on the ability of the borrower to pay and the value of the underlying collateral, if any. Principal recoveries of loans previously charged off are recorded as increases to the ACL.
Loan origination fees and the related direct origination costs are deferred and amortized over the life of the loan as an adjustment to interest income.
Allowance for Credit Losses
The allowance for credit losses is a valuation reserve established and maintained by charges against income and is deducted from the amortized cost basis of loans to present the net amount expected to be collected on the loans. Loans, or portions thereof, are charged off against the ACL when they are deemed uncollectible. Expected recoveries do not exceed the aggregate of amounts previously charged-off and expected to be charged-off.
The ACL is an estimate of expected credit losses, measured over the contractual life of a loan, that considers our historical loss experience, current conditions and forecasts of future economic conditions. Determination of an appropriate ACL is inherently subjective and may have significant changes from period to period.
The methodology for determining the ACL has two main components: evaluation of expected credit losses for certain groups of homogeneous loans that share similar risk characteristics and evaluation of loans that do not share risk characteristics with other loans.
The Company has elected to exclude accrued interest receivable from the measurement of its ACL. When a loan is placed on non-accrual status, any outstanding accrued interest is reversed against interest income. The accrued interest receivable was $
The ACL for loans is an estimate of the expected losses to be realized over the life of the loans in the portfolio. The ACL is determined for two distinct categories of loans: 1) loans evaluated collectively for expected credit losses and 2) loans evaluated individually for expected credit losses. The ACL also includes certain qualitative adjustments.
Loans Evaluated Collectively. Homogeneous loans are evaluated collectively for expected credit losses.
Portfolio segment is defined as the level at which an entity develops and documents a systematic methodology to determine its ACL. The Company has designated
Loans Evaluated Individually. Certain loans may be evaluated individually for expected credit losses.
Quaint Oak Bancorp, Inc.
Notes to Consolidated Financial Statements (Continued)
Note 2 - Summary of Significant Accounting Policies (Continued)
Allowance for Credit Losses (Continued)
Loans evaluated individually may have specific allocations assigned if the measured value of the loan using one of the noted techniques is less than its current carrying value. For loans measured using the fair value of collateral, if the analysis determines that sufficient collateral value would be available for repayment of the debt, then no allocations would be assigned to those loans. Collateral could be in the form of real estate or business assets, such as accounts receivable or inventory, in the case of commercial and industrial loans. Commercial and industrial loans may also be secured by real estate.
Management regularly reviews loans in the portfolio to assess credit quality indicators and to determine appropriate loan classification. For all loans, an internal risk rating process is used. The Company believes that internal risk ratings are the most relevant credit quality indicator for these types of loans. The migration of loans through the various internal risk rating categories is a significant component of the ACL methodology for these loans, which bases the probability of default on this migration. Assigning risk ratings involves judgment. Risk ratings may be changed based on ongoing monitoring procedures, or if specific loan review assessments identify a deterioration or an improvement in the loan.
The following is a summary of the Company's internal risk rating categories:
| • | Pass: These loans do not currently pose undue credit risk and can range from the highest to average quality, depending on the degree of potential risk. |
| • | Special Mention: These loans have a heightened credit risk, but not to the point of justifying a classification of Substandard. Loans in this category are currently acceptable but are nevertheless potentially weak. |
| • | Substandard: These loans are inadequately protected by current sound worth and paying capacity of the borrower. There exists a well-defined weakness or weaknesses that jeopardize the normal repayment of the debt. |
| • | Doubtful: These loans have all the weaknesses inherent in those classified as substandard, with the added characteristic that the weaknesses make collection or liquidation in full, on the basis of currently existing facts, conditions, and values, highly questionable and improbable. |
The allocation of the ACL is reviewed to evaluate its appropriateness in relation to the overall risk profile of the loan portfolio. The Company considers risk factors such as: local and national economic conditions; trends in delinquencies and non-accrual loans; the diversity of borrower industry types; and the composition of the portfolio by loan type.
Qualitative and Other Adjustments to Allowance for Credit Losses: In addition to the quantitative credit loss estimates for loans evaluated collectively, qualitative factors that may not be fully captured in the quantitative results are also evaluated. For example, the Company considers the impact of current environmental factors at the reporting date that did not exist over the period from which historical experience was used. Relevant factors include, but are not limited to, concentrations of credit risk (geographic, large borrower, and industry), economic trends and conditions, changes in underwriting standards, experience and depth of lending staff, trends in delinquencies, and the level of criticized loans. Qualitative adjustments are judgmental and are based on management’s knowledge of the portfolio and the markets in which the Company operates. Qualitative adjustments are evaluated and approved on a quarterly basis. Additionally, the ACL includes other allowance categories that are not directly incorporated in the quantitative results. These include but are not limited to loans-in-process, trade acceptances and overdrafts. The ACL model utilizes 36-month economic forecasts which include housing starts, real estate prices, loan delinquency trends, and US GDP changes.
Quaint Oak Bancorp, Inc.
Notes to Consolidated Financial Statements (Continued)
Note 2 - Summary of Significant Accounting Policies (Continued)
Allowance for Credit Losses (Continued)
Loans Held for Sale
Loans originated by the Bank’s mortgage banking subsidiary, Quaint Oak Mortgage, LLC, are intended for sale in the secondary market and are carried at the lower of cost or fair value. Gains and losses on loan sales (sales proceeds minus carrying value) are recorded in noninterest income, and direct loan origination costs, commissions and fees are deferred at origination of the loan and are recognized in noninterest income upon sale of the loan. Oakmont Capital Holdings, LLC originated commercial real estate loans for the purchase of business essential equipment for sale primarily to other financial institutions and these are also classified as loans held for sale.
Bank Owned Life Insurance (“BOLl”)
The Company purchases bank owned life insurance as a mechanism for funding various employee benefit costs. The Company is the beneficiary of these policies that insure the lives of certain officers of its subsidiaries. The Company has recognized the cash surrender value under the insurance policies as an asset in the Consolidated Balance Sheets. Changes in the cash surrender value are recorded in non-interest income in the Consolidated Statements of Income.
Premises and Equipment
Premises and equipment are stated at cost less accumulated depreciation. Depreciation is computed on the straight-line method over the expected useful lives of the related assets that range from to years. The costs of maintenance and repairs are expensed as incurred. Costs of major additions and improvements are capitalized.
Goodwill and Other Intangible Assets
Intangible assets on the consolidated balance sheets represent the acquisition by Quaint Oak Insurance Agency of the renewal rights to a book of business on August 1, 2016 at a total cost of $
The Company performs a goodwill and other intangible asset impairment analysis at least on an annual basis or more often if events and circumstances indicate that there may be impairment.
Other Real Estate Owned
Other real estate owned (OREO) or foreclosed assets are comprised of property acquired through a foreclosure proceeding or acceptance of a deed in lieu of foreclosure and loans classified as in-substance foreclosures. A loan is classified as in-substance foreclosure when the Bank has taken possession of the collateral regardless of whether formal foreclosure proceedings take place. Other real estate properties are initially recorded at fair value, net of estimated selling costs at the date of foreclosure, establishing a new cost basis. After foreclosure, valuations are periodically performed by management and the real estate is carried at the lower of cost or fair value less estimated costs to sell. Net revenue and expenses from operations and additions to the valuation allowance are included in other expenses.
The Company had
Quaint Oak Bancorp, Inc.
Notes to Consolidated Financial Statements (Continued)
Note 2 - Summary of Significant Accounting Policies (Continued)
Loan Servicing Rights
The Company sells the guaranteed portion of certain SBA loans to third parties and retains servicing rights and receives servicing fees. All such transfers are accounted for as sales. While the Company may retain a portion of certain sold SBA loans, its continuing involvement in the portion of the loan that was sold is limited to certain servicing responsibilities.
These servicing assets amortize in proportion to, and over the period of, the estimated future net servicing life of the underlying loans. The servicing assets are evaluated quarterly for impairment based upon the fair value of the rights as compared to their amortized cost. Impairment is recognized on the income statement to the extent that fair value is less than the capitalized amount of the servicing assets. Included in other assets are SBA servicing rights recognized as separate assets when the guaranteed portion of the SBA loans are sold and the servicing rights are retained. These capitalized SBA servicing rights are amortized into non-interest income in proportion to, and over the period of, the estimated future net servicing period of the underlying SBA loans. SBA servicing rights totaled $
Advertising Costs
The Company expenses all advertising costs as incurred. Advertising costs are included in non-interest expense on the Consolidated Statements of Income.
Transfers of Financial Assets
Transfers of financial assets are accounted for as sales, when control over the assets has been surrendered. Control over transferred assets is deemed to be surrendered when (1) the assets have been isolated from the Company, (2) the transferee obtains the right (free of conditions that constrain it from taking advantage of that right) to pledge or exchange the transferred assets, and (3) the Company does not maintain effective control over the transferred assets through an agreement to repurchase them before their maturity or the ability to unilaterally cause the holder to return specific assets.
Income Taxes
Deferred income taxes are provided on the liability method whereby deferred tax assets are recognized for deductible temporary differences and deferred tax liabilities are recognized for taxable temporary differences. Temporary differences are the differences between the reported amounts of assets and liabilities and their tax basis. Deferred tax assets are reduced by a valuation allowance when, in the opinion of management, it is more likely than not that some portion of the deferred tax assets will not be realized. Deferred tax assets and liabilities are adjusted for the effects of changes in tax laws and rates on the date of enactment.
The Company follows guidance related to accounting for uncertainty in income taxes, which sets out a consistent framework to determine the appropriate level of tax reserves to maintain for uncertain tax positions. A tax position is recognized as a benefit only if it is more likely than not that the tax position would be sustained in a tax examination, with a tax examination presumed to occur. The amount recognized is the largest amount of tax benefit that has more than 50 percent likelihood of being realized upon examination. For tax positions not meeting the more likely than not test, no tax benefit is recorded. The Company had
Quaint Oak Bancorp, Inc.
Notes to Consolidated Financial Statements (Continued)
Note 2 - Summary of Significant Accounting Policies (Continued)
Comprehensive Income
Accounting principles generally accepted in the United States of America require that recognized revenue, expenses, gains and losses be included in net income. Although certain changes in assets and liabilities, such as unrealized gains and losses on available for sale securities, are reported as a separate component of the stockholders’ equity section of the balance sheet, such items, along with net income, are components of comprehensive income.
Treasury Stock
The acquisition of treasury stock by the Company is recorded under the cost method. At the date of subsequent reissue, treasury stock is reduced by the cost of such stock based on an average cost method with any excess proceeds credited to additional paid-in capital.
Share-Based Compensation
Stock compensation accounting guidance requires that the compensation cost relating to share-based payment transactions be recognized in financial statements. That cost is measured based on the grant date fair value of the equity or liability instruments issued. The stock compensation accounting guidance covers a wide range of share-based compensation arrangements including stock option and restricted share plans.
The stock compensation accounting guidance requires that compensation cost for all stock awards be calculated and recognized over the employees’ service period, generally defined as the vesting period. For awards with graded-vesting, compensation cost is recognized on a straight-line basis over the requisite service period for the entire award. A Black-Scholes model is used to estimate the fair value of stock options, while the closing price of the Company’s common stock on the grant date is used for restricted stock awards.
At December 31, 2025, the Company has outstanding equity awards under two share-based plans: the 2018 Stock Incentive Plan, and the 2023 Stock Incentive Plan. Outstanding awards under these plans were made in May 2018 and May 2023. These plans are more fully described in Note 15.
The Company also has an employee stock ownership plan (“ESOP”). This plan is more fully described in Note 15. As shares are contributed to the ESOP and allocated among participants, the Company recognizes compensation expense equal to the average market price of the shares.
Earnings Per Share
Amounts reported in earnings per share reflect earnings available to common stockholders for the period divided by the weighted average number of shares of common stock outstanding during the period, exclusive of unearned ESOP shares, unvested restricted stock (RRP) shares and treasury shares. Stock options and unvested restricted stock are regarded as potential common stock and are considered in the diluted earnings per share calculations to the extent they would have a dilutive effect if converted to common stock, computed using the “treasury stock” method.
Revenue from Contracts with Customers
The Company records revenue from contracts with customers in accordance with Accounting Standards Codification Topic 606, “Revenue from Contracts with Customers” (“Topic 606”). Under Topic 606, the Company must identify the contract with a customer, identify the performance obligations in the contract, determine the transaction price, allocate the transaction price to the performance obligations in the contract, and recognize revenue when (or as) the Company satisfies a performance obligation. In certain circumstances, noninterest income is reported net of associated expenses.
Quaint Oak Bancorp, Inc.
Notes to Consolidated Financial Statements (Continued)
Note 2 - Summary of Significant Accounting Policies (Continued)
Revenue from Contracts with Customers (Continued)
The Company’s primary sources of revenue are derived from interest and dividends earned on loans and investment securities, mortgage banking revenue, including gains on the sale of loans, income from bank-owned life insurance, and other financial instruments that are not within the scope of Topic 606. The main types of non-interest income within the scope of the standard are as follows:
Other Fees and Service Charges: The Bank has contracts with its commercial checking deposit customers where fees are charged if the account balance falls below predetermined levels defined as compensating balances. These agreements can be cancelled at any time by either the Bank or the deposit customer. Revenue from these transactions is recognized on a monthly basis as the Bank has an unconditional right to the fee consideration. The Bank also has transaction fees related to specific transactions or activities resulting from customer request or activity that include overdraft fees, wire fees, and other transaction fees. All of these fees are attributable to specific performance obligations of the Bank where the revenue is recognized at a defined point in time, completion of the requested service/transaction.
Abstract Title Fees: The Bank provides abstract title services through its wholly owned subsidiary, Quaint Oak Abstract, LLC. Fees for these services are recognized as revenue immediately after the completion of the real estate settlement.
Real Estate Sales Commissions, Net: The Bank provided real estate sales services through its wholly owned subsidiary, Quaint Oak Real Estate, LLC. Commission income was earned for these services and recognized as revenue immediately after the completion of the real estate settlement. On March 29, 2024, the Company discontinued the operations of Quaint Oak Real Estate, LLC.
Insurance Commissions: Insurance income generally consists of commissions from the sale of insurance policies and performance-based commissions from insurance companies. The Bank recognizes commission income from the sale of insurance policies when its wholly owned subsidiary, Quaint Oak Insurance Agency, LLC, acts as an agent between the insurance carrier and policyholder, arranging for the insurance carrier to provide policies to policyholders, and acts on behalf of the insurance carrier by providing customer service to the policyholder during the policy period. Commission income is recognized over time, using the output method of time elapsed, which corresponds with the underlying insurance policy period, for which the Bank is obligated to perform under contract with the insurance carrier. Commission income is variable, as it is comprised of a certain percentage of the underlying policy premium. The Bank estimates the variable consideration based upon the “most likely amount” method and does not expect or anticipate a significant reversal of revenue in future periods, based upon historical experience. Payment is due from the insurance carrier for commission income once the insurance policy has been sold. The Bank has elected to apply a practical expedient related to capitalizable costs, which are the commissions paid to insurance producers, and will expense these commissions paid to insurance producers as incurred, as these costs are related to the commission income and would have been amortized within one year or less if they had been capitalized, the same period over which the commission income was earned. Performance-based commissions from insurance companies are recognized at a point in time, when received, and no contingencies remain.
Quaint Oak Bancorp, Inc.
Notes to Consolidated Financial Statements (Continued)
Note 2 - Summary of Significant Accounting Policies (Continued)
Off-Balance Sheet Financial Instruments
In the ordinary course of business, the Bank has entered into off-balance sheet financial instruments consisting of commitments to extend credit. Such financial instruments are recorded in the Consolidated Balance Sheets when they are funded.
The Bank estimates expected credit losses over the contractual period in which the Bank is exposed to credit risk via a contractual obligation to extend credit, unless that obligation is unconditionally cancellable by the Bank. The allowance for credit losses on off-balance sheet credit exposures is adjusted through credit loss expense. The estimate includes consideration of the likelihood that funding will occur and an estimate of expected credit losses on commitments expected to be funded over its estimated life.
Reclassifications
Certain items in the 2024 consolidated financial statements have been reclassified to conform to the presentation in the 2025 consolidated financial statements. Such reclassifications did not have a material impact on the overall consolidated financial statements.
Accounting Pronouncements Adopted
In December 2023, the FASB issued ASU 2023-09, Income Taxes (Topic 740): Improvements to Income Tax Disclosures, which provides for improvements to income tax disclosures primarily related to the rate reconciliation and income taxes paid information. This guidance is effective for public business entities for annual periods beginning after December 15, 2024. See Note 15 – Income Taxes.
Recent Accounting Pronouncements Not Yet Adopted
In November 2024, the FASB issued ASU 2024-03, Income Statement – Reporting Comprehensive Income – Expense Disaggregation Disclosures. This ASU requires disclosure in the notes to financial statements of specified information about certain costs and expenses. Specific disclosures are required for (a) purchases of inventory, (b) employee compensation, (c) depreciation, (d) intangible asset amortization, and (e) depreciation, depletion, and amortization recognized as part of oil and gas producing activities. The amendments in this Update do not change or remove current expense disclosure requirements. However, the amendments affect where this information appears in the notes to financial statements because entities are required to include certain current disclosures in the same tabular format disclosure as the other disaggregation requirements in the amendments. The amendments in ASU 2024-03 apply only to public business entities and are effective for fiscal years beginning after December 15, 2026, and interim reporting periods beginning after December 15, 2027, with early adoption permitted. The Company is currently evaluating the impact of this new guidance on its financial statements.
In January 2025, the FASB issued ASU 2025-01, Income Statement—Reporting Comprehensive Income—Expense Disaggregation Disclosures (Subtopic 220-40), which revises the effective date of ASU 2024-03 (on disclosures about disaggregation of income statement expenses) “to clarify that all public business entities are required to adopt the guidance in annual reporting periods beginning after December 15, 2026, and interim periods within annual reporting periods beginning after December 15, 2027.” Entities within the ASU’s scope are permitted to early adopt the ASU. The Company is currently evaluating the impact of this new guidance on its financial statements.
Quaint Oak Bancorp, Inc.
Notes to Consolidated Financial Statements (Continued)
Note 2 - Summary of Significant Accounting Policies (Continued)
Recent Accounting Pronouncements Not Yet Adopted (Continued)
In November 2025, the FASB issued ASU 2025-08, Financial Instruments – Credit Losses (Topic 326), which amends the guidance in Topic 326 to expand the population of acquired financial assets subject to the gross-up approach to include loans (excluding credit cards) that are acquired without credit deterioration and deemed “seasoned.” All non-purchased credit deteriorated loans (excluding credit cards) that are acquired in a business combination are deemed seasoned. Other non-purchased credit deteriorated loans (excluding credit cards) are considered to be seasoned if they were purchased at least 90 days after origination and the acquirer was not involved in the origination of the loans. ASU 2025-08 should be applied prospectively and is effective for annual reporting periods beginning after December 15, 2026, including interim reporting periods within those annual reporting periods. Early adoption is permitted. The Company is currently evaluating the impact of this new guidance on its financial statements.
In December 2025, the FASB issued ASU 2025-11, Interim Reporting (Topic 270): Narrow-Scope Improvements, to clarify interim disclosure requirements, the form and content of interim financial statements, and when ASC Topic 270 applies. The amendments in the ASU provide a list of specific interim disclosures that are required by generally accepted accounting principles (GAAP), which, together with the disclosure principle, represent the complete population of required disclosures in interim reporting periods. The intent of the disclosure principle is to help entities determine whether any disclosures not specified in Topic 270 should be provided in interim reporting periods. ASU 2025-11 may be applied either prospectively or retrospectively to any or all prior periods presented in the financial statements for public business entities for interim periods in fiscal years beginning after December 15, 2027, and all other entities in interim periods in fiscal years beginning after December 15, 2028. The Company is currently evaluating the impact of this new guidance on its financial statements.
Note 3 – Discontinued Operations
On March 29, 2024, Quaint Oak Bank sold its
No assets or liabilities for OCH were held at December 31, 2025 or 2024.
Quaint Oak Bancorp, Inc.
Notes to Consolidated Financial Statements (Continued)
Note 3 – Discontinued Operations (Continued)
There were no operating results of the discontinued operations as of December 31, 2025. The following presents operating results of the discontinued operations OCH for the year ended December 31, 2024 (in thousands):
| For the Year Ended | ||||
| December 31, 2024 | ||||
| (In thousands) | ||||
| Interest and Dividend Income | ||||
| Interest on loans, including fees | $ | |||
| Interest and dividends on time deposits, investment securities, interest-bearing deposits with others, and Federal Home Loan Bank stock | ||||
| Total Interest and Dividend Income | ||||
| Interest Expense | ||||
| Interest on other borrowings | ||||
| Total Interest Expense | ||||
| Net Interest Loss | ( | ) | ||
| Non-Interest Income | ||||
| Mortgage banking, equipment lending and title abstract fees | ||||
| Other fees and services charges | ||||
| Net loan servicing income | ||||
| Net gain on sale of loans | ||||
| Gain on sale of OCH (1) | ||||
| Total Non-Interest Income | ||||
| Non-Interest Expense | ||||
| Salaries and employee benefits | ||||
| Occupancy and equipment | ||||
| Professional fees | ||||
| Advertising | ||||
| Other | ||||
| Total Non-Interest Expense | ||||
| Total net loss from discontinued operations | $ | ( | ) | |
| Loss attributable to non-controlling interest | ( | ) | ||
| Net gain from discontinued operations | $ | |||
| (1) | The gain on sale of OCH has been reclassified from prior periods from continuing operations to discontinued operations. |
Quaint Oak Bancorp, Inc.
Notes to Consolidated Financial Statements (Continued)
Note 4 – Earnings Per Share
Earnings per share (“EPS”) consists of two separate components, basic EPS and diluted EPS. Basic EPS is computed based on the weighted average number of shares of common stock outstanding for each period presented. Diluted EPS is calculated based on the weighted average number of shares of common stock outstanding plus dilutive common stock equivalents (“CSEs”). CSEs consist of shares that are assumed to have been purchased with the proceeds from the exercise of stock options, as well as unvested restricted stock (RRP) shares. Common stock equivalents which are considered antidilutive are not included for the purposes of this calculation. For the years ended December 31, 2025 and December 31, 2024, all outstanding stock options granted under the 2018 Stock Incentive Plan and the 2023 Stock Incentive Plan representing shares were dilutive.
The following table sets forth the composition of the weighted average shares (denominator) used in the basic and dilutive earnings per share computations.
| For the Year Ended December 31, | ||||||||
| 2025 | 2024 | |||||||
| Net Income | $ | $ | ||||||
| Weighted average shares outstanding – basic | ||||||||
| Effect of dilutive common stock equivalents | ||||||||
| Adjusted weighted average shares outstanding – diluted | ||||||||
| Basic earnings per share from continuing operations | $ | $ | ||||||
| Basic earnings per share from discontinued operations | $ | $ | ||||||
| Basic earnings per share, net | $ | $ | ||||||
| Diluted earnings per share from continuing operations | $ | $ | ||||||
| Diluted earnings per share from discontinued operations | $ | $ | ||||||
| Diluted earnings per share, net | $ | $ | ||||||
Note 5 – Accumulated Other Comprehensive Income
The following table presents the changes in accumulated other comprehensive income by component, net of tax, for the years ended December 31, 2025 and 2024 (in thousands):
| Unrealized Losses on Investment Securities Available for Sale (1) | ||||||||
| 2025 | 2024 | |||||||
| Balance, beginning of the year | $ | $ | ( | ) | ||||
| Other comprehensive income before reclassifications | ||||||||
| Amount reclassified from accumulated other comprehensive | ||||||||
| Total other comprehensive income | ||||||||
| Balance, end of the year | $ | $ | ||||||
_______________________
| (1) | All amounts are net of tax. Amounts in parentheses indicate debits. |
Quaint Oak Bancorp, Inc.
Notes to Consolidated Financial Statements (Continued)
Note 6 – Investment in Interest-Earning Time Deposits
The investment in interest-earning time deposits as of December 31, 2025 and 2024, by contractual maturity, is shown below (in thousands):
| 2025 | 2024 | |||||||
| Due in one year or less | $ | $ | ||||||
| Due after one year through five years | ||||||||
| Total | $ | $ | ||||||
Note 7 – Investment Securities Available for Sale
The amortized cost, gross unrealized gains and losses, and fair value of investment securities available for sale at December 31, 2025 and 2024 are summarized below (in thousands):
| December 31, 2025 | ||||||||||||||||
| Amortized Cost | Gross Unrealized Gains | Gross Unrealized (Losses) | Fair Value | |||||||||||||
| Available for Sale: | ||||||||||||||||
| Mortgage-backed securities: | ||||||||||||||||
| Government National Mortgage Association securities | $ | $ | $ | $ | ||||||||||||
| Federal National Mortgage Association securities | ||||||||||||||||
| Total available-for-sale-securities | $ | $ | $ | $ | ||||||||||||
| December 31, 2024 | ||||||||||||||||
| Amortized Cost | Gross Unrealized Gains | Gross Unrealized (Losses) | Fair Value | |||||||||||||
| Available for Sale: | ||||||||||||||||
| Mortgage-backed securities: | ||||||||||||||||
| Government National Mortgage Association securities | $ | $ | $ | ( | ) | $ | ||||||||||
| Federal National Mortgage Association securities | ||||||||||||||||
| Total available-for-sale-securities | $ | $ | $ | ( | ) | $ | ||||||||||
The amortized cost and fair value of mortgage-backed and debt securities at December 31, 2025, by contractual maturity, are shown below. Expected maturities will differ from contractual maturities because borrowers may have the right to call or prepay obligations with or without call or prepayment penalties (in thousands):
| Available for Sale | ||||||||
| Amortized Cost | Fair Value | |||||||
| Due after ten years | $ | $ | ||||||
Quaint Oak Bancorp, Inc.
Notes to Consolidated Financial Statements (Continued)
Note 7 – Investment Securities Available for Sale (Continued)
The following table shows the Company’s gross unrealized losses and fair value, aggregated by investment category and length of time that the individual securities have been in a continuous unrealized loss position at December 31, 2024 (in thousands):
|
| ||||||||||||||||||||||||||||
| December 31, 2024 | ||||||||||||||||||||||||||||
| Less than Twelve Months | Twelve Months or Greater | Total | ||||||||||||||||||||||||||
|
| Number of Securities | Fair Value | Gross | Fair Value | Gross | Fair Value | Gross | |||||||||||||||||||||
| Government National Mortgage Association securities | $ | $ | $ | $ | ( | ) | $ | $ | ( | ) | ||||||||||||||||||
There were securities in a loss position at December 31, 2025.
There was allowance for credit losses at December 31, 2025 or 2024.
Note 8 – Loans Receivable, Net and Allowance for Credit Losses
The composition of net loans receivable is as follows (in thousands):
| December 31, | ||||||||
| Real estate loans: | 2025 | 2024 | ||||||
| One-to-four family residential: | ||||||||
| Owner occupied | $ | $ | ||||||
| Non-owner occupied | ||||||||
| Total one-to-four family residential | ||||||||
| Multi-family (five or more) residential | ||||||||
| Commercial real estate | ||||||||
| Construction | ||||||||
| Home equity | ||||||||
| Total real estate loans | ||||||||
| Commercial business | ||||||||
| Other consumer | ||||||||
| Total Loans | ||||||||
| Deferred loan (fees) and costs | ( | ) | ||||||
| Allowance for credit losses, net | ( | ) | ( | ) | ||||
| Net Loans | $ | $ | ||||||
Quaint Oak Bancorp, Inc.
Notes to Consolidated Financial Statements (Continued)
Note 8 – Loans Receivable, Net and Allowance for Credit Losses (Continued)
The following table summarizes designated internal risk categories by portfolio segment and loan class, by origination year, as of December 31, 2025 (in thousands):
| Term Loans Amortized Cost by Origination Year | ||||||||||||||||||||||||||||||||
| As of December 31, 2025 | 2025 | 2024 | 2023 | 2022 | 2021 | Prior | Revolving Loans Amortized Cost Basis | Total | ||||||||||||||||||||||||
| One-to-four family residential owner occupied | ||||||||||||||||||||||||||||||||
| Risk rating | ||||||||||||||||||||||||||||||||
| Pass | $ | $ | $ | $ | $ | $ | $ | $ | ||||||||||||||||||||||||
| Special mention | ||||||||||||||||||||||||||||||||
| Substandard | ||||||||||||||||||||||||||||||||
| Doubtful | ||||||||||||||||||||||||||||||||
| Total one-to-four family residential owner occupied | $ | $ | $ | $ | $ | $ | $ | $ | ||||||||||||||||||||||||
| Current period gross charge-offs | $ | $ | $ | $ | $ | $ | $ | $ | ||||||||||||||||||||||||
| One-to-four family residential non- owner occupied | ||||||||||||||||||||||||||||||||
| Risk rating | ||||||||||||||||||||||||||||||||
| Pass | $ | $ | $ | $ | $ | $ | $ | $ | ||||||||||||||||||||||||
| Special mention | ||||||||||||||||||||||||||||||||
| Substandard | ||||||||||||||||||||||||||||||||
| Doubtful | ||||||||||||||||||||||||||||||||
| Total one-to-four family residential non-owner occupied | $ | $ | $ | $ | $ | $ | $ | |||||||||||||||||||||||||
| Current period gross charge-offs | $ | $ | $ | $ | $ | $ | $ | $ | ||||||||||||||||||||||||
| Multi-family residential | ||||||||||||||||||||||||||||||||
| Risk rating | ||||||||||||||||||||||||||||||||
| Pass | $ | $ | $ | $ | $ | $ | $ | $ | ||||||||||||||||||||||||
| Special mention | ||||||||||||||||||||||||||||||||
| Substandard | ||||||||||||||||||||||||||||||||
| Doubtful | ||||||||||||||||||||||||||||||||
| Total multi-family residential | $ | $ | $ | $ | $ | $ | $ | $ | ||||||||||||||||||||||||
| Current period gross charge-offs | $ | $ | $ | $ | $ | $ | $ | $ | ||||||||||||||||||||||||
| Commercial real estate | ||||||||||||||||||||||||||||||||
| Risk rating | ||||||||||||||||||||||||||||||||
| Pass | $ | $ | $ | $ | $ | $ | $ | $ | ||||||||||||||||||||||||
| Special mention | ||||||||||||||||||||||||||||||||
| Substandard | ||||||||||||||||||||||||||||||||
| Doubtful | ||||||||||||||||||||||||||||||||
| Total commercial real estate | $ | $ | $ | $ | $ | $ | $ | $ | ||||||||||||||||||||||||
| Current period gross charge-offs | $ | $ | $ | $ | $ | $ | $ | $ | ||||||||||||||||||||||||
| Construction | ||||||||||||||||||||||||||||||||
| Risk rating | ||||||||||||||||||||||||||||||||
| Pass | $ | $ | $ | $ | $ | $ | $ | $ | ||||||||||||||||||||||||
| Special mention | ||||||||||||||||||||||||||||||||
| Substandard | ||||||||||||||||||||||||||||||||
| Doubtful | ||||||||||||||||||||||||||||||||
| Total construction | $ | $ | $ | $ | $ | $ | $ | $ | ||||||||||||||||||||||||
| Current period gross charge-offs | $ | $ | $ | $ | $ | $ | $ | $ | ||||||||||||||||||||||||
Quaint Oak Bancorp, Inc.
Notes to Consolidated Financial Statements (Continued)
Note 8 – Loans Receivable, Net and Allowance for Credit Losses (Continued)
| Term Loans Amortized Cost by Origination Year | ||||||||||||||||||||||||||||||||
| As of December 31, 2025 | 2025 | 2024 | 2023 | 2022 | 2021 | Prior | Revolving Loans Amortized Cost Basis | Total | ||||||||||||||||||||||||
| Home equity | ||||||||||||||||||||||||||||||||
| Risk rating | ||||||||||||||||||||||||||||||||
| Pass | $ | $ | $ | $ | $ | $ | $ | $ | ||||||||||||||||||||||||
| Special mention | ||||||||||||||||||||||||||||||||
| Substandard | ||||||||||||||||||||||||||||||||
| Doubtful | ||||||||||||||||||||||||||||||||
| Total home equity | $ | $ | $ | $ | $ | $ | $ | $ | ||||||||||||||||||||||||
| Current period gross charge-offs | $ | $ | $ | $ | $ | $ | $ | $ | ||||||||||||||||||||||||
| Commercial business | ||||||||||||||||||||||||||||||||
| Risk rating | ||||||||||||||||||||||||||||||||
| Pass | $ | $ | $ | $ | $ | $ | $ | $ | ||||||||||||||||||||||||
| Special mention | ||||||||||||||||||||||||||||||||
| Substandard | ||||||||||||||||||||||||||||||||
| Doubtful | ||||||||||||||||||||||||||||||||
| Total commercial business | $ | $ | $ | $ | $ | $ | $ | $ | ||||||||||||||||||||||||
| Current period gross charge-offs | $ | $ | $ | $ | $ | $ | $ | $ | ||||||||||||||||||||||||
| Other consumer | ||||||||||||||||||||||||||||||||
| Risk rating | ||||||||||||||||||||||||||||||||
| Pass | $ | $ | $ | $ | $ | $ | $ | $ | ||||||||||||||||||||||||
| Special mention | ||||||||||||||||||||||||||||||||
| Substandard | ||||||||||||||||||||||||||||||||
| Doubtful | ||||||||||||||||||||||||||||||||
| Total other consumer | $ | $ | $ | $ | $ | $ | $ | $ | ||||||||||||||||||||||||
| Current period gross charge-offs | $ | $ | $ | $ | $ | $ | $ | $ | ||||||||||||||||||||||||
| Total | ||||||||||||||||||||||||||||||||
| Pass | $ | $ | $ | $ | $ | $ | $ | $ | ||||||||||||||||||||||||
| Special mention | ||||||||||||||||||||||||||||||||
| Substandard | ||||||||||||||||||||||||||||||||
| Doubtful | ||||||||||||||||||||||||||||||||
| Total | $ | $ | $ | $ | $ | $ | $ | $ | ||||||||||||||||||||||||
| Current period gross charge-offs | $ | $ | $ | $ | $ | $ | $ | $ | ||||||||||||||||||||||||
Quaint Oak Bancorp, Inc.
Notes to Consolidated Financial Statements (Continued)
Note 8 – Loans Receivable, Net and Allowance for Credit Losses (Continued)
The following table summarizes designated internal risk categories by portfolio segment and loan class, by origination year, as of December 31, 2024 (in thousands):
| Term Loans Amortized Cost by Origination Year | ||||||||||||||||||||||||||||||||
| As of December 31, 2024 | 2024 | 2023 | 2022 | 2021 | 2020 | Prior | Revolving Loans Amortized Cost Basis | Total | ||||||||||||||||||||||||
| One-to-four family residential owner occupied | ||||||||||||||||||||||||||||||||
| Risk rating | ||||||||||||||||||||||||||||||||
| Pass | $ | $ | $ | $ | $ | $ | $ | $ | ||||||||||||||||||||||||
| Special mention | ||||||||||||||||||||||||||||||||
| Substandard | ||||||||||||||||||||||||||||||||
| Doubtful | ||||||||||||||||||||||||||||||||
| Total one-to-four family residential owner occupied | $ | $ | $ | $ | $ | $ | $ | $ | ||||||||||||||||||||||||
| Current period gross charge-offs | $ | $ | $ | $ | $ | $ | $ | $ | ||||||||||||||||||||||||
| One-to-four family residential non-owner occupied | ||||||||||||||||||||||||||||||||
| Risk rating | ||||||||||||||||||||||||||||||||
| Pass | $ | $ | $ | $ | $ | $ | $ | $ | ||||||||||||||||||||||||
| Special mention | ||||||||||||||||||||||||||||||||
| Substandard | ||||||||||||||||||||||||||||||||
| Doubtful | ||||||||||||||||||||||||||||||||
| Total one-to-four family residential non-owner occupied | $ | $ | $ | $ | $ | $ | $ | |||||||||||||||||||||||||
| Current period gross charge-offs | $ | $ | $ | $ | $ | $ | $ | $ | ||||||||||||||||||||||||
| Multi-family residential | ||||||||||||||||||||||||||||||||
| Risk rating | ||||||||||||||||||||||||||||||||
| Pass | $ | $ | $ | $ | $ | $ | $ | $ | ||||||||||||||||||||||||
| Special mention | ||||||||||||||||||||||||||||||||
| Substandard | ||||||||||||||||||||||||||||||||
| Doubtful | ||||||||||||||||||||||||||||||||
| Total multi-family residential | $ | $ | $ | $ | $ | $ | $ | $ | ||||||||||||||||||||||||
| Current period gross charge-offs | $ | $ | $ | $ | $ | $ | $ | $ | ||||||||||||||||||||||||
| Commercial real estate | ||||||||||||||||||||||||||||||||
| Risk rating | ||||||||||||||||||||||||||||||||
| Pass | $ | $ | $ | $ | $ | $ | $ | $ | ||||||||||||||||||||||||
| Special mention | ||||||||||||||||||||||||||||||||
| Substandard | ||||||||||||||||||||||||||||||||
| Doubtful | ||||||||||||||||||||||||||||||||
| Total commercial real estate | $ | $ | $ | $ | $ | $ | $ | $ | ||||||||||||||||||||||||
| Current period gross charge-offs | $ | $ | $ | $ | $ | $ | $ | $ | ||||||||||||||||||||||||
| Construction | ||||||||||||||||||||||||||||||||
| Risk rating | ||||||||||||||||||||||||||||||||
| Pass | $ | $ | $ | $ | $ | $ | $ | $ | ||||||||||||||||||||||||
| Special mention | ||||||||||||||||||||||||||||||||
| Substandard | ||||||||||||||||||||||||||||||||
| Doubtful | ||||||||||||||||||||||||||||||||
| Total construction | $ | $ | $ | $ | $ | $ | $ | $ | ||||||||||||||||||||||||
| Current period gross charge-offs | $ | $ | $ | $ | $ | $ | $ | $ | ||||||||||||||||||||||||
Quaint Oak Bancorp, Inc.
Notes to Consolidated Financial Statements (Continued)
Note 8 – Loans Receivable, Net and Allowance for Credit Losses (Continued)
| Term Loans Amortized Cost by Origination Year | ||||||||||||||||||||||||||||||||
| As of December 31, 2024 | 2024 | 2023 | 2022 | 2021 | 2020 | Prior | Revolving Loans Amortized Cost Basis | Total | ||||||||||||||||||||||||
| Home equity | ||||||||||||||||||||||||||||||||
| Risk rating | ||||||||||||||||||||||||||||||||
| Pass | $ | $ | $ | $ | $ | $ | $ | $ | ||||||||||||||||||||||||
| Special mention | ||||||||||||||||||||||||||||||||
| Substandard | ||||||||||||||||||||||||||||||||
| Doubtful | ||||||||||||||||||||||||||||||||
| Total home equity | $ | $ | $ | $ | $ | $ | $ | $ | ||||||||||||||||||||||||
| Current period gross charge-offs | $ | $ | $ | $ | $ | $ | $ | $ | ||||||||||||||||||||||||
| Commercial business | ||||||||||||||||||||||||||||||||
| Risk rating | ||||||||||||||||||||||||||||||||
| Pass | $ | $ | $ | $ | $ | $ | $ | $ | ||||||||||||||||||||||||
| Special mention | ||||||||||||||||||||||||||||||||
| Substandard | ||||||||||||||||||||||||||||||||
| Doubtful | ||||||||||||||||||||||||||||||||
| Total commercial business | $ | $ | $ | $ | $ | $ | $ | $ | ||||||||||||||||||||||||
| Current period gross charge-offs | $ | $ | $ | $ | $ | $ | $ | $ | ||||||||||||||||||||||||
| Other consumer | ||||||||||||||||||||||||||||||||
| Risk rating | ||||||||||||||||||||||||||||||||
| Pass | $ | $ | $ | $ | $ | $ | $ | $ | ||||||||||||||||||||||||
| Special mention | ||||||||||||||||||||||||||||||||
| Substandard | ||||||||||||||||||||||||||||||||
| Doubtful | ||||||||||||||||||||||||||||||||
| Total other consumer | $ | $ | $ | $ | $ | $ | $ | $ | ||||||||||||||||||||||||
| Current period gross charge-offs | $ | $ | $ | $ | $ | $ | $ | $ | ||||||||||||||||||||||||
| Total | ||||||||||||||||||||||||||||||||
| Pass | $ | $ | $ | $ | $ | $ | $ | $ | ||||||||||||||||||||||||
| Special mention | ||||||||||||||||||||||||||||||||
| Substandard | ||||||||||||||||||||||||||||||||
| Doubtful | ||||||||||||||||||||||||||||||||
| Total | $ | $ | $ | $ | $ | $ | $ | $ | ||||||||||||||||||||||||
| Current period gross charge-offs | $ | $ | $ | $ | $ | $ | $ | $ | ||||||||||||||||||||||||
The following tables present non-performing loans by classes of the loan portfolio as of December 31, 2025 and December 31, 2024 (in thousands):
| December 31, 2025 | ||||||||||||||||||||
| Non-accrual loans | 90 Days or More Past Due and Accruing | Total Non-Performing | ||||||||||||||||||
| With a Related Allowance | Without a Related Allowance | Total | ||||||||||||||||||
| One-to-four family residential owner occupied | $ | $ | $ | $ | $ | |||||||||||||||
| Commercial real estate | ||||||||||||||||||||
| Commercial business | ||||||||||||||||||||
| Total | $ | $ | $ | $ | $ | |||||||||||||||
As part of the discontinued operations of OCH, the Bank retained approximately
Quaint Oak Bancorp, Inc.
Notes to Consolidated Financial Statements (Continued)
Note 8 – Loans Receivable, Net and Allowance for Credit Losses (Continued)
| December 31, 2024 | ||||||||||||||||||||
| Non-accrual loans | 90 Days or More Past Due and Accruing | Total Non-Performing | ||||||||||||||||||
| With a Related Allowance | Without a Related Allowance | Total | ||||||||||||||||||
| One-to-four family residential owner occupied | $ | $ | $ | $ | $ | |||||||||||||||
| Commercial real estate | ||||||||||||||||||||
| Commercial business | ||||||||||||||||||||
| Total | $ | $ | $ | $ | $ | |||||||||||||||
As part of the discontinued operations of OCH, the Bank retained approximately
Occasionally, the Bank modifies loans to borrowers in financial distress by providing principal forgiveness and term extensions. When principal forgiveness is provided, the amount of forgiveness is charged-off against the allowance for credit losses.
In some cases, the Bank provides multiple types of concessions on one loan. Typically, one type of concession, such as a term extension, is granted initially. If the borrower continues to experience financial difficulty, another concession, such as principal forgiveness, may be granted.
As of December 31, 2025, there was commercial business loan with an amortized cost of $
Following is a summary, by loan portfolio class, of changes in the allowance for credit losses for the year ended December 31, 2025 (in thousands):
| December 31, 2025 | ||||||||||||||||||||||||||||||||
| 1-4 Family Residential Owner Occupied | 1-4 Family Residential Non-Owner Occupied | Multi-Family Residential | Commercial Real Estate | Construction | Home Equity | Commercial Business and Other Consumer | Total | |||||||||||||||||||||||||
| Allowance for credit losses: | ||||||||||||||||||||||||||||||||
| Beginning balance | $ | $ | $ | $ | $ | $ | $ | $ | ||||||||||||||||||||||||
| Charge-offs | ( | ) | ( | ) | ( | ) | ||||||||||||||||||||||||||
| Recoveries | ||||||||||||||||||||||||||||||||
| Provision | ( | ) | ( | ) | ( | ) | ||||||||||||||||||||||||||
| Ending balance | $ | $ | $ | $ | $ | $ | $ | $ | ||||||||||||||||||||||||
The Bank allocated increased allowance for credit loss provisions to the construction loan portfolio class for the year ended December 31, 2025, due primarily to changes in qualitative factors and quantitative factors in this portfolio class. The Bank allocated increased allowance for credit loss provisions to the one-to-four family residential owner-occupied portfolio class for the year ended December 31, 2025, due primarily to increased loan balances in this portfolio class. The Bank allocated decreased allowance for credit loss provisions to the multi-family residential portfolio class for the year ended December 31, 2025, due primarily to decreased loan balances in this portfolio class. The Bank allocated decreased allowance for credit loss provisions to the commercial business loan portfolio class for the year ended December 31, 2025, due primarily to a decrease in loan balances, and a decrease in charge-offs in this portfolio class.
Quaint Oak Bancorp, Inc.
Notes to Consolidated Financial Statements (Continued)
Note 8 - Loans Receivable, Net and Allowance for Credit Losses (Continued)
Following is a summary, by loan portfolio class, of changes in the allowance for credit losses for the year ended December 31, 2024 (in thousands):
| December 31, 2024 | ||||||||||||||||||||||||||||||||
| 1-4 Family Residential Owner Occupied | 1-4 Family Residential Non-Owner Occupied | Multi-Family Residential | Commercial Real Estate | Construction | Home Equity | Commercial Business and Other Consumer | Total | |||||||||||||||||||||||||
| Allowance for credit losses: | ||||||||||||||||||||||||||||||||
| Beginning balance | $ | $ | $ | $ | $ | $ | $ | $ | ||||||||||||||||||||||||
| Charge-offs | ( | ) | ( | ) | ( | ) | ||||||||||||||||||||||||||
| Recoveries | ||||||||||||||||||||||||||||||||
| Provision | ( | ) | ( | ) | ( | ) | ( | ) | ||||||||||||||||||||||||
| Ending balance | $ | $ | $ | $ | $ | $ | $ | $ | ||||||||||||||||||||||||
The Bank allocated decreased allowance for credit loss provisions to the commercial real estate loan portfolio class for the year ended December 31, 2024, due primarily to decreased loan balances in this portfolio class. The Bank allocated increased allowance for credit loss provisions to the commercial business loan portfolio class for the year ended December 31, 2024, due primarily to changes in qualitative factors associated with the current economic environment in this portfolio class. The Bank allocated decreased allowance for credit loss provisions to the construction loan portfolio class for the year ended December 31, 2024, due primarily to changes in qualitative factors and quantitative factors in this portfolio class.
The performance and credit quality of the loan portfolio is also monitored by analyzing the age of the loans receivable as determined by the length of time a recorded payment is past due. The following table presents the classes of the loan portfolio summarized by the past due status as of December 31, 2025 and December 31, 2024 (in thousands):
| December 31, 2025 | ||||||||||||||||
| 30-89 Days Past Due | 90 Days or More Past Due | Current | Total Loans Receivable | |||||||||||||
| One-to-four family residential owner occupied | $ | $ | $ | $ | ||||||||||||
| One-to-four family residential non-owner occupied | ||||||||||||||||
| Multi-family residential | ||||||||||||||||
| Commercial real estate | ||||||||||||||||
| Construction | ||||||||||||||||
| Home equity | ||||||||||||||||
| Commercial business | ||||||||||||||||
| Other consumer | ||||||||||||||||
| Total | $ | $ | $ | $ | ||||||||||||
Quaint Oak Bancorp, Inc.
Notes to Consolidated Financial Statements (Continued)
Note 8 - Loans Receivable, Net and Allowance for Credit Losses (Continued)
| December 31, 2024 | ||||||||||||||||
| 30-89 Days Past Due | 90 Days or More Past Due | Current | Total Loans Receivable | |||||||||||||
| One-to-four family residential owner occupied | $ | $ | $ | $ | ||||||||||||
| One-to-four family residential non-owner occupied | ||||||||||||||||
| Multi-family residential | ||||||||||||||||
| Commercial real estate | ||||||||||||||||
| Construction | ||||||||||||||||
| Home equity | ||||||||||||||||
| Commercial business | ||||||||||||||||
| Other consumer | ||||||||||||||||
| Total | $ | $ | $ | $ | ||||||||||||
For the delinquent loans in our portfolio, we have considered our ability to collect the past due interest, as well as the principal balance of the loan, in order to determine whether specific loans should be placed on non-accrual status. In cases where our evaluations have determined that the principal and interest balances are collectible, we have continued to accrue interest.
As of December 31, 2025, the Company had initiated formal foreclosure procedures on $
For the years ended December 31, 2025 and 2024 there was interest income recognized on non-accrual loans on a cash basis. Interest income foregone on non-accrual loans was approximately $
Note 9 - Premises and Equipment
The components of premises and equipment at December 31, 2025 and 2024 are as follows (in thousands):
| 2025 | 2024 | |||||||
| Leasehold improvements | $ | $ | ||||||
| Furniture, fixtures and equipment | ||||||||
| Accumulated depreciation | ( | ) | ( | ) | ||||
| Premises and equipment, net | $ | $ | ||||||
Depreciation expense for the years ended December 31, 2025 and 2024 amounted to approximately $
Quaint Oak Bancorp, Inc.
Notes to Consolidated Financial Statements (Continued)
Note 10 – Goodwill and Other Intangible, Net
On August 1, 2016, Quaint Oak Insurance Agency, LLC began operations by acquiring the renewal rights to a book of business produced and serviced by an independent insurance agency located in New Britain, Pennsylvania, that provides a broad range of personal and commercial insurance coverage solutions. The Company paid $
Note 11 - Deposits
Deposits at December 31, 2025 and 2024 consist of the following (in thousands):
| 2025 | 2024 | |||||||
| Non-interest bearing checking accounts | $ | $ | ||||||
| Interest bearing checking accounts(1) | ||||||||
| Savings accounts | ||||||||
| Money market accounts | (2) | |||||||
| Certificate of deposit accounts | ||||||||
| Total | $ | $ | ||||||
| (1) | The Company has identified one major interest bearing checking account deposit customer that accounted for approximately $ |
| (2) | The Company has identified one major money market deposit customer, a separate customer than the interest bearing checking account deposit customer referred to above in footnote (1), that accounted for approximately |
A summary of certificates of deposit by maturity at December 31, 2025 is as follows (in thousands):
| Years ending December 31 | ||||
| 2026 | $ | |||
| 2027 | ||||
| 2028 | ||||
| 2029 | ||||
| 2030 | ||||
| Total | $ |
The aggregate amount of certificates of deposit with a minimum denomination of $250,000 was $
Quaint Oak Bancorp, Inc.
Notes to Consolidated Financial Statements (Continued)
Note 12 - Borrowings
As of December 31, 2025, Quaint Oak Bank has a maximum borrowing capacity with the Federal Home Loan Bank of approximately $
Short-term borrowings and the weighted interest rates consist of the following at December 31, 2025 and 2024 (dollars in thousands):
| FHLB Short-Term Borrowings At or For the Year Ended December 31, | FRB Short-Term Borrowings At or For the Year Ended December 31, | |||||||||||||||
| 2025 | 2024 | 2025 | 2024 | |||||||||||||
| Average balance outstanding | $ | $ | $ | $ | ||||||||||||
| Maximum amount outstanding at any month-end during the period | ||||||||||||||||
| Balance outstanding at end of period | ||||||||||||||||
| Average interest rate during the period | % | % | % | % | ||||||||||||
| Weighted average interest rate at end of period | % | % | % | % | ||||||||||||
Federal Home Loan Bank borrowings and the weighted interest rate consist of the following at December 31, 2025 and 2024 (in thousands):
| December 31, 2025 | December 31, 2024 | |||||||||||||||
| Fixed rate borrowings maturing: | Amount | Weighted Interest | Amount | Weighted Interest | ||||||||||||
| 2025 | $ | % | $ | % | ||||||||||||
Note 13 – Senior Debt and Subordinated Debt
On March 4, 2025, the Company entered into a Senior Unsecured Note Purchase Agreement with certain institutional accredited investors pursuant to which the Company issued an aggregate of $
On December 27, 2018, the Quaint Oak Bancorp, Inc. issued $
Quaint Oak Bancorp, Inc.
Notes to Consolidated Financial Statements (Continued)
Note 13 – Senior Debt and Subordinated Debt (Continued)
The following table presents the balance and unamortized issuance costs of the subordinated debt and senior debt at December 31, 2025 are as follows (in thousands):
| Principal | Unamortized Debt Issuance Costs | Net | ||||||||||
| % subordinated notes, due | $ | $ | $ | |||||||||
| % senior notes, due | $ | $ | $ | |||||||||
| % senior notes, due | $ | $ | $ | |||||||||
The balance of senior debt, net of unamortized debt issuance costs, was $
The balance of subordinated debt was $
All subordinated notes are not subject to repayment at the option of the noteholders. These notes are all unsecured and rank junior in right of payment to the Company’s obligations to its general creditors.
Note 14 - Income Taxes
The components of income tax expense for the years ended December 31, 2025 and 2024 are as follows (in thousands):
| 2025 | 2024 | |||||||
| Federal: | ||||||||
| Current | $ | ( | ) | $ | ||||
| Deferred | ||||||||
| Total federal | ||||||||
| State, current | ||||||||
| Total | $ | $ | ||||||
The following table presents the reconciliation between the reported income tax expense and the income tax expense which would be computed by applying the normal federal income tax rate of 21% to income before taxes for the years ended December 31, 2025 and 2024, respectively, as follows (in thousands):
| 2025 | 2024 | |||||||||||||||
| Amount | Rate | Amount | Rate | |||||||||||||
| Federal income tax at statutory rate | $ | % | $ | % | ||||||||||||
| State tax, net of federal benefit | ||||||||||||||||
| Stock compensation expense | ||||||||||||||||
| BOLI income | ( | ) | ( | ) | ( | ) | ( | ) | ||||||||
| Other | ||||||||||||||||
| Total | $ | % | $ | % | ||||||||||||
Quaint Oak Bancorp, Inc.
Notes to Consolidated Financial Statements (Continued)
Note 14 - Income Taxes (Continued)
The components of the net deferred tax asset at December 31, 2025 and 2024 are as follows (in thousands):
| 2025 | 2024 | |||||||
| Deferred tax assets: | ||||||||
| Allowance for credit losses | $ | $ | ||||||
| Deferred loan fees | ||||||||
| Stock-based compensation | ||||||||
| Interest on non-accrual loans | ||||||||
| Total deferred tax assets | ||||||||
| Deferred tax liabilities: | ||||||||
| Bank premises and equipment | ( | ) | ( | ) | ||||
| Deferred loan fees | ( | ) | ||||||
| Intangible | ( | ) | ( | ) | ||||
| Unrealized gains on investment securities available for sale | ( | ) | ||||||
| Total deferred tax liabilities | ||||||||
| Net Deferred Tax Asset | $ | $ |
The net deferred tax asset at December 31, 2025 and 2024 of $
Note 15 – Stock Compensation Plans
Employee Stock Ownership Plan
The Company maintains an Employee Stock Ownership Plan (ESOP) for the benefit of employees who meet the eligibility requirements of the plan. The Bank may make cash contributions to the ESOP on a quarterly basis which are allocated to participant accounts on an annual basis.
During the years ended December 31, 2025 and 2024, the Company did make a discretionary contribution of shares to the ESOP. However, in order to purchase shares from distribution elections by participants, the Company contributed $
Stock Incentive Plans – Share Awards
In May 2018, the shareholders of Quaint Oak Bancorp approved the adoption of the 2018 Stock Incentive Plan (the “2018 Stock Incentive Plan”). The 2018 Stock Incentive Plan approved by shareholders in May 2018 covered a total of
In May 2023, the shareholders of Quaint Oak Bancorp approved the adoption of the 2023 Stock Incentive Plan (the “2023 Stock Incentive Plan”). The 2023 Stock Incentive Plan approved by shareholders in May 2023 covered a total of
Quaint Oak Bancorp, Inc.
Notes to Consolidated Financial Statements (Continued)
Note 15 – Stock Compensation Plans (Continued)
Stock Incentive Plans – Share Awards (Continued)
As of December 31, 2025, a total of
A summary of share award activity under the Company’s 2018 and 2023 Stock Incentive Plans as of December 31, 2025 and changes during the year ended December 31, 2025 is as follows:
| December 31, 2025 | ||||||||
| Number of Shares | Weighted Average Grant Date Fair Value | |||||||
| Unvested at the beginning of the period | $ | |||||||
| Granted | ||||||||
| Vested | ( | ) | ||||||
| Forfeited | ( | ) | ||||||
| Unvested at the end of the period | $ | |||||||
Compensation expense on the share awards is recognized ratably over the year vesting period in an amount which is equal to the fair value of the common stock at the date of grant. During the years ended December 31, 2025 and 2024 the Company recognized approximately $
Stock Incentive Plans – Stock Options
The 2018 Stock Incentive Plan approved by shareholders in May 2018 covered a total of
All incentive stock options issued under the 2018 and 2023 Stock Incentive Plans are intended to comply with the requirements of Section 422 of the Internal Revenue Code. Options will become vested and exercisable over a -year period and are generally exercisable for a period of years after the grant date.
In September 2025,
Quaint Oak Bancorp, Inc.
Notes to Consolidated Financial Statements (Continued)
Note 15 – Stock Compensation Plans (Continued)
Stock Incentive Plans – Stock Options (Continued)
A summary of option activity under the Company’s 2018 and 2023 Stock Incentive Plans for the year ended December 31, 2025 is as follows:
| December 31, 2025 | ||||||||||||
| Number of Shares | Weighted Average Exercise Price | Weighted Average Remaining Contractual Life (in years) | ||||||||||
| Outstanding at the beginning of the period | $ | |||||||||||
| Granted | 9.7 | |||||||||||
| Exercised | - | |||||||||||
| Forfeited | ( | ) | ||||||||||
| Outstanding at end of period | $ | |||||||||||
| Exercisable at end of period | $ | |||||||||||
The estimated fair value of the options granted in September 2025 was $
| Expected dividend yield | |
| Risk-free interest rate | |
| Expected life of options |
|
| Expected stock-price volatility | |
The dividend yield was calculated on the dividend amount and stock price existing at the grant date. The risk free interest rate used was based on the rates of United States Treasury securities with maturities equal to the expected lives of the options. Although the contractual term of the options granted is ten years, the expected term of the options is less. Management estimated the expected term of the stock options to be the average of the vesting period and the contractual term. The expected stock-price volatility was estimated by considering the Company’s own stock volatility. The actual future volatility may differ from our historical volatility.
At December 31, 2025 and December 31, 2024, the aggregate intrinsic value of options outstanding and options exercisable was zero. The aggregate intrinsic value of a stock option represents the total pre-tax intrinsic value (the amount by which the current market value of the underlying stock exceeds the exercise price of the option) that would have been received by the option holder had all option holders exercised their options on December 31, 2025 and December 31, 2024. This amount changes based on changes in the market value of the Company’s common stock.
During the years ended December 31, 2025 and 2024, approximately $
Quaint Oak Bancorp, Inc.
Notes to Consolidated Financial Statements (Continued)
Note 16 - Transactions with Executive Officers and Directors
Certain directors and executive officers of the Company, their families and their affiliates are customers of the Bank. Any transactions with such parties, including loans and commitments, are in the ordinary course of business at normal terms, including interest rate and collateralization, prevailing at the time and do not represent more than normal risks of collectability. of these individuals were indebted to the Company for loans at December 31, 2025 and 2024, respectively.
Note 17 - Financial Instruments with Off-Balance Sheet Risk
The Company is a party to financial instruments with off-balance sheet risk in the normal course of business to meet the financing needs of its customers. These financial instruments include commitments to extend credit. Those instruments involve, to varying degrees, elements of credit risk in excess of the amount recognized in the balance sheet.
The Company’s exposure to credit loss in the event of nonperformance by the other party to the financial instrument for commitments to extend credit is represented by the contractual amount of those instruments. The Company uses the same credit policies in making commitments as it does for on-balance sheet instruments.
A summary of the Company’s financial instrument commitments at December 31, 2025 and 2024 is as follows (in thousands):
| 2025 | 2024 | |||||||
| Commitments to originate loans | $ | $ | ||||||
| Unfunded commitments under lines of credit | ||||||||
| Standby letters of credit | ||||||||
Commitments to extend credit are agreements to lend to a customer as long as there is no violation of any condition established in the contract. Since the commitments may expire without being drawn upon, the total commitment amounts do not necessarily represent future cash requirements. Commitments generally have fixed expiration dates or other termination clauses and may require payment of a fee. The Company evaluates each customer’s credit worthiness on a case-by-case basis. The amount of collateral obtained, if deemed necessary by the Company upon extension of credit, is based on management’s credit evaluation. Collateral held varies but includes principally residential and commercial real estate.
The ACL for off balance sheet credit exposures is recorded in other liabilities on the Consolidated Balance Sheet. This ACL represents management’s estimate of expected losses in its unfunded loan commitments and other off balance sheet credit exposures, such as letters of credit and credit recourse on sold residential mortgage loans. The allowance for credit losses specific to unfunded commitments is determined by estimating future draws and applying the expected loss rates on those draws. Future draws are based on historical averages of utilization rates (i.e., the likelihood of draws taken). The ACL for off balance sheet credit exposures is increased or decreased by charges or reductions to expense, through the provision for credit losses. The balance of off balance sheet credit exposures is $
Note 18 - Leases
The Company leases its office at 501 Knowles Avenue in Southampton, Pennsylvania, as well as other office facilities and equipment. The Company leases four office locations under operating leases. Several assumptions and judgments were made when applying the requirements of Topic 842 to the Company’s existing lease commitments, including the allocation of consideration in the contracts between lease and nonlease components, determination of the lease term, and determination of the discount rate used in calculating the present value of the lease payments.
Quaint Oak Bancorp, Inc.
Notes to Consolidated Financial Statements (Continued)
Note 18 – Leases (Continued)
The Company has elected to account for the variable nonlease components, such as common area maintenance charges, utilities, real estate taxes, and insurance, separately from the lease component. Such variable nonlease components are reported in net occupancy expense on the Consolidated Statements of Income when paid. These variable nonlease components were excluded from the calculation of the present value of the remaining lease payments, therefore, they are not included in the right-of-use assets and lease liabilities reported on the Consolidated Balance Sheets. The lease cost associated with the operating leases was $
Certain of the Company’s leases contain options to renew the lease after the initial term. Management considers the Company’s historical pattern of exercising renewal options on leases and the positive performance of the leased locations, when determining whether it is reasonably certain that the leases will be renewed. If management concludes that there is reasonable certainty about the renewal option, it is included in the calculation of the remaining term of each applicable lease. The discount rate utilized in calculating the present value of the remaining lease payments for each lease was the Federal Home Loan Bank of Pittsburgh advance rate corresponding to the remaining maturity of the lease. The following table presents the weighted-average remaining lease term and discount rate for the leases outstanding at December 31, 2025.
| Operating | ||||
| Weighted average remaining term (years) | ||||
| Weighted average discount rate | % | |||
The following table presents the undiscounted cash flows due related to operating leases as of December 31, 2025, along with a reconciliation to the discounted amount recorded on the Consolidated Balance Sheets:
| Undiscounted cash flows due (In thousands): | Operating | |||
| 2026 | $ | |||
| 2027 | ||||
| 2028 | ||||
| 2029 | ||||
| 2030 | ||||
| 2031 and thereafter | ||||
| Total undiscounted cash flows | ||||
| Discount on cash flows | ( | ) | ||
| Total lease liabilities | $ | |||
Under Topic 842, the lessee can elect to not record on the Consolidated Balance Sheets a lease whose term is twelve months or less and does not include a purchase option that the lessee is reasonably certain to exercise. As of December 31, 2025, the Company had no leases that had a term of twelve months or less.
Rental expense under operating leases totaled approximately $
On October 23, 2024, the Company and Mountainseed Real Estate Services, LLC entered into a sale-leaseback transaction for its office building located at 1710 Union Boulevard, which is owned by the Company and leased by the Bank as a branch and as offices for the following subsidiaries of the Bank: Quaint Oak Mortgage, LLC, Quaint Oak Abstract, LLC, and Quaint Oak Insurance, LLC. On December 20, 2024, the transaction settled and funded and the Bank entered into an initial lease for a term of
Quaint Oak Bancorp, Inc.
Notes to Consolidated Financial Statements (Continued)
Note 19 - Regulatory Matters
The Bank is subject to various regulatory capital requirements administered by the federal banking agencies. Failure to meet minimum capital requirements can initiate certain mandatory and possibly additional discretionary actions by regulators that, if undertaken, could have a direct material effect on the Company’s financial statements. Under capital adequacy guidelines and the regulatory framework for prompt corrective action, the Bank must meet specific capital guidelines that involve quantitative measures of the Bank’s assets, liabilities and certain off-balance sheet items as calculated under regulatory accounting practices. The Bank’s capital amounts and classification are also subject to qualitative judgments by the regulators about components, risk-weightings and other factors.
Quantitative measures established by regulation to ensure capital adequacy require the Bank to maintain minimum amounts and ratios (set forth below) of total, Tier 1, and common equity Tier 1 capital (as defined in the regulations) to risk-weighted assets, and of Tier 1 capital to average assets. Management believes, as of December 31, 2025, that the Bank meets all capital adequacy requirements to which it is subject.
The Bank’s actual capital amounts and ratios at December 31, 2025 and 2024 and the minimum amounts and ratios required for capital adequacy purposes and to be well capitalized under the prompt corrective action provisions are as follows (dollars in thousands):
| Actual | For Capital Adequacy Purposes | To be Well Capitalized Under Prompt Corrective Action Provisions | ||||||||||||||||||||||
| Amount | Ratio | Amount | Ratio | Amount | Ratio | |||||||||||||||||||
| As of December 31, 2025: | ||||||||||||||||||||||||
| Total capital (to risk-weighted assets) | $ | % | $ | % | $ | % | ||||||||||||||||||
| Tier 1 capital (to risk-weighted assets) | ||||||||||||||||||||||||
| Common Equity Tier 1 capital (to risk-weighted assets) | ||||||||||||||||||||||||
| Tier 1 capital (to average assets) | ||||||||||||||||||||||||
| Actual | For Capital Adequacy Purposes | To be Well Capitalized Under Prompt Corrective Action Provisions | ||||||||||||||||||||||
| Amount | Ratio | Amount | Ratio | Amount | Ratio | |||||||||||||||||||
| As of December 31, 2024: | ||||||||||||||||||||||||
| Total capital (to risk-weighted assets) | $ | % | $ | % | $ | % | ||||||||||||||||||
| Tier 1 capital (to risk-weighted assets) | ||||||||||||||||||||||||
| Common Equity Tier 1 capital (to risk-weighted assets) | ||||||||||||||||||||||||
| Tier 1 capital (to average assets) | ||||||||||||||||||||||||
Under the Dodd-Frank Wall Street Reform and Consumer Protection Act the Board of Governors of the Federal Reserve System as the primary regulator for the Company is authorized to extend leverage capital requirements and risk based capital requirements applicable to depository institutions and bank holding companies to thrift holding companies. Legislation adopted in late 2014 generally exempts small savings and loan holding companies like Quaint Oak Bancorp from these capital requirements if certain conditions are met.
Quaint Oak Bancorp, Inc.
Notes to Consolidated Financial Statements (Continued)
Note 19 - Regulatory Matters (Continued)
Banking regulations place certain restrictions on dividends paid by the Bank to the Company. The Company is dependent upon dividends from the Bank to provide funds for the payment of dividends to the Company’s shareholders, interest payments on the subordinated debt and other general corporate purposes. The Bank’s ability to pay cash dividends directly or indirectly to the Company is governed by federal law, regulations and related guidance. These include the requirement that the Bank must receive approval to declare a dividend if the total amount of all dividends, including the proposed dividend, declared by the Bank in any current year exceeds the total of the Bank’s net income for the current year to date, combined with its retained net income for the previous two years. The term “retained net income” as defined by federal regulations means the Bank’s net income for a specified period less the total amount of all dividends declared in that period.
The Bank may not pay dividends to the Company if, after paying those dividends, it would fail to meet the required minimum levels under risk-based capital guidelines or if the bank regulators have notified the Bank that it is in need of more than normal supervision. Under the Federal Deposit Insurance Act, an insured depository institution such as the Bank is prohibited from making capital distributions, including the payment of dividends, if, after making such distribution, the institution would become “undercapitalized” (as such term is used in the Federal Deposit Insurance Act). Payment of dividends by the Bank also may be restricted at any time at the discretion of the appropriate regulator if it deems the payment to constitute an unsafe and unsound banking practice.
The Bank paid a total of $
Note 20 – Fair Value Measurements and Fair Values of Financial Instruments
Fair value estimates are based on quoted market prices, if available, quoted market prices of similar assets or liabilities, or the present value of expected future cash flows and other valuation techniques. These valuations are significantly affected by discount rates, cash flow assumptions, and risk assumptions used. Therefore, fair values estimates may not be substantiated by comparison to independent markets and are not intended to reflect the proceeds that may be realizable in an immediate settlement of the instruments.
Fair value is determined at one point in time and is not representative of future value. These amounts do not reflect the total value of a going concern organization. Management does not have the intention to dispose of a significant portion of its assets and liabilities and therefore, the unrealized gains or losses should not be interpreted as a forecast of future earnings and cash flows.
The following disclosures show the hierarchal disclosure framework associated with the level of pricing observations utilized in measuring assets and liabilities at fair value. The three broad levels of pricing are as follows:
| Level I: | Quoted prices are available in active markets for identical assets or liabilities as of the reported date. |
| Level II: | Pricing inputs are other than the quoted prices in active markets, which are either directly or indirectly observable as of the reported date. The nature of these assets and liabilities includes items for which quoted prices are available but traded less frequently and items that are fair-valued using other financial instruments, the parameters of which can be directly observed. |
| Level III: | Valuations derived from valuation techniques in which one or more significant inputs or significant value drivers are unobservable. |
This hierarchy requires the use of observable market data when available.
Quaint Oak Bancorp, Inc.
Notes to Consolidated Financial Statements (Continued)
Note 20 – Fair Value Measurements and Fair Values of Financial Instruments (Continued)
The methods of determining the fair value of assets and liabilities presented in this note are consistent with our methodologies disclosed in Note 19 of the Company’s Form 10-K for the fiscal year ended December 31, 2025, as the fair value of loans, excluding previously presented impaired loans measured at fair value on a non-recurring basis, is estimated using discounted cash flow analyses. The discount rates used to determine fair value use interest rate spreads that reflect factors such as liquidity, credit and non-performance risk. Loans are considered a Level 3 classification.
The following is a discussion of assets and liabilities measured at fair value on a recurring and non-recurring basis and valuation techniques applied:
Investment Securities Available for Sale: The fair value of securities available for sale are determined by obtaining quoted market prices on nationally recognized securities exchanges (Level 1), or matrix pricing (Level 2), which is a mathematical technique used widely in the industry to value debt securities without relying exclusively on quoted market prices for the specific securities but rather by relying on the securities’ relationship to other benchmark quoted prices.
We may be required from time to time to measure certain assets at fair value on a nonrecurring basis in accordance with U.S. GAAP. These adjustments to fair value usually result from application of lower-of-cost-or-market accounting or write-downs of individual assets.
Individually Evaluated Loans: Individually evaluated loans are carried at the lower of cost or the fair value of the collateral for collateral-dependent loans less estimated costs to sell. Collateral is primarily in the form of real estate. The use of independent appraisals, discounted cash flow models and management’s best judgment are significant inputs in arriving at the fair value measure of the underlying collateral and impaired loans are therefore classified within Level 3 of the fair value hierarchy.
The table below sets forth the financial assets and liabilities that were accounted for on a recurring and nonrecurring basis by level within the fair value hierarchy as of December 31, 2025 (in thousands):
| December 31, 2025 | ||||||||||||||||
| Fair Value Measurements Using: | ||||||||||||||||
| Total Fair Value | Quoted Prices in Active Markets for Identical Assets (Level 1) | Significant Other Observable Inputs (Level 2) | Unobservable Inputs (Level 3) | |||||||||||||
| Recurring fair value measurements: | ||||||||||||||||
| Investment securities available for sale | ||||||||||||||||
| Government National Mortgage Association mortgage-backed securities | $ | $ | $ | $ | ||||||||||||
| Federal National Mortgage Association mortgage- backed securities | ||||||||||||||||
| Total investment securities available for sale | $ | $ | $ | $ | ||||||||||||
| Total recurring fair value measurements | $ | $ | $ | $ | ||||||||||||
| Nonrecurring fair value measurements: | ||||||||||||||||
| Other real estate owned | $ | $ | $ | $ | ||||||||||||
Quaint Oak Bancorp, Inc.
Notes to Consolidated Financial Statements (Continued)
Note 20 – Fair Value Measurements and Fair Values of Financial Instruments (Continued)
The table below sets forth the financial assets and liabilities that were accounted for on a recurring basis by level within the fair value hierarchy as of December 31, 2024 (in thousands):
| December 31, 2024 | ||||||||||||||||
| Fair Value Measurements Using: | ||||||||||||||||
| Total Fair Value | Quoted Prices in Active Markets for Identical Assets (Level 1) | Significant Other Observable Inputs (Level 2) | Unobservable Inputs (Level 3) | |||||||||||||
| Recurring fair value measurements: | ||||||||||||||||
| Investment securities available for sale | ||||||||||||||||
| Government National Mortgage Association mortgage-backed securities | $ | $ | $ | $ | ||||||||||||
| Federal National Mortgage Association mortgage- backed securities | ||||||||||||||||
| Total investment securities available for sale | $ | $ | $ | $ | ||||||||||||
| Total recurring fair value measurements | $ | $ | $ | $ | ||||||||||||
The following table presents additional quantitative information about assets measured at fair value on a nonrecurring basis and for which the Company has used Level 3 inputs to determine fair value as of December 31, 2025 (in thousands):
| December 31, 2025 | ||||||||||
| Quantitative Information About Level 3 Fair Value Measurements | ||||||||||
| Total Fair Value | Valuation Techniques | Unobservable Input | Range (Weighted Average) | |||||||
| Collateral-dependent loans | $ | Appraisal of collateral (1) | Appraisal adjustments (2) | |||||||
| Other real estate owned | $ | Appraisal of collateral (1) | Appraisal adjustments (2) | % | ||||||
_______________
| (1) | Fair value is generally determined through independent appraisals of the underlying collateral, which generally include various Level 3 inputs which are identifiable. |
| (2) | Appraisals may be adjusted by management for qualitative factors such as economic conditions and estimated liquidation expenses. The range and weighted average of liquidation expenses and other appraisal adjustments are presented as a percentage of the appraisal. |
The following table presents additional quantitative information about assets measured at fair value on a nonrecurring basis and for which the Company has used Level 3 inputs to determine fair value as of December 31, 2024 (in thousands):
| December 31, 2024 | ||||||||||
| Quantitative Information About Level 3 Fair Value Measurements | ||||||||||
| Total Fair Value | Valuation Techniques | Unobservable Input | Range (Weighted Average) | |||||||
| Collateral-dependent loans | $ | Appraisal of collateral (1) | Appraisal adjustments (2) | |||||||
_______________
| (1) | Fair value is generally determined through independent appraisals of the underlying collateral, which generally include various Level 3 inputs which are identifiable. |
| (2) | Appraisals may be adjusted by management for qualitative factors such as economic conditions and estimated liquidation expenses. The range and weighted average of liquidation expenses and other appraisal adjustments are presented as a percentage of the appraisal.
|
Quaint Oak Bancorp, Inc.
Notes to Consolidated Financial Statements (Continued)
Note 20 – Fair Value Measurements and Fair Values of Financial Instruments (Continued)
The estimated fair values of the Company’s financial instruments that are not required to be measured or reported at fair value were as follows at December 31, 2025 and 2024 (in thousands):
| Fair Value Measurements at | ||||||||||||||||||||
| December 31, 2025 | ||||||||||||||||||||
| Carrying Amount | Fair Value Estimate | Quoted Prices in Active Markets for Identical Assets (Level 1) | Significant Other Observable Inputs (Level 2) | Unobservable Inputs (Level 3) | ||||||||||||||||
| Financial Assets | ||||||||||||||||||||
| Investment in interest-earning time deposits | $ | $ | $ | $ | $ | |||||||||||||||
| Loans held for sale | ||||||||||||||||||||
| Loans receivable, net | ||||||||||||||||||||
| Individually evaluated loans | ||||||||||||||||||||
| Financial Liabilities | ||||||||||||||||||||
| Deposits | ||||||||||||||||||||
| Senior debt | ||||||||||||||||||||
| Subordinated debt | ||||||||||||||||||||
| Fair Value Measurements at | ||||||||||||||||||||
| December 31, 2024 | ||||||||||||||||||||
| Carrying Amount | Fair Value Estimate | Quoted Prices in Active Markets for Identical Assets (Level 1) | Significant Other Observable Inputs (Level 2) | Unobservable Inputs (Level 3) | ||||||||||||||||
| Financial Assets | ||||||||||||||||||||
| Investment in interest-earning time deposits | $ | $ | $ | $ | $ | |||||||||||||||
| Loans held for sale | ||||||||||||||||||||
| Loans receivable, net | ||||||||||||||||||||
| Individually evaluated loans | ||||||||||||||||||||
| Financial Liabilities | ||||||||||||||||||||
| Deposits | ||||||||||||||||||||
| FHLB long-term borrowings | ||||||||||||||||||||
| Subordinated debt | ||||||||||||||||||||
For cash and cash equivalents, accrued interest receivable, investment in FHLB stock, bank-owned life insurance, FHLB short-term borrowings, accrued interest payable, and advances from borrowers for taxes and insurance, the carrying value is a reasonable estimate of the fair value and are considered Level 1 measurements.
Quaint Oak Bancorp, Inc.
Notes to Consolidated Financial Statements (Continued)
Note 21 – Operating Segments
ASC Topic 820 – Segment Reporting identifies operating segments as components of an enterprise which are evaluated regularly by the Company’s Chief Operating Decision Maker, our Chief Executive Officer, in deciding how to allocate resources and assess performance. The Company has applied the aggregation criterion set forth in this codification to the results of its operations. The Company's operations currently consist of reportable operating segments: Banking and Oakmont Commercial. The Company offers different products and services through its two segments. The accounting policies of the segments are generally the same as those of the consolidated company.
The Banking Segment generates its revenues primarily from its lending, deposit gathering and fee business activities. The profitability of this segment's operations depends primarily on its net interest income after provision for credit losses, which is the difference between interest earned on interest earning assets and interest paid on interest bearing liabilities less provision for credit losses. The provision for credit losses is almost entirely dependent on changes in the Banking Segment's loan portfolio and management’s assessment of the collectability of the loan portfolio as well as prevailing economic and market conditions. The profitability of this segment’s operations also depends on the generation of non-interest income which includes fees and commissions generated by Quaint Oak Bank and its wholly-owned subsidiaries, Quaint Oak Mortgage, LLC, Quaint Oak Abstract, LLC, Quaint Oak Insurance Agency, LLC, and Quaint Oak Properties, LLC, which are included in the Banking Segment for segment reporting purposes. The Banking Segment is also subject to an extensive system of laws and regulations that are intended primarily for the protection of depositors and other customers, federal deposit insurance funds and the banking system as a whole. These laws and regulations govern such areas as capital, permissible activities, allowance for loan and lease losses, loans and investments, and rates of interest that can be charged on loans. For segment reporting purposes, Quaint Oak Bancorp, Inc. is included as part of the Company’s Banking segment.
The Oakmont Commercial Segment originates commercial real estate loans which are sold into the secondary market along with the loans’ servicing rights. The profitability of this segment’s operations depends primarily on the gains realized from the sale of loans and processing fees. The Oakmont Commercial Segment is also subject to an extensive system of laws and regulations that are intended primarily for the protection of consumers.
Quaint Oak Bancorp, Inc.
Notes to Consolidated Financial Statements (Continued)
Note 21 – Operating Segments (Continued)
The following table presents summary financial information for the reportable segments (in thousands):
| As of or for the Year Ended December 31, | ||||||||||||||||||||||||
| 2025 | 2024 | |||||||||||||||||||||||
| Quaint Oak Bank(1) | Oakmont Commercial, LLC | Consolidated | Quaint Oak Bank(2) | Oakmont Commercial, LLC | Consolidated | |||||||||||||||||||
| Net Interest Income | $ | $ | $ | $ | $ | $ | ||||||||||||||||||
| Provision for (Recovery of) Credit Losses | ( | ) | ||||||||||||||||||||||
| Net Interest Income after Provision for (Recovery of) Credit Losses | ||||||||||||||||||||||||
| Non-Interest Income | ||||||||||||||||||||||||
| Mortgage banking, equipment lending and title abstract fees | ||||||||||||||||||||||||
| Real estate sales commissions, net | ||||||||||||||||||||||||
| Insurance commissions | ||||||||||||||||||||||||
| Other fees and services charges | ( | ) | ||||||||||||||||||||||
| Income from bank-owned life insurance | ||||||||||||||||||||||||
| Net gain on sale of loans | ||||||||||||||||||||||||
| Gain on the sale of SBA loans | ||||||||||||||||||||||||
| Gain on the sale-leaseback transaction | ||||||||||||||||||||||||
| Total Non-Interest Income | ||||||||||||||||||||||||
| Non-Interest Expense | ||||||||||||||||||||||||
| Salaries and employee benefits | ||||||||||||||||||||||||
| Directors’ fees and expenses | ||||||||||||||||||||||||
| Occupancy and equipment | ||||||||||||||||||||||||
| Data processing | ||||||||||||||||||||||||
| Professional fees | ||||||||||||||||||||||||
| FDIC deposit insurance assessment | ||||||||||||||||||||||||
| Advertising | ||||||||||||||||||||||||
| Amortization of other intangible | ||||||||||||||||||||||||
| Other | ||||||||||||||||||||||||
| Total Non-Interest Expense | ||||||||||||||||||||||||
| Pretax Segment (Loss) Profit | $ | ( | ) | $ | $ | $ | $ | $ | ||||||||||||||||
| Income from Discontinued Operations | $ | $ | $ | $ | $ | $ | ||||||||||||||||||
| Income Tax from Discontinued Operations | $ | $ | $ | $ | $ | $ | ||||||||||||||||||
| Net Income from Discontinued Operations | $ | $ | $ | $ | $ | $ | ||||||||||||||||||
| Segment Assets | $ | $ | $ | $ | $ | $ | ||||||||||||||||||
___________________
| (1) | Includes Quaint Oak Bancorp, Inc. and the Bank’s subsidiaries, Quaint Oak Mortgage, Quaint Oak Abstract, Quaint Oak Insurance Agency, and QOB Properties. |
| (2) | Includes Quaint Oak Bancorp, Inc. and the Bank’s subsidiaries, Quaint Oak Mortgage, Quaint Oak Real Estate, Quaint Oak Abstract, Quaint Oak Insurance Agency, and QOB Properties. |
Quaint Oak Bancorp, Inc.
Notes to Consolidated Financial Statements (Continued)
Note 22– Quaint Oak Bancorp, Inc. (Parent Company Only)
Condensed financial statements of Quaint Oak Bancorp, Inc. are as follows (in thousands):
Balance Sheets
| December 31, | ||||||||
| 2025 | 2024 | |||||||
| Assets | ||||||||
| Cash and cash equivalents | $ | $ | ||||||
| Investment in Quaint Oak Bank | ||||||||
| Total Assets | $ | $ | ||||||
| Liabilities and Stockholders’ Equity | ||||||||
| Senior debt | $ | $ | ||||||
| Subordinated debt | ||||||||
| Other liabilities | ||||||||
| Stockholders’ equity | ||||||||
| Total Liabilities and Stockholders’ Equity | $ | $ | ||||||
Statements of Income
| For the Year Ended December 31, | ||||||||
| 2025 | 2024 | |||||||
| Income | ||||||||
| Dividends from subsidiary | $ | $ | ||||||
| Gain on the sale of 1710 Union Boulevard | ||||||||
| Rental income | ||||||||
| Total Income | ||||||||
| Expenses | ||||||||
| Occupancy and equipment expense | ||||||||
| Interest on senior debt | ||||||||
| Interest on subordinated debt | ||||||||
| Other expenses | ||||||||
| Total Expenses | ||||||||
| Net Income Before Income Taxes | ( | ) | ||||||
| Equity in Undistributed Net Income of Subsidiary, Net of Dividends | ( | ) | ||||||
| Income Tax Benefit | ||||||||
| Net Income | $ | $ | ||||||
| Comprehensive Income | $ | $ | ||||||
Quaint Oak Bancorp, Inc.
Notes to Consolidated Financial Statements (Continued)
Note 22 – Quaint Oak Bancorp, Inc. (Parent Company Only) (Continued)
Statements of Cash Flows
| For the Year Ended December 31, | ||||||||
| 2025 | 2024 | |||||||
| Operating Activities | ||||||||
| Net income | $ | $ | ||||||
| Adjustments to reconcile net income to net cash provided by operating activities: | ||||||||
| Undistributed net income in subsidiary, net of dividends | ( | ) | ||||||
| Depreciation expense | ||||||||
| Amortization of senior debt issuance costs | ||||||||
| Amortization of subordinated debt issuance costs | ( | ) | ||||||
| Stock-based compensation expense | ||||||||
| (Increase) decrease in other assets | ( | ) | 331 | |||||
| Net cash provided by operating activities | ||||||||
| Investing Activities | ||||||||
| Sale of property and equipment | ||||||||
| Net cash provided by investing activities | ||||||||
| Financing Activities | ||||||||
| Dividends paid | ( | ) | ( | ) | ||||
| Proceeds from the issuance of Subordinate Debt | ( | ) | ||||||
| Proceeds from issuance of unallocated shares from authorized shares | ||||||||
| Purchase of treasury stock | ( | ) | ( | ) | ||||
| Proceeds from the reissuance of treasury stock under 401(k) plan | ||||||||
| Net cash (used in) provided by financing activities | ( | ) | ||||||
| Net (Decrease) Increase in Cash and Cash Equivalents | ( | ) | ||||||
| Cash and Cash Equivalents-Beginning of Year | ||||||||
| Cash and Cash Equivalents-End of Year | $ | $ | ||||||
Quaint Oak Bancorp, Inc.
Quaint Oak Bancorp, Inc.