Pay vs Performance Disclosure
|
12 Months Ended |
|
Dec. 31, 2025
USD ($)
|
Dec. 31, 2024
USD ($)
|
Dec. 31, 2023
USD ($)
|
Dec. 31, 2022
USD ($)
|
Dec. 31, 2021
USD ($)
|
| Pay vs Performance Disclosure |
|
|
|
|
|
| Pay vs Performance Disclosure, Table |
| | | | | | | | | | | | | | | | | | | | | | | | | | | | | | Pay vs. Performance Disclosures(1)(2)(8) | | | Year | Summary Compensation Table Total
for PEO
($) | Compensation Actually Paid for PEO(3) ($) | Average Summary
Compensation Table Total for Non-PEO NEOs
($) | Average Compensation Actually Paid for Non-PEO NEOs(4) ($) | Value of Fixed $100 Investment Based On: | Net
Income
($) | Total AFFO per Share(7) ($) | | | | W. P. Carey Total Shareholder Return(5) ($) | MSCI US REIT Index Total Shareholder Return(6) ($) | | | | | | | | | | | | | 2025 | 10,786,686 | | 22,438,754 | | 3,263,737 | | 5,699,233 | | 124.42 | | 137.53 | | 466,359,000 | | 4.97 | | | | 2024 | 10,153,724 | | 3,680,523 | | 3,814,908 | | 1,750,974 | | 99.55 | | 133.59 | | 460,839,000 | | 4.70 | | | | 2023 | 12,990,932 | | 4,687,585 | | 3,889,876 | | 1,917,029 | | 111.34 | | 122.84 | | 708,334,000 | | 5.18 | | | | 2022 | 9,405,063 | | 16,628,053 | | 3,240,587 | | 5,044,873 | | 123.46 | | 108.00 | | 599,139,000 | | 5.29 | | | | 2021 | 10,103,384 | | 13,913,308 | | 3,448,110 | | 4,514,778 | | 122.88 | | 143.06 | | 409,988,000 | | 5.03 | | |
|
|
|
|
|
| Named Executive Officers, Footnote |
Our principal executive officer ("PEO") for FY2021 through FY2025 was Jason E. Fox. Our other, non-PEO, NEOs for FY2021 through FY2025 for whom Summary Compensation total average compensation and other amounts are presented were ToniAnn Sanzone, Brooks G. Gordon, Jeremiah H. Gregory and Gino M. Sabatini.
|
|
|
|
|
| Peer Group Issuers, Footnote |
Peer TSR calculated for the MSCI US REIT Index based on an assumed $100 investment as of December 31, 2019 and the reinvestment of any issued dividends.
|
|
|
|
|
| PEO Total Compensation Amount |
$ 10,786,686
|
$ 10,153,724
|
$ 12,990,932
|
$ 9,405,063
|
$ 10,103,384
|
| PEO Actually Paid Compensation Amount |
$ 22,438,754
|
3,680,523
|
4,687,585
|
16,628,053
|
13,913,308
|
| Adjustment To PEO Compensation, Footnote |
The following table sets forth the adjustments made during 2025 represented in the Pay Versus Performance Table to arrive at compensation "actually paid" to our PEO during 2025. No adjustments were made pursuant to defined benefit or actuarial pension plans, and such line items have been excluded from the table below: | | | | | | | | | | PEO "Compensation Actually Paid" Calculation Detail | | Compensation Element | 2025 ($) | | | | | Summary Compensation table Reported Total Compensation | 10,786,686 | | | Aggregate Summary Compensation table Reported Equity Compensation (-) | (7,986,686) | | | | Year-End Fair Value of Awards Granted During the FY & Outstanding (+) | 12,732,647 | | | | Year-Over-Year Change in Fair Value of Awards Granted During Prior FY & Outstanding (+/-) | 5,729,208 | | | | Vesting Date Fair Value of Awards Granted & Vested During the Covered FY (+) | — | | | | Year-Over-Year Change in Fair Value of Awards Granted During Prior FY & Vesting During Covered FY (+/-) | 239,241 | | | | Prior FYE Value of Awards Determined to Fail to Meet Vesting Conditions During Covered FY (-) | — | | | | Value of Dividends or Other Earnings Paid on Stock Awards Not Otherwise Included (+) | 937,658 | | | | "Compensation Actually Paid" Determination | 22,438,754 | | |
|
|
|
|
|
| Non-PEO NEO Average Total Compensation Amount |
$ 3,263,737
|
3,814,908
|
3,889,876
|
3,240,587
|
3,448,110
|
| Non-PEO NEO Average Compensation Actually Paid Amount |
$ 5,699,233
|
1,750,974
|
1,917,029
|
5,044,873
|
4,514,778
|
| Adjustment to Non-PEO NEO Compensation Footnote |
The following table sets forth the adjustments made during 2025 represented in the Pay Versus Performance Table to arrive at compensation "actually paid" to our non-PEO NEOs during 2025: | | | | | | | | | | Average Non-PEO NEO "Compensation Actually Paid" Calculation Detail | | Compensation Element | 2025 ($) | | | | | Summary Compensation table Reported Total Compensation | 3,263,737 | | | Aggregate Summary Compensation table Reported Equity Compensation (-) | (1,741,563) | | | | Year-End Fair Value of Awards Granted During the FY & Outstanding (+) | 2,775,422 | | | | Year-Over-Year Change in Fair Value of Awards Granted During Prior FY & Outstanding (+/-) | 1,148,949 | | | | Vesting Date Fair Value of Awards Granted & Vested During the Covered FY (+) | — | | | | Year-Over-Year Change in Fair Value of Awards Granted During Prior FY & Vesting During Covered FY (+/-) | 54,589 | | | | Prior FYE Value of Awards Determined to Fail to Meet Vesting Conditions During Covered FY (-) | — | | | | Value of Dividends or Other Earnings Paid on Stock Awards Not Otherwise Included (+) | 198,099 | | | | "Compensation Actually Paid" Determination | 5,699,233 | | |
|
|
|
|
|
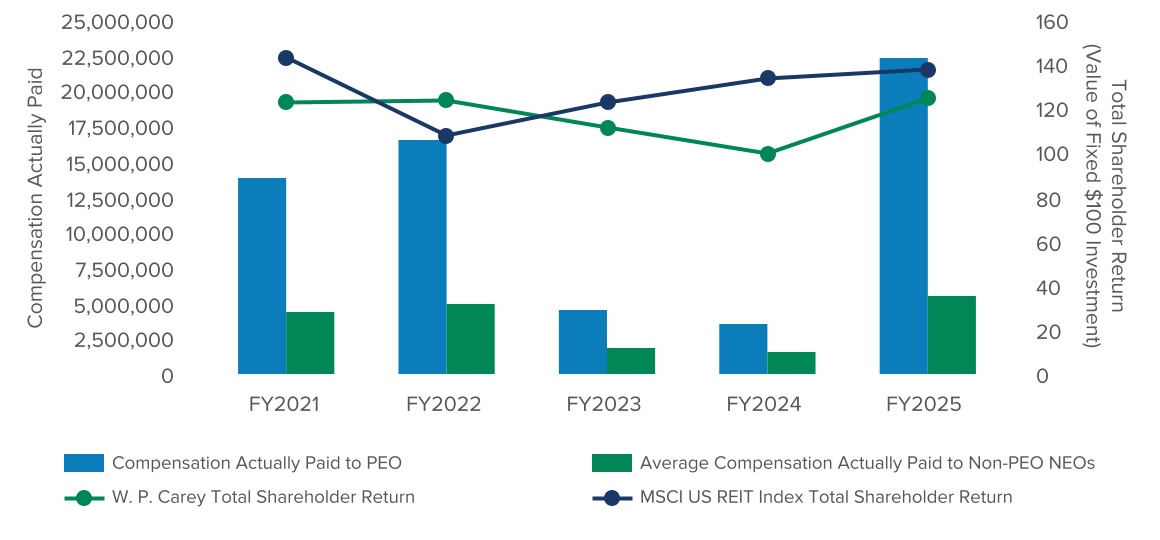
| Compensation Actually Paid vs. Total Shareholder Return |
Compensation Actually Paid vs. TSR
|
|
|
|
|
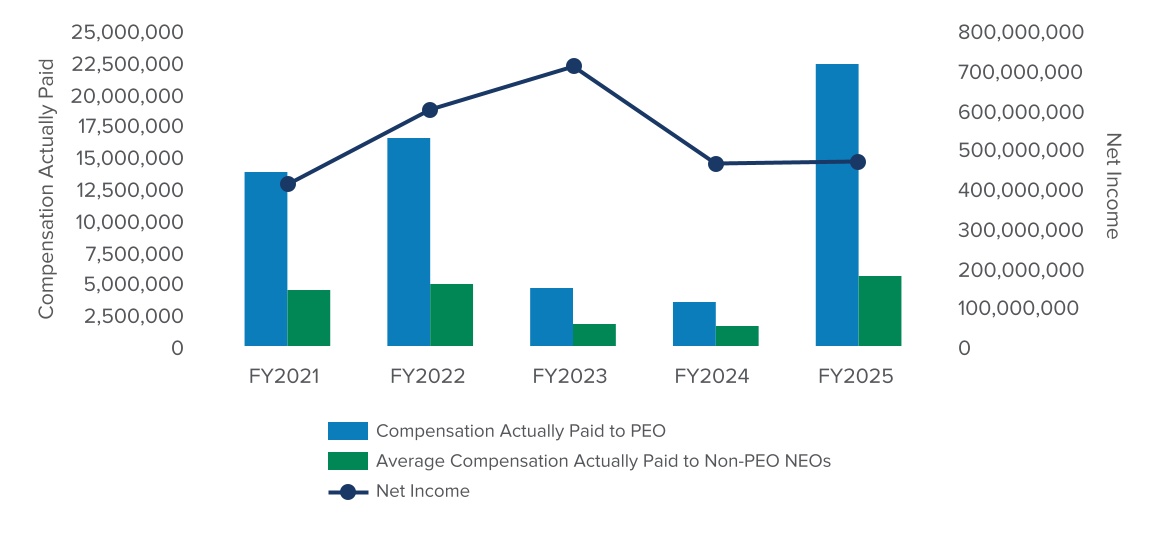
| Compensation Actually Paid vs. Net Income |
Compensation Actually Paid vs. Net Income
|
|
|
|
|
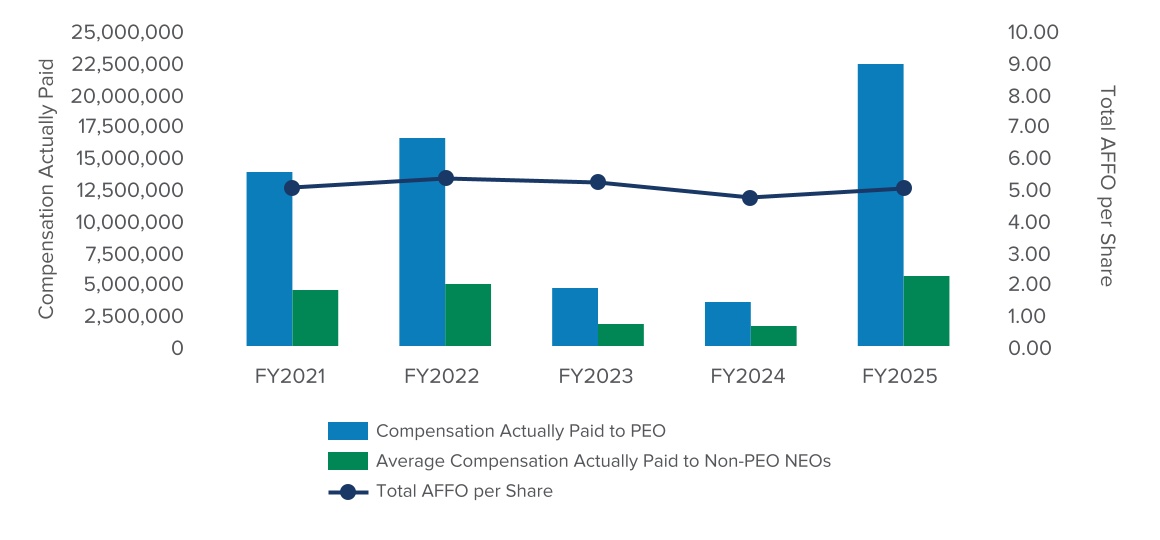
| Compensation Actually Paid vs. Company Selected Measure |
Compensation Actually Paid vs. Total AFFO(1) per Share 1.See Appendix A for a description of this non-GAAP financial measure.
|
|
|
|
|
| Total Shareholder Return Vs Peer Group |
Compensation Actually Paid vs. TSR
|
|
|
|
|
| Tabular List, Table |
| | | Performance Metric Tabular Disclosure | | Total Adjusted Funds from Operations ("Total AFFO") per Share(1) | Total Shareholder Return | Net Debt to Adjusted EBITDA(1) | Cash Interest Expense Coverage Ratio(1) | Investment Volume(2) |
|
|
|
|
|
| Total Shareholder Return Amount |
$ 124.42
|
99.55
|
111.34
|
123.46
|
122.88
|
| Peer Group Total Shareholder Return Amount |
137.53
|
133.59
|
122.84
|
108.00
|
143.06
|
| Net Income (Loss) |
$ 466,359,000
|
$ 460,839,000
|
$ 708,334,000
|
$ 599,139,000
|
$ 409,988,000
|
| Company Selected Measure Amount |
4.97
|
4.70
|
5.18
|
5.29
|
5.03
|
| PEO Name |
Jason E. Fox
|
|
|
|
|
| Additional 402(v) Disclosure |
Equity compensation fair value calculated based on assumptions determined in accordance with FASB ASC Topic 718. No adjustments were made to Summary Compensation disclosed compensation values pursuant to any defined benefit or actuarial pension plans. W. P. Carey TSR calculated based on an assumed $100 investment as of December 31, 2019, and the reinvestment of any issued dividends. See Appendix A for a description of these non-GAAP financial measures. 8.In connection with the Spin-Off, each RSU and PSU outstanding at November 1, 2023, received an equitable adjustment pursuant to the equitable adjustment provision of the 2017 SIP equal to the ratio of the five-day volume weighted-average per-share price of our common stock prior to the Spin-Off divided by the five-day volume weighted-average per-share price of our common stock following the Spin-Off. See Appendix A for a description of this non-GAAP financial measure.2.This metric only impacts Mr. Sabatini's compensation performance.
|
|
|
|
|
| Measure:: 1 |
|
|
|
|
|
| Pay vs Performance Disclosure |
|
|
|
|
|
| Name |
Total Adjusted Funds from Operations ("Total AFFO") per Share(1)
|
|
|
|
|
| Non-GAAP Measure Description |
Our Compensation Committee reviews a variety of Company-wide and individual factors to link executive compensation actually paid with Company and executive performance. To promote strong pay-for-performance orientation, when setting executive pay levels, the Compensation Committee considers the Company's absolute and relative TSR, short- and long-term business outlook, including Total AFFO(7) per share, and the broader market environment. The following section provides a description of the relationships between W. P. Carey's TSR relative to a peer comparison index and compensation actually paid relative to W. P. Carey's TSR, net income and Total AFFO(7) per share over the last four completed fiscal years.
|
|
|
|
|
| Measure:: 2 |
|
|
|
|
|
| Pay vs Performance Disclosure |
|
|
|
|
|
| Name |
Total Shareholder Return
|
|
|
|
|
| Measure:: 3 |
|
|
|
|
|
| Pay vs Performance Disclosure |
|
|
|
|
|
| Name |
Net Debt to Adjusted EBITDA(1)
|
|
|
|
|
| Measure:: 4 |
|
|
|
|
|
| Pay vs Performance Disclosure |
|
|
|
|
|
| Name |
Cash Interest Expense Coverage Ratio(1)
|
|
|
|
|
| Measure:: 5 |
|
|
|
|
|
| Pay vs Performance Disclosure |
|
|
|
|
|
| Name |
Investment Volume(2)
|
|
|
|
|
| PEO | Aggregate Grant Date Fair Value of Equity Award Amounts Reported in Summary Compensation Table |
|
|
|
|
|
| Pay vs Performance Disclosure |
|
|
|
|
|
| Adjustment to Compensation, Amount |
$ (7,986,686)
|
|
|
|
|
| PEO | Year-end Fair Value of Equity Awards Granted in Covered Year that are Outstanding and Unvested |
|
|
|
|
|
| Pay vs Performance Disclosure |
|
|
|
|
|
| Adjustment to Compensation, Amount |
12,732,647
|
|
|
|
|
| PEO | Year-over-Year Change in Fair Value of Equity Awards Granted in Prior Years That are Outstanding and Unvested |
|
|
|
|
|
| Pay vs Performance Disclosure |
|
|
|
|
|
| Adjustment to Compensation, Amount |
5,729,208
|
|
|
|
|
| PEO | Vesting Date Fair Value of Equity Awards Granted and Vested in Covered Year |
|
|
|
|
|
| Pay vs Performance Disclosure |
|
|
|
|
|
| Adjustment to Compensation, Amount |
0
|
|
|
|
|
| PEO | Change in Fair Value as of Vesting Date of Prior Year Equity Awards Vested in Covered Year |
|
|
|
|
|
| Pay vs Performance Disclosure |
|
|
|
|
|
| Adjustment to Compensation, Amount |
239,241
|
|
|
|
|
| PEO | Prior Year End Fair Value of Equity Awards Granted in Any Prior Year that Fail to Meet Applicable Vesting Conditions During Covered Year |
|
|
|
|
|
| Pay vs Performance Disclosure |
|
|
|
|
|
| Adjustment to Compensation, Amount |
0
|
|
|
|
|
| PEO | Dividends or Other Earnings Paid on Equity Awards not Otherwise Reflected in Total Compensation for Covered Year |
|
|
|
|
|
| Pay vs Performance Disclosure |
|
|
|
|
|
| Adjustment to Compensation, Amount |
937,658
|
|
|
|
|
| Non-PEO NEO | Aggregate Grant Date Fair Value of Equity Award Amounts Reported in Summary Compensation Table |
|
|
|
|
|
| Pay vs Performance Disclosure |
|
|
|
|
|
| Adjustment to Compensation, Amount |
(1,741,563)
|
|
|
|
|
| Non-PEO NEO | Year-end Fair Value of Equity Awards Granted in Covered Year that are Outstanding and Unvested |
|
|
|
|
|
| Pay vs Performance Disclosure |
|
|
|
|
|
| Adjustment to Compensation, Amount |
2,775,422
|
|
|
|
|
| Non-PEO NEO | Year-over-Year Change in Fair Value of Equity Awards Granted in Prior Years That are Outstanding and Unvested |
|
|
|
|
|
| Pay vs Performance Disclosure |
|
|
|
|
|
| Adjustment to Compensation, Amount |
1,148,949
|
|
|
|
|
| Non-PEO NEO | Vesting Date Fair Value of Equity Awards Granted and Vested in Covered Year |
|
|
|
|
|
| Pay vs Performance Disclosure |
|
|
|
|
|
| Adjustment to Compensation, Amount |
0
|
|
|
|
|
| Non-PEO NEO | Change in Fair Value as of Vesting Date of Prior Year Equity Awards Vested in Covered Year |
|
|
|
|
|
| Pay vs Performance Disclosure |
|
|
|
|
|
| Adjustment to Compensation, Amount |
54,589
|
|
|
|
|
| Non-PEO NEO | Prior Year End Fair Value of Equity Awards Granted in Any Prior Year that Fail to Meet Applicable Vesting Conditions During Covered Year |
|
|
|
|
|
| Pay vs Performance Disclosure |
|
|
|
|
|
| Adjustment to Compensation, Amount |
0
|
|
|
|
|
| Non-PEO NEO | Dividends or Other Earnings Paid on Equity Awards not Otherwise Reflected in Total Compensation for Covered Year |
|
|
|
|
|
| Pay vs Performance Disclosure |
|
|
|
|
|
| Adjustment to Compensation, Amount |
$ 198,099
|
|
|
|
|