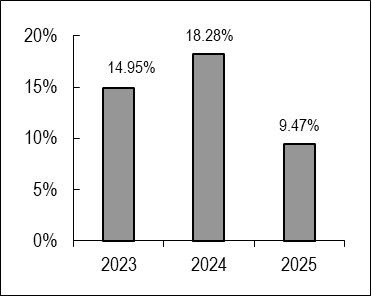
The bar chart and table that follow provide some indication of the risks of investing in the Fund by showing changes in the Fund’s performance from year to year and by showing how the Fund’s average annual returns for 1 year and since-inception periods compared with those of a broad measure of market performance. Please remember that the Fund’s past performance (before and after taxes) is not necessarily an indication of how the Fund will perform in the future. Performance information, current through the most recent month end, is available by calling 833-601-2676 or by visiting the Fund’s website at www.connorsinvestor.com/mutual-funds.
| Highest Quarter: | 12/31/2023 | 8.98% |
| Lowest Quarter: | 03/31/2025 | -3.32% |
| Class I Shares | One Year |
Since Inception(1) |
| Return Before Taxes | 9.47% | 9.31% |
| Returns After Taxes on Distributions | 9.38% | 9.12% |
| Returns After Taxes on Distributions and Sale of Fund Shares | 5.67% | 7.28% |
| S&P 500® Total Return Index(2) | 17.88% | 12.67% |
| CBOE S&P 500® BuyWrite Index(3) | 8.91% | 7.35% |
| (1) | The Fund commenced operations on January 19, 2022. | |
| (2) | The S&P 500® Total Return Index is a widely recognized unmanaged index of equity prices and is representative of a broader market and range of securities than is found in the Fund’s portfolio. The index is an unmanaged benchmark that assumes reinvestment of all distributions and excludes the effect of taxes and fees. Investors cannot invest directly in an index. | |
| (3) | The CBOE S&P 500 BuyWrite IndexSM (BXM) is a passive total return index based on (1) buying an S&P 500 stock index portfolio, and (2) “writing” (or selling) the near-term S&P 500 Index (SPXSM) “covered” call option, generally on the third Friday of each month. An investor cannot invest directly in an index. |
After-tax returns are based on the highest historical individual U.S. federal marginal income tax rates, and do not reflect the impact of state and local taxes; actual after-tax returns depend on an individual investor’s tax situation and may differ from those shown. If you own shares of the Fund in a tax-deferred account, such as an individual retirement account (“IRA”) or a 401(k) plan, after-tax returns are not applicable to your investment. A higher after-tax return results when a capital loss occurs upon redemption and translates into an assumed tax deduction that benefits the shareholder.