Pay vs Performance Disclosure - USD ($)
Dec. 31, 2025
Dec. 31, 2024
Dec. 31, 2023
Pay Versus Performance Table
| Year | Summary compensation table total for PEO (1) | Compensation actually paid to PEO (1) | Average summary compensation table total for non-PEO NEOs (2) | Average compensation actually paid to non-PEO NEOs (2) | Total shareholder return (3) | Net income (in thousands) | ||||||||||||||
| 2025 | $ | 1,237,359 | $ | 3,788,386 | $ | 1,015,192 | $ | 2,287,174 | $ | 156 | $ | 19,369 | ||||||||
| 2024 | $ | 1,739,079 | $ | 2,743,670 | $ | 1,039,647 | $ | 1,752,139 | $ | 117 | $ | 28,903 | ||||||||
| 2023 | $ | 1,484,267 | $ | 3,910,533 | $ | 879,832 | $ | 2,604,177 | $ | 168 | $ | 26,323 | ||||||||
Adjustments from Total Compensation to Compensation Actually Paid
The following tables present the requisite adjustments from total compensation, as reported in the Summary Compensation Table, to calculate Compensation Actually Paid to our CEO and other NEO for the fiscal years ended December 31, 2025, 2024 and 2023.
| Summary Compensation Table to Compensation Actually Paid to our PEO | 2025 | 2024 | 2023 | |||||||||||||||||
| Summary Compensation Table - Total Compensation | $ | 1,237,359 | $ | 1,739,079 | $ | 1,484,267 | ||||||||||||||
| — | Grant Date Fair Value of Equity Awards Granted in Fiscal Year | — | (448,460) | (399,994) | ||||||||||||||||
| + | Fair Value at Fiscal Year-End of Outstanding and Unvested Equity Awards | 1,712,831 | 1,329,338 | 1,893,923 | ||||||||||||||||
| + | Fair value of awards that vested during the year, measured at vesting date | 145,673 | 435,460 | 383,328 | ||||||||||||||||
| + | Change in Fair Value of Outstanding and Unvested Equity Awards Granted in Prior Fiscal Years | 692,523 | (311,746) | 549,009 | ||||||||||||||||
| + | Dividends or dividend equivalents paid on unvested awards, if not already included in SCT | — | — | — | ||||||||||||||||
| Compensation Actually Paid | $ | 3,788,386 | $ | 2,743,670 | $ | 3,910,533 | ||||||||||||||
| Summary Compensation Table to Compensation Actually Paid to non-PEO NEO | 2025 | 2024 | 2023 | ||||||||||||||
| Summary Compensation Table - Total Compensation | $ | 1,015,192 | $ | 1,039,647 | $ | 879,832 | |||||||||||
| — | Grant Date Fair Value of Equity Awards Granted in Fiscal Year | (254,068) | (236,971) | (212,498) | |||||||||||||
| + | Fair Value at Fiscal Year-End of Outstanding and Unvested Equity Awards | 1,050,156 | 842,263 | 1,366,609 | |||||||||||||
| + | Fair value of awards that vested during the year, measured at vesting date | 98,680 | 338,659 | 310,157 | |||||||||||||
| + | Change in Fair Value of Outstanding and Unvested Equity Awards Granted in Prior Fiscal Years | 377,214 | (231,458) | 260,077 | |||||||||||||
| + | Dividends or dividend equivalents paid on unvested awards, if not already included in SCT | — | — | — | |||||||||||||
| Compensation Actually Paid | $ | 2,287,174 | $ | 1,752,139 | $ | 2,604,177 | |||||||||||
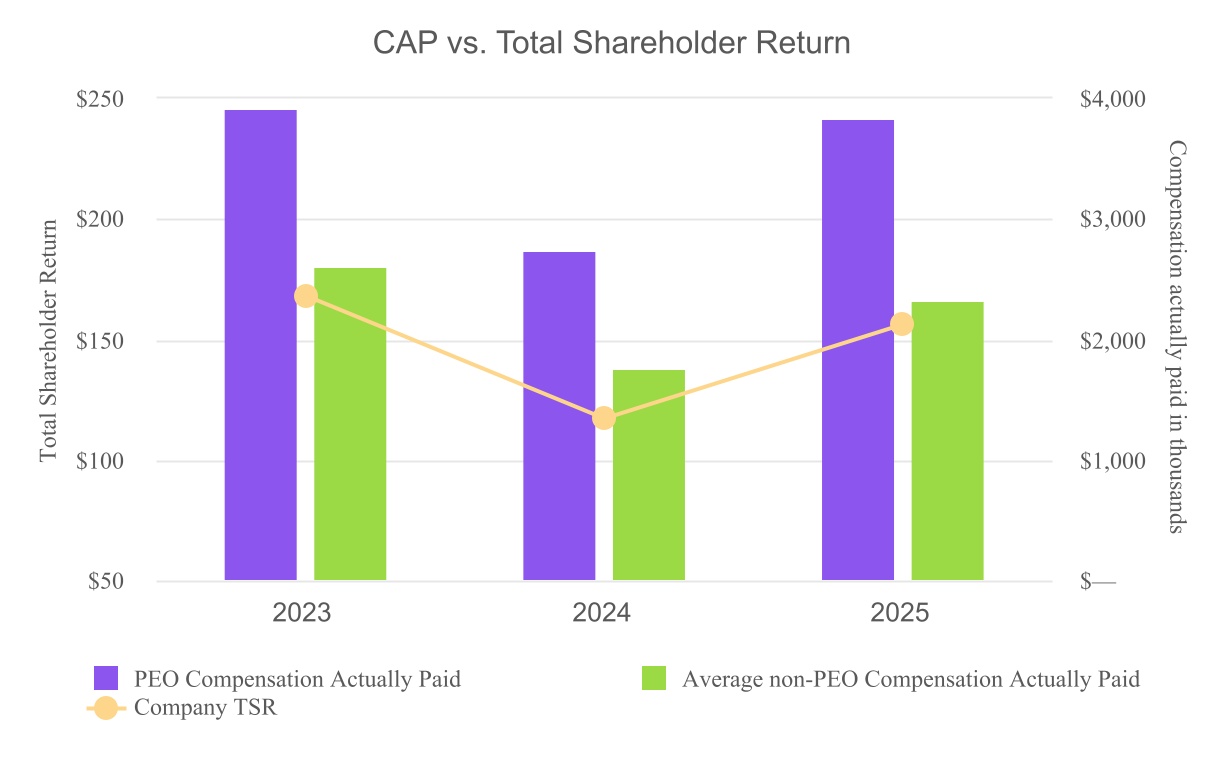
The following graph illustrates the relationship between (i) the Compensation Actually Paid (“CAP”) to our Principal Executive Officer (“PEO”) and the average CAP to our non-PEO named executive officers (“NEOs”) and (ii) the Company’s cumulative total shareholder return (“TSR”), assuming an initial investment of $100 on December 31, 2022 and the reinvestment of all dividends, for the fiscal years ended December 31, 2023, 2024 and 2025. CAP amounts presented in the graph are expressed in thousands of dollars.
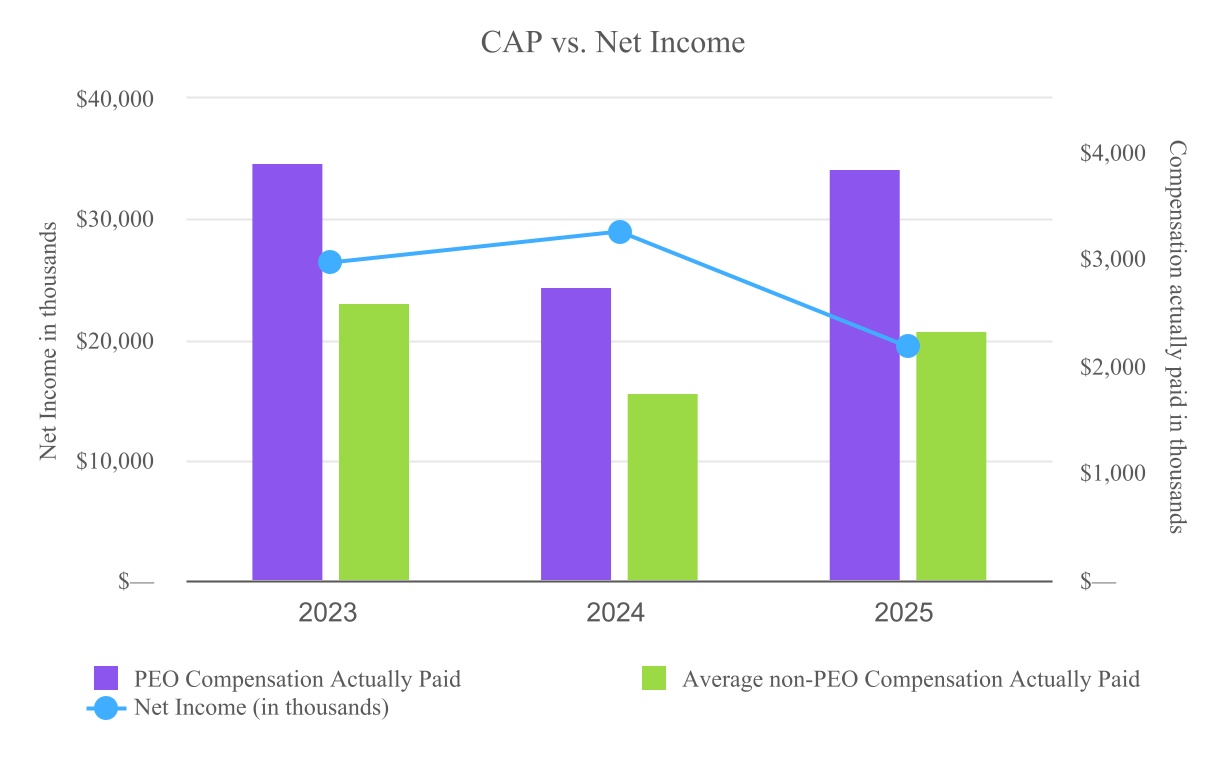
The graph below illustrates the relationship between the PEO and average Non-PEO NEO CAP amounts and the Company’s net income for the fiscal years ended December 31, 2023, 2024, and 2025. Net income and CAP amounts for the PEO and average Non-PEO NEOs are presented in thousands of dollars.
Pay Versus Performance
As required by the Dodd-Frank Wall Street Reform and Consumer Protection Act and SEC rules, we are providing the following information about the relationship of executive compensation actually paid (“Compensation Actually Paid”) or ("CAP") and certain financial performance of our Company. The following table shows the total compensation for our Named Executive Officers ("NEOs") NEOs for the past two fiscal years as set forth in the Summary Compensation Table, the Compensation Actually Paid to our CEO (also referred to as the principal executive officer or “PEO”) and our other non-PEO NEOs, our total shareholder return on a $100 hypothetical investment in our common stock and our net income.
The CAP for the PEO and the average non-PEO NEOs is calculated by taking the Summary Compensation Table values: a) less the grant value of equity granted during the year; b) plus the year-end fair value of unvested equity awards granted during the year; c) plus, for awards granted in prior years that are outstanding and unvested at the end of the year, the difference between the year-end fair value and the immediately prior year-end fair value; d) plus, for awards granted in prior years that vested during the year, the difference between the fair value as of the vesting date and the immediately prior year-end fair value; The tables below illustrate the CAP for the PEO and average non-PEO NEO's.
Financial Performance Measures.
The most important financial performance measures used by the Company to link executive compensation actually paid to the Company’s NEOs, for the most recently completed fiscal year, to the Company’s performance are as follows:
•Adjusted EBITDA
•Cash Flow from Operations
•Vessel TCE