Performance Management
|
Nov. 30, 2025 |
| Bancreek U.S. Large Cap ETF |
|
| Prospectus [Line Items] |
|
| Bar Chart and Performance Table [Heading] |
Performance Information
|
| Performance Narrative [Text Block] |
The following bar chart and table provide some
indication of the risks of investing in the Fund by showing changes in the Fund’s performance from year to year and by showing
how the Fund’s average annual returns for certain time periods compare with the average annual total returns of the S&P 500®
Index, a broad-based securities market index. The S&P 500® Index is considered representative of the U.S. equity market.
All returns assume reinvestment of dividends and distributions. The Fund’s past performance (before and after taxes) is not necessarily
an indication of how the Fund will perform in the future. Updated performance information is available at www.bancreeketfs.com./bcus,
or by calling toll-free 833-442-3223.
|
| Performance Past Does Not Indicate Future [Text] |
The Fund’s past performance (before and after taxes) is not necessarily
an indication of how the Fund will perform in the future.
|
| Performance Information Illustrates Variability of Returns [Text] |
The following bar chart and table provide some
indication of the risks of investing in the Fund by showing changes in the Fund’s performance from year to year and by showing
how the Fund’s average annual returns for certain time periods compare with the average annual total returns of the S&P 500®
Index, a broad-based securities market index.
|
| Bar Chart [Heading] |
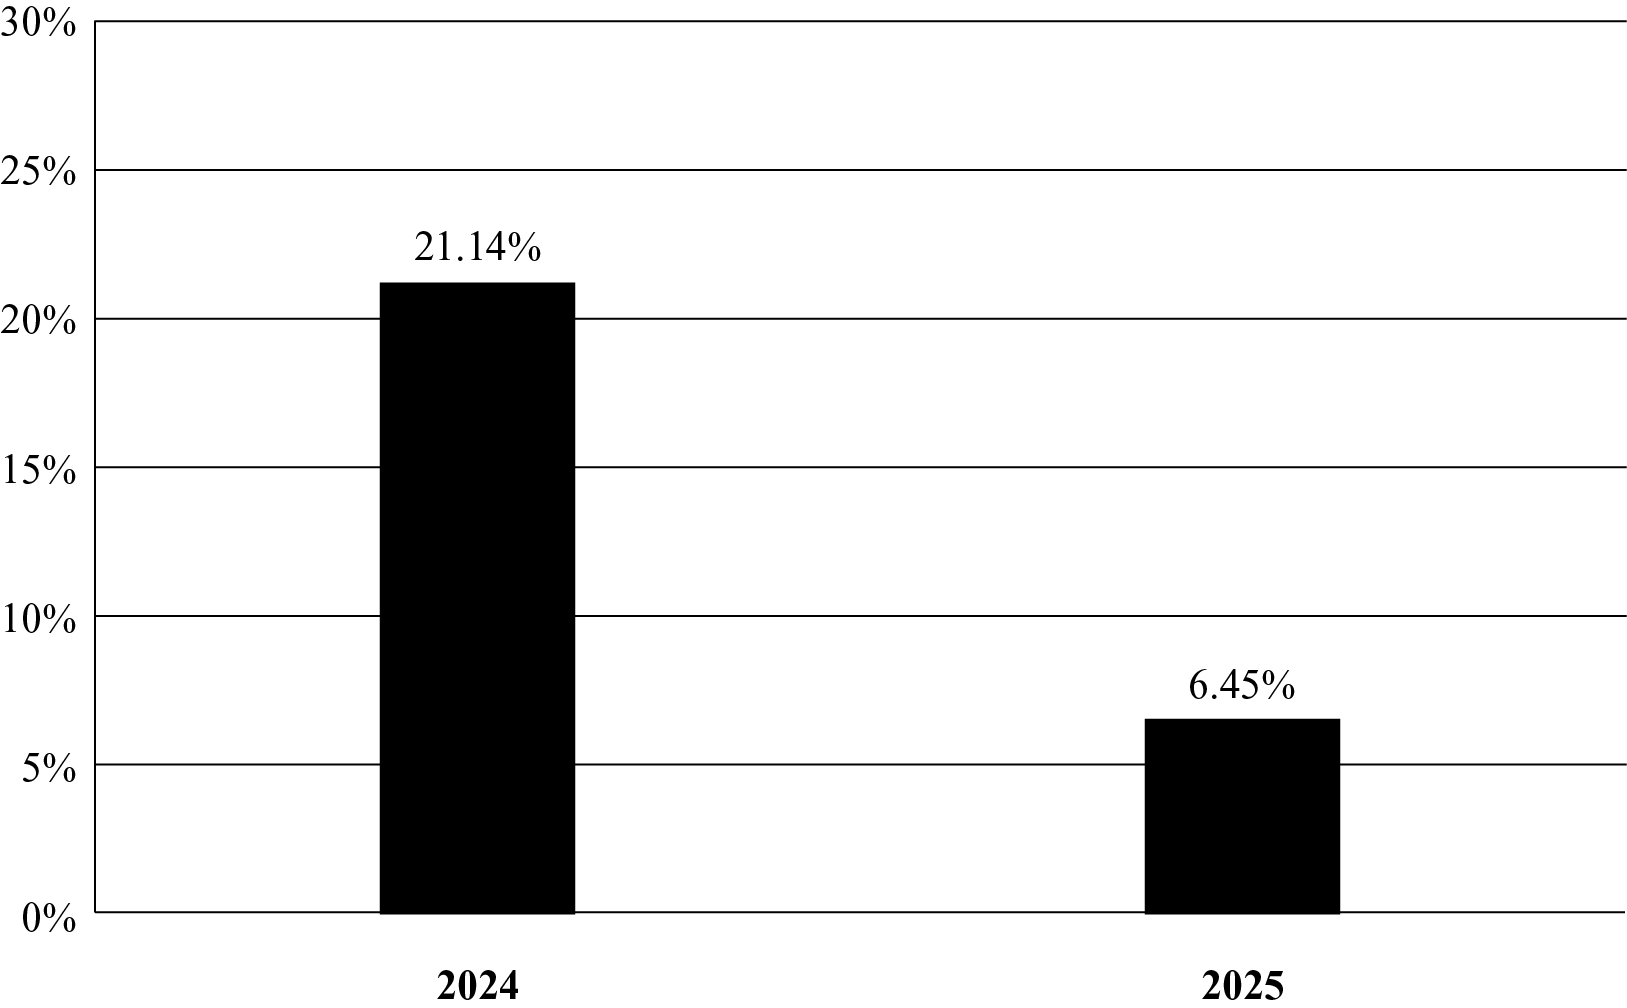
Annual Total Returns as of 12/31
|
| Bar Chart [Table] |
|
| Bar Chart Closing [Text Block] |
Best and Worst Quarter Returns (for the period reflected in the
bar chart above)
| | Return | Quarter/Year | | Highest Return | 14.23% | Q1/2024 | | Lowest Return | -3.51% | Q1/2025 |
|
| Highest Quarterly Return, Label [Optional Text] |
Highest Return
|
| Highest Quarterly Return |
14.23%
|
| Highest Quarterly Return, Date |
Mar. 31, 2024
|
| Lowest Quarterly Return, Label [Optional Text] |
Lowest Return
|
| Lowest Quarterly Return |
(3.51%)
|
| Lowest Quarterly Return, Date |
Mar. 31, 2025
|
| Performance Table Heading |
Average Annual Total Returns for the Periods Ended December 31,
2025
|
| Performance Table Uses Highest Federal Rate |
After-tax returns are calculated using the highest
historical individual federal marginal income tax rates and do not reflect the impact of state and local taxes.
|
| Performance Table Not Relevant to Tax Deferred |
After-tax returns shown are not relevant to investors who hold
their shares through tax-deferred arrangements, such as 401(k) plans or individual retirement accounts.
|
| Performance Table Explanation after Tax Higher |
In some cases, the return after
taxes may exceed the return before taxes due to an assumed tax benefit from any losses on a sale of shares of the Fund at the end of the
measurement period.
|
| Performance [Table] |
| Bancreek U.S. Large Cap ETF | 1 Year | Since Inception
(12/20/23) | | Return Before Taxes | 6.45% | 14.36% | | Return After Taxes on Distributions | 6.33% | 14.26% | | Return After Taxes on Distributions and Sale of Fund Shares | 3.90% | 11.11% | | S&P 500® Index (reflects no deduction for fees, expenses, or taxes) | 17.88% | 21.97% |
|
| Index No Deduction for Fees, Expenses, or Taxes [Text] |
reflects no deduction for fees, expenses, or taxes
|
| Performance Table Closing [Text Block] |
After-tax returns are calculated using the highest
historical individual federal marginal income tax rates and do not reflect the impact of state and local taxes. Your actual after-tax
returns will depend on your tax situation and may differ from those shown. After-tax returns shown are not relevant to investors who hold
their shares through tax-deferred arrangements, such as 401(k) plans or individual retirement accounts. In some cases, the return after
taxes may exceed the return before taxes due to an assumed tax benefit from any losses on a sale of shares of the Fund at the end of the
measurement period.
|
| Performance Availability Website Address [Text] |
www.bancreeketfs.com./bcus
|
| Performance Availability Phone [Text] |
833-442-3223
|
| Bancreek International Large Cap ETF |
|
| Prospectus [Line Items] |
|
| Bar Chart and Performance Table [Heading] |
Performance Information
|
| Performance Narrative [Text Block] |
The following bar chart and table provide
some indication of the risks of investing in the Fund by showing changes in the Fund’s performance from year to year and by showing
how the Fund’s average annual returns for certain time periods compare with the average annual total returns of the MSCI WORLD
ex USA Index, a broad-based securities market index. All returns assume reinvestment of dividends and distributions. The Fund’s
past performance (before and after taxes) is not necessarily an indication of how the Fund will perform in the future. Updated performance
information is available at www.bancreeketfs.com./bcil, or by calling toll-free 833-442-3223.
|
| Performance Past Does Not Indicate Future [Text] |
The Fund’s
past performance (before and after taxes) is not necessarily an indication of how the Fund will perform in the future.
|
| Performance Information Illustrates Variability of Returns [Text] |
The following bar chart and table provide
some indication of the risks of investing in the Fund by showing changes in the Fund’s performance from year to year and by showing
how the Fund’s average annual returns for certain time periods compare with the average annual total returns of the MSCI WORLD
ex USA Index, a broad-based securities market index.
|
| Bar Chart [Heading] |
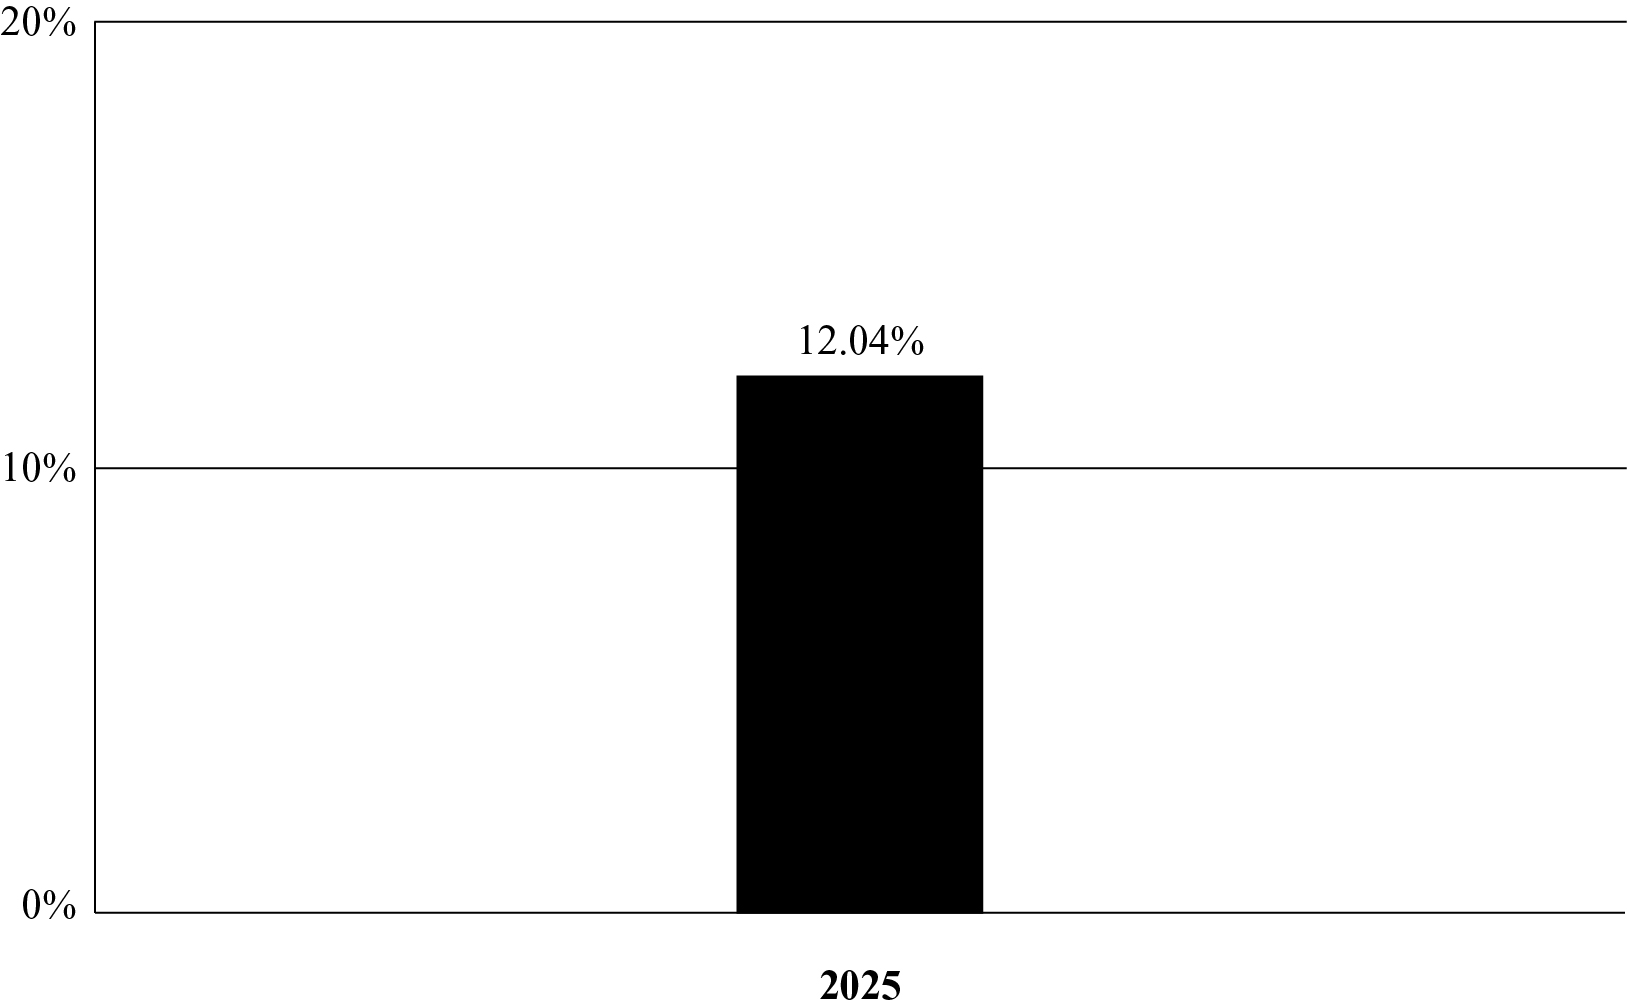
Annual Total Returns as of 12/31
|
| Bar Chart [Table] |
|
| Bar Chart Closing [Text Block] |
Best and Worst Quarter Returns (for the period reflected in
the bar chart above)
| | Return | Quarter/Year | | Highest Return | 15.94% | Q2/2025 | | Lowest Return | -4.81% | Q3/2025 |
|
| Highest Quarterly Return, Label [Optional Text] |
Highest Return
|
| Highest Quarterly Return |
15.94%
|
| Highest Quarterly Return, Date |
Jun. 30, 2025
|
| Lowest Quarterly Return, Label [Optional Text] |
Lowest Return
|
| Lowest Quarterly Return |
(4.81%)
|
| Lowest Quarterly Return, Date |
Sep. 30, 2025
|
| Performance Table Heading |
Average Annual Total Returns for the Periods Ended December 31,
2025
|
| Performance Table Uses Highest Federal Rate |
After-tax returns are calculated using the
highest historical individual federal marginal income tax rates and do not reflect the impact of state and local taxes.
|
| Performance Table Not Relevant to Tax Deferred |
After-tax returns shown are not relevant to investors who
hold their shares through tax-deferred arrangements, such as 401(k) plans or individual retirement accounts.
|
| Performance Table Explanation after Tax Higher |
In some cases, the return
after taxes may exceed the return before taxes due to an assumed tax benefit from any losses on a sale of shares of the Fund at the end
of the measurement period.
|
| Performance [Table] |
| Bancreek International Large Cap ETF | 1 Year | Since Inception
(3/20/24) | | Return Before Taxes | 12.04% | 7.47% | | Return After Taxes on Distributions | 11.89% | 7.26% | | Return After Taxes on Distributions and Sale of Fund Shares | 7.45% | 5.77% | | MSCI WORLD ex USA Index (reflects no deduction for fees, expenses, or taxes) | 31.85% | 16.97% |
|
| Index No Deduction for Fees, Expenses, or Taxes [Text] |
reflects no deduction for fees, expenses, or taxes
|
| Performance Table Closing [Text Block] |
After-tax returns are calculated using the
highest historical individual federal marginal income tax rates and do not reflect the impact of state and local taxes. Your actual after-tax
returns will depend on your tax situation and may differ from those shown. After-tax returns shown are not relevant to investors who
hold their shares through tax-deferred arrangements, such as 401(k) plans or individual retirement accounts. In some cases, the return
after taxes may exceed the return before taxes due to an assumed tax benefit from any losses on a sale of shares of the Fund at the end
of the measurement period.
|
| Performance Availability Website Address [Text] |
www.bancreeketfs.com./bcil
|
| Performance Availability Phone [Text] |
833-442-3223
|
| Saba Closed-End Funds ETF |
|
| Prospectus [Line Items] |
|
| Bar Chart and Performance Table [Heading] |
Performance Information
|
| Performance Narrative [Text Block] |
The following bar chart and table provide some
indication of the risks of investing in the Fund by showing changes in the Fund’s performance from year to year and by showing
how the Fund’s average annual returns for certain time periods compare with the average annual total returns of the S&P 500®
Index, a broad-based securities market index, and iBoxx Liquid High Yield Index. The S&P 500® Index is considered
representative of the U.S. equity market, and the iBoxx Liquid High Yield Index is considered representative of the high yield corporate
bond market. All returns assume reinvestment of dividends and distributions. The Fund’s past performance (before and after taxes)
is not necessarily an indication of how the Fund will perform in the future. Updated performance information is available online at www.sabaetf.com
or by calling collect 1-888-615-4310.
|
| Performance Past Does Not Indicate Future [Text] |
The Fund’s past performance (before and after taxes)
is not necessarily an indication of how the Fund will perform in the future.
|
| Performance Information Illustrates Variability of Returns [Text] |
The following bar chart and table provide some
indication of the risks of investing in the Fund by showing changes in the Fund’s performance from year to year and by showing
how the Fund’s average annual returns for certain time periods compare with the average annual total returns of the S&P 500®
Index, a broad-based securities market index, and iBoxx Liquid High Yield Index.
|
| Bar Chart [Heading] |
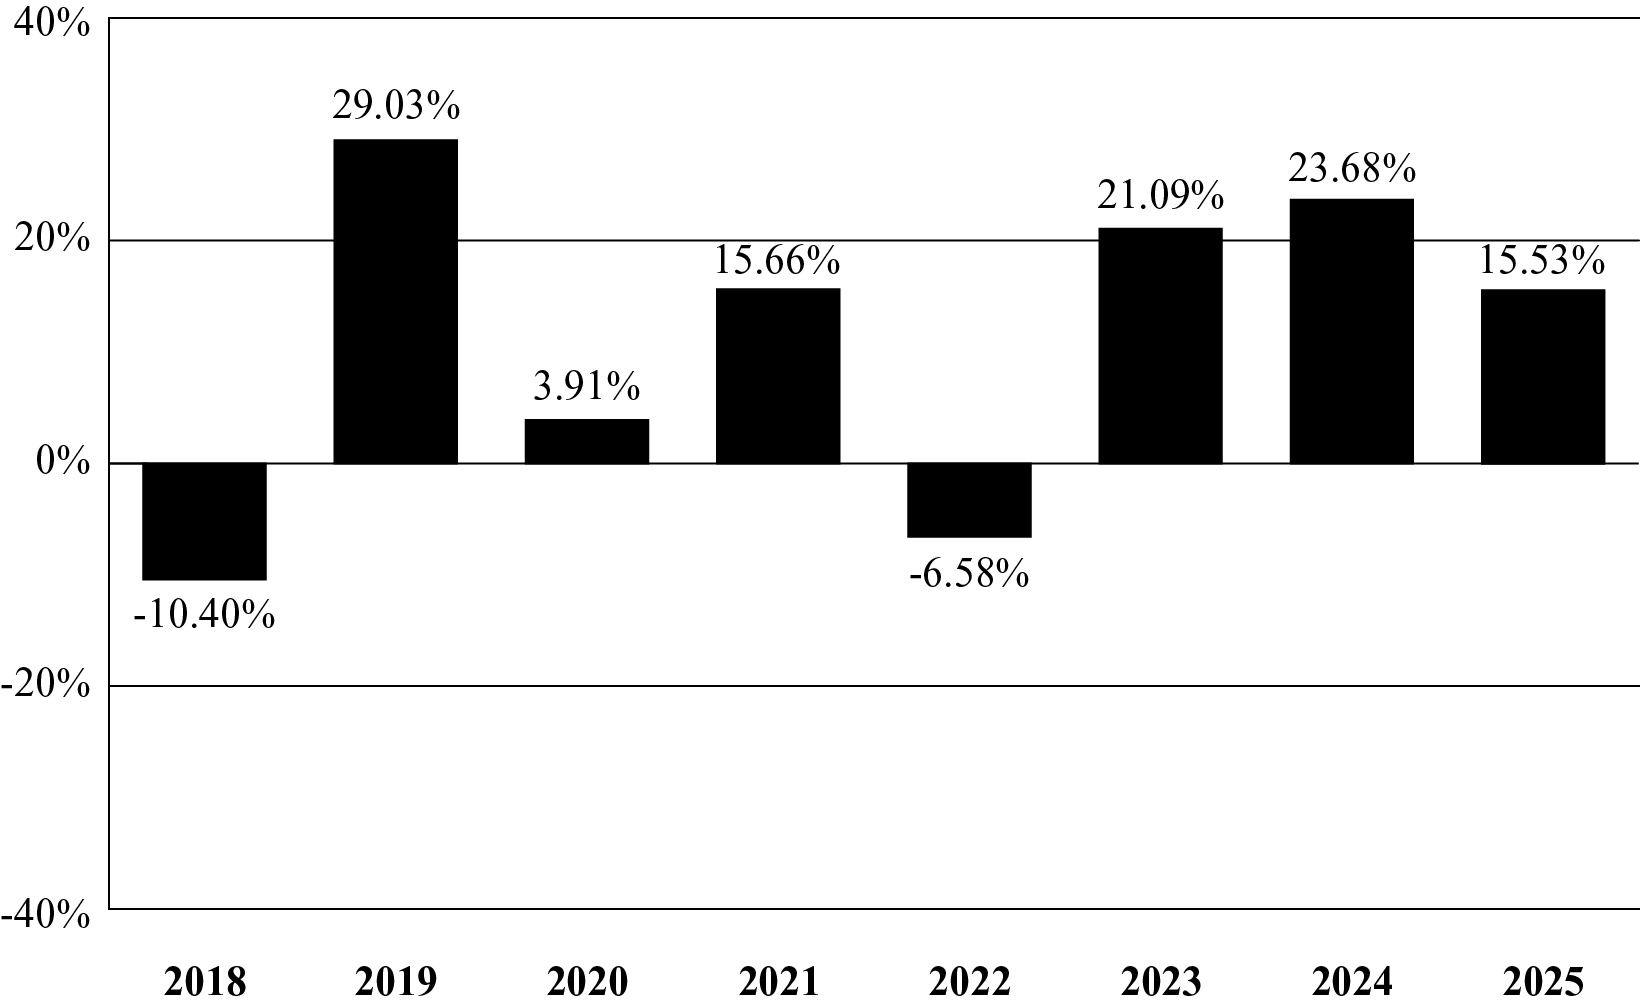
Annual Total Returns as of 12/31
|
| Bar Chart [Table] |
|
| Bar Chart Closing [Text Block] |
Best and Worst Quarter Returns (for the period
reflected in the bar chart above)
| | Return | Quarter/Year | | Highest Return | 17.79% | Q2/2020 | | Lowest Return | -25.07% | Q1/2020 |
|
| Highest Quarterly Return, Label [Optional Text] |
Highest Return
|
| Highest Quarterly Return |
17.79%
|
| Highest Quarterly Return, Date |
Jun. 30, 2020
|
| Lowest Quarterly Return, Label [Optional Text] |
Lowest Return
|
| Lowest Quarterly Return |
(25.07%)
|
| Lowest Quarterly Return, Date |
Mar. 31, 2020
|
| Performance Table Heading |
Average Annual Total Returns for the Periods
Ended December 31, 2025
|
| Performance Table Uses Highest Federal Rate |
After-tax returns are calculated using the highest
historical individual federal marginal income tax rates and do not reflect the impact of state and local taxes.
|
| Performance Table Not Relevant to Tax Deferred |
After-tax returns shown are not relevant to investors who hold
their shares through tax-deferred arrangements, such as 401(k) plans or individual retirement accounts (“IRAs”).
|
| Performance Table Explanation after Tax Higher |
In some cases,
the return after taxes may exceed the return before taxes due to an assumed tax benefit from any losses on a sale of shares of the Fund
at the end of the measurement period.
|
| Performance [Table] |
Saba Closed-End Funds ETF | 1 Year | 5 Years | Since Inception
(3-20-2017) | | Return Before Taxes | 15.53% | 13.35% | 11.28% | | Return After Taxes on Distributions | 13.32% | 9.70% | 7.57% | | Return After Taxes on Distributions and Sale of Fund Shares | 10.60% | 9.01% | 7.20% | | S&P 500® Index (reflects no deduction for fees, expenses, or taxes) | 17.88% | 14.42% | 14.72% | | iBoxx Liquid High Yield Index (reflects no deduction for fees, expenses, or taxes) | 8.83% | 4.34% | 4.98% |
|
| Index No Deduction for Fees, Expenses, or Taxes [Text] |
reflects no deduction for fees, expenses, or taxes
|
| Performance Table Closing [Text Block] |
After-tax returns are calculated using the highest
historical individual federal marginal income tax rates and do not reflect the impact of state and local taxes. Your actual after-tax
returns will depend on your tax situation and may differ from those shown. After-tax returns shown are not relevant to investors who hold
their shares through tax-deferred arrangements, such as 401(k) plans or individual retirement accounts (“IRAs”). In some cases,
the return after taxes may exceed the return before taxes due to an assumed tax benefit from any losses on a sale of shares of the Fund
at the end of the measurement period.
|
| Performance Availability Website Address [Text] |
www.sabaetf.com
|
| Performance Availability Phone [Text] |
1-888-615-4310
|
| PLUS Korea Defense Industry Index ETF |
|
| Prospectus [Line Items] |
|
| Bar Chart and Performance Table [Heading] |
Performance Information
|
| Performance Narrative [Text Block] |
The Fund commenced operations on February
4, 2025, and therefore, does not have performance for a full calendar year. Once the Fund has completed a full calendar year of operations,
a bar chart and table will be included that will provide some indication of the risks of investing in the Fund by comparing the Fund’s
return to a broad measure of market performance.
|
| Performance Information Illustrates Variability of Returns [Text] |
Once the Fund has completed a full calendar year of operations,
a bar chart and table will be included that will provide some indication of the risks of investing in the Fund by comparing the Fund’s
return to a broad measure of market performance.
|
| Performance One Year or Less [Text] |
The Fund commenced operations on February
4, 2025, and therefore, does not have performance for a full calendar year
|