NI 43-101 Technical Report
Macraes Operation, Otago, New Zealand
Effective Date: December 31, 2025
Report Date: March 27, 2026
Report Prepared by:
OCEANAGOLD
Suite 1020, 400 Burrard Street
Vancouver, BC V6C 3A6
Canada
Signed by Qualified Persons:
Matthew Grant PhD Applied Geology, MAIG, MAusIMM (OceanaGold Senior Geologist – Resource Development). Knowell Madambi, BSc Eng (Hons) Mining, MAusIMM CP (Min) (OceanaGold Manager - Technical Services & Projects). Euan Leslie BEng Mining, BCom Economics, MAusIMM CP (Min) (OceanaGold Group Mining Engineer). David Carr, BEng (Hons) Metallurgical, MAusIMM CP (Met) Metallurgy (OceanaGold Group Manager Metallurgy).
Forward Looking Information
This report contains certain “forward-looking statements” and “forward-looking information” (collectively, “forward-looking statements”) within the meaning of applicable Canadian securities laws which may include, but is not limited to, statements with respect to: future financial and operating performance; cash flow forecasts; projected capital, operating and exploration expenditures; targeted cost reductions; mine life and production rates; potential mineralization and metal or mineral recoveries; information pertaining to potential improvements to financial and operating performance and mine life at the Macraes Operation; future metals prices; the estimation of Mineral Reserves and Mineral Resources; the realization of Mineral Reserves and Mineral Resources estimates; costs of production; costs and timing of the development of new deposits; costs and timing of future exploration and drilling programs; timing of filing of updated technical information; requirements for additional capital; governmental regulation of mining operations and exploration operations; timing and receipt of approvals; consents and permits under applicable legislation; environmental risks; title disputes or claims; and the timing and possible outcome of current and pending litigation and regulatory matters. All statements in this report that address events or developments that OceanaGold Corporation (“OceanaGold”) expects to occur in the future are forward-looking statements. Forward-looking statements are statements that are not historical facts and are generally, although not always, identified by words such as “may”, “plans”, “expects”, “projects”, “is expected”, “scheduled”, “potential”, “estimates”, “forecasts”, “intends”, “targets”, “aims”, “anticipates” or “believes” or variations (including negative variations) of such words and phrases, or may be identified by statements to the effect that certain actions, events or results “may”, “could”, “would”, “should”, “might” or “will” be taken, occur or be achieved.
Forward-looking statements involve known and unknown risks, uncertainties and other factors which may cause OceanaGold’s actual results, performance or achievements to be materially different from any future results, performance or achievements expressed or implied by the forward-looking statements. Such risks include, among others: the risk of not achieving OceanaGold’s production estimates, forecasts or Guidance; inaccuracy of Mineral Reserves, Mineral Resources and operating and capital cost estimates; the actual results of current and future production, development and/or exploration activities; possible variations of ore grade, metallurgy or recovery rates; changes in mine plans, project parameters or assumptions as plans continue to be refined; delays in, or inability to complete, development or construction or expansion activities or to re-commence or sustain operations as planned; failures or underperformance of plant, equipment, infrastructure or processes; geotechnical risks or events, including open pit wall stability, crown pillar failure, land subsidence and tailings dam failures; challenges associated with effective water management; environmental, health and safety and climate-related risks; risks related to community acceptance, stakeholder engagement and social licence to operate; competition for mineral properties and other growth opportunities; legal and regulatory challenges to current and future permits, certifications, approvals or licences; adverse judicial, regulatory or governmental decisions; delays in, or inability to obtain, financing or governmental approvals on acceptable terms; changes in laws, regulations, taxation regimes, regulated accounting standards or their interpretation or application; the risks associated with operating in foreign jurisdictions, including political instability, changes in policy or law, civil unrest or conflict; fluctuations in the prices of gold, copper and silver; general business, economic and market conditions (including changes in global, national or regional financial, credit, currency or
| | | | | | | | |
| Released: March 27, 2026 | Page 2 of 213 |
securities markets); changes or developments in global, national or regional political and social conditions; fluctuations in foreign exchange rates, including the value of the U.S. dollar relative to the Canadian dollar, the New Zealand dollar or the Philippine peso; inflationary pressure; labour availability, retention and turnover; accidents, labour disputes and other operational risks of the mining industry; limitations of insurance coverage or uninsured risks; the conclusions of economic evaluations, studies and models; and those other factors identified and described in more detail in the section entitled “Risk Factors” contained in OceanaGold’s most recent Annual Information Form and OceanaGold’s other filings with Canadian securities regulators, which are available under OceanaGold’s profile on SEDAR+ at sedarplus.com and on OceanaGold’s website at oceanagold.com. The list is not exhaustive of the factors that may affect OceanaGold’s forward-looking statements.
OceanaGold’s forward-looking statements are based on the applicable assumptions and factors Management considers reasonable as of the date hereof, based on the information available to Management at such time. These assumptions and factors include, but are not limited to, assumptions and factors related to our ability to carry on current and future operations, including: exploration and development activities; the timing, extent, duration and economic viability of such operations; the accuracy and reliability of estimates, projections, forecasts, studies and assessments; our ability to meet or achieve guidance, estimates, projections and forecasts; the availability and cost of inputs; the price and market for outputs, including gold, copper and silver; foreign exchange rates; taxation levels; the timely receipt of necessary approvals, permits or certifications; the ability to meet current and future obligations; the ability to obtain timely financing on reasonable terms when required; the current and future social, economic and political conditions; and other assumptions and factors generally associated with the mining industry.
OceanaGold’s forward-looking statements are based on the opinions and estimates of OceanaGold management and reflect their current expectations regarding future events and operating performance and speak only as of the date hereof. OceanaGold does not assume any obligation to update forward-looking statements if circumstances or management’s beliefs, expectations or opinions should change other than as required by applicable law. There can be no assurance that forward-looking statements will prove to be accurate, and actual results, performance or achievements could differ materially from those expressed in, or implied by, these forward-looking statements. Accordingly, no assurance can be given that any events anticipated by the forward-looking statements will transpire or occur, or if any of them do, what benefits or liabilities OceanaGold will derive therefrom. For the reasons set forth above, undue reliance should not be placed on forward-looking statements.
| | | | | | | | |
| Released: March 27, 2026 | Page 3 of 213 |
Table of Contents
| | | | | | | | |
1 | Summary | 18 |
1.1 | Property Description and Ownership | 18 |
1.2 | History | 19 |
1.3 | Geology and Mineralization | 20 |
1.3.1 | Geology | 20 |
1.3.2 | Mineralization and Deposit Types | 21 |
1.4 | Mineral Permits and Regulatory Matters | 22 |
1.5 | Exploration | 22 |
1.6 | Drilling | 22 |
1.7 | Sampling, Analysis and Data Verification | 23 |
1.8 | Mineral Processing and Metallurgical Testing | 24 |
1.9 | Mineral Resource Estimate | 24 |
1.10 | Mineral Reserve Estimate | 25 |
1.11 | Mining Methods | 26 |
1.11.1 | Open Pit Mining Methods | 27 |
1.11.2 | Underground Mining Methods | 28 |
1.12 | Recovery Methods | 28 |
1.13 | Infrastructure | 28 |
1.14 | Environmental Studies and Permitting | 29 |
1.15 | Capital and Operating Costs | 29 |
1.16 | Economic Analysis | 31 |
1.17 | Conclusion and Recommendations | 33 |
1.17.1 | Conclusions | 33 |
1.17.2 | Recommendations | 33 |
2 | Introduction | 34 |
2.1 | Terms of Reference and Purpose | 34 |
2.2 | Purpose of the Report | 34 |
2.3 | Reporting Standards | 34 |
2.4 | Authors of the Report | 34 |
2.5 | Qualifications and Experience of Qualified Persons | 35 |
2.6 | Site Inspections | 35 |
2.7 | Sources of Information | 35 |
2.8 | Effective Date | 35 |
| | | | | | | | |
| Released: March 27, 2026 | Page 4 of 213 |
| | | | | | | | |
2.9 | Units of Measure | 35 |
3 | Reliance on other Experts | 36 |
3.1 | General | 36 |
4 | Property Description and Location | 37 |
4.1 | Property Location | 37 |
4.2 | Ownership | 38 |
4.3 | Mineral Titles | 40 |
4.4 | Nature and Extent of Title | 40 |
4.5 | Location of Mineral Resources | 41 |
4.6 | Royalties, Agreements and Encumbrances | 42 |
4.7 | Environmental Permitting & Compliance | 42 |
4.7.1 | Overview | 42 |
4.7.2 | Access Arrangements | 45 |
4.7.3 | Compliance | 45 |
5 | Accessibility, Climate, Physiography, Local Resources, and Infrastructure | 47 |
5.1 | Accessibility | 47 |
5.2 | Physiography | 47 |
5.3 | Climate | 47 |
5.4 | Land Resources and Infrastructure | 48 |
5.4.1 | Sufficiency of Surface Rights | 48 |
5.4.2 | Power | 48 |
5.4.3 | Water | 48 |
5.4.4 | Communications | 48 |
5.4.5 | Mining Infrastructure | 48 |
5.4.6 | Labour | 48 |
6 | History | 49 |
6.1 | Historical Mining | 49 |
6.2 | Prior Ownership | 50 |
6.3 | Previous Work (Pre – 1990) | 50 |
6.3.1 | Geochemistry | 50 |
6.3.2 | Geophysics | 51 |
6.3.3 | Drilling | 52 |
6.4 | Historical Estimates | 52 |
6.5 | Previous Production | 52 |
| | | | | | | | |
| Released: March 27, 2026 | Page 5 of 213 |
| | | | | | | | |
7 | Geological Setting and Mineralization | 53 |
7.1 | General | 53 |
7.2 | Regional Geology | 53 |
7.3 | Local Geology | 54 |
7.4 | Mineralization | 55 |
7.4.1 | Mineralization Zones | 55 |
7.4.2 | Mineralization Types | 58 |
7.5 | Deposit Geology | 59 |
8 | Deposit Types | 60 |
8.1 | General | 60 |
9 | Exploration | 62 |
9.1 | General | 62 |
9.2 | Geology | 62 |
9.2.1 | Geological Mapping | 62 |
9.3 | Geophysics | 62 |
9.4 | Geochemistry | 64 |
9.4.1 | Stream Sediment Sampling | 64 |
9.4.2 | Soil Sampling | 64 |
9.5 | Trenching | 67 |
9.6 | Remote Sensing | 67 |
9.7 | Aerial Photography | 67 |
9.8 | Exploration Statement | 67 |
10 | Drilling | 68 |
10.1 | Summary | 68 |
10.2 | Historical Drilling | 70 |
10.3 | OceanaGold Drilling | 71 |
10.4 | Surveys | 72 |
10.4.1 | Magnetic to Macraes Grid Conversion | 73 |
10.5 | Logging Procedures | 73 |
10.6 | Drilling Orientation | 75 |
10.7 | Sampling Methods and Approach | 75 |
10.7.1 | Introduction | 75 |
10.7.2 | RC Percussion Sampling | 75 |
10.7.3 | Diamond Core Sampling | 77 |
10.8 | Sample Quality | 77 |
| | | | | | | | |
| Released: March 27, 2026 | Page 6 of 213 |
| | | | | | | | |
10.8.1 | Summary | 77 |
10.8.2 | Sample Recovery | 77 |
10.8.3 | RC Wet Sample Bias | 77 |
10.9 | Summary of Mineralized Widths | 78 |
11 | Sample Preparation, Analysis, and Security | 79 |
11.1 | Sample Preparation Statement | 79 |
11.2 | Sample Preparation, Assay and Analytical Procedures | 79 |
11.2.1 | Graysons/AMDEL Limited | 79 |
11.2.2 | SGS New Zealand Limited | 79 |
11.2.3 | ALS Minerals Laboratory, Australia | 80 |
11.2.4 | SGS Limited 2013 – April 2025 | 80 |
11.2.5 | SGS NZ Limited 2025 Onwards | 81 |
11.2.6 | Off-site Sample Preparation | 82 |
11.3 | Sample Analysis | 82 |
11.4 | Quality Assurance/Quality Control Procedures | 82 |
11.4.1 | Standards | 82 |
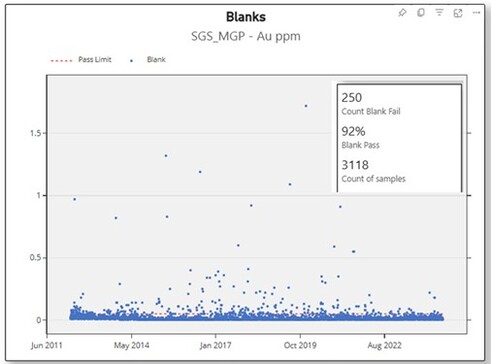
11.4.2 | Blanks | 82 |
11.4.3 | Duplicates | 83 |
11.4.4 | Core and Sample Storage | 83 |
11.4.5 | Actions | 83 |
11.5 | Opinion on Adequacy of Sample Preparation, Analysis and Security | 83 |
12 | Data Verification | 84 |
12.1 | Introduction | 84 |
12.2 | Drill Hole Database | 84 |
12.2.1 | Historical Data | 84 |
12.2.2 | Recent Data | 84 |
12.3 | Analysis of Assay Quality Control Data | 84 |
12.3.1 | Blanks | 85 |
12.3.2 | Standards | 87 |
12.3.3 | Duplicates – SGS Macraes | 88 |
12.4 | Summary | 90 |
13 | Mineral Processing and metallurgical testing | 92 |
13.1 | Ore Mineralogy | 92 |
13.2 | Throughput | 92 |
13.3 | Mass Pull | 92 |
| | | | | | | | |
| Released: March 27, 2026 | Page 7 of 213 |
| | | | | | | | |
13.4 | Flotation Tails Gold Grade | 93 |
13.5 | CIL Recoveries | 93 |
13.6 | Flotation Recovery | 94 |
13.7 | Overall Recovery | 94 |
13.8 | Future Ore Testing Program | 95 |
13.9 | Golden Point Underground Testing | 96 |
13.10 | Innes Mills | 98 |
13.11 | Super Low Grade Testwork | 100 |
13.12 | Reconciling plant recovery to ore sources | 100 |
14 | Mineral Resource Estimates | 103 |
14.1 | Introduction | 103 |
14.2 | Qualified Persons Responsible for Resource Estimates | 103 |
14.3 | Open Pit Mineral Resource Estimates | 103 |
14.3.1 | Drillhole Database | 103 |
14.3.2 | Software Used | 103 |
14.3.3 | Geologic Model Methodology | 103 |
14.3.4 | Compositing and Assay Capping | 104 |
14.3.5 | Bulk Density | 104 |
14.3.6 | Variogram Analysis and Modelling | 106 |
14.3.7 | Block Model | 106 |
14.3.8 | Estimation Methodology | 106 |
14.3.9 | Model Validation | 107 |
14.3.10 | Resource Classification | 108 |
14.3.11 | Resource Estimate Tonnes and Grade | 109 |
14.3.12 | Nunns | 109 |
14.3.13 | Coronation North | 110 |
14.3.14 | Coronation | 111 |
14.3.15 | Deepdell | 112 |
14.3.16 | Round Hill/Golden Point Open Pit | 113 |
14.3.17 | Innes Mills | 114 |
14.3.18 | Ounce | 115 |
14.3.19 | Golden Bar | 117 |
14.3.20 | Taylors | 120 |
14.3.21 | Stoneburn Group | 121 |
14.4 | Underground Mineral Resource Estimate | 124 |
| | | | | | | | |
| Released: March 27, 2026 | Page 8 of 213 |
| | | | | | | | |
14.4.1 | Drillhole Database | 124 |
14.4.2 | Software Used | 124 |
14.4.3 | Geologic Modelling | 124 |
14.4.4 | Assay Capping and Compositing | 124 |
14.4.5 | Density | 124 |
14.4.6 | Variogram Analysis and Modelling | 125 |
14.4.7 | Block Model | 125 |
14.4.8 | Estimation Methodology | 125 |
14.4.9 | Model Validation | 125 |
14.4.10 | Resource Classification | 125 |
14.4.11 | Golden Point Underground (GPUG) Resource Estimate | 125 |
14.5 | Resource Model to Mine Reconciliation | 127 |
14.6 | Open Pit and Underground Combined Mineral Resource Statement | 128 |
15 | Mineral Reserve Estimates | 130 |
15.1 | General | 130 |
15.2 | Open Pit Mineral Reserve Estimate | 130 |
15.2.1 | Conversion Assumptions, Parameters and Methods | 130 |
15.2.2 | Relevant Modifying Factors | 130 |
15.3 | Underground Mineral Reserve Estimate | 131 |
15.3.1 | Conversion Assumptions, Parameters and Methods | 131 |
15.4 | Macraes Combined Mineral Reserves Statement | 132 |
16 | Mining Methods | 134 |
16.1 | General | 134 |
16.2 | Open Pit Mining Methods | 134 |
16.2.1 | Current or Proposed Mining Methods | 134 |
16.2.2 | Parameters Relevant to Mine or Pit Designs and Plans | 134 |
16.2.3 | Pit Optimization | 135 |
16.2.4 | Design Criteria | 143 |
16.2.5 | Waste Rock Storage | 143 |
16.2.6 | Mine Production Schedule | 145 |
16.2.7 | Mining Fleet and Requirements | 150 |
16.2.8 | Mine Water | 152 |
16.3 | Golden Point Underground | 153 |
16.3.1 | Mining Methods | 153 |
16.3.2 | Mine Design Criteria | 153 |
| | | | | | | | |
| Released: March 27, 2026 | Page 9 of 213 |
| | | | | | | | |
16.3.3 | Mine Production Schedule | 154 |
16.3.4 | Underground Mining Schedule Results | 155 |
16.3.5 | Mining Fleet and Requirements | 155 |
16.3.6 | Mine Ventilation Requirements | 157 |
16.3.7 | Mine Services | 157 |
16.4 | Combined Open Pit and Underground Production Schedule | 159 |
17 | Recovery Methods | 160 |
17.1 | Introduction | 160 |
17.2 | Plant Description | 160 |
17.3 | Plant Performance | 163 |
17.4 | Process Costs | 166 |
18 | Macraes Operation Infrastructure | 168 |
18.1 | Roads | 168 |
18.1.1 | Site Access Roads | 168 |
18.1.2 | Mine Haul Roads | 168 |
18.2 | Mine Services Facilities | 168 |
18.2.1 | Electrical Power | 168 |
18.2.2 | Open Pit Mine | 168 |
18.2.3 | Underground Mine | 169 |
18.2.4 | Assay Laboratory | 169 |
18.2.5 | Fuel Storage and Dispensing | 170 |
18.2.6 | Explosives | 170 |
18.2.7 | Communications | 170 |
18.3 | Tailings Storage | 170 |
18.3.1 | Design Criteria | 170 |
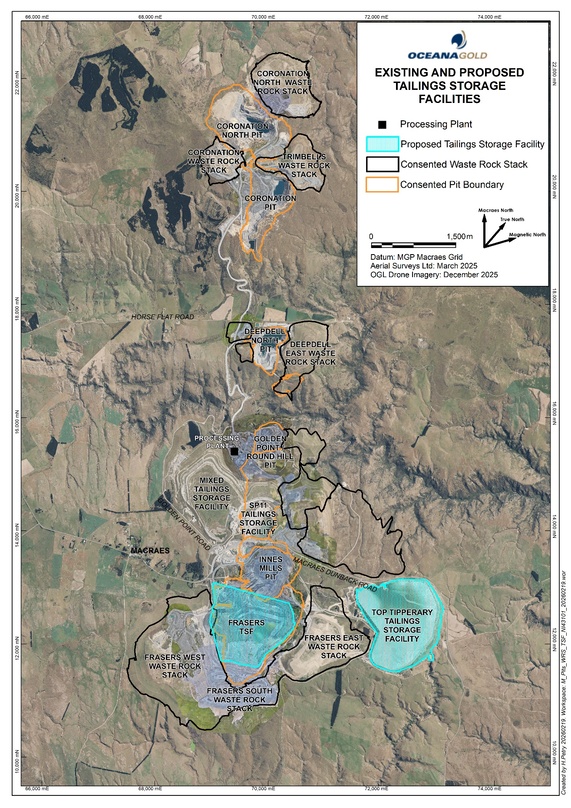
18.3.2 | Existing Facilities | 171 |
18.3.3 | Tailings Deposition Plan | 174 |
18.4 | Water | 175 |
18.4.1 | Surface Water Management | 175 |
18.4.2 | Underground Water Management | 175 |
18.4.3 | Process Plant Water Management | 175 |
19 | Market Studies and Contracts | 176 |
19.1 | General | 176 |
19.2 | Doré Production and Sales | 176 |
19.3 | Hedging and Forward Sames Contracts | 176 |
| | | | | | | | |
| Released: March 27, 2026 | Page 10 of 213 |
| | | | | | | | |
19.4 | Contracts and Status | 176 |
19.4.1 | Open Pit Mining | 176 |
19.4.2 | Explosives | 177 |
19.4.3 | Diesel | 177 |
19.4.4 | Power Supply | 177 |
19.4.5 | Water Supply | 177 |
19.5 | Bonds | 177 |
19.6 | Comments on Market Studies and Contracts | 177 |
20 | Environmental Studies, Permitting, Social or Community Impact | 178 |
20.1 | General | 178 |
20.2 | Required Permits and Status | 178 |
20.3 | Environmental Study Results | 179 |
20.4 | Environmental and Social Issues | 179 |
20.4.1 | Land Use | 179 |
20.4.2 | Long Term Water Quality | 180 |
20.5 | Stakeholder and Iwi Engagement | 181 |
20.6 | Operating and Post Closure Requirements and Plans | 181 |
20.7 | Rehabilitation Measures during Operations | 182 |
20.8 | Mine Closure | 182 |
20.9 | Post-Performance or Reclamations Bonds | 182 |
20.10 | Closure Monitoring | 183 |
20.11 | Reclamation and Closure Cost Estimate | 183 |
21 | Capital and Operating Costs | 184 |
21.1 | Introduction | 184 |
21.2 | Capital Expenditure Estimates | 184 |
21.2.1 | Basis of Estimate | 184 |
21.2.2 | Labour Assumptions | 184 |
21.2.3 | Material Costs | 184 |
21.2.4 | Mine Capital Expenditures – Underground | 184 |
21.2.5 | Mine Capital Expenditures – Open Pit | 185 |
21.2.6 | Infrastructure Expenditures | 185 |
21.2.7 | Capital Expenditure Summary | 185 |
21.3 | Operating Cost Estimates | 186 |
21.3.1 | Basis of Estimate | 186 |
21.3.2 | Mining Operating Costs | 187 |
| | | | | | | | |
| Released: March 27, 2026 | Page 11 of 213 |
| | | | | | | | |
21.3.3 | Processing Operating Costs | 187 |
21.3.4 | General and Administrative Operating Costs | 188 |
21.3.5 | Operating Cost Summary | 188 |
22 | Economic Analysis | 190 |
22.1 | Principal Assumptions and Input Parameters | 190 |
22.2 | Taxes, Royalties and Other Interests | 190 |
22.2.1 | Taxation | 190 |
22.2.2 | Royalties | 191 |
22.2.3 | Financing Costs | 191 |
22.3 | Pricing Model Results Reserve Case | 191 |
22.4 | Sensitivity Analysis | 194 |
22.4.1 | Operational Sensitivity | 194 |
22.4.2 | Gold Price Sensitivity | 194 |
22.4.3 | Pricing Model Results For Alternative Case | 195 |
23 | Adjacent Properties | 197 |
24 | Other Relevant Data and Information | 198 |
24.1 | Topography | 198 |
25 | Interpretation and Conclusion | 199 |
25.1 | Geology | 199 |
25.2 | Mining | 199 |
25.3 | Mineral Processing | 200 |
25.4 | Project Infrastructure | 201 |
25.5 | Environmental Studies, Permitting and Tenement Status | 201 |
25.6 | Production | 202 |
25.7 | Capital and Operating Costs | 202 |
26 | Recommendations | 203 |
26.1 | Recommended Work Programmes | 203 |
26.1.1 | Exploration & Resource Conversion | 203 |
26.1.2 | Mineral Processing and Metallurgical Testing | 203 |
26.1.3 | Mining and Reserves | 203 |
16.1.4 | Macraes Operation Infrastructure | 203 |
26.1.5 | Environmental Studies and Permitting | 203 |
27 | References | 204 |
28 | Glossary | 208 |
28.1 | Mineral Resources | 208 |
| | | | | | | | |
| Released: March 27, 2026 | Page 12 of 213 |
| | | | | | | | |
28.2 | Mineral Reserves | 208 |
28.3 | Definition of Terms | 209 |
28.4 | Abbreviations | 210 |
Tables
| | | | | | | | |
Table 1-1 | Macraes Operation Mineral Resource statement as at December 31, 2025 | 25 |
Table 1-2 | Macraes Mineral Reserve estimate as at December 31, 2025 | 26 |
Table 1-3 | Combined open pit and underground ore processing schedule | 27 |
Table 1-4 | LoM sustaining capital expenditure | 30 |
Table 1-5 | LoM operating cost summary | 31 |
Table 1-6: | Indicative Economic Results | 32 |
Table 4-1 | Macraes Operation minerals permit | 40 |
Table 4-2 | Macraes Operation Resource area boundaries | 42 |
Table 9-1 | Geophysical surveys completed | 62 |
Table 10-1 | Drilling summary by Resource area | 68 |
Table 10-2 | Macraes exploration drilling summary | 71 |
Table 10-3 | Magnetic to Macraes grid azimuth corrections | 73 |
Table 10-4 | Summary of rock code descriptions | 74 |
Table 11-1 | Graysons/AMDEL assay techniques | 79 |
Table 11-2 | SGS (NZ) limited assay techniques 2009-2012 | 80 |
Table 11-3 | ALS minerals laboratory assay techniques 2009-2012 | 80 |
Table 11-4 | SGS (NZ) Limited assay techniques 2013 – April 2025 | 81 |
Table 11-5 | SGS (NZ) limited assay technique from April 2025 onwards | 81 |
Table 13-1 | Forecast recoveries used for production planning | 95 |
Table 13-2 | Results of GPUG round 1 composites | 97 |
Table 13-3 | Results of GPUG round 2 variability composites | 97 |
Table 13-4 | Innes Mills 2022 composite summary results | 99 |
Table 13-5 | Innes Mills 2025 test summary results | 100 |
Table 13-6 | Gay Tan super low grade testwork results | 101 |
Table 13-7 | Innes Mills super low grade testwork results | 101 |
Table 13-8 | Super low grade plant trial results | 102 |
| | | | | | | | |
| Released: March 27, 2026 | Page 13 of 213 |
| | | | | | | | |
Table 14-1 | Density assumptions | 105 |
Table 14-2 | Bulk density data by area | 106 |
Table 14-3 | MIK Resource classification parameters | 108 |
Table 14-4 | OK Resource classification parameters | 109 |
Table 14-5 | Open Pit Resource estimate versus mill adjusted truck estimates at 0.3g/t cut-off | 127 |
Table 14-6 | Underground Resource estimate versus mill adjusted trucked estimates | 128 |
Table 14-7 | Combined OP and UG Resource estimate versus mill adjusted trucked estimates | 128 |
Table 14-8 | Macraes Resource inventory as at December 31, 2025 | 129 |
Table 15-1 | Stope modifying factors | 131 |
Table 15-2 | Golden Point underground cut-off grade calculations | 132 |
Table 15-3 | Macraes combined Mineral Reserve estimate as at December 31, 2025 | 133 |
Table 16-1 | Resource models used in pit optimizations | 136 |
Table 16-3 | Innes Mills optimization inputs | 137 |
Table 16-4 | Innes Mills pit slopes used in optimizations | 137 |
Table 16-5 | Innes Mills optimization results | 140 |
Table 16-6 | Golden Bar optimization inputs | 140 |
Table 16-7 | Golden Bar pit slopes used in optimizations | 140 |
Table 16-8 | Golden Bar optimization results | 141 |
Table 16-9 | Coronation optimization inputs | 141 |
Table 16-10 | Coronation pit slopes used in optimizations | 141 |
Table 16-11 | Coronation optimization results | 142 |
Table 16-12 | Coronation North optimization inputs | 142 |
Table 16-13 | Coronation North pit slopes used in optimizations | 142 |
Table 16-14 | Coronation North optimization results | 143 |
Table 16-15 | Generic pit design parameters | 143 |
Table 16-16 | Waste rock storage | 145 |
Table 16-17 | Key open pit schedule assumptions | 147 |
Table 16-18 | Open pit mining quantities by year | 151 |
Table 16-19 | Open pit drill and blast parameters | 152 |
Table 16-20 | Major open pit equipment fleet by year | 152 |
| | | | | | | | |
| Released: March 27, 2026 | Page 14 of 213 |
| | | | | | | | |
Table 16-21 | Major open pit equipment fleet addition and replacement schedule | 155 |
Table 16-22 | Key underground schedule assumptions | 155 |
Table 16-23 | Schedule physicals | 156 |
Table 16-24 | Underground drill and blast parameters | 157 |
Table 16-25 | Major underground equipment fleet by year | 157 |
Table 16-26 | Mine ventilation Requirements | 159 |
Table 16-27 | Combined open pit and underground ore processing schedule | 166 |
Table 17-1 | Consumable consumption rates | 167 |
Table 17-2 | Life of Mine processing metrics | 170 |
Table 18-1 | Explosives used on site | 172 |
Table 18-2 | Macraes Tailings Storage Facilities | 174 |
Table 18-3 | Future tailings storage options | 174 |
Table 18-4 | Tailings deposition plan | 178 |
Table 20-1 | Operational permits at Macraes Operation | 178 |
Table 20-2 | Required permits and status | 186 |
Table 21-1 | LoM sustaining capital expenditures | 188 |
Table 21-2 | Operating cost summary | 190 |
Table 22-1 | Financial Parameters | 192 |
Table 22-2 | Financial Performance Summary (Reserve Case) | 193 |
Table 22-3 | Indicative Economic Results at Alternative Price Profile | 196 |
Table 28-1 | Definition of Terms | 209 |
Table 28-2 | Abbreviations | 211 |
Figures
| | | | | | | | |
Figure 1-1 | General location of the Macraes Operation | 19 |
Figure 1-2 | Capital expenditure for LoM | 30 |
Figure 1-3 | LoM direct operating costs | 31 |
Figure 4-1 | Macraes Operation location map | 37 |
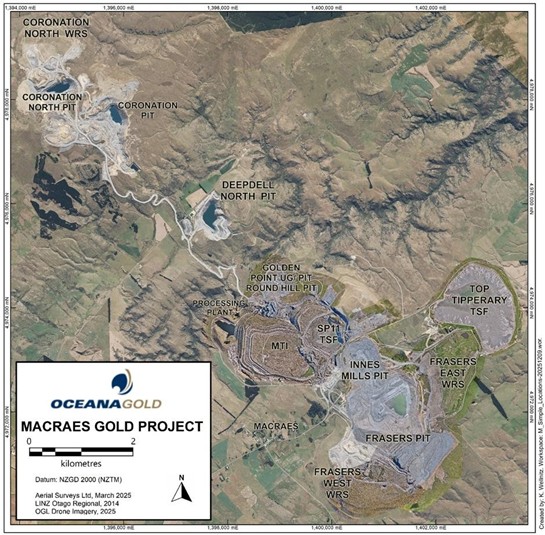
Figure 4-2 | Macraes Operation aerial image from 2025 | 38 |
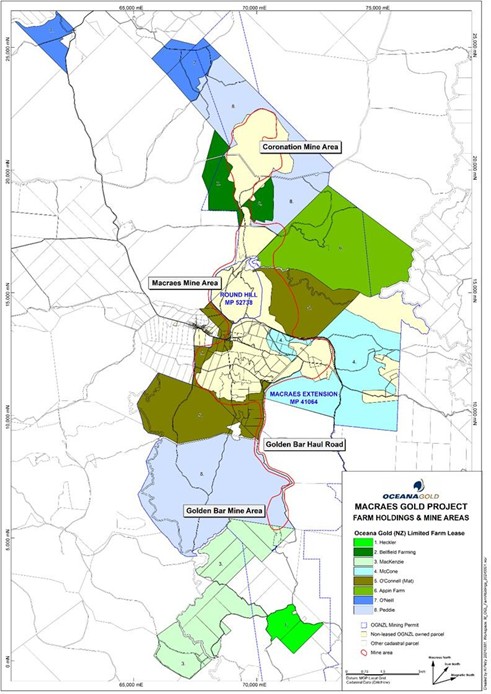
Figure 4-3 | Macraes Operation farm holdings and mine area | 39 |
| | | | | | | | |
| Released: March 27, 2026 | Page 15 of 213 |
| | | | | | | | |
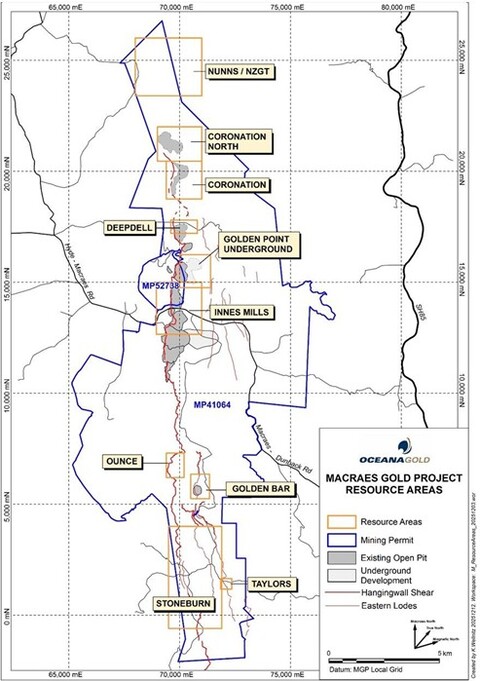
Figure 4-4 | Macraes Operation Resource locations | 41 |
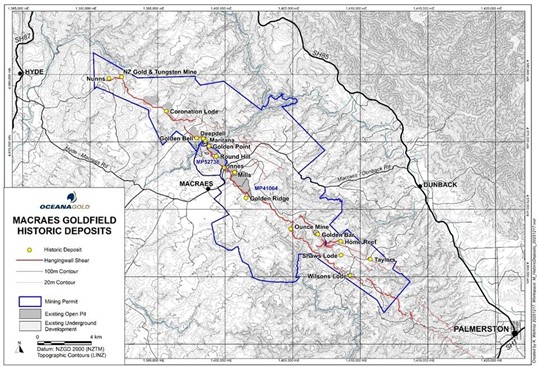
Figure 6-1 | Macraes historical deposits | 50 |
Figure 7-1 | Regional geological setting | 54 |
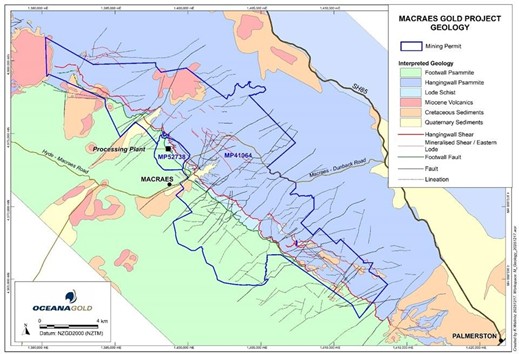
Figure 7-2 | Macraes geology map | 55 |
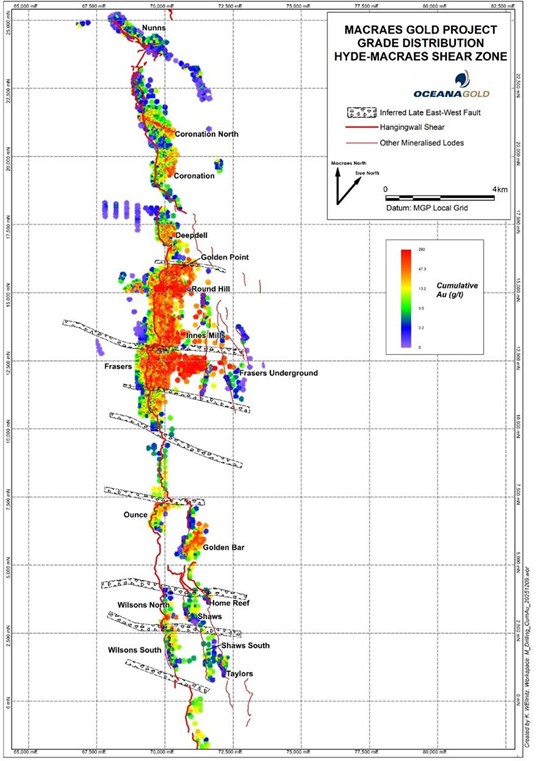
Figure 7-3 | Grade distribution along the HMSZ | 57 |
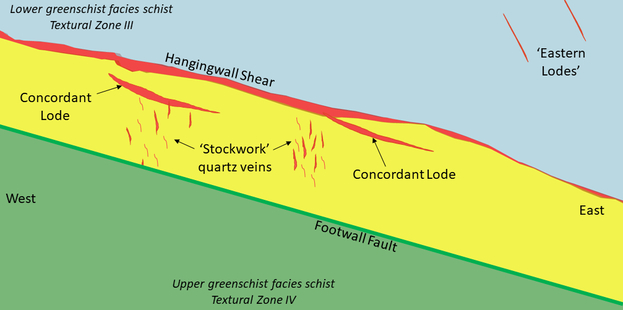
Figure 7-4 | Schematic sketch cross section through the HMSZ showing styles of mineralization | 59 |
Figure 8-1 | Orogenic gold deposits of New Zealand | 61 |
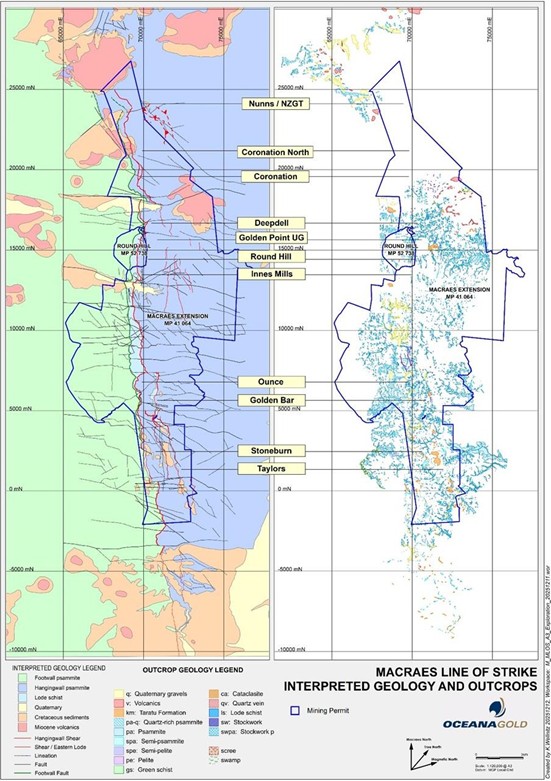
Figure 9-1 | Macraes interpreted and outcrop geology | 63 |
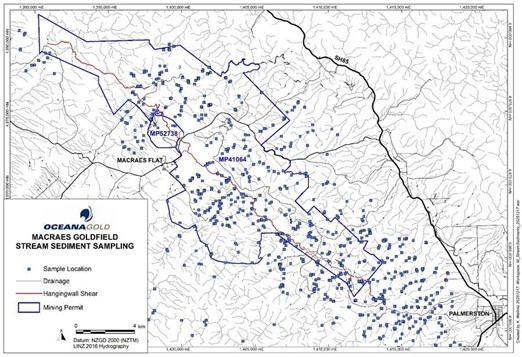
Figure 9-2 | Macraes stream sediment sampling | 64 |
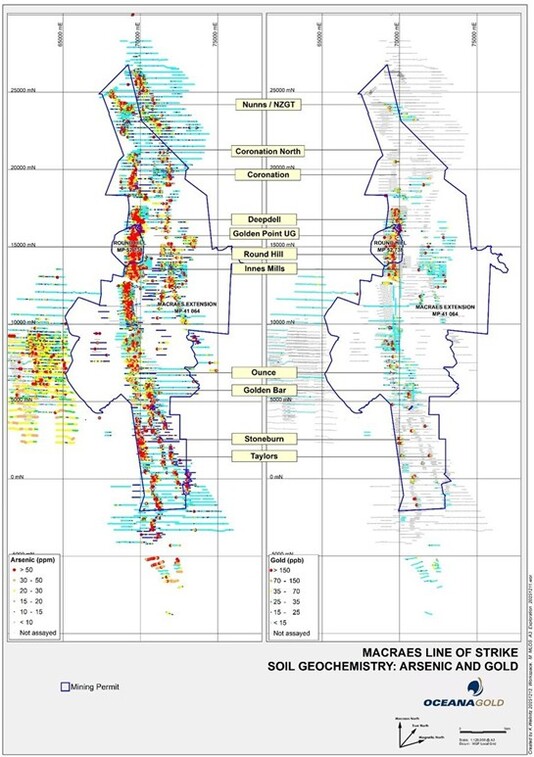
Figure 9-3 | Macraes soil sampling locations | 66 |
Figure 10-1 | Macraes drill hole locations | 69 |
Figure 10-2 | Drill hole locations prior to 1990 | 70 |
Figure 10-3 | Exploration Drill meters by year from surface and underground | 72 |
Figure 12-1 | Blank samples submitted with Fire Assay submissions 2012-2025 (nine outliers excluded) | 86 |
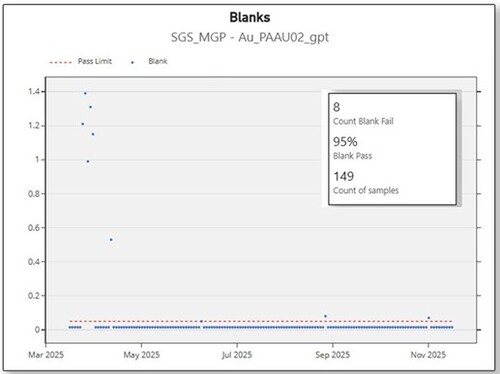
Figure 12-2 | Blank samples submitted with Photon Assay submission since March 2025 (No outliers excluded) | 86 |
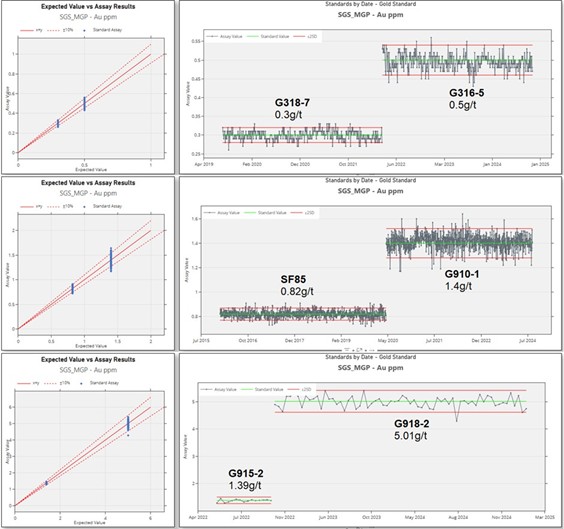
Figure 12-3 | Selection of six Fire Assay gold standards SGS Macraes Lab | 87 |
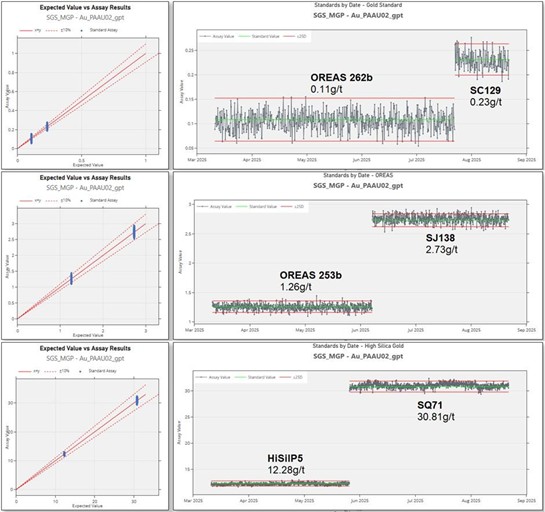
Figure 12-4 | Selection of six Photon Assays gold standards SGS Macraes Lab | 88 |
Figure 12-5 | Field duplicate and coarse crush duplicate Fire Assay pairs SGS Macraes | 89 |
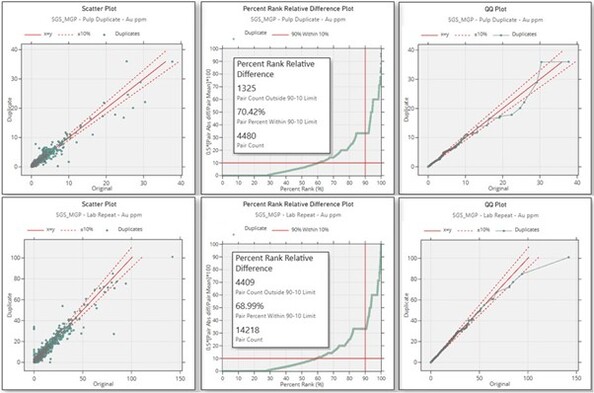
Figure 12-6 | Pulp duplicate and laboratory repeat Fire Assay pairs SGS Macraes | 90 |
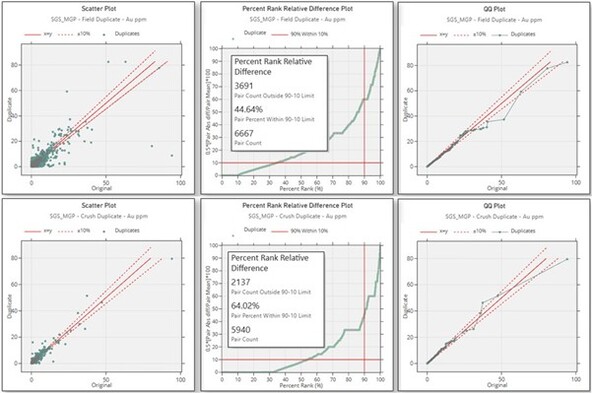
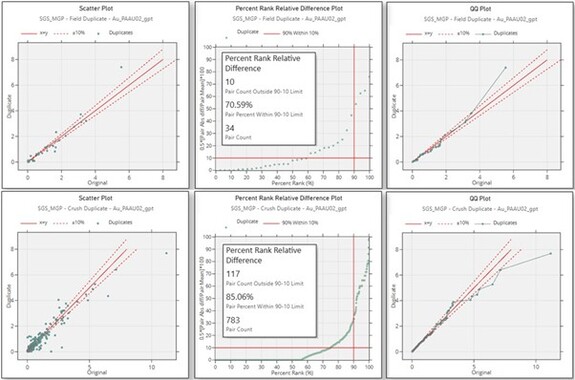
Figure 12-7 | Field duplicate & coarse crush duplicate Photon Assay pairs SGS Macraes | 91 |
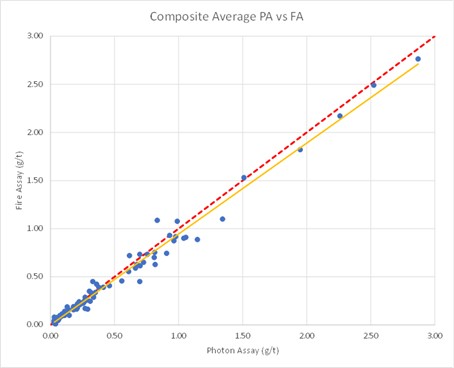
Figure 12-8 | Scatterplot of 100 duplicates of Fire Assay and Photon Assay completed during transition period in March 2025. Red dash line has slope of 1 | 93 |
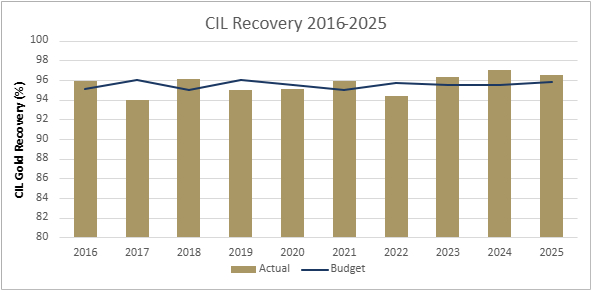
Figure 13-1 | Plant CIL recovery comparison between budget and actual CIL recovery from 2019-2025 | 94 |
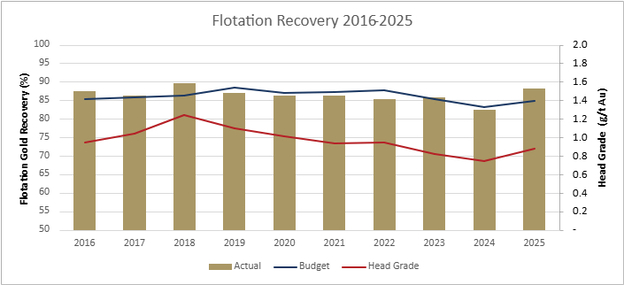
Figure 13-2 | Plant flotation recovery comparison between budget and actual flotation recovery | 110 |
Figure 14-1 | Cross section through Coronation North showing original topography, geology and domaining Grade control grade shells >0.3g/t and >1.0g/t included | 111 |
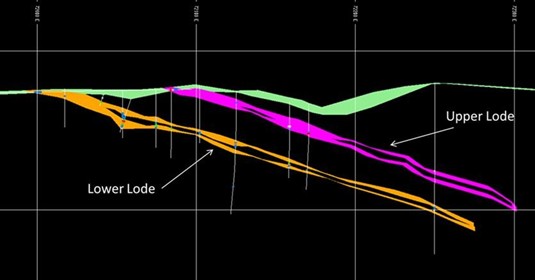
Figure 14-2 | Coronation cross section Looking North showing two mineralized lodes associated with the hangingwall shear | 116 |
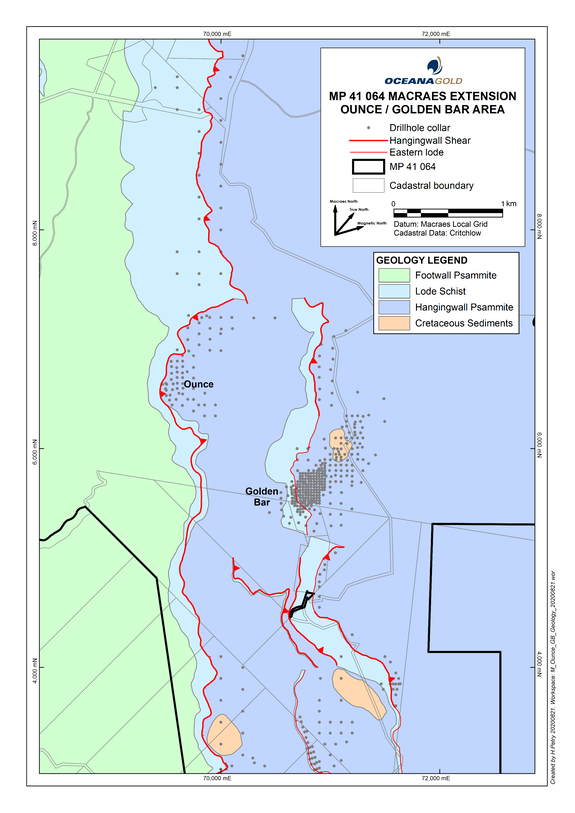
Figure 14-3 | Ounce and Golden Bar geology and deposits | 117 |
Figure 14-4 | Ounce schematic cross section with 2017 Resource domain | 119 |
| | | | | | | | |
| Released: March 27, 2026 | Page 16 of 213 |
| | | | | | | | |
Figure 14-5 | Golden Bar schematic cross section 5575 m N | 121 |
Figure 14-6 | Taylors schematic cross section line 1400 n M | 123 |
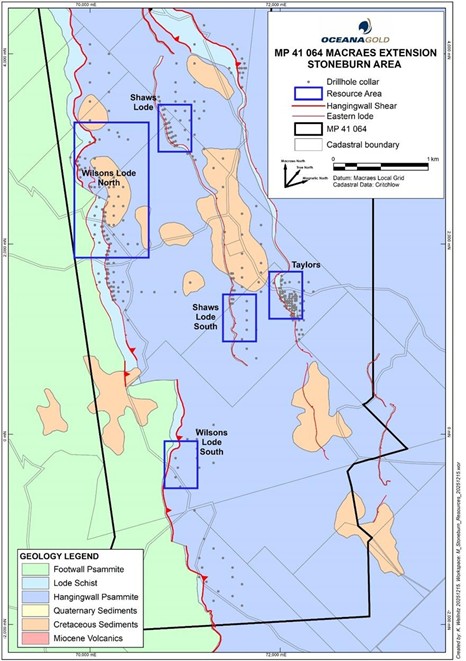
Figure 14-7 | Stoneburn geology and Resource area | 126 |
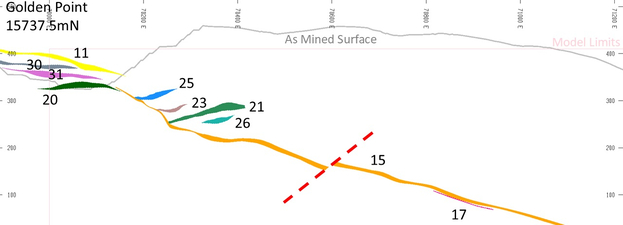
Figure 14-8 | Golden Point lode domains | 126 |
Figure 16-1 | Pit expansion into the SP11 tailings storage facility | 139 |
Figure 16-2 | Existing and proposed open pits and waste rock stacks | 144 |
Figure 16-3 | Open pit mining areas | 146 |
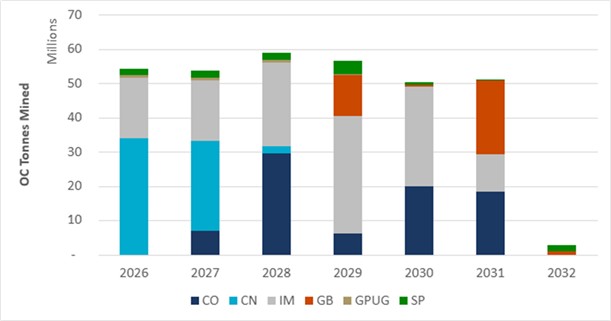
Figure 16-4 | Mined quantities by material type | 147 |
Figure 16-5 | Movement by sources | 147 |
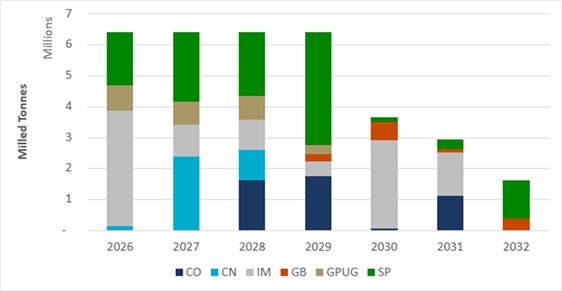
Figure 16-6 | Ore milled by sources | 148 |
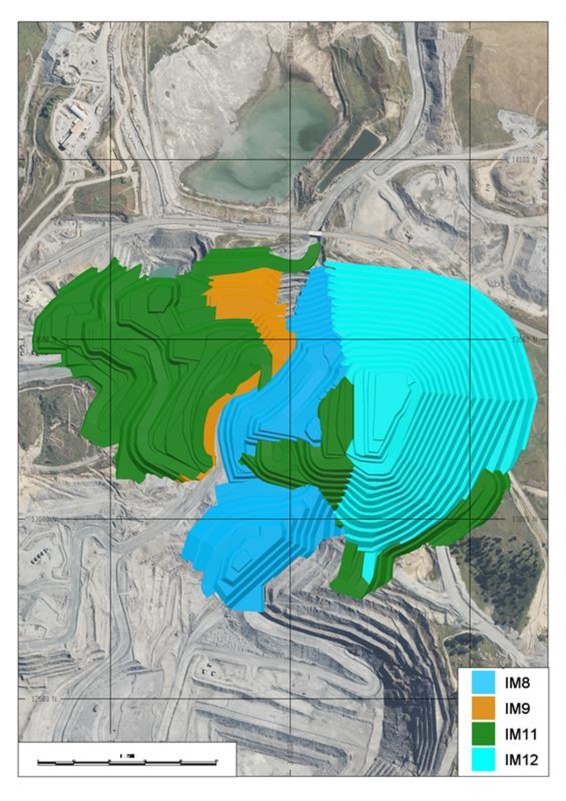
Figure 16-7 | Innes Mills open pit stages | 149 |
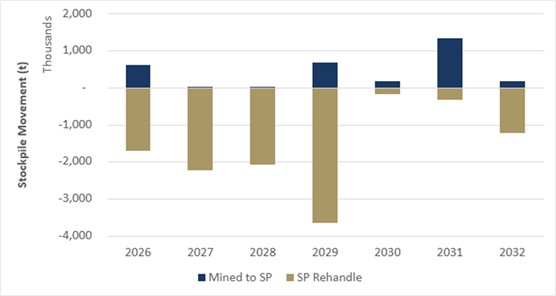
Figure 16-8 | Stockpile movements | 150 |
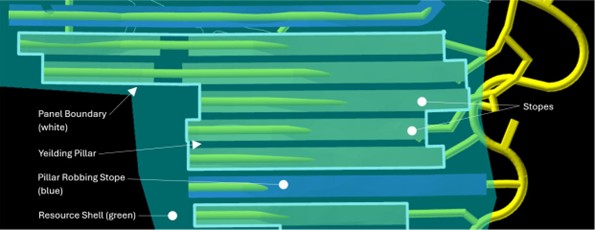
Figure 16-9 | Panel layout | 154 |
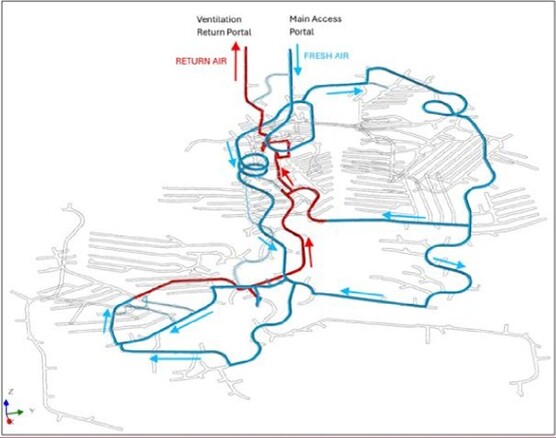
Figure 16-10 | Primary Ventilation Circuit | 158 |
Figure 16-11 | Combined open pit and underground ore processing schedule | 159 |
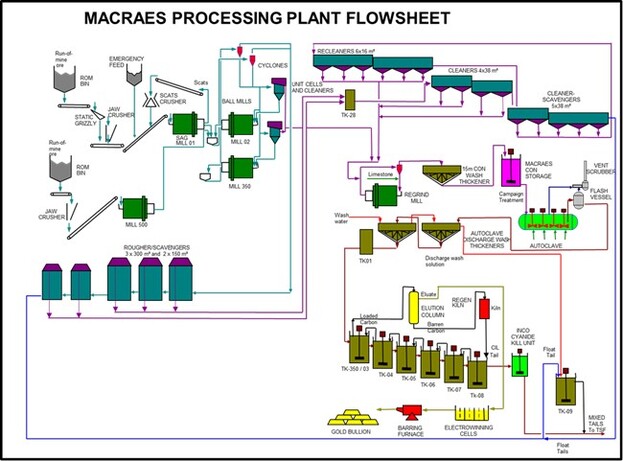
Figure 17-1 | Macraes process plant flowsheet | 161 |
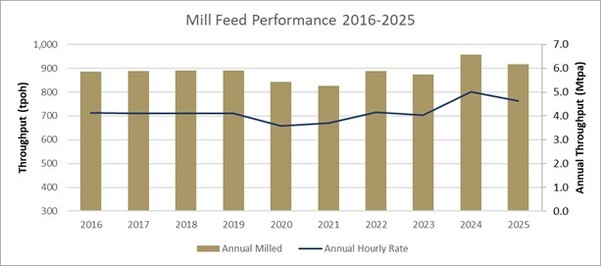
Figure 17-2 | Actual milled tonnages and combined mill throughput | 163 |
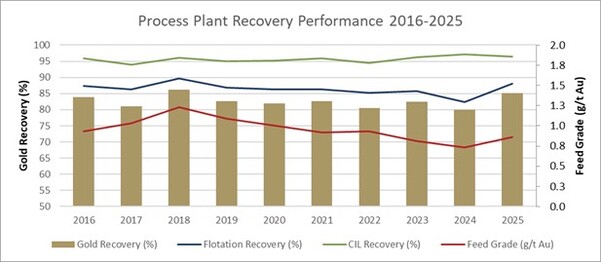
Figure 17-3 | Actual overall circuit, flotation and CIL recoveries | 164 |
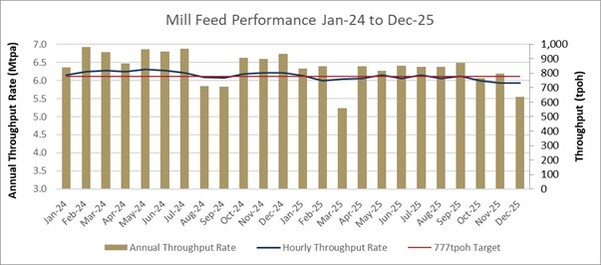
Figure 17-4 | Mill throughput post pebble crushing installation | 165 |
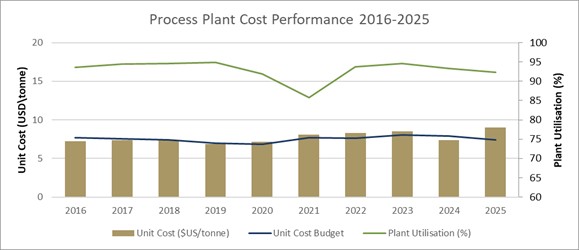
Figure 17-6 | Overall mill utilization and unit costs for 2016-2025 | 165 |
Figure 18-1 | Existing and proposed tailings storage facilities | 173 |
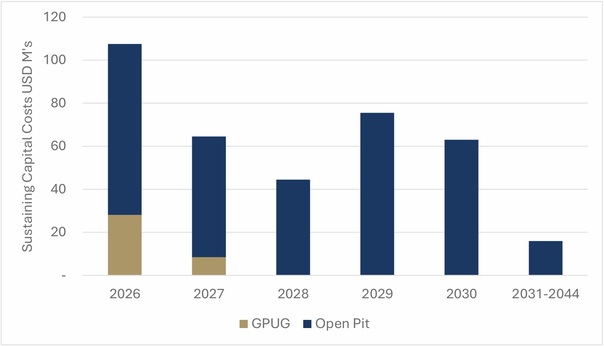
Figure 21-1 | LoM annual sustaining capital costs | 186 |
Figure 21-2 | LoM direct operating costs | 189 |
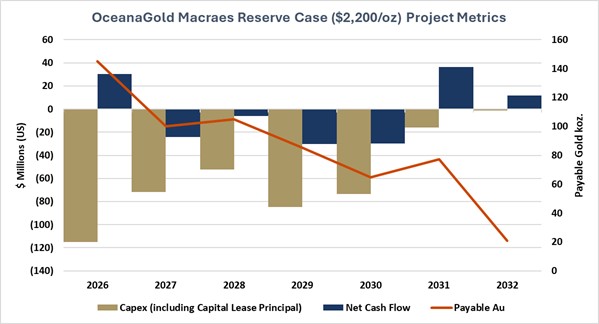
Figure 22-1 | Macraes Reserve Case Project Metrics | 192 |
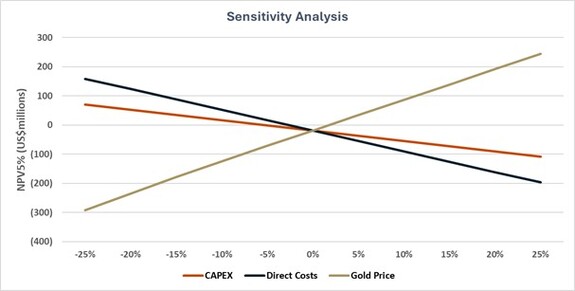
Figure 22-2 | Reserve Case Sensitivity Analysis | 194 |
Figure 22-3 | Gold Price Sensitivity Analysis | 195 |
| | | | | | | | |
| Released: March 27, 2026 | Page 17 of 213 |
1Summary
OceanaGold Corporation (OceanaGold) has prepared this National Instrument 43-101 (NI43-101) Technical Report (Technical Report) on the Macraes Operation (Macraes or the Project) as at December 31, 2025. This disclosure includes an increased Mineral Reserve estimate of 0.77 Moz and a Reserve mine life extension to 2032.
The Project is controlled by OceanaGold Corporation through its wholly owned subsidiary OceanaGold (New Zealand) Limited (OGNZL). OceanaGold Corporation is listed on the Toronto Stock Exchange under the code “OGC” and is the Issuer of this Technical Report.
The areas included in the Project mine plan comprise the following:
•Innes Mills, Coronation, Coronation North and Golden Bar open pits;
•Golden Point Underground mine (GPUG);
•Processing plant; and
•Tailings Storage Facilities.
OceanaGold continues to identify and evaluate potential additional ore sources through exploration work, drilling campaigns and studies to increase mining inventories and extend the mine life beyond the existing Reserve life.
1.1Property Description and Ownership
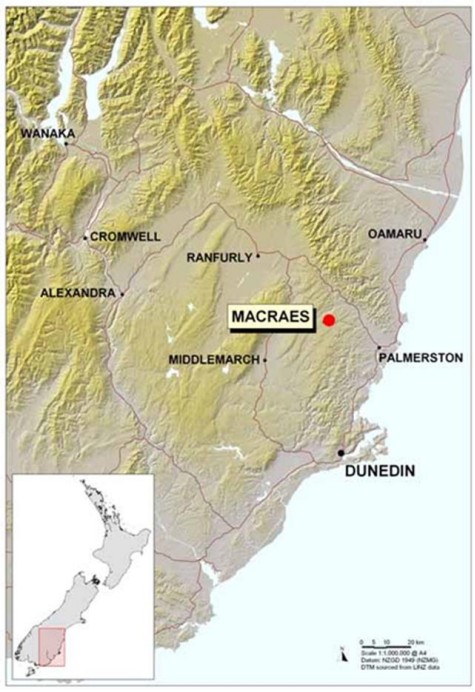
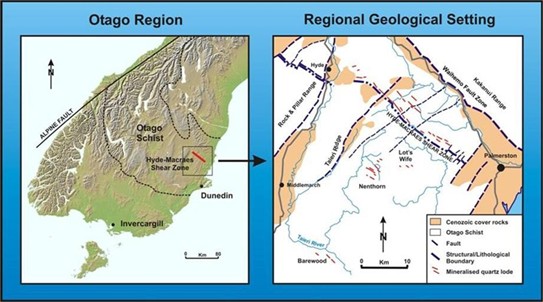
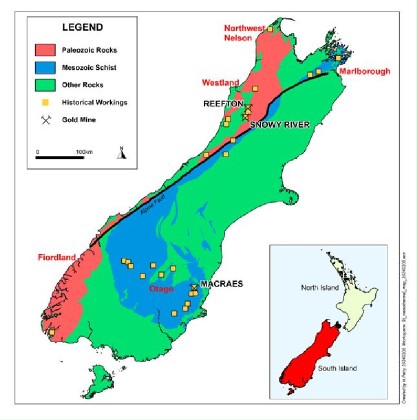
The Macraes Operation, located on the South Island of New Zealand, is the country’s largest gold producing operation and includes both open pit and underground mining. Macraes is located approximately 60 kilometres north of Dunedin and 30 kilometres to the northwest of Palmerston in the Otago Region. The mining activities occur approximately two kilometres to five kilometres north and east of the Macraes township and is predominantly surrounded by farmland.
Access to the mine is by sealed roads from Dunedin, Oamaru, Middlemarch and Ranfurly. There is adequate access along sealed roads and farm tracks throughout the mine area. The general location of the Macraes Operation is shown in Figure 1-1.
The Macraes mining and exploration permits cover a contiguous area of 14,576 ha.
| | | | | | | | |
| Released: March 27, 2026 | Page 18 of 213 |
Figure 1-1 General location of the Macraes Operation
1.2History
The first records of mining in the Macraes area date to 1862 with alluvial mining at Murphy’s Flat, with Macraes Flat, Deepdell and some parts of Horse Flat being worked soon after (Hamel, 1992).
Discovery of the modern Macraes Operation resulted from two geophysical surveys carried out using IP/resistivity in April 1985. During 1987, an orientation stream sediment sampling survey was
| | | | | | | | |
| Released: March 27, 2026 | Page 19 of 213 |
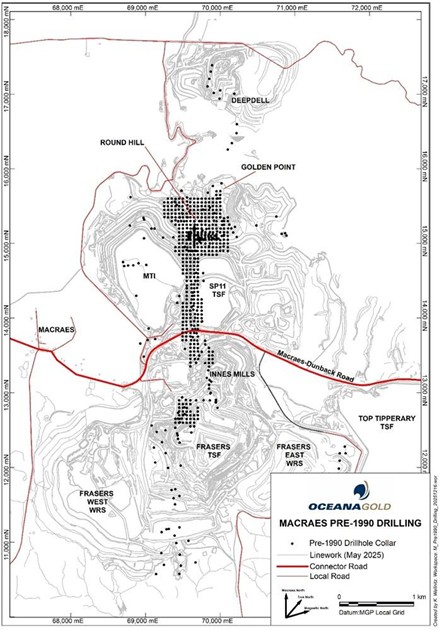
conducted by BHP Gold Mines (New Zealand) Ltd (“BHPNZ”) in the Round Hill area. Exploration activities conducted in the Macraes region prior to 1990 included approximately 56,000 metres of rotary air blast, RC and diamond drilling in 779 holes.
The current Macraes Operation began mining and processing gold bearing ore in 1990. The original permits comprising the Macraes Operation were owned by Golden Point Mining Limited, and by BHPNZ. In December 1989, the Macraes Mining Company Limited (“MMCL”) obtained 100% ownership of these permits.
In December 1998, MMCL amalgamated with Macraes Mining Company Holdings Limited. This company subsequently changed its name to Gold and Resource Developments (NZ) Limited, and then to GRD Macraes Limited. In 2004, the name was changed to OceanaGold (New Zealand) Limited.
Macraes Operation is presently the largest gold producing operation in New Zealand. To December 31, 2025, over 5 million ounces of gold have been produced. The Project consists of large-scale open pit mining, underground mining and an adjacent process plant inclusive of an autoclave for pressure oxidation of the ore, details of which are provided below.
1.3Geology and Mineralization
1.3.1Geology
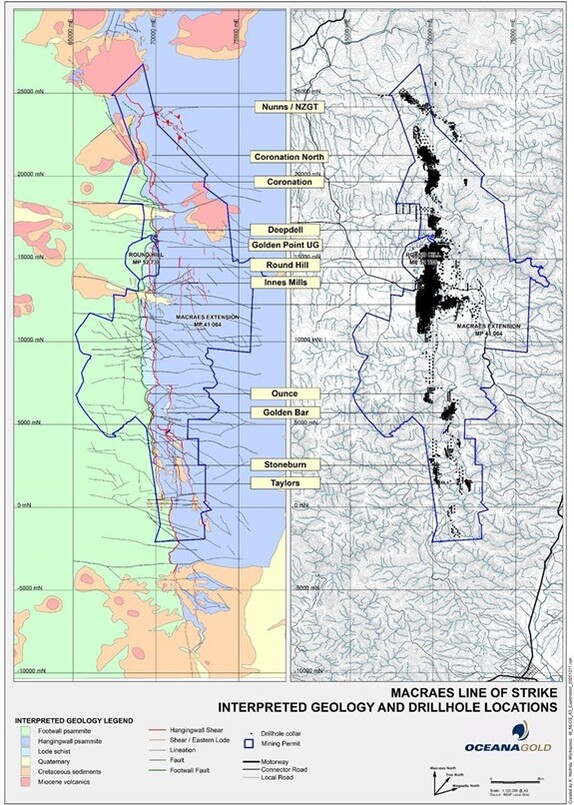
The Macraes Operation centres on a major, low-angle structure known as the Hyde-Macraes Shear Zone (“HMSZ”). This regionally continuous, late metamorphic deformation zone cuts greenschist facies metasedimentary rocks of the Otago Schist, a metamorphic belt that was formed by collisional amalgamation of the Caples and Torlesse terranes in the Early-Middle Jurassic.
The HMSZ is one of the largest Mesozoic structures mapped in the Otago Schist, traceable for at least 30 kilometres along strike in east Otago. Mining to date has occurred along a continuous strike length of six kilometres in numerous staged pits, three smaller discrete satellite pits five kilometres to six kilometres to the north, and at Golden Bar, a further six kilometres to the south. The HMSZ consists of variably altered, deformed and mineralized schist up to 150 metres thick, known as the intrashear schist. The thickest part of the shear zone consists of several mineralized zones stacked on metre-thick shears. These shears have ductile deformation textures overprinted by cataclasis. A shear known as the Hangingwall Shear (“HWS”), defines the upper limit of the intrashear schist. This shear, which can be up to 25 metres thick, is the most strongly mineralised structure at the Macraes Operation.
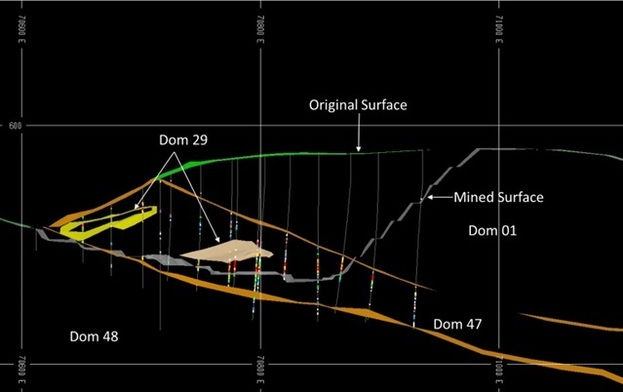
The Coronation and Coronation North deposits are located five kilometres to six kilometres to the northeast of the processing plant. Coronation consists of a 15 to 20 degrees dipping HWS that is between three metres and ten metres thick. Unlike deposits to the south, there is very little development of stockwork mineralization beneath the HWS. Located one kilometre to the north of Coronation is the Coronation North deposit, which was discovered in 2015. Coronation North differs from previously mined ore bodies along the HMSZ and comprises a high-grade zone of ENE plunging mineralization associated with a left-hand lateral bend in the strike of the HWS.
The Innes Mills open pit is centred on mining the HWS and subparallel stacked lenses beneath. In outcrop, the shears typically dip 15 to 20 degrees to the east and are approximately five metres
| | | | | | | | |
| Released: March 27, 2026 | Page 20 of 213 |
thick. Within the open pit, gold mineralization comprises mineralized schist and cataclasite, shear-parallel quartz veins and arrays of sub-vertical quartz veins.
Erratic mineralization locally occurs between the base of the HWS and the Footwall Fault. At the resource drilling stage, this mineralization manifests as poorly developed clusters of elevated gold grades, which often appear discontinuous. During mining, however, these typically present as zones of quartz vein arrays and mineralized shears. The Footwall Fault lies between 80 metres and 120 metres below the HWS and is identified as a cataclastic zone up to ten metres thick. To date, no economic mineralization has been located below the Footwall Fault.
GPUG encompasses the down-dip continuation of the HWS mined in the Round Hill and Golden Point open pits. Current drilling has shown this to extend more than 700 metres beyond the limit of the open pit design. The thickest, most mineralized part is a series of stacked lodes proximal to the Golden Point open pit. Mineralization continues as a single higher-grade lode down-dip to the north-northeast. Mineralization is contained within the intrashear schist, which is generally 80 metres to 100 metres thick, with the higher gold grades confined to the upper part, which is dominated by cataclasite, lode schist and local stockwork pelite lithologies. Numerous drill holes have penetrated through the intrashear schist into the Footwall Psammite. Mineralization is consistent with the ore delineated in the Golden Point and Round Hill open pits, however down-dip of Golden Point this is constrained to a single lode. The highest gold grades are contained within the strongly developed and visually distinguishable zone within the upper hangingwall, characterized by quartz cataclasite, and mineralized schist. This typically forms a well mineralized, continuous zone up to five metres to ten metres thick, with a gold grade of approximately 3 g/t.
1.3.2Mineralization and Deposit Types
The Macraes deposit is an orogenic style gold deposit, with mineralization broadly synchronous with deformation, metamorphism and magmatism during a lithospheric-scale continental-margin orogeny. Most orogenic gold deposits like Macraes occur in greenschist facies rocks. Orogenic deposits typically formed on retrograde portions of pressure-temperature time paths during the last increments of crustal shortening and thus postdate regional metamorphism of the host rocks.
Mineralization within the HMSZ is hosted within lower greenschist facies pelitic to psammitic metasediments that are variably altered, deformed, and mineralized. This package of schist, known as the Intrashear Schist, is bounded above by the Hangingwall Shear, and below by the Footwall Fault, and can be up to 150 m thick. The thickest parts of the HMSZ comprise multiple, stacked shears and associated quartz vein arrays. The shears have ductile deformation textures overprinted by cataclasis (Craw et al., 1999). The Hangingwall shear, which is the most continuous and intensely mineralized structure, can be up to 25 m thick and is commonly darker coloured due to fine grained graphite and sheared sulfide minerals (McKeag et al., 1989).
There is a strong empirical correlation between gold, arsenic, scheelite, silicification and deformation intensity within the HMSZ. Gold-scheelite-pyrite-arsenopyrite mineralization is associated with replacement and fissure quartz veins within late metamorphic shearing. Shear-parallel quartz veins and cataclastic shears contain the highest gold and scheelite grades (Lee et al. 1989). Dore is typically comprised of 5% silver.
| | | | | | | | |
| Released: March 27, 2026 | Page 21 of 213 |
The following four types of mineralization are recognised within the HMSZ at Macraes (Mitchell et al., 2006):
•Mineralized schist;
•Black, sheared schist;
•Shear-parallel quartz veins, ranging from 1 cm to 2 m; and
•Stockworks (aka quartz vein arrays).
Gold is associated with pyrite and arsenopyrite in all the above styles of mineralization.
Tungsten as scheelite is found predominantly within mineralized quartz veins, although subordinate phases of disseminated scheelite within schist and remobilised stringer veins are also observed (Farmer, 2016).
1.4Mineral Permits and Regulatory Matters
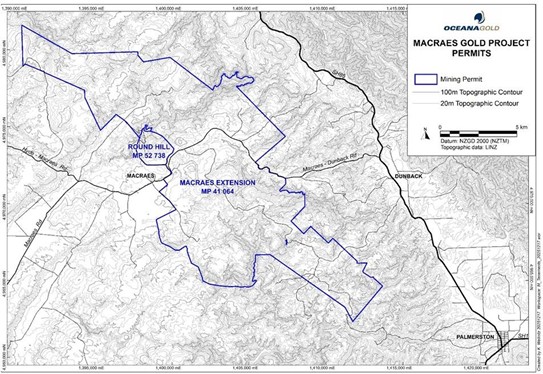
Macraes Operation Mineral Reserves, plant site, tailings dams and waste rock stacks are located on land that is covered by mining permits, and which OceanaGold owns or has access to mine. All material permits and landholder agreements are in good standing.
The mineral permits are in good standing, and their duration is currently sufficient and can be extended, to allow future mining of the Resource within the permits as MP 41 064 expires in 2030 and MP 52 738 expires in 2045.
1.5Exploration
The Macraes area is a mature exploration province and much of the strike potential has been tested near surface. There remains potential for discovery both down dip of previously mined open cuts and underground operations and along strike to the north and south.
Detailed geological mapping, geophysical surveys (including seismic surveys, magnetic and electromagnetic surveys), geochemical surveys (including stream sediment sampling, soil sampling and trenching), remote sensing and aerial photography, have been completed along the strike of the HMSZ. Target areas with favourable characteristics for gold mineralization have been systematically tested with drilling.
1.6Drilling
As at December 31, 2024, over 1,105,000 metres in approximately 8,500 drill holes have been drilled from surface at the Macraes Operation. Full year 2024 exploration drilling totalled 9,389 metres. During 2024, resource definition drilling was ongoing to improve resource confidence at Coronation, Coronation North and GPUG.
Holes usually have been surveyed at 30 metre intervals to the end of the hole. RC holes and diamond core are generally logged and classified at one metre intervals with exceptions for lithology changes in diamond core holes. Drill hole information is stored in an electronic database.
Due to the long exploration and mining history of the Macraes Operation, the quality control database is incomplete for some of earlier drilling (1980s) making complete and thorough investigation impossible. Most of the Resources supported by early drilling have now been mined out and therefore no longer represent a significant risk to the project.
| | | | | | | | |
| Released: March 27, 2026 | Page 22 of 213 |
1.7Sampling, Analysis and Data Verification
The sampling approach at the Macraes Operation consists of drill cuttings (RC percussion drilling) and half cut core samples (diamond drill core). The diamond drilling sampling has remained relatively constant over the life of the project, while the sampling of the percussion drilling has changed dependant on the drilling method.
Sampling of the RC percussion drilling is completed by trained employees who are supervised by technical staff. The sampling, splitting, tagging, bagging and storage of RC percussion drill holes is carried out in accordance with industry protocols and standards.
Drill core is logged and photographed, and the sections of core considered to be mineralized, or proximal to mineralized zones, are cut in half using a core saw and sampled by trained technicians and geologists, in accordance with sampling and QA protocols.
Sample recovery from RC percussion drilling and diamond drill core is routinely recorded in geological logs and recovery data are stored in a database. Sample preparation for analysis is carried out by independent laboratory staff (Amdel Limited (“Amdel”) or SGS New Zealand Limited and is not conducted by any of our employees.
Between 2009 and mid-2011, all diamond core samples from surface exploration drilling, and most RC percussion drill samples were processed and analyzed by SGS laboratories in Ngakawau and Waihi. Samples were dried, crushed, split and then pulverized. One 50-gram pulp split was sent to SGS Waihi and analyzed for gold by Fire Assay. A second 50-gram subsample was retained in Ngakawau and used to make pressed powder pellets for XRF spectrometry analysis for arsenic and tungsten.
In mid-2011, SGS opened a new laboratory facility in Westport and took ownership of the laboratory services contract at the Macraes mine site. All the RC percussion chips and diamond core drill samples since 2011 were analyzed by SGS at the Macraes laboratory in New Zealand, using the process described above.
From 2010 until 2012, the independent ALS Laboratory Group Minerals laboratory in Brisbane, Australia was retained to analyze high value (deep) diamond drill holes from surface drills to test the down dip extent of the Frasers Underground (FRUG) mineralization and potential blind ore shoots. Half-core (NQ or HQ) samples were cut and sampled by our personnel and delivered to ALS Brisbane laboratory by freight companies. All sample preparation and analysis were completed by ALS employees. After crushing and pulverizing, all samples were analyzed by Fire Assay.
During 2013, selected sample pulps without existing tungsten analyses from Round Hill/Southern Pit and the Frasers 6 areas were retrieved from storage and analyzed for tungsten. The samples were retrieved and were initially analyzed in-house using our portable XRF (“pXRF”) analyzer. Orientation studies were conducted, and sampling protocols were developed to ensure consistent presentation of the samples to the pXRF analyzer.
The QC database is incomplete for the Macraes Operation, in part due to the long exploration and mining history. Where available, the recovery and QA/QC data indicate the assay data are acceptable. The risk associated with the incomplete data is mitigated by the available mining and reconciliation data which supports the quality of the information. The data are suitable for the purposes of grade estimation. Potential biases associated with the sampling of wet RC percussion drilling have been addressed by replacing wet sampled RC percussion drill holes with their
| | | | | | | | |
| Released: March 27, 2026 | Page 23 of 213 |
corresponding diamond or dry RC twins; or, in cases where no twin drill hole exists, globally determined wet sample bias correction factors have been used to factor gold grades for wet RC percussion drill hole samples.
1.8Mineral Processing and Metallurgical Testing
Over the last 35 years OceanaGold has developed considerable experience in development and operation of the complex ore processing technology required to optimise gold recovery from the Macraes refractory ores.
Emphasis is placed on efficiency, recoveries and cost control. The relatively high tonnage processed, the simple flotation reagent regime, and economies resulting from concentration of the gold into a flotation product comprising between 1.5% and 3% of the ore mass treated, reduce the operating cost. The low operating cost of the core sulfide process is due to low comminution costs (driven by the coarse grind, and relatively soft ore).
OceanaGold conducts a metallurgical ore testing program at the Macraes Operation using core from recently drilled areas to determine ore recovery parameters. The data produced from the test work feeds into the recovery models used in the life of mine plan. Test work checks ore amenability to the Macraes flowsheet of grinding/flotation and leaching.
1.9Mineral Resource Estimate
The estimation methodology used for the Mineral Resources depends on the mineralization style, drill hole spacing, population statistics and mining method of the various deposits across the Macraes Operation area.
The main open pit deposits use Large Panel Recoverable estimation via Multiple Indicator Kriging. Ordinary Kriging is used for underground estimates as well as for some satellite, non-producing open pits.
Resource classification considers drill hole spacing, geological confidence and, in some cases, the probability of the block grade being above cut-off grade.
OceanaGold’s Mineral Resource estimation processes are well established and are maintained by a process of internal peer review, and independent external review. The estimates are supported by appropriate drilling data, with acceptable sampling and assaying quality. The estimates have been constrained within domains based upon appropriate geological and grade criteria.
For the five years trailing (2021 to 2025), the Measured and Indicated Resources have reconciled against the mill-adjusted mine averages of 125%, 96% and 119% for tonnes, grade and contained gold respectively. Inferred Resources are not considered in reconciliation performance metrics, due to their lower confidence. Nonetheless, inclusion of Inferred Resources would improve the reconciliation metrics to 111%, 100% and 111% for tonnes, grade and contained gold respectively.
While monthly, quarterly and annual reconciliation fluctuations are expected to continue, the Macraes open pit and underground Mineral Resource estimates are believed to provide an acceptable basis for medium- to long-term mine planning purposes.
Table 1-1 represents the Macraes Operation Mineral Resource Statement as at December 31, 2025, reported in accordance with the Canadian National Instrument 43-101, Standards of Disclosure for Mineral Projects of June 2011 (the Instrument) and the classifications adopted by Canadian Institute of Mining, Metallurgy and Petroleum (CIM) Council in December 2011.
| | | | | | | | |
| Released: March 27, 2026 | Page 24 of 213 |
Table 1-1 Macraes Operation Mineral Resource statement as at December 31, 2025
| | | | | | | | | | | | | | | | | | | | | | | | | | | | | | | | | | | | | | | | | |
Gold | Measured | Indicated | Measured & Indicated | Inferred |
Tonnes (Mt) | Au (g/t) | Contained Ozs (Moz) | Tonnes (Mt) | Au (g/t) | Contained Ozs (Moz) | Tonnes (Mt) | Au (g/t) | Contained Ozs (Moz) | Tonnes (Mt) | Au (g/t) | Contained Ozs (Moz) | |
Macraes | |
Nunns/NZGT | - | - | - | 0.27 | 0.81 | 0.01 | 0.27 | 0.81 | 0.01 | 0.8 | 0.9 | 0.0 | |
Coronation North | 0.14 | 1.23 | 0.01 | 3.06 | 0.63 | 0.06 | 3.19 | 0.66 | 0.07 | 1.0 | 0.4 | 0.0 | |
Coronation | 0.27 | 1.14 | 0.01 | 5.84 | 0.69 | 0.13 | 6.1 | 0.71 | 0.14 | 2.5 | 0.6 | 0.1 | |
Deepdell | 0.36 | 1.17 | 0.01 | 0.66 | 0.9 | 0.02 | 1.03 | 0.99 | 0.03 | 0.5 | 0.6 | 0.0 | |
Innes Mills | 1.91 | 1.32 | 0.08 | 24.3 | 0.64 | 0.50 | 26.2 | 0.69 | 0.58 | 7.5 | 0.5 | 0.1 | |
Ounce | - | - | - | - | - | - | - | - | - | 1.3 | 0.7 | 0.0 | |
Golden Bar | 0.19 | 1.31 | 0.01 | 1.34 | 0.94 | 0.04 | 1.52 | 0.98 | 0.05 | 4.7 | 1.1 | 0.2 | |
Stoneburn | - | - | - | - | - | - | - | - | - | 6.1 | 0.6 | 0.1 | |
Taylors | - | - | - | 0.29 | 0.81 | 0.01 | 0.29 | 0.81 | 0.01 | 0.3 | 0.7 | 0.01 | |
Stockpiles | 9.73 | 0.42 | 0.13 | - | - | 0.00 | 9.73 | 0.42 | 0.13 | - | - | - | |
Golden Point Underground | 0.08 | 3.02 | 0.01 | 6.37 | 2.28 | 0.47 | 6.45 | 2.29 | 0.47 | 2.4 | 1.8 | 0.1 | |
Macraes Total | 12.7 | 0.63 | 0.26 | 42.1 | 0.91 | 1.23 | 54.8 | 0.85 | 1.49 | 27 | 0.8 | 0.7 | |
All figures are rounded to reflect the relative accuracy of the estimates. Totals may not sum due to rounding;
•Mineral Resources are reported inclusive of Mineral Reserves. Mineral Resources that are not Mineral Reserves do not have demonstrated economic viability;
•All Resources are based on metal prices of USD2,450 /oz gold, NZD/USD exchange rate of 0.60;
•Open Pit Resources are constrained by optimised shells based upon economic assumptions above;
•Open Pits cut-off grades between 0.25 g/t Au and 0.30 g/t Au;
•Golden Point underground cut-off grade is 0.97 g/t Au;
•Underground Resources are reported within volumes guided by conceptual stope designs which are based upon economic assumptions above. Reported underground Resources exclude dilution; and
•Matthew Grant, Senior Geologist – Resource Development at Macraes is the Qualified Person for the Mineral Resource Estimates.
1.10Mineral Reserve Estimate
The Mineral Reserves reported by category are presented in Table 1-2. These Mineral Reserves are a subset of the Mineral Resources tabulated in Table 1-1.
| | | | | | | | |
| Released: March 27, 2026 | Page 25 of 213 |
Table 1-2 Macraes Mineral Reserve estimate as at December 31, 2025
| | | | | | | | | | | | | | | | | | | | | | | | | | | | | | | | |
Gold | Proven | Probable | Proven & Probable | |
Tonnes (Mt) | Au (g/t) | Contained Ozs (Moz) | Tonnes (Mt) | Au (g/t) | Contained Ozs (Moz) | Tonnes (Mt) | Au (g/t) | Contained Ozs (Moz) | |
Macraes | |
Coronation | 0.22 | 1.23 | 0.01 | 4.9 | 0.66 | 0.10 | 5.12 | 0.69 | 0.11 | |
Coronation North | 0.11 | 1.12 | 0.00 | 3.34 | 0.58 | 0.06 | 3.46 | 0.6 | 0.07 | |
Innes Mills | 1.28 | 1.3 | 0.05 | 10.3 | 0.61 | 0.20 | 11.6 | 0.69 | 0.26 | |
Golden Bar | 0.14 | 1.25 | 0.01 | 1.15 | 0.94 | 0.03 | 1.29 | 0.97 | 0.04 | |
Stockpiles | 9.73 | 0.42 | 0.13 | - | - | 0.00 | 9.73 | 0.42 | 0.13 | |
Sub-total-Open Pit | 11.5 | 0.55 | 0.20 | 19.70 | 0.64 | 0.40 | 31.20 | 0.61 | 0.61 | |
Goden Point Underground | 0.04 | 2.01 | 0.00 | 2.57 | 1.9 | 0.16 | 2.62 | 1.90 | 0.16 | |
Total Macraes | 11.5 | 0.56 | 0.21 | 22.3 | 0.78 | 0.56 | 33.8 | 0.71 | 0.77 | |
All figures are rounded to reflect the relative accuracy of the estimates. Totals may not sum due to rounding;
•Mineral Reserves are reported based on a cut-off grade based on metal price assumptions, exchange rates and mining, processing, general and administrative costs;
•Open pit reserves for Innes Mills, Coronation and Coronation North are stated using a 0.25 g/t Au cut-off and for Golden Bar using a 0.30 g/t Au cut-off;
•Underground reserves are stated using 1.08 g/t Au where ore drive development is required and 0.94 g/t Au where development is in place;
•Reserves are based on a USD2,200 /oz Au gold price; NZD/USD exchange rate of 0.60;
•The Macraes processing plant recovery varies based on ore source and feed grade – an average recovery of 77% is estimated.
•Open pit dilution and recovery estimates are built into the underlying Resource models and no further adjustments are made;
•Underground insitu recovery, mining recovery and dilution modifying factors have been applied resulting in an average underground mining recovery of 89% of the designed tonnage and 77% of the designed grade;
•Mineral Reserves have been estimated based on mine designs and plans consolidated into a Life of Mine Schedule;
•Knowell Madambi, Manager - Technical Services & Projects at Macraes is the Qualified Person for the Open Pit Mineral Reserve Estimate; and
•Euan Leslie, Group Mining Engineer based in Brisbane is the Qualified Person for the Underground Mineral Reserve Estimate.
1.11Mining Methods
OceanaGold has prepared Life of Mine production plans from Mineral Reserves for the period 2026-2032 at Macraes. This schedule sees new open pit cutbacks at Innes Mills, Coronation North, Coronation and Golden Bar and continuation of the Golden Point Underground from 2026 to 2029. The production rates forecast are consistent with recent performance. The mine production plans are considered reasonable for the purpose of long-term scheduling.
The Innes Mills Stages 7 and 8, and Gay Tan Stage 5 were mined by open pit methods in 2025, and supplied approximately 4.9 Mt of ore, while the Golden Point Underground (GPUG) mine supplied a further 0.9 Mt of ore. Stockpiles provided supplementary feed when required. The combined Macraes production for the twelve months ended December 31, 2025 was 147 koz.
Mining of Innes Mills Stage 7 and Gay Tan Stage 5 was completed in 2025. Mining of Innes Mills Stage 8 is expected to be completed in 2027. Innes Mills Stages 9, 10, 11 and 12 are an expansion on the main Innes Mills pit and mining is scheduled to start in IM 9 and 10 pit stages in mid-2026.
The current combined open pit, stockpile and underground Mineral Reserves of 0.77 Moz support a mine life at Macraes extending to 2032. The combined open pit and underground schedule from 31 December 2025 is shown in Table 1-3. As noted previously, Macraes is actively seeking to identify potential additional ore sources through drilling campaigns and studies to increase mining inventories and extend mine life beyond the existing reserve life.
| | | | | | | | |
| Released: March 27, 2026 | Page 26 of 213 |
The open pit and underground operations are owner-operated by OceanaGold with a range of contractors supporting the mining operations. OceanaGold’s performance at Macraes has demonstrated that the mining equipment and mining methods are suited to the required mining rates and deposit geometry. Open pit and underground mine design procedures are appropriate and have been conducted in accordance with established industry standards and with input from appropriately qualified geotechnical specialists, hydrological and hydrogeological specialists, and other subject matter experts and consultants.
The mining and ore processing schedules have factors applied to account for poor weather, public holidays, and use equipment availability and utilization, and mill throughput parameters in line with historical performance.
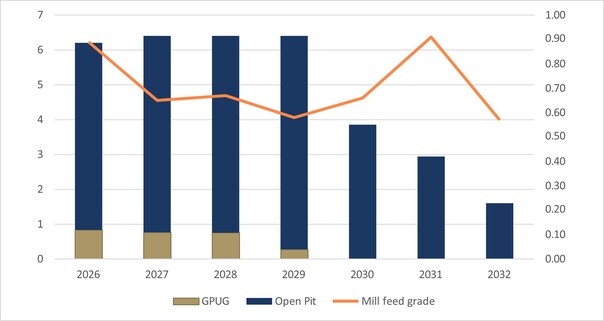
Table 1-3 Combined open pit and underground ore processing schedule
| | | | | | | | | | | | | | | | | | | | | | | | | | | | | |
| Units | 2026 | 2027 | 2028 | 2029 | 2030 | 2031 | 2032 | LoM |
Open Pit Schedule |
Total Ore Milled Quantity | Mt | 5.37 | 5.64 | 5.65 | 6.13 | 3.85 | 2.94 | 1.60 | 31.18 |
Total Milled Gold Grade | g/t Au | 0.72 | 0.49 | 0.51 | 0.53 | 0.66 | 0.91 | 0.57 | 0.61 |
Total Milled Contained Gold | koz | 124 | 88 | 93 | 104 | 82 | 86 | 29 | 607 |
Underground Schedule |
Total Ore Milled Quantity | Mt | 0.83 | 0.76 | 0.75 | 0.27 | - | - | - | 2.62 |
Total Milled Gold Grade | g/t Au | 2.02 | 1.87 | 1.88 | 1.68 | - | - | - | 1.90 |
Total Milled Contained Gold | koz | 54 | 46 | 45 | 15 | - | - | - | 160 |
Combined Open Pit and Underground |
Total Ore Milled Quantity | Mt | 6.21 | 6.40 | 6.40 | 6.40 | 3.85 | 2.94 | 1.60 | 33.80 |
Total Milled Gold Grade | g/t Au | 0.89 | 0.65 | 0.67 | 0.58 | 0.66 | 0.91 | 0.57 | 0.71 |
Total Milled Contained Gold | koz | 178 | 134 | 139 | 118 | 82 | 86 | 29 | 768 |
Gold Recovery | % | 81.6 | 74.5 | 75.7 | 71.8 | 79.6 | 82.5 | 71.3 | 77.8 |
Gold Production | koz | 145 | 100 | 105 | 85 | 65 | 77 | 21 | 598 |
1.11.1Open Pit Mining Methods
The open pit mining operation utilises hydraulic excavators and diesel rigid dump trucks to extract both waste and ore, while an electric-hydraulic shovel is restricted to bulk waste. Blasting requires relatively light powder factors compared with some other operations due to the comparatively weak and fractured rock mass. Ore is blasted in 7.5 m high benches and excavated in three, nominally 2.5 m high, flitches. For backhoe excavators, waste is blasted in 15 m benches and excavated in four flitches, and for the electric shovel, waste is blasted and excavated in 10 m benches.
The open pit fleet is held to a consistent size from 2026 to 2032. The fleet includes three Hitachi EX3600 backhoe excavators, one Hitachi EX3600 electric shovel, and one Hitachi EX2500 excavator loading up to twenty-four Caterpillar 789C/D haul trucks. The open pit hauling fleet for the current plan is reduced to twenty-one trucks in 2031 and five trucks in 2032.
| | | | | | | | |
| Released: March 27, 2026 | Page 27 of 213 |
1.11.2Underground Mining Methods
Macraes underground mining is completed by a combination of retreat uphole and reverse-fire open-stoping methods along the line of strike. The underground ore is dumped at an in-pit stockpile for periodic re-handling by the open pit fleet to the process plant's run of mine stockpile. Dilution and ore loss factors used in the mining schedule are supported by extensive operating experience.
The underground retreat uphole stope mining operation utilises electro-hydraulic development jumbos, diesel load-haul-dump units, diesel haul trucks and longhole drill rigs to extract both waste and ore. The uphole retreat stope voids are not backfilled, and the mine design utilises yielding pillars between adjacent extracted stopes to gradually deform over a timeframe that permits ore extraction.
The current underground fleet will be maintained from 2026 to 2028, reducing to one truck and two loaders in 2029.
1.12Recovery Methods
The Macraes Operation process plant comprises a crushing and grinding circuit that reduces ROM ore to a nominal particle size of 80% passing 120 µm to 140 µm at a treatment rate of approximately 6.4 Mtpa. The sulfide ore is then recovered through the flotation circuit to produce a concentrate, which is reground down to an 80% passing size of 15 µm. Grinding of the flotation concentrate is required to make it suitable for treatment in the pressure oxidation process.
Plant availability and utilization has been maintained at approximately 95% and 94%, respectively, which is at the high end of typical industry benchmarks for similar designed plants of the same age. Overall, recoveries shown in Table 1-3, are considered reasonable given the refractory, preg robbing nature and low feed grade of the ores. The processing plant has the capacity to treat up to 6.4 Mtpa and incorporates a SAG mill, flotation circuit, autoclave for pressure oxidation of the concentrate, CIL plant and smelting facilities.
In the pressure oxidation circuit, the sulfide ore in the concentrate is oxidized suitably for gold recovery in the CIL circuit. The CIL and elution processes recover the gold into a concentrated solution from where the precious metal is recovered through electrowinning, with final smelting of the electrowinning cathodes into gold doré.
1.13Infrastructure
OceanaGold continues to maintain required infrastructure at Macraes, including road access, power, water supplies and administration facilities. Surface infrastructure required to support the life of mine plan is in place or requires only minor modifications.
Tailings and waste rock disposal facilities are maintained and managed on an ongoing basis. Progressive rehabilitation is ongoing. There is enough tailings storage capacity in the current Frasers Tailing Storage Facility (FTSF) to store tailings for the remainder of the mine life. A raise of the FTSF to accommodate tailings to beyond 2032, for future growth opportunities, is being designed for the resource consent and permit application to be submitted in Q3 2026.
| | | | | | | | |
| Released: March 27, 2026 | Page 28 of 213 |
1.14Environmental Studies and Permitting
Environmental management and mitigation measures are well maintained at Macraes and are managed to meet resource consent conditions and permit requirements (Rodger, 2026).
The Macraes Operation is fully consented for current operations, with actual and potential environmental effects regularly monitored and reported to the relevant agencies. The consents and permits are issued by the Otago Regional Council (ORC), the Dunedin City Council (DCC), Environment Canterbury (ECAN) and the Waitaki District Council (WDC).
The Macraes Operation Mineral Reserves, plant site, tailings dams and waste rock stacks are located on land that is covered by mining permits, and which OceanaGold owns or has access to mine. All material permits and landholder agreements are in good standing.
The mineral permits are in good standing, and their duration is currently sufficient and can be extended, to allow future mining of the Resource within the permits as MP 41 064 expires in 2030 and MP 52 738 expires in 2045.
The site environmental documentation is appropriate and follows Environment Management System (EMS) principles. It is also aligned with the OceanaGold Integrated Management System (IMS) which maintains an EMS structure in alignment with ISO4001. Documentation is reviewed and updated regularly.
Current mining operations have resource consents up to 2028 while the tailings storage facility has resource consents up to 2032. Resource consent applications are being finalised for lodging in Q3 2026 for the Innes Mills Stages 11 and 12 pits, Coronation Stages 6 and 7, Golden Bar Stages 2 and 3, Golden Point underground extension and Frasers Tailings Storage Facility Stage 3. OceanaGold has a reasonable expectation that these consents will be approved to allow for planned mining operations.
OceanaGold is in partnership with Otago Fish and Game, a semi-government organization, to manage a Trout Hatchery on the Macraes mine site.
Overall, no material environmental issues have been identified to limit the ongoing operation of the mine within the planned schedule.
1.15Capital and Operating Costs
Capital and operating costs are well-known from the 35 years of operations and have been appropriately applied to develop cut-off grades and inputs into economic analysis.
There is no material expansion planned for production rates at Macraes based on the reported Mineral Reserves. The production schedule is being implemented through to completion of the open pits and underground operations. Capital and operating costs were estimated in NZD and then converted to USD using an exchange rate of 0.58 USD:NZD.
Mining, Processing, and General and Administration (G&A) operating cost estimates for Macraes are considered reasonable and consistent with recent experience.
Capital cost estimation and forecasting are considered reasonable and consistent with proposed development programmes and ongoing requirements. Common to all mining operations, there is a
| | | | | | | | |
| Released: March 27, 2026 | Page 29 of 213 |
risk of fluctuation in capital expenditures due to unforeseen problems, modifications, upgrades and introduction of new technology.
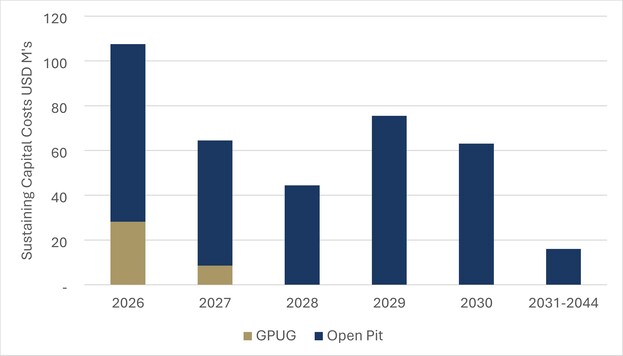
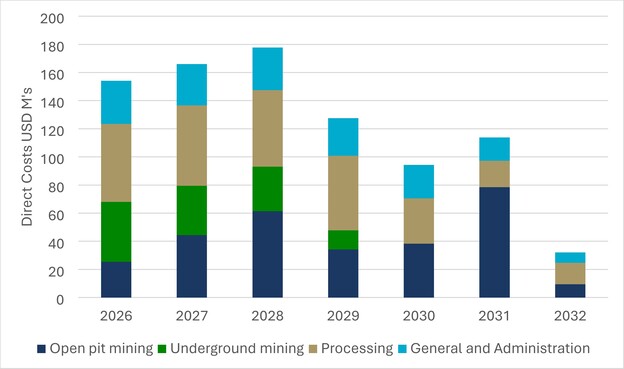
Total capital expenditures are provided by area in Table 1-4 and by year in Figure 1-2, and the total operating costs are provided by area in Table 1-5 and by year in Figure 1-3.
Table 1-4 LoM sustaining capital expenditure
| | | | | | | | | | | | | | | | | | | | |
Capital Expenditure | LoM Plan Total (NZD M) | LoM Plan Total (USD M) |
| Open Pit | Underground | Total | Open Pit | Underground | Total |
Pre-strip | 420.6 | | 420.6 | 243.9 | | 243.9 |
Tailings | 3.1 | | 3.1 | 1.8 | | 1.8 |
Underground decline development | | 53.9 | 53.9 | | 31.2 | 31.2 |
Processing facilities | 20.2 | | 20.2 | 11.7 | | 11.7 |
Exploration capital | 3.9 | | 3.9 | 2.3 | | 2.3 |
General capital | 108.5 | 11.6 | 120.1 | 62.9 | 6.7 | 69.7 |
Asset sales | (63.8) | | (63.8) | (37.0) | | (37.0) |
Total capital expenditure | 492.5 | 65.5 | 557.9 | 285.6 | 38.0 | 323.6 |
Lease payments & interest | 78.9 | 40.6 | 119.6 | 45.8 | 23.6 | 69.4 |
•Notes: Exchange rate – USD:NZD 0.58
Figure 1-2 Capital expenditure for LoM
| | | | | | | | |
| Released: March 27, 2026 | Page 30 of 213 |
Table 1-5 LoM operating cost summary
| | | | | | | | | | | | | | |
Operating Expenditure | NZD | USD |
LoM Total $M | $/t | LoM Total $M | $/t |
Open Pit Mining | 502.3 | 2.96 | 291.3 | 1.72 |
GPUG Underground Mining | 212 .0 | 81.38 | 123.0 | 47.20 |
Processing Costs | 493.8 | 14.62 | 286.4 | 8.48 |
General and Administration Costs | 284.1 | 8.41 | 164.8 | 4.88 |
Total Direct Costs | 1,492.2 | - | 865.5 | - |
•Exchange rate – USD:NZD 0.58
Figure 1-3 LoM direct operating costs
1.16Economic Analysis
The Macraes Operation consists of an operating surface and underground mine with a mill. The milling facility is fed by both the open pit and underground mine with supplementary feed rehandled from stockpiles.
Macraes is expected to produce 0.6 Moz of payable gold over a 7-year mine life at an average rate of 85 koz Au per year during full production years with a LoM all-in sustaining cost (AISC) of US$2,237 /oz Au.
The Macraes Operation is expected to incur sustaining capital in the amount of US$393 million over the modelled life and a non-sustaining capital spend, including rehabilitation costs, of US$53 million for total capital expenditure of US$446 million.
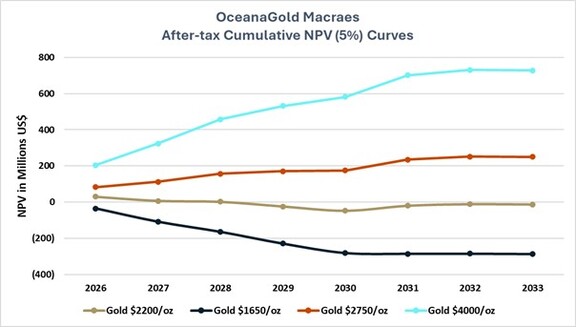
The project cash flow using the Mineral Reserve price of US$2,200 /oz gold flat over the LoM and a 5% discount rate results in a pre-tax net present value (NPV) of US($7) million and after-tax NPV of US($19) million, with projected positive cashflow from operations estimated to be offset by closure
| | | | | | | | |
| Released: March 27, 2026 | Page 31 of 213 |
costs. As a result of significant depreciation and depletion, the operation at $2,200 /oz Mineral Reserve gold price is expected to incur US$12 million in income tax liability at the Mineral Reserve price. Existing loss carry-forwards have not been included in the economic model. Inclusion of these items may further reduce the income tax liability of the operation.
OceanaGold provides an alternative price profile more reflective of current market conditions (refer to section 22.4.2) which consists of a flat US$4,000 /oz gold price over the life of the operation. At these prices and a 5% discount rate, the project is estimated to produce pre-tax and after-tax NPV values of US$912 million and US$722 million, respectively. Income tax payments amount to US$212 million in this scenario (US$190 million in NPV terms).
As summary of the model results for both the reserve case and the OceanaGold price case is presented in Table 1-6.
Table 1-6: Indicative Economic Results
| | | | | | | | | | | |
Description | US$000’s | US$000’s | |
Scenario | Reserve Case Price | Alternative Price | |
Market Prices | |
Gold (US$/oz) | 2,200 | 4,000 | |
Payable Gold (Moz) | 0.6 | 0.6 | |
Revenue | |
Gross Gold Revenue | 1,315,160 | 2,391,200 | |
Operating Costs | |
Total Operating Costs | 915,969 | 944,913 | |
Operating Margin (EBITDA) | 399,191 | 1,446,287 | |
Taxes | |
Income Tax | 12,254 | 212,497 | |
Operating Cash Flow | 386,937 | 1,233,790 | |
Capital | |
Sustaining Capital | 392,954 | 392,954 | |
Closure and Rehabilitation | 53,262 | 53,262 | |
Total Capital | 446,216 | 446,216 | |
Metrics | |
Pre-Tax Free Cash Flow | (12,594) | 1,034,502 | |
After-Tax Free Cash Flow | (24,848) | 822,005 | |
Pre-Tax NPV at 5% | (7,036) | 912,326 | |
After-Tax NPV at 5% | (18,995) | 722,205 | |
Because the Macraes Operation is operational and is valued on a total project basis and not by an incremental analysis, an initial rate of return (IRR) value is not relevant in this analysis. In terms of sensitivity, the project is most sensitive to gold grade and price, followed by operating costs and capital costs.
| | | | | | | | |
| Released: March 27, 2026 | Page 32 of 213 |
1.17Conclusion and Recommendations
1.17.1Conclusions
The following conclusions have been drawn from this Technical Report:
•The Mineral Resources and Mineral Reserves have been estimated in accordance with the Canadian Institute of Mining, Metallurgy and Petroleum Standard Definitions for Mineral Resources and Mineral Reserves dated May 10, 2014 (CIM definitions);
•While the geological setting and mineralization styles are well-understood, additional drilling is likely to allow further expansion of the Mineral Resource based on current and forecast gold prices;
•Potential for further extension to the LoM is being investigated through exploration drilling and feasibility studies, such as the Southern Pit Innes Mills (SPIM) Feasibility Study covering the area to the north of the existing Innes Mills pit; and
•Consenting (permitting) requirements are in place for current operations. Future LoM consenting requirements are planned to be submitted under New Zealand’s Fast-Track process in Q3 of 2026. This submission is referred to as Macraes Phase 4 Fast Track (MP4Fast).
1.17.2Recommendations
The recommended work programme costs are included in the operating and capital costs for Macraes and are not listed separately.
Exploration programmes and budget are determined annually for the following year as part of the annual budgeting process.
Based on the conclusions of the Technical Report, recommended actions have been identified and split between requirements for the existing LoM plan and investigation of future potential expansion.
Recommendations for achieving the LoM plan include:
•Complete infill drilling at Innes Mills, Coronation, Coronation North, Golden Bar and GPUG as planned in 2026 for a total cost of around NZD4.0 million;
•Progress FTSF Stage 3 detailed design and submit permit applications in Q3 2026;
•Complete lodging of MP4Fast consent submission in Q3 2026; and
•Keep the current permits and consents in good standing by continuing with the established monitoring and compliance practices.
Recommendations to investigate future potential expansion include:
•Complete Feasibility study of the SPIM Project;
•Maintain annual exploration investment to define Mineral Resources made available by an increasing gold price, replacing mining depletion and adding additional ore sources;
•Complete test work on metal recoveries for any additional potential mineable inventory identified to allow risk mitigation and support conversion to Mineral Reserves;
•Continue assessment of potential mineable targets along strike;
•Continue to assess the tungsten extraction potential of any additional ore discoveries;
| | | | | | | | |
| Released: March 27, 2026 | Page 33 of 213 |
2Introduction
2.1Terms of Reference and Purpose
This report has been prepared to support disclosures in OceanaGold’s Annual Information Form for the year ended December 31, 2025.
This report provides updated information on the Macraes Operation, including an updated Mineral Resources and Mineral Reserves estimate.
References in this report to OceanaGold include OceanaGold Corporation and its wholly-owned subsidiary, OceanaGold (New Zealand) Limited.
This report uses Mineral Reserve and Mineral Resource classification terms that comply with reporting standards in Canada and the Mineral Reserve and Mineral Resource estimates are made in accordance with the Canadian Institute of Mining, Metallurgy and Petroleum (CIM) Council – Definition Standards for Mineral Resources & Mineral Reserves adopted by the CIM Council on May 19, 2014, which were adopted by the Canadian Securities Administrators’ National Instrument 43-101 – Standards of Disclosure for Mineral Projects (NI 43-101).
2.2Purpose of the Report
This report was prepared as a National Instrument 43-101 (NI 43-101) Technical Report for OceanaGold by internal qualified persons employed by OceanaGold to provide updated technical information for Mineral Reserves and Mineral Resources for the Macraes Operation.
This report includes an economic analysis of open pit and underground mining and ore processing based on open pit and underground reserves.
This report updates the previous NI43-101 Technical Report on Macraes dated 27th March 2024 (Grant et al., 2024) which covers the period up to the end of 2023. References to this earlier document will be made throughout this report where appropriate for historical context, however all relevant information is contained within this report.
2.3Reporting Standards
This report has been prepared in accordance with Canadian National Instrument 43-101 for the ‘Standards of Disclosure for Mineral Projects’ of June 2011 (the Instrument) and the Mineral Resource and Mineral Reserve classifications adopted by CIM Council. This report complies with disclosure and reporting requirements set forth in the Instrument, Companion Policy 43-101CP, and Form 43-101F1.
2.4Authors of the Report
This technical report has been prepared by or under the supervision of the following authors, who are all employees of OceanaGold:
•Matthew Grant, as Senior Geologist - Resource Development at Macraes;
•Knowell Madambi, as Manager - Technical Services & Projects at Macraes;
•Euan Leslie as Group Mining Engineer in Brisbane, Australia; and
•David Carr as Head of Metallurgy in Dunedin, New Zealand
| | | | | | | | |
| Released: March 27, 2026 | Page 34 of 213 |
2.5Qualifications and Experience of Qualified Persons
The following serve as the qualified persons as defined in NI 43-101 for this report:
•Matthew Grant, PhD Applied Geology, MAIG, MAusIMM (OceanaGold Senior Geologist – Resource Development, Macraes) is the QP responsible for Sections 1, 4, 5, 6, 7, 8, 9, 10, 11, 12, 14 and 24.1 of this Technical Report;
•Knowell Madambi, BSc Eng (Hons) Mining MAusIMM CP(Min) (OceanaGold Manager - Technical Services & Projects, Macraes) is the QP responsible for Sections 1, 2, 3, 18, 19, 20, 21, 22, 23, 25, 26 and the open pit portions of Sections 15 and 16 of this Technical Report;
•Euan Leslie BEng Mining, BCom Econ, MAusIMM CP (Min) (OceanaGold Group Mining Engineer) is the QP responsible for the underground portions for sections 15 and 16 of this Technical Report; and
•David Carr BEng (Hons) Metallurgical MAusIMM CP (Met), (OceanaGold Group Manager - Metallurgy) is the QP responsible for Sections 13, 17 and portions of Section 25 of this Technical Report.
2.6Site Inspections
Knowell Madambi and Matthew Grant are based at Macraes. Euan Leslie is based in Brisbane and last visited Macraes on the 14th September 2023 for data verification. David Carr is based in New Zealand and visits the Macraes mine site regularly most recently on 19th November 2025 to review the future ores program progress and planning.
2.7Sources of Information
Reports and documents listed in Section 27 of this report were used to support preparation of the report. Additional information was provided by OceanaGold personnel as requested. Supplemental information was also provided to the qualified persons by third-party consultants retained by OceanaGold in their areas of expertise.
2.8Effective Date
The effective date of this report is December 31, 2025.
2.9Units of Measure
The Metric System for weights and units has been used throughout this report unless otherwise noted. Tonnes are reported in metric tonnes of 1,000 kg. Gold is reported in grams and troy ounces, where applicable (1 Troy ounce = 31.1035 grams). Monetary units are in New Zealand dollars (NZD) unless otherwise stated.
| | | | | | | | |
| Released: March 27, 2026 | Page 35 of 213 |
3Reliance on other Experts
3.1General
The Qualified Persons’ opinions contained herein are based on information provided by OceanaGold throughout the course of the investigations. The Qualified Persons have relied upon OceanaGold and the work of other consultants in various project areas in support of this Technical Report.
The Qualified Persons have used their experience to determine if the information from previous reports was suitable for inclusion in this Technical Report and adjusted information that required amending. This report includes scientific and technical information, which required subsequent calculations to derive subtotals, totals, and weighted averages. Such calculations inherently involve a degree of rounding and consequently introduce a margin of error. Where these occur, the consultants do not consider them to be material.
For reporting of environmental, permitting, and social or community impact matters in Sections 4 and 20 of this Technical Report, the Qualified Persons have relied upon information provided by OceanaGold’s Manager - Environment & Social Performance, Macraes, in a report dated January 26, 2026.
For ownership of land title and mineral titles in Section 4 of this Technical Report, the Qualified Persons have relied on ownership information provided by OceanaGold’s Manager - Legal in a report dated February 20, 2026. The Qualified Persons have not independently reviewed property title or mineral rights for the Macraes Operation, as they consider it reasonable to rely on such report.
For applicable taxes, royalties and other government levies or interests applicable to revenue or income from the Macraes Operation in Section 22 of this Technical Report, the Qualified Persons have relied on information provided by OceanaGold’s Superintendent – Management Accounting in a report dated February 19, 2026.
| | | | | | | | |
| Released: March 27, 2026 | Page 36 of 213 |
4Property Description and Location
4.1Property Location
The Macraes Operation is located approximately 60 km north of Dunedin in eastern Otago and is located north and east of the small township of Macraes. The Project comprises two Mining Permits (MP’s) granted by New Zealand Petroleum and Minerals (NZPAM) under the Crown Minerals Act (1991).
The current activity is mining from the Innes Mills and Coronation North Open Pits, and from underground at Golden Point (GPUG) all within MP41 064. The process plant, several waste rock stacks, and tailings impoundments are located within MP52 738.
The Project is located at, -45.36°S, 170.43°E (Latitude/Longitude – World Geodetic System 1984) or at 5,535,600 m N, 2,308,500 m E New Zealand Map Grid (New Zealand Geodetic Datum 1949) or at 4,973,945 m N, 1,398,635 m E New Zealand Transverse Mercator (New Zealand Geodetic Datum 2000).
A local grid (Mine Grid) has also been established for the Macraes Operation. This grid is rotated 45° west of true north, parallel with the local trend of the mineralized structures.
The Macraes Operation has a total area of 14,576.3 ha. The Macraes Operation location map and 2025 aerial image are shown in Figure 4-1 and Figure 4-2.
Figure 4-1 Macraes Operation location map
| | | | | | | | |
| Released: March 27, 2026 | Page 37 of 213 |
Macraes is predominantly surrounded by farmland grass and tussock used for high country grazing, as shown in Figure 4-2.
Figure 4-2 Macraes Operation aerial image from 2025
4.2Ownership
Land in the immediate vicinity of the OceanaGold mining operations, and most of the land in permits MP52 738 and MP41 064, is owned by OceanaGold. Land not used for active mining activities is leased to local farmers. OceanaGold land ownership extends beyond those two permits as shown in Figure 4-3. Land outside the OceanaGold holdings is currently owned by a variety of landowners.
| | | | | | | | |
| Released: March 27, 2026 | Page 38 of 213 |
In general, OceanaGold property boundaries follow existing cadastral boundaries. Where OceanaGold boundaries have departed from these, the boundaries have been surveyed by registered surveyors.
Figure 4-3 Macraes Operation farm holdings and mine area
| | | | | | | | |
| Released: March 27, 2026 | Page 39 of 213 |
4.3Mineral Titles
OceanaGold holds contiguous Mining Permits (MP) granted under the Crown Minerals Act 1991 to the north-west and south-east of Round Hill, covering approximately 27 km of strike along the mineralized Hyde Macraes Shear Zone (HMSZ) as shown in Figure 4-1 and detailed in Table 4-1.
The Crown Minerals Act 1991 allows for extensions of permit duration and the permit areas subject to compliance with the technical requirements of the Crown Minerals (Minerals other than Petroleum) Regulations 2007 and the Minerals Programme for Minerals (Excluding Petroleum) 2025. During 2026 OceanaGold intends to apply to extend the permit duration of MP41 064
Table 4-1 Macraes Operation minerals permit
| | | | | | | | | | | | | | | | | | | | | | | |
Permit No. | Licence | Location Name | Date Commenced | Term Length | Term Expires | Area (Hectares) | Interest in Permit |
MP 52 738 | OceanaGold | Round Hill | 31/10/2010 | 35 Year | 30/10/2045 | 395.40 | 100% |
MP 41 064 | OceanaGold | Macraes Extension | 01/02/1994 | 36 Years | 31/01/2030 | 14171.5 | 100% |
A previously held exploration permit EP60 589 Round Hill East over an area of 9.4 ha, expired on 13 July 2025, and at that time the area held under title reduced from 14,576.3 ha to 14,566.9 ha.
4.4Nature and Extent of Title
The granting of a mineral permit does not confer a right of access to land subject to the permit. A permit holder must arrange land access with the owner and occupier of the land before beginning any prospecting, exploration or mining for minerals on or in land (other than minimum impact activity as defined in the Crown Minerals Act 1991). Access arrangements are binding on successors in title provided they are registered against affected land titles where the term is longer than six months.
OceanaGold currently has no access agreements for land covered by mineral permits it does not own, and in the future may need to negotiate access agreements to the properties that cover the Nunns, Stoneburn and any extension to Golden Bar Resources, none of which are Mineral Reserves. OceanaGold has a set of principles that guide its approach to land access aimed at minimising impacts and delivering access agreements that are fair and reasonable.
Any activity carried out below the surface of any land subject to a permit will not be considered, for the purposes of the land access requirements of the Crown Minerals Act, to be prospecting, exploration or mining on or in the land and consequently will not require an access arrangement, if the activity will not or is not likely to:
•cause any damage to the surface of the land or any loss or damage to the owner and/or occupier of the land;
•have any prejudicial effect regarding the use and enjoyment of the land by the owner and/or occupier; and
•have any prejudicial effect regarding any possible future use of the surface of the land.
| | | | | | | | |
| Released: March 27, 2026 | Page 40 of 213 |
4.5Location of Mineral Resources
Mineralized zones at Macraes are located along the surface trace of the HMSZ, a major northwest-southeast trending structure (see Section 7.3). All previous mining production and current Resources are located along this zone. Figure 4-4 shows the location of reported Mineral Resources within OceanaGold’s Macraes permits. Local grid coordinates for the limits of the Resource areas at Macraes are given in Table 4-2.
Figure 4-4 Macraes Operation Resource locations
| | | | | | | | |
| Released: March 27, 2026 | Page 41 of 213 |
Table 4-2 Macraes Operation Resource area boundaries
| | | | | | | | | | | | | | | | | |
Resource Area | Northing (Local Grid) | Easting (Local Grid) | |
From | To | From | To | |
Nunns / NZGT | 23,400 | 26,000 | 68,000 | 71,000 | |
Coronation North | 20,450 | 22,000 | 69,000 | 71,000 | |
Coronation | 18,750 | 20,450 | 69,400 | 71,000 | |
Deepdell | 17,200 | 17,800 | 69,600 | 70,800 | |
Golden Point UG | 14,750 | 16,240 | 70,000 | 71,400 | |
Innes Mills | 12,650 | 15,000 | 68,950 | 71,000 | |
Ounce | 6,200 | 7,300 | 69,400 | 70,200 | |
Golden Bar | 5,250 | 6,350 | 70,500 | 71,350 | |
Stoneburn | -600 | 4,000 | 69,500 | 71,900 | |
Taylors | 1,175 | 1,650 | 71,850 | 72,350 | |
4.6Royalties, Agreements and Encumbrances
MP52 738 is covered under a Royalty Agreement between OW Hopgood and OceanaGold, where OceanaGold pays Hopgood a royalty of 5% of revenue if recovered by open pit mining and 3% if recovered by underground mining on any gold, scheelite or other minerals recovered from the area which was formerly PL31 595 and ML32 3047.
Under the Crown Minerals Act 1991 which applies to MP41 064 and MP52 738 royalties are payable to the Crown annually in respect of all gold, silver and scheelite that are recovered from the land pursuant to the mining permits. Royalties are calculated based on net sales revenue or accounting profits whichever is the greater. Royalties are generally calculated and payable at the following rates:
•no royalty is payable if net sales revenue from the permit is less than NZD100,000 for an annual reporting period or averages less than NZD8,333 per month if the annual reporting period for the permit is less than 12 months. Where the permit is part of a production unit, the thresholds will apply to net sales revenues from all permits in the production unit;
•a royalty of 1% Ad Valorem is payable if net sales revenue from a permit is between NZD100,000 and NZD1,000,000; and
•a royalty of either 1% Ad Valorem or 5% of the accounting profits, whichever is greater, if the net sales revenue from a permit is more than NZD1,000,000.
4.7Environmental Permitting & Compliance
4.7.1Overview
This report provides an overview of the principal environmental statutes that OceanaGold operates under to understand the extent of OceanaGold’s environmental liabilities and how these liabilities arise.
| | | | | | | | |
| Released: March 27, 2026 | Page 42 of 213 |
There are four principal agencies that oversee OceanaGold’s mining activities together with several secondary agencies. The four principal agencies are:
•Otago Regional Council;
•Environment Canterbury;
•Waitaki District Council; and
•Dunedin City Council.
In order to undertake mining of Crown owned minerals (such as gold) there are five key types of permits required:
•access arrangements with the owner of the land;
•a mining permit under the Crown Minerals Act 1991;
•Resource consents to use land, water, and air;
•Building Consents for the construction of tailings or freshwater dams; and
•Wildlife Authorities to handle and relocate wildlife away from areas to be mined.
As OceanaGold is a significant landholder in the district and the area covered under the mining permits covers most of the foreseeable mining target, the key ongoing approval processes are related to resource consents, building permits and wildlife authorities.
Resource Consents Description
The Resource Management Act 1991 (RMA) is currently the primary piece of legislation governing the use of land, water and air resources in New Zealand. The RMA process is summarized below.
Under the RMA process as it stands territorial authorities and regional councils have primary responsibility for administering the consenting regime. Their functions are defined within the RMA (Sections 30 and 31 RMA) but in simple terms, relevant to OceanaGold’s activities, territorial authorities manage the effects of land use change and noise, whilst regional councils manage effects associated with:
•water quality (surface, ground and coastal water);
•taking, damming, diversion of water;
•discharges of contaminants into or onto land, air, or water, and discharges of water into water; and
•the bed of any water body, and the planting of any plant in, on, or under that land.
In managing the effects of activities on the matters above, both territorial authorities and regional councils seek to give effect to the purpose of the RMA (Section 5 RMA), which is “to promote the sustainable management of natural and physical resources”. Sustainable management is defined by the RMA as the use, development, and protection of natural and physical resources in a way, or at a rate, which enable people and communities to provide for their social, economic, and cultural wellbeing and for their health and safety while:
•sustaining the potential of natural and physical resources (excluding minerals) to meet the reasonably foreseeable needs of future generations;
•safeguarding the life-supporting capacity of air, water, soil, and ecosystems; and
•avoiding, remedying, or mitigating any adverse effects of activities on the environment.
Supporting the purpose of the RMA are several principles relating to managing the use, development, and protection of natural and physical resources, that OceanaGold “recognises and
| | | | | | | | |
| Released: March 27, 2026 | Page 43 of 213 |
provides for” (Section 6 RMA), “has particular regard to” (Section 7 RMA), and “takes into account” (Section 8 RMA).
The term “effect” includes (Section 3 RMA):
•any positive or adverse effect;
•any temporary or permanent effect;
•any past, present, or future effect;
•any cumulative effect which arises over time or in combination with other effects – regardless of the scale, intensity, duration, or frequency of the effect, and includes;
•any potential effect of high probability; and
•any potential effect of low probability which has a high potential impact.
The RMA places restrictions on the use of land (Section 9 RMA), the subdivision of land (Section 11 RMA), the use of the coastal marine area (Section 12 RMA), on certain uses of beds of lakes and rivers (Section 13 RMA), water (Section 14 RMA), and the discharge of contaminants into the environment (Section 15 RMA). Activities that ‘use’ land, water, and air cannot legally occur unless they are permitted by a rule in a district or regional plan or have a Resource Consent granted.
A Resource Consent is therefore permission from a territorial authority or regional council to undertake an activity that would otherwise contravene a statutory plan prepared under the RMA (or Sections 9,11,12,13,14 or 15 RMA).
Applications for resource consents are typically processed in one of three ways:
•Non-notified;
•Limited notified; and
•Publicly notified.
Non-notified applications (i.e. no general public submissions are allowed) may occur when the environmental effects of the activity to be consented are no more than minor and written approvals have been obtained from any party considered potentially affected by the application. Limited notified applications may occur where the environmental effects are no more than minor, and either written approvals are unable to be obtained, or when potentially affected parties are difficult to identify. Notified applications occur when the environmental effects of the activity to be consented may be minor or more than minor and provide an opportunity for any person in New Zealand to make a submission supporting or opposing the application.
Consents are granted subject to conditions such as the requirement for an environmental bond to be paid by the consent holder, conditions to avoid, remedy, or mitigate significant adverse effects on the environment and provide for the monitoring of these effects. Failure to meet the conditions of consent may lead to prosecution, payment of fines, and in severe circumstances the cancellation of the consent. The maximum penalties available under the RMA for an individual are imprisonment for a term not exceeding 18 months, or a fine not exceeding NZD1,000,000, and for a company a fine not exceeding NZD10,000,000. If the offence is a continuing one, an additional fine may be imposed not exceeding NZD10,000 for every day or part of a day during which the offence continues.
OceanaGold holds all required resource consents for the activities it currently undertakes. Compliance with the conditions of resource consents is discussed below.
| | | | | | | | |
| Released: March 27, 2026 | Page 44 of 213 |
Although expectations over how effects from activities are assessed and the level of mitigation required for managing those effects have changed over time, OceanaGold has a robust understanding of the resource consenting process, engages competent specialists (many of whom have a long-standing relationship with the Macraes Operation) to undertake assessments, and has effective working relationships with the territorial and regional councils.
In December 2025 the Government introduced two new Bills to replace the RMA: the Planning Bill and the Natural Environment Bill. The Government aims to pass them into law in 2026. OceanaGold will submit on the proposed legislation and follow the enactment process closely. Once the legislation is passed OceanaGold’s future resource consenting will be conducted under the new regime and/or the Fast-Track Approvals Act 2024 as appropriate.
In 2024 the Government enacted the Fast-track Approvals Act 2024 (FTAA) for consenting projects of regional or national significance. The FTAA enables a suite of approvals to be obtained in one process, including resource consents, access arrangements, concessions, wildlife authorities and archaeological authorities.
The Macraes Operation has a project listed in Schedule 2 of the FTAA – Macraes Phase 4 Fast Track (MP4Fast) - which will enable OceanaGold to apply under the FTAA to, in stages, expand the existing open pit and underground gold mining operations to enable output of approximately 130,000 ounces per annum to 2036. OceanaGold is preparing to utilise the new FTAA process to accelerate consenting processes by lodging an application for MP4Fast approvals in Q3 2026.
Mining Permits/Crown Minerals Act 1991
Mining permits for the Macraes Operation have been issued under the Crown Minerals Act 1991 (CMA) for currently consented Life of Mine mining requirements.
The allocation of rights to prospect, explore or mine for minerals owned by the Crown is carried out by the issuing of permits under the CMA. “Crown owned” minerals include all naturally occurring gold and silver and some coal and other metallic and non-metallic minerals and aggregates.
4.7.2Access Arrangements
Access Arrangements under the CMA are agreements sought with landowners to allow for surface access to allow exploration activities to be conducted. At the time of entering into an access arrangement under general terms and conditions, it is OceanaGold’s practice to include an option to purchase, subject to obtaining Overseas Investment Office consent, should exploration results prove favourable.
OceanaGold currently owns approximately 13,540 ha of land covering and in the immediate vicinity of the Macraes Operation. The land is within tenements MP52 738 and MP41 064. The current exploration forecast suggests that in the future Oceana may need to negotiate access agreements to the privately owned properties that cover the Nunn’s, Stoneburn and any extension to Golden Bar Resources.
4.7.3Compliance
Management of compliance by the regulating authorities is undertaken through several mechanisms:
•submission of and in some cases presentation of annual plans and reports for activities;
| | | | | | | | |
| Released: March 27, 2026 | Page 45 of 213 |
•compliance audits and inspections, undertaken; and
•self-reporting of incidents which result in or have the potential to result in non-compliance with consents and permits.
The primary agencies involved in the submission of annual plans are New Zealand Petroleum and Minerals (in the case of the Mineral Permits) and the territorial and regional authorities (Councils) in the case of resource consents.
Audits are conducted by the Councils either on an annual basis or on a consent- or topic-specific basis, and inspections are also annual and can be ad-hoc. In some cases, the Councils will work with other related government institutions such as the Department of Conservation, on topic-specific audits.
Progress against corrective actions identified in audits and inspection are tracked in the Corporate Database, InControl.
| | | | | | | | |
| Released: March 27, 2026 | Page 46 of 213 |
5Accessibility, Climate, Physiography, Local Resources, and Infrastructure
5.1Accessibility
Access to the mine is by sealed highway from Dunedin, and then via sealed roads from Middlemarch and Palmerston. There is good access along mine roads and farm tracks throughout the project area.
The Macraes Operation is within short driving distance to several populated centres:
•Macraes, approximately 6 km by road from the Macraes Operation process plant, consists of approximately 40 families (including surrounds);
•Dunedin, a university city with a population of 130,000, is 90 km away by road;
•Oamaru with a population of 14,000 is 105 km by road; and
•Palmerston, with a population of 900, is 37 km by road (Stats NZ, 2024).
OceanaGold provides bus services from Oamaru and Dunedin with many pick-up points enroute. A domestic and international airport is in Dunedin, which also has an operating seaport. A national trunk railway line from Christchurch to Dunedin passes through Palmerston.
5.2Physiography
The project area is situated on an elevated (approximately 490 m above sea level) plateau drained by a trellis pattern of north-westerly and north-easterly trending streams. Parts of the plateau are deeply dissected. Elevations range from 200 m to 820 m above sea level.
Vegetation is comprised of a combination of improved pasture and tussock grassland, while streams and gullies are choked by matagouri, gorse, thistles and wild rose. The predominant land use is stock grazing, with small areas covered by pine plantations.
5.3Climate
Daily temperatures average 15 °C in summer and 5 °C in winter, with maximums ranging up to just over 30 °C in summer with winter minimums down to -7 °C. Snow regularly falls during the winter months but rarely enough to severely restrict access.
Rainfall averages 650 mm per year but can vary by about 80 mm per year depending on topography. There is little seasonal variation in rainfall, but monthly totals can be quite variable, and the area is susceptible to long dry periods. Droughts, which last two or three years, have been recorded in the east Otago region every 10 to 20 years.
Based on the aggregate of past experience, open pit planning assumes 650 hours of lost mining time per year due to rainfall, snow or fog. Underground mining and processing plant operations are unaffected by weather.
| | | | | | | | |
| Released: March 27, 2026 | Page 47 of 213 |
5.4Land Resources and Infrastructure
5.4.1Sufficiency of Surface Rights
OceanaGold has all necessary rights and mining permits for current mining operations at the Macraes Operation. Planned mining extensions in Innes Mills, Coronation, Coronation North, Golden Bar and GPUG extension along with required tailings storage, require approval of additional resource consents. Application preparations are in progress for submission in Q3 2026.
Any future discoveries may require new consents.
5.4.2Power
Macraes is connected to the local power grid, which provides a reliable electrical power supply. The power line has adequate capacity to supply the mine at full operating limits.
5.4.3Water
Water is drawn from the Taieri River and pumped to the site. Through storage and active recycling, an adequate reservoir of process and potable water is maintained to enable continuous operation, even in times of drought conditions.
5.4.4Communications
Macraes is connected to the New Zealand ultrafast broadband fibre network, providing both voice and internet access. The mine site utilises a local area network for computer connections.
A multi-channel radio network is utilised for operations communication in the mine and process plant.
5.4.5Mining Infrastructure
The Macraes Operation area is sufficient to contain the current open pit and underground mines, process plant, haulage roads, tailings storage areas and waste rock storage areas. Furthermore, sufficient surface area is available within Macraes Operation area for the construction of any infrastructure necessary for the potential development and mining of other deposits under consideration.
5.4.6Labour
Mining, processing and support staff are drawn from the local region, with all living in the nearby towns or commuting from Dunedin. Recruitment of suitably skilled and experienced employees for all areas of the operation has been regularly achieved and maintained.
Contract support services are readily available from Palmerston, Oamaru, Waikouaiti and Dunedin.
| | | | | | | | |
| Released: March 27, 2026 | Page 48 of 213 |
6History
6.1Historical Mining
The earliest alluvial mining in the district commenced at Murphy’s Flat in 1862, with Macraes Flat, Deepdell and some parts of Horse Flat being worked soon after (Hamel, 1992). Murphy’s Creek was the major early alluvial workings and there is evidence that all of its tributaries were being worked in the 1860’s. The Murphy’s Creek alluvial workings are reasonably well preserved and are of historic significance (Hamel, 1992).
Lode quartz mining commenced in the 1860’s, but the scale of operations was very small. The Golden Point/Round Hill lode system was not discovered until 1889. Development of Golden Point commenced in 1889 and it became established as a significant scheelite and gold producer. From 1890 to 1933, it produced an estimated 13,000 ozs of gold and 800 tons of scheelite (Williamson, 1939). Other areas mined included Maritana, Golden Bell and Deepdell but quantities were small with a total reported of 8,463 tons of crushed ore for 1,630 ozs of gold and 50 tons scheelite (Williamson, 1939). Lodes were worked for either scheelite or gold depending on the price at the time. This was because the fine grinding required to liberate the gold resulted in poor recovery of scheelite.
Areas continued to be mined after 1939 as tungsten was in demand during the Second World War but gold prices were sharply reduced during this time. The scale of operations was small, and work was discontinuous. As a result, records of ore production are poor. Local miners suggest that less than 100 tonnes of scheelite was mined since 1939, but estimates are widely varied. It was a question of economics (due to preferential recoverability of gold or tungsten) not availability that controlled the scheelite industry at Macraes Flat.
The first lode worked in the Macraes field was probably the Duke of Edinburgh, described by Ulrich in 1875 (Williamson, 1939). He also mentions the Golden Bar Reef and the Moonlight Reef, at the head of Macraes Flat, but gives no details. In 1888, the Highlay Reef was discovered on the Mareburn, and the lode was traced to Golden Point, where it was opened out in 1889. Further prospecting soon resulted in the opening of other mines along the lode, some of them, however, being little more than surface workings.
The mines that have been worked, given in order eastward, are Mount Highlay, New Zealand Gold and Tungsten, Coronation, Golden Bell, Maritana, Deepdell, Golden Point, Round Hill, Innes, Mills, Griffins, Golden Ridge, Ounce and Golden Bar (Williamson, 1939).
Figure 6-1 shows historical mining areas in relation to modern open pit and underground mining zones.
| | | | | | | | |
| Released: March 27, 2026 | Page 49 of 213 |
Figure 6-1 Macraes historical deposits
6.2Prior Ownership
The original permits at Macraes were owned by Golden Point Mining Limited and BHP Gold Mines (New Zealand) Limited, owned by BHP Gold Mines Limited. During December 1989, Macraes Mining Company Limited (MMCL) obtained 100% ownership of these permits and mining commenced in 1990. On May 14, 1999, Macraes Mining Company Limited changed its name to Gold and Resource Developments (New Zealand) Limited and again to GRD Macraes Limited on June 30, 2000. Finally, on May 18, 2004, the name was changed to OceanaGold (New Zealand) Limited.
6.3Previous Work (Pre – 1990)
Details on the exploration activities conducted in the Macraes region prior to 1990 when MMCL acquired the Macraes permits are from Redden and Moore (2010). This included approximately 56,000 metres of RAB, RC and diamond drilling in 779 holes.
6.3.1Geochemistry
Stream Sediment Sampling
During 1987, an orientation stream sediment sampling survey was conducted by BHP Gold Mines (New Zealand) Limited (BHP), in the Round Hill Area. The results from a total of 64 samples taken showed total sediment fine fraction samples (-20# and -80#) gave the best results.
Although the bulk cyanide leach method returned lower detection level results, this method was adopted for use on a regional basis due to ease of sample collection.
| | | | | | | | |
| Released: March 27, 2026 | Page 50 of 213 |
6.3.2Geophysics
Two geophysical surveys have been carried using induced polarisation (IP)/Resistivity; one by Homestake New Zealand Exploration Limited (HNZEL), in April 1985 and a second by BP Oil in 1986.
The objective of the HNZEL survey was to test the ability of IP to discriminate between ore grade Au-scheelite- sulfide mineralization at Round Hill (intersected by diamond drilling) from weakly mineralized parts of the lode shear system south of Round Hill employing dipole-dipole and gradient array IP surveys. The survey lines were orientated both grid east, across the line of lode, and grid north, parallel with the strike of the lode system but across the trend of the Round Hill shoot. A dipole spacing of 50 m was used.
Dipole-dipole traverses revealed chargeability responses more or less associated with outcrop of the main lode, however the anomaly was stronger than what would be expected from the sulfide content of the lode system (generally less than 1% total sulfide with maximum of 2-5% in sulfidic zones) and may be related to graphite associated with the shear system. A chargeable source near the centre of line 14,900 m N was associated with very weak mineralization intercepted in diamond drill hole (DDH) 5.
The surveys across the Round Hill Shoot failed to clearly discriminate between the shoot and weakly mineralized lode to the south. The gradient array surveys on these lines revealed anomalies in the vicinity of Ferguson’s workings (Southern Pit – 14,200-14,400 m N) in which graphitic rocks are exposed. In summary, IP chargeability anomalies may define a shear system of the Macraes type, especially if sufficient graphite is present, but the variability of sulfide content within the lode system is too low to discriminate between high grade mineralized shoots and low grade or barren parts of the lode system (Robinson, 1986).
In 1986, BP Oil New Zealand Limited (Minerals Division), (BP Oil), carried out a total of 32-line km of dipole-dipole IP/Resistivity surveying at Nunn’s-New Zealand Gold and Tungsten, Frasers (south of the alluvial flats along Macraes Road), Golden Ridge, Golden Bar and Frasers East (Coochey, 1986; Moore,1986). The bulk of this survey, 19-line km, was over Frasers and Golden Ridge. A comparative analysis of the IP survey results with subsequent drilling was not completed, however it appears that the results were similar to those of HNZEL.
On November 17, 1987, BP Oil undertook a down-hole geophysical survey on drill hole GRRC 14 (Moore,1987). BPB Instrument Limited carried out the demonstration log recording dip-meter analysis, density logs, focused electric and resistivity logs, neutron-neutron and gamma logs. Moore reported that the logs which provided the most information, and which correlated with the down-hole geology were resistivity, focused electric, density, and dip-meter analysis.
During 1987, the Ministry of Works and Development Central Laboratories used portable “OYO” equipment to log 13 holes on the eastern high wall side of the (then proposed) Round Hill pit (Brown,1988). BPB Instruments Limited also logged one of these holes which enabled a comparison between the two contractors. The surveys were reasonably successful with a similarity of results between the two contractors. The results of the survey became very useful allowing for the interpretation of structures required for slope stability analysis.
| | | | | | | | |
| Released: March 27, 2026 | Page 51 of 213 |
6.3.3Drilling
During 1970, Helpet Mining Company Limited drilled 28 holes in the Macraes Flat area exploring for tungsten mineralization. Core recovery was poor, and mineralization was found to be sporadic and discontinuous. Kennecott Exploration (Australia) Pty Ltd also undertook exploration in the area in 1970-71, but their reconnaissance work did not include drilling.
In 1984, Homestake New Zealand Exploration Limited commenced exploration at Round Hill and by the end of 1986 had drilled over 5.5 km of strike on the Deepdell, Round Hill and Frasers systems at 100 m to 200 m drill hole spacings. This drilling defined the Round Hill shoot which was amenable to open cast mining (Lee et al, 1989).
Following HNZEL’s success in the Macraes Flat region, BP Oil obtained licences to the north-west and south-east of Macraes along the HMSZ. Between 1986 and 1988, BP Oil carried out drilling at Nunns, Golden Ridge, Ounce, Golden Bar and Frasers East.
Drilling has continued at Round Hill and adjacent prospects since the purchase of HNZEL by BHP in 1987 and subsequently by MMCL in 1990.
6.4Historical Estimates
Prior to 2010 there were no relevant historical Resource estimates for the Macraes Operation compliant with NI 43-101 rules or CIM guidelines (Redden and Moore 2010). However, the mine had been in production for approximately 19 years to that date and Resource estimates for the deposits were routinely updated and refined over time.
Since 2010 all Resource estimates have been completed in accordance with CIM guidelines. The current Resource estimates (as of December 31, 2025) are presented in Section 14.
6.5Previous Production
Historical production from the Macraes Goldfield is poorly recorded. The Golden Point mine produced an estimated 13,000 ozs of gold and 800 tons of scheelite from 1890 to 1933 (Williamson, 1939).
Since the commencement of mining in 1990, the combined Macraes open pits and underground mines have produced over 5 Moz. Since 2000, annual gold production from Macraes has ranged between 125 koz and 210 koz.
| | | | | | | | |
| Released: March 27, 2026 | Page 52 of 213 |
7Geological Setting and Mineralization
7.1General
The Macraes gold deposits lie in a major, low-angle (~15-20°) structure known as the Hyde Macraes Shear Zone (HMSZ). This regionally-continuous, late-metamorphic deformation zone cuts greenschist facies metasedimentary rocks of the Otago Schist. The Otago Schist is a moderately high-pressure metamorphic belt (Yardley, 1982) that formed by collisional amalgamation (“Rangitata” Orogeny) of the Caples and Torlesse terranes in the Early-Middle Jurassic (Coombs et al.,1976; Bishop et al., 1985; Little et al., 1999).
7.2Regional Geology
The Otago Region derives its characteristic landscape from extensive ranges of metamorphic rocks (collectively named the Otago Schist) which form a broad belt running from coastal Otago through to the Southern Alps where they are bounded and offset by the Alpine Fault (Figure 7-1). These basement rocks represent the deepest exhumed portion of a thick pile of sea-floor mudstones and sandstones that accumulated as an accretionary wedge above a long-lived convergent plate margin of the Gondwana supercontinent during the Late Paleozoic-Mesozoic (~300 to ~100 million years ago).
Thickening and compression of the accretionary wedge during ongoing plate convergence resulted in regional metamorphism of the deeply buried sediments and associated deformation and recrystallisation to schist from the Early to Middle Jurassic (Adams et al, 1985). Evidence of regional cooling from the Early Cretaceous is described as marking the onset of rapid erosional unroofing following crustal thickening and the start of uplift of the schist (Little et al, 1999). Extension in the brittle upper part of the crust is recorded by the local preservation of late Cretaceous fault-bounded and non-marine sedimentary units with abundant schist clasts (Mitchell et al, 2009). The extensional rifting culminated in the opening of the Tasman Sea around 85 million years ago which initiated separation of New Zealand continental crust from the Australian-Antarctic landmass. Cessation of tectonic activity following the separation allowed steady erosion of the rifted landmass to a terrain of low relief by the early Cenozoic. The resulting peneplain is preserved as the planar and gently rolling form of the present-day Central Otago ranges.
The quiescent tectonics through the Early to Middle Cenozoic produced a transgressive marine sequence of mudstones and limestones that form the cover rocks unconformably overlying schist well exposed around coastal Otago. Further inland, the deposition of fluvial and lacustrine sediments is locally preserved in fault basins. Sporadic intraplate volcanic activity occurred during this time; however, the bulk of local volcanic activity occurred during the Middle Miocene. Many monogenetic volcanic centres erupted in the Otago province, whereby flow deposits and tuffs capped the cover sediments and schist basement.
With the inception of the Australian/Pacific Plate boundary through the Late Miocene-Pliocene the tectonic regime radically changed to one of active compressional deformation and regional uplift. Across Otago this is accommodated by reverse faulting, including the reactivation of some existing Cretaceous faults (with an opposite sense of motion). Faulting has disrupted the schist, eroded most of the cover sequences and formed the present-day basin and range topography in Central Otago (Forsyth, 2001).
| | | | | | | | |
| Released: March 27, 2026 | Page 53 of 213 |
Within the Otago Schist there are widespread examples of orogenic-style gold such as Macraes (Groves et al 1998, 2003) that formed throughout the post-metamorphic peak uplift history (Craw and Norris, 1991). A general model for ore formation within the Otago Schist describes metal-bearing fluids produced by dehydration reactions during prograde metamorphism channelled to structurally higher levels in the crust through large scale shear zones and faults (Craw and Norris, 1991; Pitcairn et al 2006). Mineralization occurs at sites where changes in temperature and pressure of migrating fluids, or the chemistry of the surrounding rocks allows precipitation of minerals such as quartz and sulfide minerals. Where mineralization conditions and fluid flow are sustained over time, then gold and or tungsten can accumulate as ore (McKeag and Craw, 1989; Allibone et al, 2018).
The estimated crustal depth of the Otago Schist orogenic gold deposits varies by deposit and ranges from ~12 km to less than 1 km (McKeag and Craw, 1989). Faulting during uplift of the schist and subsequent Cenozoic block faulting and erosion has juxtaposed different structural levels at the present-day surface. The depth of formation also broadly correlates with the mineralization age, with the deepest examples being the oldest (Mortensen et al, 2010).
Figure 7-1 Regional geological setting
7.3Local Geology
The Macraes mining area is centred on the Hyde-Macraes Shear Zone (HMSZ), the largest known gold-bearing feature within the Otago Schist. Striking north-west and dipping shallowly (15-20°) towards the north-east, the shear zone can be traced 30 km along strike where schist is exposed at surface and only ends where it is covered by younger volcanic rocks in the north at Hyde and sedimentary rock cover in the south towards Palmerston.
The HMSZ consists of variably altered, deformed, and mineralized schist up to 150 m thick, known as the Intrashear Schist. The thickest part of the shear zone consists of several mineralized zones stacked on metre-thick shears. These shears have ductile deformation textures overprinted by cataclasis (Craw and Angus, 1999). The HMSZ is hosted in lower greenschist facies (chlorite zone)
| | | | | | | | |
| Released: March 27, 2026 | Page 54 of 213 |
schist and has been juxtaposed against upper greenschist facies schist (“Footwall Psammite”) along a normal fault, the Footwall Fault (Angus et a, 1997). The Footwall Fault is younger than the HMSZ and truncates mineralization at its base.
The upper boundary between mineralized HMSZ schist (Intrashear Schist) and unmineralized lower greenschist facies schist is commonly a well-defined structure, the Hangingwall Shear. This shear ranges up to 25 m thick and is typically black due to the presence of fine-grained graphite and sheared sulfide minerals (pyrite and arsenopyrite) (McKeag et al, 1989; Craw, 2002). The Hangingwall Shear can be traced through the mined pits in the main mining area.
Figure 7-2 Macraes geology map
7.4Mineralization
7.4.1Mineralization Zones
The mineralization at Macraes is principally developed within the gently-dipping HMSZ, though anomalous grades are also recorded in narrow, steeply-dipping quartz veins locally occurring in the hanging wall schists, collectively known as the Eastern Lodes (Figure 7-2). Mining to date has occurred along a continuous strike length of 6 km in numerous staged open pits and two underground operations, four discrete satellite pits immediately to the north, and at Golden Bar, approximately 7 km to the south.
Within the shear zone, mineralization is generally constrained between the Hangingwall Shear and the Footwall Fault. Schists above the Hangingwall Shear and below the Footwall Fault are generally barren though there are exceptions to this rule, for example at Innes Mills and the Eastern Lodes. Economic mineralization is typically restricted to the upper part of the HMSZ. The Hangingwall Shear, which varies from 1 m to >30 m in thickness contains the most continuous and consistent
| | | | | | | | |
| Released: March 27, 2026 | Page 55 of 213 |
mineralization. This zones locally underlain by extensive but low grade stockwork zones which may be developed over a width of up to 100 m.
Higher-grade zones of mineralization within the shear zone form tabular shoots that may have strike lengths of >300 m and extend up to 800 m down-dip (i.e. Frasers and Round Hill). In most cases these zones are observed to trend towards the north-east (Mine Grid), oblique to the shear zone dip direction. This orientation is interpreted to be due to the interaction of the HMSZ with folds within the host schist units, creating a preferred lineation direction for mineralization. The exception to this is at Coronation North where the mineralized shoot trends towards the south-east.
Mineralization distribution is broadly consistent along the HMSZ but shows considerable variability in grade, width, continuity and geometry at mine-scale. This variability is attributed to the local development of the HMSZ structure during mineralization and the influence of host rock lithology, particularly with respect to competency contrasts.
There is a strong empirical correlation between gold, arsenic, scheelite, silicification and strain intensity within the HMSZ. Gold-scheelite-pyrite-arsenopyrite mineralization is associated with
| | | | | | | | |
| Released: March 27, 2026 | Page 56 of 213 |
replacement and fissure quartz veins within post-metamorphic shear zones. Shear parallel quartz veins and cataclastic shears contain the highest gold and scheelite grades (Lee et al. 1989).
Figure 7-3 Grade distribution along the HMSZ
| | | | | | | | |
| Released: March 27, 2026 | Page 57 of 213 |
7.4.2Mineralization Types
The following four types of mineralization occur within the HMSZ at Macraes (Mitchell et al., 2006):
•Mineralized schist. This style of mineralization involved hydrothermal replacement of schist minerals with sulfides and microcrystalline quartz. Mineralization was accompanied by only minor deformation;
•Black sheared schist. This type of schist is pervaded by cm to mm scale anastomosing fine graphite and sulfide bearing micro shears. This type of mineralization is typically proximal to the Hangingwall Shear. Scheelite mineralization occurs in the silicified cataclastic shears;
•Shear-parallel quartz veins. These veins lie within and/or adjacent to the black sheared schist and have generally been deformed with the associated shears. The veins locally crosscut the foliation in the host schist at low to moderate angles. Veins are mainly massive quartz, with some internal lamination and localised brecciation. Sulfide minerals are scattered through the quartz, aligned along laminae and stylolitic seams. These veins range from 1 cm to > 2 m. Scheelite mineralization is associated with quartz veining in some areas; and
•Sheeted veins (laminated veins) locally known as ‘stockwork veins’. These occur in the Intrashear Schist and consist of numerous steeply dipping veins. Stockwork veins are typically traceable for 1-5 m vertically with most filling fractures that are 5 – 10 cm thick but can be up to 1 m thick. These veins generally display evidence of incremental opening.
Gold is associated with pyrite and arsenopyrite in all the above styles of mineralization. Rarely free gold up to 300 μm occurs in quartz veins but mostly presents as 1-10 μm scale blebs hosted in and near sulfide grains (Angus, 1993).
Tungsten (as scheelite) is found predominantly within mineralized quartz veins, although a subordinate phase of disseminated scheelite and a mineralization phase are also observed (Farmer, 2016). The main phase of tungsten mineralization occurred early in the development of the deposit and typically occur in the same lode and vein structures as gold mineralization. However, tungsten mineralization is not genetically related to gold mineralization. MacKenzie (2015) recognised 5 types of scheelite. Types 1,3,4,5 are fine grained and disseminated varieties. Type 2 scheelite is the coarse grained to massive creamy coloured scheelite that was mined historically but is not currently recovered.
Within the Macraes open-pits, gold mineralization comprises a combination of Hangingwall, shear-parallel quartz veins (‘concordant lodes’), and ‘stockwork’ veins.
Apart from Coronation, a large amount of irregular mineralization occurs between the base of the Hangingwall and the Footwall Fault. This is stockwork mineralization and generally appears in the drilling as clusters of elevated gold grades. Stockwork mineralization refers to mixtures of steeply-dipping narrow quartz veins and concordant lodes, which appear discontinuous at the Resource drilling scale. The Footwall Fault lies between 80 m and 120 m below the Hangingwall Shear and is easily identified in drill holes as a distinctive light-grey fault gouge between 5 and 30 cm thick. To date, no economic mineralization has been located below the Footwall Fault.
| | | | | | | | |
| Released: March 27, 2026 | Page 58 of 213 |
A schematic sketch cross section through the HMSZ of the stratigraphy and mineralization is shown in Figure 7-4.
Figure 7-4 Schematic sketch cross section through the HMSZ showing styles of mineralization
7.5Deposit Geology
At present mining occurs at Innes Mills and Coronation North open pits and from Golden Point Underground (GPUG).
Future mining expansion is planned at Innes Mills, Coronation North, Coronation, Golden Bar and GPUG.
Descriptions of individual deposit geology is included where appropriate in Section 14.
| | | | | | | | |
| Released: March 27, 2026 | Page 59 of 213 |
8Deposit Types
8.1General
The Macraes deposit is an example of an orogenic style gold deposit. This style of deposit is recognised to be broadly synchronous with deformation, metamorphism, and magmatism during lithospheric-scale continental-margin orogeny (Groves et al., 1998). Most orogenic gold deposits like Macraes occur in greenschist facies metamorphic rocks. In New Zealand, favourable hosts for orogenic gold deposits of Paleozoic and Mesozoic age are found throughout the South Island (Figure 8-1).
Orogenic deposits are typically formed on retrograde portions of pressure- temperature time paths during the last increments of crustal shortening and thus postdate regional metamorphism of the host rocks (Powell et al., 1991 and references therein). Orogenic deposits can be subdivided into epizonal, mesozonal, and hypozonal based on pressure-temperature conditions of ore formation. The Macraes deposit falls into the mesozonal category with mineralization having occurred near to the brittle-ductile transition at about 300°C.
In orogenic deposits the association between gold and greenschist grade rocks is commonly thought to be related to: 1) the large fluid volume created during the amphibolite and/or greenschist transition and released into the greenschist zone; 2) the structurally favourable brittle-ductile zone that lies just above this transition; 3) fluid focusing and phase separation that are most likely to occur as fluids ascend into the greenschist pressure-temperature regime and/or gold solubility shows a sharp drop under greenschist facies temperatures (Phillips, 1991). Fluid
| | | | | | | | |
| Released: March 27, 2026 | Page 60 of 213 |
migration along fault-fracture networks was likely to be driven by episodes of major pressure fluctuations during seismic events.
Figure 8-1 Orogenic gold deposits of New Zealand
| | | | | | | | |
| Released: March 27, 2026 | Page 61 of 213 |
9Exploration
9.1General
Exploration conducted in the Macraes region prior to 1990 when MMCL acquired the Macraes permits is summarized in Section 6.
Exploration by OceanaGold and its predecessor companies from 1990 to the end of 2009 is covered in Redden & Moore (2010) updated to end of 2023 in Grant et al. (2024).
9.2Geology
9.2.1Geological Mapping
Detailed geological mapping has been completed at various times along the strike of the HMSZ. The last major mapping exercise was in Macraes North in 2016 covering the gap between Coronation and Nunns but only interpreted rather than outcrop geology was plotted. Rock exposure and interpreted geology are shown in Figure 9-1.
9.3Geophysics
No new geophysical surveys have been completed since 2007 apart from re-processing of data from the 2007 electromagnetic survey completed by Fugro.
Between 1990 and 2009 the following surveys completed by OceanaGold, and its contractors is listed in Table 9-1.
Table 9-1 Geophysical surveys completed
| | | | | | | | | | | |
Date | Survey Type | Contractor | |
1991 | Seismic | Works consultancy services | |
1994 | Seismic | Institute of Geological & Earth sciences (IGNS) | |
2004 | Seismic | Otago University | |
1994 | Electromagnetic (LOTEM, CSAMT, TEM, HEM) | IGNS | |
1995, 1997 | DIGHEM | Geoterrex Ltd | |
2007 | Electromagnetic | Fugro | |
Results of these surveys are covered in detail in Redden & Moore (2010) and will not be repeated here.
| | | | | | | | |
| Released: March 27, 2026 | Page 62 of 213 |
Figure 9-1 Macraes interpreted and outcrop geology
| | | | | | | | |
| Released: March 27, 2026 | Page 63 of 213 |
9.4Geochemistry
9.4.1Stream Sediment Sampling
Stream sediment sampling campaigns were undertaken in 1991 (Grieve, 1991), in 1994 (Bleakley, 1994) and during 1995. As of June 30, 1997, 803 BLEG (bulk leach extractable gold) stream sediment samples had been collected on the Macraes Operation area to complete first pass sampling and infill anomalous catchments. Additionally, 241 total sediment fine fraction (TSFF) stream sediment samples were also collected. The location of all stream sediment samples collected on the project is shown on Figure 9-2.
Figure 9-2 Macraes stream sediment sampling
Bulk leach extractable gold (BLEG) samples consisted of approximately 2 kg to 3 kg (dry weight), of -2 mm sediment, collected from multiple points ranging from trap sites in active creek channels to over bank fines. Many samples were collected from creeks with low water flow and small active sediment content, which may limit the catchment area sampled. Sediment from these creeks consisted of organic-rich fine silts and clays trapped by vegetation. Recent orientation sampling from creeks draining known mineralization (i.e., the Frasers and Golden Ridge Prospects), produced assays from 78.7 ppb to 3,353 ppb gold and 40 ppm to 170 ppm arsenic.
9.4.2Soil Sampling
Soil sampling of B horizon soils using a hand or motorised hand auger has been carried out over a large part of the Macraes current and former permit areas. Samples are routinely analyzed for arsenic, with some samples also analyzed for gold, tungsten and antimony. Arsenic is interpreted as the most reliable path finder element.
| | | | | | | | |
| Released: March 27, 2026 | Page 64 of 213 |
In total, approximately 18,000 soil samples have been collected across the Macraes current and former permit areas. The location of all soil samples collected on the project is shown as Figure 9-3.
For conventional sampling, a 2 kg un-sieved sample is collected from 0.25 m to 1 m depth using an auger at each station. Samples usually reached the soil/bedrock interface and consisted of B and C horizon material.
During 1997, two new soil geochemistry techniques were trialled. A two-phase orientation survey testing the Mobile Metal Ion (MMI) technique was conducted, with a total of 604 samples collected. The technique is based on the location of ‘blind’ mineralization through the detection of highly mobile ionic species, including gold, which is shed from mineralization at depth and moves up through the substrate to become weakly bound to soil particles. A very weak solute is used followed by ICP-MS analysis. The results of the orientation were inconclusive, and the programme was suspended.
From November 2008 to end 2012, all soil samples have been analyzed by ICP-MS at SGS Waihi for Au, As, Sb and W. This has included an extensive soil programme over the eastern parts of the Macraes North and Hyde exploration permits that successfully delineated extension of the Hangingwall Shear north of Coronation.
In 2015 a soils sampling programme by Hardie Resources on an adjacent permit crossed over into EP40 576, then held by OceanaGold. 19 samples were collected and analyzed by a portable XRF analyzer for a range of elements including arsenic but not gold.
| | | | | | | | |
| Released: March 27, 2026 | Page 65 of 213 |
Figure 9-3 Macraes soil sampling locations
| | | | | | | | |
| Released: March 27, 2026 | Page 66 of 213 |
9.5Trenching
Approximately 17,000 linear metres of trenches have been excavated at Macraes, with approximately 5,300 trench rock samples collected.
Trenches are mapped and rock chip sampled, with samples typically analyzed for gold ± arsenic, ± tungsten ± antimony. In general, the soil profile is shallow in the Macraes area allowing trenching to be undertaken by light (12 tonne) excavators in most areas. Although stream beds and areas of extensive alluvial cover present some difficulties, trenching has proven to be an excellent exploration tool for geological mapping and geochemical sampling.
Trenches are mapped at 1:100 scale with horizontal channel samples collected over geological intervals from 0.5 m to 6 m. Samples were submitted to the AMDEL laboratory on site for gold, arsenic and tungsten analysis.
9.6Remote Sensing
In 1994, MMCL purchased a 10 m resolution, monochrome 1990 Spot image of the eastern Otago region.
Digital satellite imagery over the Macraes Operation was purchased from Digital Globe Limited in July 2005, March 2006, March 2007, January 2008 and June 2009. The Quickbird satellite imagery is in the visible spectrum, with a resolution of 5 m and was used for base maps and for rough plan view area calculations for overall disturbance and rehabilitation for Environmental reporting purposes.
9.7Aerial Photography
Colour aerial photography was flown by New Zealand Aerial Mapping Limited during January 1996. Photography was captured at a nominal scale of 1:30,000. 1:5,000 colour enlargements were produced as an aid to programme planning, geological mapping and interpretation.1:5,000 black and white orthophotographs have been rectified differentially to the Macraes local grid.
Updated colour aerial photography was flown over the Macraes area in March 2005 by Terralink International Limited. Images were supplied as 0.5 m resolution digital orthophotographs on the Macraes local grid.
Since 2012 updated colour aerial photography is flown over the Macraes every one to two years by Aerial Surveys Ltd. The most recent photography was in March 2025 with the images supplied at a 0.20 m resolution. These provide excellent documentation of the evolution of surface activities as a result of mining and exploration activities.
9.8Exploration Statement
Exploration surveys and investigations of the Macraes area detailed above have been carried out by OceanaGold, except where a contractor or consultant is named.
| | | | | | | | |
| Released: March 27, 2026 | Page 67 of 213 |
10Drilling
10.1Summary
By the end of 2025 over 1.2 million metres from over 9,500 exploration and Resource infill holes had been drilled across the Macraes Goldfield since the 1980's, predominantly by Reverse Circulation percussion or Diamond drilling methods.
The Mineral Resource inventory is based on the results of 731,052 metres of exploration drilling in 5,828 holes, supplemented by 31,804 metres of drilling from 760 non-exploration holes, used in ten Resource estimate areas.
Four companies, BP Minerals, Homestake, BHP and OceanaGold have drilled the holes but only holes drilled by OceanaGold are used in the Resource estimates. The exceptions are the Stoneburn Resources which also used the earlier drilling.
The underground Resource estimate at GPUG also uses underground diamond drill holes completed for grade control and stope definition purposes.
A breakdown of drilling by Resource area as at the end of December 2025 are summarized in Table 10-1. Non-exploration holes are largely diamond drillholes for either geotechnical or underground grade control.
Table 10-1 Drilling summary by Resource area
| | | | | | | | | | | | | | | | | |
Resource Area | Exploration Holes used in current Resource Estimates | Non-Exploration holes included in Current Resource Estimate | |
Holes | Meters Drilled | Holes | Meters Drilled | |
Nunns | 84 | 5,597 | - | - | |
Coronation North 1 | 639 | 70,924 | 7 | 457 | |
Coronation 1 | 432 | 47,402 | 25 | 596 | |
Deepdell 2 | 528 | 51,166 | - | - | |
Golden Point Underground 2,3 | 1,929 | 286,760 | 413 | 21,317 | |
Innes Mills 3 | 2,175 | 276,665 | 315 | 9,434 | |
Golden Bar | 282 | 39,921 | - | - | |
Ounce | 54 | 6,530 | - | - | |
Taylors | 82 | 3,479 | - | - | |
Stoneburn | 223 | 11,747 | - | - | |
Total 4 | 5,828 | 731,052 | 760 | 31,804 | |
•Coronation North and Coronation share 11 holes;
•Deepdell and Golden Point Underground share 2 holes;
•Golden Point Underground and Innes Mills share 612 holes; and
•Total of all holes used across multiple estimates.
| | | | | | | | |
| Released: March 27, 2026 | Page 68 of 213 |
Figure 10-1 Macraes drill hole locations
| | | | | | | | |
| Released: March 27, 2026 | Page 69 of 213 |
10.2Historical Drilling
Limited information is available regarding the specific details of drilling prior to 1990. Drilling was principally completed on the near surface parts of Golden Point, Round Hill, Southern Pit, Innes Mills and Frasers (Figure 10-2). All Resources associated with this drilling have been mined. Consequently, as mentioned above these are not used in modelling.
Figure 10-2 Drill hole locations prior to 1990
| | | | | | | | |
| Released: March 27, 2026 | Page 70 of 213 |
10.3OceanaGold Drilling
Details of the drilling completed by OceanaGold post 1990 is shown in Table 10-2 and Figure 10-3. Historical drilling (pre-1990) completed by Homestake and BHP minerals has been included where available.
Over 8,750 exploration holes for a combined 1.17 million metres have been drilled between 1990 and 2025. Most metres (58%) were completed using Reverse Circulation (RC) Percussion drilling delineating open pit Resources. A third of the metres (35%) were completed by diamond coring from surface or a diamond tail including the percussion precollar and since 2007 exploration drilling of diamond core from underground platforms comprises nearly 7% of total metres. The remaining metres (<1%) include open hole percussion, aircore and sonic drilling methods from surface. The sonic and aircore drilling were sampling tailings material within embankments for tungsten content and geotechnical reasons and do not have samples used in Resource estimation.
| | | | | | | | |
| Released: March 27, 2026 | Page 71 of 213 |
Table 10-2 Macraes exploration drilling summary
| | | | | | | | | | | | | | |
Year | Hole Type | No, Holes | No. Meters | |
1984 | DDH | 15 | 2,163 | |
1985 - 1989 | DDH | 75 | 9,193 | |
OPH | 185 | 5,156 | |
RC/DD | 29 | 4,225 | |
RCH | 475 | 35,342 | |
1990 - 1994 | DDH | 56 | 4,517 | |
OPH | 74 | 1,712 | |
RC/DD | 9 | 1,952 | |
RCH | 1,186 | 110,629 | |
1995 - 1999 | DDH | 23 | 3,175 | |
OPH | 18 | 589 | |
RC/DD | 199 | 49,727 | |
RCH | 2,273 | 317,452 | |
2000 - 2004 | DDH | 15 | 2,350 | |
RC/DD | 206 | 78,700 | |
RCH | 479 | 33,595 | |
2005 - 2009 | Aircore | 77 | 2,638 | |
DDH | 48 | 18,296 | |
RC/DD | 102 | 39,641 | |
RCH | 107 | 6,501 | |
UGDD | 39 | 3,673 | |
2010 - 2014 | DDH | 16 | 2,450 | |
RC/DD | 65 | 22,245 | |
RCH | 494 | 54,452 | |
UGDD | 231 | 41,941 | |
2015 - 2019 | DDH | 137 | 30,122 | |
OPH | 24 | 561 | |
RC/DD | 136 | 26,180 | |
RCH | 1,615 | 125,006 | |
Sonic | 6 | 476 | |
UGDD | 228 | 21,899 | |
| | | | | | | | |
| Released: March 27, 2026 | Page 72 of 213 |
| | | | | | | | | | | | | | |
2020 – 2023 | DDH | 293 | 86,111 | |
RC/DD | 103 | 21,360 | |
RCH | 306 | 23,266 | |
UGDD | 79 | 8,959 | |
2025 - | DDH | 85 | 21,715 | |
RC/DD | 11 | 2,511 | |
RCH | 43 | 7,298 | |
Figure 10-3 Exploration Drill meters by year from surface and underground
10.4Surveys
Current practice is to survey drill hole collars locations using RTK GPS (GNSS since 2023 when base station equipment was upgraded). Current survey precision is ±15 mm horizontal, ±30 mm vertical.
Prior to March 1994, down-hole deviation surveys were not completed on any of the RC percussion or percussion drill holes. For holes drilled since March 1994, down-hole deviation surveys have been attempted on all RC percussion holes that exceeded 50 m in depth, using an Eastman single shot or multi- shot camera. Holes are generally surveyed at 50 m intervals to the end of the hole.
Surface diamond holes are routinely surveyed every 25 m to 50 m. Current surveys are completed with gyro tools. Survey information is routinely recorded in an acQuire geological database.
Underground diamond holes are routinely surveyed at 10 m then at every 15 m to the end of hole.
Air-core holes do not have down-hole surveys.
| | | | | | | | |
| Released: March 27, 2026 | Page 73 of 213 |
10.4.1Magnetic to Macraes Grid Conversion
For downhole surveys using magnetic tools, azimuths were recorded then converted to the Macraes mine grid azimuths by adding a correction that included magnetic declination. Up until the end of 2011 this correction was assumed to be 67° (that is 67° is added to the magnetic reading to give the Macraes grid azimuth).
However, in September 2011 a check using a 105 m long underground probe hole along a development drive in the Frasers Underground found that this correction should have been 69.5° relative to the Macraes grid. This is due to the location of the magnetic North Pole drifting east by around 4.5 minutes per year at this location in NZ. It is uncertain when the original Macraes grid was set up but a reasonable assumption is that it was based on a topographical map from the early 1980s and this adequately explains the difference.
As a result of this study, the earlier drill hole azimuths were adjusted in the acQuire database at the end of 2011 as shown in Table 10-3.
Table 10-3 Magnetic to Macraes grid azimuth corrections
| | | | | | | | | | | |
Drill Hole Date Range | Correction Factor | Records Affected | |
1/1/2005 to 2011 | 70.5 | 4,127 | |
1/1/1995 – 31/12/2004 | 70 | 13,408 | |
1/1/1985 – 31/12/1994 | 69.5 | 3,667 | |
Pre 1985 | 69 | 36 | |
Drill hole surveys from 2011 to 2015 had a correction factor of 70.5 ° applied.
Drill hole surveys from 2016 onwards have a correction factor of 71 ° applied.
Since 2024 downhole surveys for surface and UG holes are collected using gyro tools and so no correction is required.
10.5Logging Procedures
RC percussion and most air core programme drill holes are geologically logged at one-metre intervals, with each metre being classified into one of nineteen summary rock codes listed in Table 10-4. Rock code classification is based on a combination of textural and mineralogical properties.
Diamond drill core is photographed and then geologically logged using the same rock codes and additional detailed pre, post and syn-mineralization structures and mineralogy are recorded. The summary rock codes are plotted on cross sections and are used in combination with the assays to develop a geological interpretation which include three mineralized elements.
These elements are the a) Hangingwall Shear, b) concordant lodes and c) stockwork. The Hangingwall and concordant lodes consist of a combination of Cataclasite, Quartz Cataclasite, Silicified Breccia and Lode Schist. In general, the Hangingwall has greater proportion of Cataclasite lithologies logged than the concordant lodes, which typically consist of more Lode Schist lithologies. The stockwork mineralization is identified on cross sections by a combination of Stockwork and Quartz vein lithologies.
| | | | | | | | |
| Released: March 27, 2026 | Page 74 of 213 |
Drill hole information is stored in an acQuire database. For holes prior to 1994 only collar, interval and assay information has been entered into the database, while for all holes from 1994 onward the database contains all logged information.
Aircore drilling holes on the tailings storage facilities are geologically logged using two codes only: ‘C’ records the schist boulders and gravel used to build mattresses, causeways and embankment lifts; ‘T’ is used to record tailings material of fine-medium grained sand. The distinction is easily recognised by field technicians, and the contacts are typically defined to within a decimetre by the drilling crew. The colour of the tailings material is usually a monotonous grey although thin (<2 m) horizons of yellow-brown oxidation staining are noted and can be correlated between holes.
Table 10-4 Summary of rock code descriptions
| | | | | | | | |
| Code | Description |
Cataclasite | ca | Quartz poor (<15%) dark grey/black fine grained cataclasite |
Quartz cataclasite | qca | Quartz rich (15-50%) dark grey/black fie grained cataclasite |
Silicified breccia | sb | >50% brecciated quartz. Generally associated with cataclasite |
Quartz vein | qv | >50% banded or milky quartz veins with no associated brecciation or cataclasis |
Lode schist | is | Weakly sheared schist with minor cataclasite/brecciated quartz |
Stockwork | swpe or swpa | From trace to 50% banded or milky quartz veins with no associated brecciation or cataclasis and hosted by either pelitic (swpe) or psammitic (swpa) schist |
Pelite | pe | Massive to laminated medium to dark grey mica-quartz-chlorite schist |
Semi-pelite | spe | Inter-layered pelite and psammite, more than 50% pelitic layers > 1 cm thick |
Semi-psammite | spa | Inter-layered psammite and pelite, more than 50% psammitic layers > 1 cm thick |
Psammite | pa | Massive to light grey-green quartz-feldspar-mica-chlorite schist, 90% psammitic |
Footwall psammite | fwpa | Light greenish-grey, often finely laminated quartz-feldspar-chlorite+/-biotite+/-garnet psammite, grain size typically 0.1-0.3 mm. Found beneath the Footwall Fault |
Greenschist | gs | Light green/brown massive quartz-mica schist |
Basalt | Ba | Massive, grey fine-grained volcanic rock of Miocene age |
Basalt breccia | bab | As for basalt but brecciated |
Lapilli tuff | tuff | Basaltic fragments 2-64 mm in diameter in fine matrix. Product of ashfall from basaltic eruptions. |
Clay | cly | Clay of variable colour and origin. May form through weathering or deposition |
Sandstone | ss | Sandstone of carriable origin and colour. May form through weathering or deposition |
Alluvial | alv | Transported cover |
Fault | flt | Light to medium grey gouge or pug, may be associated with mineralization |
| | | | | | | | |
| Released: March 27, 2026 | Page 75 of 213 |
10.6Drilling Orientation
Surface drill holes at Macraes are typically collared between vertical and -75º oriented towards the northwest (Mine Grid). Down-hole survey information indicates that within a shallow depth (~100 m) the holes can significantly deviate, generally aligning perpendicular to the schist foliation and to the HMSZ orientation. Exceptions to this trend may occur where the foliation orientation has been disrupted, or where the schists are cut by later fault zones.
Underground drill holes are restricted to whatever mine development is available at the time and are collared in a variety of orientations and inclinations, including up-hole directions.
10.7Sampling Methods and Approach
10.7.1Introduction
The diamond drilling sampling approach has remained relatively constant over the life of the project while the sampling of the percussion drilling has changed dependent on the drilling method. A discussion of the sampling methods applied is provided below.
Drilling has typically been conducted on a regularly spaced grid. Underground drill holes are drilled in a wide range of inclinations and directions, and true widths need to be assessed on an individual basis.
10.7.2RC Percussion Sampling
The percussion drilling methods have varied substantially over the life of the project. Early drilling was open-hole percussion where the drill cuttings are returned outside the drill rod and captured in a stuffing box on the drill collar prior to being sampled via a cyclone. This drilling method is historically of a lesser quality than face sampling RC due to down-hole sample contamination and loss of sample.
After the open-hole percussion programmes, RC percussion drilling was completed using a crossover sampling sub. This method of RC percussion drilling collects the drill cuttings via a sampling tool (the crossover sub) which was positioned in the drill string immediately above the RC hammer. The sample quality of this form of RC percussion drilling is superior to that of the open-hole percussion, however down-hole contamination is still more prevalent than samples collected with a face sampling RC hammer.
Programmes of RC percussion drilling since 1990 were completed with a face sampling RC hammer. This technology uses a dual-tube system to immediately transport samples through a series of holes in the centre of the hammer, preventing contamination from the borehole wall and ensuring high-quality, dry samples even below the water table. It is considered to provide the most representative sample.
Sampling of the RC percussion drilling is completed by trained OceanaGold employees and is supervised by OceanaGold technical staff. Definition of sampling intervals for RC percussion drilling has generally been based on 1 m intervals, over the full depth of the drill hole.
| | | | | | | | |
| Released: March 27, 2026 | Page 76 of 213 |
Sampling of RC percussion drill holes up until 2009 was completed using the methods detailed below:
•RC cuttings from the drill hole are blown into a trailer-mounted or rig-mounted cyclone, then pass through a tiered riffle splitter. At the completion of each metre, the overall sample is split into a smaller analytical “A” split and larger “B” split. Both samples are collected in uniquely numbered polythene bags;
•Where the drilling sample is suspected mineralization as evidenced by the presence of sulfides or silicification, the full “A” split is sent for analysis. Similarly, where geology is less well constrained the “A” split samples is analyzed. The B split is taken to a storage area, to be kept for any further possible test work that may be required;
•Where the drilling sample is collected from rocks considered to be unmineralized (i.e. schist sequence overlying the HMSZ) then composite samples may be collected. In this case, either four or six sub-samples are collected from the “B” samples, transferred to a new bag, and submitted for analysis. Anomalous assay results from composite samples are verified by analysis of the original “A” splits;
•Sample tickets were used in the sampling process with one half (identical halves) of each ticket placed in the sample bag; and
•Once the entire metre had been sampled and placed in the polythene bag, along with the sample ticket, the bag was closed and sealed. Certified standards and blanks were also regularly inserted into the sample sequence as part of the quality control protocols. Samples were transported directly to the on-site laboratory for preparation and subsequent analyses, along with a dispatch sheet. Bags were transported by OceanaGold personnel.
From 2010 onwards the following changes have been made to the sampling protocol:
•The A split is collected in calico bags rather than polyethylene bags and the B split is left on site at the drill site. If not required, the B split bags are then emptied or buried on completion of the programme; and
•composite sampling was largely abandoned.
Further changes were made in 2017 with the replacement of the SchrammT660H drill rigs by the KWL700 drill rig:
•The B split is collected as a duplicate sample in a similar sized calico bag to the A split. Both samples are weighed. The B split samples are taken back to the core shed and stored in larger plastic bags in case later required for duplicate sampling; and
•where possible the remainder of each metre is captured in a large plastic bag and weighed before being discarded. This is to enable sample recoveries to be more accurately determined (previously visually estimated).
Prior to 1998, samples were collected from wet percussion drilling. The wet RC percussion drilling is further discussed later in the text. The sampling of wet percussion drilling has been discontinued since 1998.
The (OceanaGold) RC percussion drilling sampling protocols were assessed by external consultants in 2007 and were considered acceptable and consistent with industry standards.
An internal review was conducted by OceanaGold personnel in 2016 and some changes to the sample collection made which have since been implemented with the arrival of the KWL700 drill rig in 2017.
| | | | | | | | |
| Released: March 27, 2026 | Page 77 of 213 |
Historical drilling completed by Homestake and BHP had defined sampling protocols, which included the logging of moisture content and some twin drilling. Where holes were not wet, a good correlation was observed. These historical drilling practices are acceptable to OceanaGold. All Resources associated with this drilling have been mined out.
Historical drilling completed by Homestake and BHP had defined sampling protocols, which included the logging of moisture content and some twin drilling. Where holes were not wet, a good correlation was observed. These historical drilling practices are acceptable to OceanaGold. All Resources associated with this drilling have been mined out.
10.7.3Diamond Core Sampling
After drill core has been geologically logged and photographed, the sections of core considered to be mineralized, or proximal to mineralized zones are cut in half using a core saw. The drill core was sampled in intervals from 0.3 up to 1.5 m by trained and supervised technicians and geologists. Each interval was sampled by taking the same half of each piece of core for that metre (i.e. leaving the half with the orientation line and / or metre marks in the tray) and placing them into the appropriate sample bag.
Underground diamond core is routinely sampled whole core in intervals from 0.3 up to 1.5 m.
Definition of sampling intervals for diamond drilling are based on geological intervals or 1 m intervals, within and beyond the margins of mineralized zones identified during logging. Higher grade intervals within a lower grade intersection are characterised by more abundant sulfide mineralization and generally can be detected visually during core logging. The 1 m sampling interval established by OceanaGold is sufficient to define these higher-grade intervals and sampling intervals can go as low as 0.3 m to honour geological boundaries.
Sample tickets were also used in the sampling process with one half (identical halves) of each ticket placed in the sample bag.
Samples were transported directly to the on-site laboratory for preparation and subsequent analyses, along with a dispatch sheet. Bags were transported by OceanaGold personnel. Certified standards and blanks are regularly inserted into the sample sequence as part of the quality control protocols.
The diamond drilling and sampling is consistent with industry standard practice.
10.8Sample Quality
10.8.1Summary
The sample quality for diamond drilling is high. Sample quality for RC percussion drilling is lower than for diamond drilling but generally sufficient to define the position and grade of mineralization. Where RC sample quality issues have caused a grade bias, this bias has been addressed (section 10.8.3).
10.8.2Sample Recovery
Sample recovery from RC percussion drilling and diamond drill core is routinely recorded in geological logs and recovery data are stored in an acQuire database. Recovery is generally high, diamond core recovery averages 95% and RC percussion recovery averages 88%, and there is no
| | | | | | | | |
| Released: March 27, 2026 | Page 78 of 213 |
observed correlation between recovery and grade. From 2018, where possible, each metre of RC sample drilled has been weighted to give a better estimate of sample recovery.
10.8.3RC Wet Sample Bias
The potential for wet sampling bias for RC percussion drilling was first identified at Frasers in June 1997; some reverse circulation (RC) drill holes were sampled under wet drilling conditions leading to the potential for positive sampling bias and contamination leading to apparent upgrading of gold. Since that time, positive biases have also been identified at Golden Bar, Innes Mills and Round Hill.
Much of the legacy risk associated with wet RC sampling has been mitigated by replacement of wet RC drill holes by subsequent diamond twins. Where however, wet RC drill holes have not been replaced, the wet RC sample grades have been factored down. Factors were derived from comparative studies looking at wet RC samples paired with nearest neighbour dry RC or diamond samples.
This approach, which has been applied by OceanaGold for a number of pits, the relatively low proportions of remaining wet RC samples, and acceptable annual Resource estimate to mine reconciliations for areas mined with wet RC samples, mean that the residual risk to the Resource estimates is considered to be low.
10.9Summary of Mineralized Widths
Most mineralized intersections have been accounted for in the Resource estimates for the Macraes Operation (see Section 14).
| | | | | | | | |
| Released: March 27, 2026 | Page 79 of 213 |
11Sample Preparation, Analysis, and Security
11.1Sample Preparation Statement
Core samples (either half-cut or whole diamond drill core) and drill cuttings (RC percussion drilling) samples from the OceanaGold drilling programmes at Macraes were collected from the source drill samples by employees of OceanaGold.
Subsequent sample preparation and assay was not conducted by any employee, officer, director or associate of OceanaGold except for tungsten analyses of pulps using a portable XRF analyzer as discussed in Section 11.3.
11.2Sample Preparation, Assay and Analytical Procedures
11.2.1Graysons/AMDEL Limited
From 1990 to 1998, RC percussion drill chips and diamond drill core samples from the OceanaGold drilling programmes at Macraes have typically undergone sample preparation and assay for Au, As and S by Graysons Laboratories (Table 11-1), initially at Palmerston and then at Macraes. Graysons was bought by AMDEL Limited (AMDEL) in 1998 who then ran the laboratory until 2009.
Sample preparation of geological samples by AMDEL routinely includes drying, crushing (to 4 mm), splitting (if required) to a maximum of 1 kg and pulverising to obtain an analytical sample of 250 g with >95% passing 75 µm.
Table 11-1 Graysons/AMDEL assay techniques
| | | | | | | | | | | | | | | | | |
Element | Sub-sample size (g) | Digest | Analysis | Detection Limit (ppm or %) | |
Gold Arsenic Sulfur | 50 | Aqua Regia Perchloric/Mixed Acid N/A | Fire/AAS Leco | 0.01 | |
0.2 – 1 | 10 | |
Tungsten (WO3) | 0.25 – 0.5 | Sodium perchloride | ICP-OES | 100 | |
0.2 | 0.001% | |
WO3 Analysis undertaken by OceanaGold for the air-core drilling between September 2008 and January 2009 had been performed by AMDEL in Auckland, New Zealand. Sample preparation was undertaken on site and pulps sent to the Auckland Laboratory for analysis. The analytical method for tungsten (reported as WO3) is preparation of a fusion bead from a 0.2 g sample followed by ICP-OES.
11.2.2SGS New Zealand Limited
From June 2009 until the end of 2012 most exploration samples were prepared and analyzed off site, with the remainder (mainly Frasers in-pit infill drilling) prepared and analyzed at the on-site AMDEL laboratory. Samples were prepared at the SGS New Zealand Limited (SGS) Laboratory at Ngakawau, Westport, and analyzed there for arsenic, tungsten (by pressed pellet XRF) and sulfur (Leco). Pulp splits were sent on to the SGS New Zealand Waihi Laboratory for gold analysis by Fire Assay (Table 11-2).
| | | | | | | | |
| Released: March 27, 2026 | Page 80 of 213 |
Samples were dried, coarse crushed to a nominal -6 mm, riffle split and then pulverised in Cr steel grinding mills to -75 μm.
One 50 g pulp split was then sent to SGS Waihi for gold analysis by Fire Assay. A second 50 g sample was retained at Westport and used to make pressed powder pellets for x-ray fluorescence spectrometry (XRF) analyses for arsenic and tungsten. Pulp from core samples were also analyzed at Westport for total sulfur by furnace/ IR.
Table 11-2 SGS (NZ) limited assay techniques 2009-2012
| | | | | | | | | | | | | | | | | | | | |
Element | Method | Sub-sample size (g) | Digest | Analysis | Detection Limit (ppm or %) | |
Gold | FAA515 | 50 | Aqua regia | Fire/AAS | 0.02 | |
Arsenic | XRF75W | 20 | N/A | XRF | 2 | |
Sulfur (total) | CSA06V | 0.5 | N/A | Leco/IR | 0.03% | |
Tungsten | XRF75W | 20 | N/A | XRF | 10 | |
11.2.3ALS Minerals Laboratory, Australia
During 2009, three diamond drill holes were sent to ALS Laboratory Group Minerals Laboratory, Brisbane, Australia for sample preparation and analyses for gold (Fire Assay), sulfur (Leco) and arsenic and tungsten (pressed pellet XRF). Samples returning relatively high grades of tungsten (>1,000 ppm) or arsenic (>5,000 ppm) were re-analyzed by fused bead XRF (Table 11-3).
Drill core samples were first crushed to a nominal 70% passing -6 mm, then riffle split to a maximum weight of 3 kg and pulverised to 85% passing 75 μm. A 50 g sub-sample was analyzed for gold by Fire Assay. 20 g samples were taken for pressed powder XRF for tungsten and arsenic.
Table 11-3 ALS minerals laboratory assay techniques 2009-2012
| | | | | | | | | | | | | | | | | | | | |
Element | Method | Sub-sample size (g) | Digest | Analysis | Detection Limit (ppm or %) | |
Gold | Au-AA26 | 50 | Aqua regia | Fire/AAS | 0.02 | |
Arsenic | MEXRF05 | 20 | N/A | XRF | 5 | |
Arsenic | ME-XRF15b | 20 | Acid | XRF | 0.01% | |
Sulfur (total) | S-IR08 | 1 | N/A | Leco/Lr | 0.01% | |
Tungsten | MEXRF05 | 20 | N/A | XRF | 10 | |
Tungsten | ME-XRG15b | 20 | Acid | XRF | 0.001% | |
11.2.4SGS Limited 2013 – April 2025
SGS New Zealand Limited took over the Macraes on-site laboratory from AMDEL in June 2011 and from 2013 onwards all the exploration samples have been processed at this laboratory. Since March 2014 the laboratory has certified accreditation conforming to standard ISO/IEC 17025 for selected tests, including gold on solids by Fire Assay until April 2025.
Gold was usually the only element analyzed for but at times sulfur, arsenic, carbon and tungsten were required (Table 11-4). Samples requiring arsenic or tungsten analyses were sent to SGS
| | | | | | | | |
| Released: March 27, 2026 | Page 81 of 213 |
Westport for pressed powder XRF after being prepared at Macraes. Any samples greater than 1,000 ppm tungsten were re-analyzed using the fused bead method.
The sample preparation process for both diamond and RC samples process is as follows:
•Samples were dried at 150 °C, coarse crushed to a nominal –2 mm, split on a linear divider to 350 g and then pulverised with a Cr steel grinding head to 90% passing – 75 µm. From this 350 g a 50 g pulp was taken for Fire Assay and analyzed for gold using the atomic absorption method. From mid-2019 this was changed to a 30 g pulp to be consistent with grade control drill samples; and since 2023 the instrument finish had routinely been with a MPAES instead of AAS.
Table 11-4 SGS (NZ) Limited assay techniques 2013 – April 2025
| | | | | | | | | | | | | | | | | | | | |
Element | Method | Sub-sample size | Digest | Analysis | Detection Limit (ppm) | |
Gold | FAA505 | 50 | Aqua regia | Fire/AAS | 0.01 | |
Gold (from mid- | FAA303 | 30 | Aqua regia | Fire/AAS | 0.01 | |
2019) | | | | | | |
Arsenic | XRF75V | 20 | N/A | XRF | 2 | |
Sulfur (total) | CSA06V | 0.2 g | N/A | Leco/lR | 0.01% | |
Carbon (organic) | CSA03V | 0.25 g | acid | Leco/lR | 0.01% | |
Tungsten | XRF74V | 20 | N/A | XRF | 6 | |
Tungsten | XRF78S | 20 | acid | XRF | 80 | |
| | | | | | |
11.2.5SGS NZ Limited 2025 Onwards
From 18 March 2025 SGS New Zealand Limited started running geology and routine plant samples from Macraes through the Chrysos Photon Assay instrument. Photon Assay results currently represent 2.0 – 2.2% of the sample data within three open pit Resource estimates (Coronation North, Coronation and Innes Mills) and 0.6% of the Golden Point Underground Resource estimate.
Gold on solids is analyzed by the Photon Assay technique. In August 2025 after a period of cross comparison of results from Fire Assay the Fire Assay equipment was decommissioned.
The sample preparation process for both diamond and RC samples process is as follows:
•Samples are dried at 150 °C, coarse crushed to a nominal –2 mm, split on a linear divider to fill a Photon Assay jar with around 425 g of sample. Samples are then presented to the Chrysos instrument for analysis for gold content using a 2-cycle count.
Table 11-5 SGS (NZ) limited assay technique from April 2025 onwards
| | | | | | | | | | | | | | | | | | | | |
Element | Method | Sub-sample size | Digest | Analysis | Detection Limit (ppm) | |
Gold | PAAU02 | 440 (approx.) | N/A | Photo Assays | 0.03 | |
| | | | | | |
| | | | | | | | |
| Released: March 27, 2026 | Page 82 of 213 |
11.2.6Off-site Sample Preparation
From June 2009 to end 2012 most exploration samples were sent off-site for sample preparation and analysis.
SGS Westport and SGS Waihi
The samples (RC and half drill core) were dispatched in calico bags to SGS Westport by OceanaGold personnel for sample preparation and arsenic, tungsten and total sulfur analysis. Once the samples have been submitted to the laboratory, SGS staff process the samples and have completed all aspects of the assaying independent of the OceanaGold personnel.
ALS Minerals Laboratory, Brisbane
The half drill core samples were dispatched in calico bags to ALS Minerals Laboratory, Brisbane by OceanaGold personnel for sample preparation and arsenic, tungsten and total sulfur analysis. Once the samples have been submitted to the laboratory, ALS staff process the samples and have completed all aspects of the assaying independent of the OceanaGold personnel.
11.3Sample Analysis
The laboratories used are all accredited and have internal quality control procedures to manage the quality of the data reported to the clients.
Analytical methods and detection limits are described in Section 11.2.
11.4Quality Assurance/Quality Control Procedures
11.4.1Standards
Gold by Photon Assay
Certified Standards are currently not independently submitted by OceanaGold with Photon Assay results. Instead, SGS self-certify by inserting its proprietary Standards with each batch during the sample preparation process by SGS.
SGS compile monthly QAQC reports with performance charts of all submitted Standards.
Gold by Fire Assay
Certified Standards are routinely inserted at a rate of one in twenty samples (5%). Standards used by OceanaGold are purchased from and certified by Rocklabs up to May 2018 and Geostats Pty Limited from June 2018 to April 2025 and include various grades. Most Standards are sulphidic.
11.4.2Blanks
Blanks are routinely inserted at a rate of around one in 40 samples. Blanks used by OceanaGold have included blanks supplied by Rocklabs, basalt blanks (from Tertiary basalt near Macraes) and Footwall schist samples from under the Footwall Fault which assayed <0.01 ppm Au.
| | | | | | | | |
| Released: March 27, 2026 | Page 83 of 213 |
11.4.3Duplicates
Duplicate sampling is now routinely carried out as part of the drilling programmes and are designated field duplicates (“FD”) in the datafiles. For RC drilling field duplicates are a second split of the sample interval. For diamond drill core a quarter core sample is taken from selected intervals of the remaining half core after the first pass sampling. In addition, coarse reject and pulp duplicate sampling and replicate sampling were also routinely carried by the laboratory for the Fire Assay method.
11.4.4Core and Sample Storage
All Fire Assay pulps were returned to OceanaGold and stored in one of three storage sheds at Macraes. However, many of the pulps from the pre-2010 drilling have been lost or destroyed over time.
Exploration drill core is stored in core boxes in either one of three storage sheds or outside in a yard on pallets with the boxes strapped. Not all the core is kept and the waste rock intervals above the Hangingwall shear have been discarded in many cases.
11.4.5Actions
Sample submissions are typically done by hole.
When results are received from the laboratory the Standards and blanks are checked against the expected values before the data are loaded into the acQuire database. If any Standards are found to be more than three standard deviations from the expected value, then that run of samples (typically 40 samples) around that Standard is re-assayed. If more than two standards in a submission are found to be more than three standard deviations out the entire submission batch is re-assayed.
Monthly meetings are held with the on-site laboratory to discuss results and address any problems with the data quality, sample quality and sample volume.
11.5Opinion on Adequacy of Sample Preparation, Analysis and Security
The adoption of the sample preparation and analytical methods is considered appropriate. Quality control data exist to allow review of the analytical performance of the assay laboratories for the recent drilling. The sampling methods, sample preparation procedures and analytical techniques are all considered appropriate. The production and reconciliation performance over the previous thirty five years is consistent with this view.
| | | | | | | | |
| Released: March 27, 2026 | Page 84 of 213 |
12Data Verification
12.1Introduction
The Macraes Operation has a long history of exploration and mining. Data collection protocols and quality control procedure have varied substantially over this period. The analytical quality is monitored by the submission of certified Standards, blanks, laboratory duplicates and field duplicates. In addition to the quality control data, a substantial amount of reconciliation data are available and has been used as the final measure of data quality.
12.2Drill Hole Database
12.2.1Historical Data
Homestake and subsequently BHP data were stored digitally and transferred to Macraes Mining when BHP left the project. Original Au assay data were recorded in parts per million and grams per tonne format. Tungsten was recorded in parts per million or percentage WO3 format to three significant figures. This data were entered into the Macraes Mining Techbase Database with all tungsten data recorded as percentage WO3. The percentage values were rounded to two decimal places. Repeat analyses were combined and the average result recorded in Techbase.
Digital data and metadata for all drilling post 1994 were captured in the Techbase database.
In 2002 the acQuire geoscientific database was installed and Techbase assay data transferred to acQuire. Tungsten assays in acQuire are denoted as W but represent WO3 values (checks against historical digital files and original reports confirm this).
Further checking of the historical tungsten data were carried out in 2013 and again in 2019. Some errors were detected and corrected.
12.2.2Recent Data
The drill hole database is stored in acQuire geoscientific database software with the assay data directly loaded from digital data supplied by AMDEL up to 2010 and then by SGS from 2011 onwards. A review of the drill hole database and data flow processes was completed by external consultants in 2005, including random checks of the drill hole database against laboratory assay data during the site visit with no material errors identified. While no exhaustive review of the data has been completed, the mining and reconciliation data can be used as a check of the data robustness.
The surface drilling, underground and open pit grade control data are held in three separate databases within acQuire.
OceanaGold consider the drill hole database management is appropriate and the final database to be robust
12.3Analysis of Assay Quality Control Data
Redden and Moore (2010) included statistical analysis of the available exploration assay quality control data on drilling results up to 2009 in the onsite laboratory. These showed that although
| | | | | | | | |
| Released: March 27, 2026 | Page 85 of 213 |
there was no systematic bias in Standard accuracy and total bias for each Standard was generally less than 5%, there was also, at that time, no reasonable monitoring and follow-up of exploration quality control results. The limited number of available field duplicates also showed relatively poor precision.
There was subsequently a period from 2010-2012 when the majority of exploration samples were analyzed offsite. Summary analysis of assay quality control data during this period is included in the annual technical reports on exploration.
From 2012, exploration samples have been analyzed by the onsite laboratory with monthly tracking of Standards, blanks and duplicates routinely carried out and results discussed in the monthly meetings with the laboratory so any issues can be addressed immediately.
An internal audit was completed in 2016 and some improvements made to the way assay quality control data is managed.
This section presents a summary statistical analysis for the quality control data submitted to the onsite SGS laboratory since 2012 up to the end of 2025. Results are presented for only those quality control samples associated with sample submissions accepted into the database, except the Photon Assay CRMs which represent all CRMs included in for all geology and metallurgical submission in 2025.
These relate quality control samples submitted with drill holes that comprise about half of all the drill holes used in the current Resource estimates. Quality control results for the remaining drill holes used in Resource estimates are summarized in Redden and Moore (2010).
12.3.1Blanks
Between 2012 and 2025 a total of 3,118 blank samples were included with drill samples. Overall, 92% blank samples were below the 0.05 g/t threshold (Figure 12-1).
Since Photo Assay has been used a total of 149 blank samples have been included with drill samples, with 95% below the 0.05g/t threshold (Figure 12-2).
| | | | | | | | |
| Released: March 27, 2026 | Page 86 of 213 |
Figure 12-1 Blank samples submitted with Fire Assay submissions 2012-2025 (nine outliers excluded)
Figure 12-2 Blank samples submitted with Photon Assay submission since March 2025 (No outliers excluded)
| | | | | | | | |
| Released: March 27, 2026 | Page 87 of 213 |
12.3.2Standards
Between 2012 and March 2025, 13,150 Fire Assay results were reported from 60 different gold certified reference material Standard pulps submitted along with drill samples. Standard grades ranged from a pulp blank up to 12.05 g/t Au.
Statistically, 96% of results were within 10% of the certified value, and 91% were within the +/- 2 SD.
Since March 2025, 6,269 Photon Assay results were reported from 10 different gold certified reference materials submitted by SGS within OceanaGold submissions. Standard grades ranged from 0.108 g/t up to 48.37 g/t.
93% of the results were within 10% of the certified values, and 95% were within +/- 2 SD.
The exact bias of most Standards was <4%. Two Standards returned exact bias >5% (maximum 6.01%) but these represent only 3 analyses.
Results for standards with a range of grades are shown in Figure 12-3 and Figure 12-4.
Figure 12-3 Selection of six Fire Assay gold standards SGS Macraes Lab
| | | | | | | | |
| Released: March 27, 2026 | Page 88 of 213 |
Figure 12-4 Selection of six Photon Assays gold standards SGS Macraes Lab
12.3.3Duplicates – SGS Macraes
Between 2012 and March 2025, 6,667 field duplicates, 5,940 coarse crush duplicates, 4,480 pulp duplicates and 14,218 laboratory repeat pairs have been reported from Fire Assays drill samples by SGS Macraes.
Since March 2025, 34 field duplicates and 783 coarse crush duplicate pairs have been reported from Photon Assay drill samples by SGS Macraes.
Charts and summary statistics are presented in Figure 12-5 to Figure 12-7.
| | | | | | | | |
| Released: March 27, 2026 | Page 89 of 213 |
Figure 12-5 Field duplicate and coarse crush duplicate Fire Assay pairs SGS Macraes
Figure 12-6 Pulp duplicate and laboratory repeat Fire Assay pairs SGS Macraes
| | | | | | | | |
| Released: March 27, 2026 | Page 90 of 213 |
Figure 12-7 Field duplicate & coarse crush duplicate Photon Assay pairs SGS Macraes
12.3.4Umpire Checks
In December 2025, 250 samples analysed by Photon Assay at Macraes were sent to SGS Waihi for umpire checks by Fire Assay. Results are expected in early 2026.
12.4Summary
Due to the long exploration and mining history of the project, the quality control database is incomplete for the Macraes Operation making complete and thorough investigation impossible. The risk associated with the incomplete quality control data set is offset by the available mining and reconciliation data which supports the quality of the data.
Notwithstanding the limitations in the data set, the available recovery and QAQC data indicate the assay data meet acceptable limits of accuracy and precision and is therefore suitable for the purposes of grade estimation. OceanaGold has taken steps to mitigate the risks associated with the RC drilling sampling under wet conditions. Whilst ultimately only removal of this data can remove the risk, the relatively low proportions of remaining wet RC samples and previous successful mining history provide the basis for OceanaGold considering the residual risk to the Resource estimates to be low.
The introduction and use of a portable handheld XRF analyzer for tungsten analysis in 2013 is well implemented and the assay is suitable for the purposes of grade estimation.
In 2025 Fire Assay for gold was retired and now all gold assays used at Macraes are by Photon Assay. The method was run in parallel during the transition and 100 duplicate checks on both methods have been completed (Figure 12-8).
| | | | | | | | |
| Released: March 27, 2026 | Page 91 of 213 |
In addition to the assay data, the survey data (both collar and down-the-hole survey), are robust and present little risk.
It is the opinion of the QP (Matthew Grant) that the drill hole data used in the production of the Resource estimates reported in this report meet acceptable limits of accuracy and precision and that all reasonable steps and process have been undertaken to validate the drill hole data.
Figure 12-8 Scatterplot of 100 duplicates of Fire Assay and Photon Assay completed during transition period in March 2025. Red dash line has slope of 1
| | | | | | | | |
| Released: March 27, 2026 | Page 92 of 213 |
13Mineral Processing and metallurgical testing
13.1Ore Mineralogy
Gold is mostly present as particles <10 μm in sulfide grains or adjacent to grain boundaries, principally within pyrite and arsenopyrite. This gold is partially refractory with up to 20% not readily recoverable by standard cyanidation methods when re-ground to 15 μm. Up to 90% of the gold can be readily recovered to a sulfide flotation concentrate with the flotation losses associated with poorly-liberated sulfide particles or locked in silicate gangue. Pressure oxidation in an autoclave is used to break down the sulfide grain structure to make the contained gold particles amenable to cyanidation with leach recoveries on the autoclaved concentrate typically 95%.
The Macraes ore also contains a carbonaceous fraction. Coarse-grained ores tend to contain less organic carbon, while finer-grained ores contain higher levels of organic carbon. The carbonaceous material has a negative impact in the CIL circuit, adsorbing some of the dissolved gold from the CIL circuit liquor; this effect is not uncommon and is termed ‘preg-robbing’. The carbonaceous material is typically recovered to the flotation concentrate, although its flotation kinetics are slower than those of the sulfide minerals, so that carbon recovery is generally lower than sulfide recovery. The soft carbonaceous material also tends to smear on the gangue components of the ore, imparting some degree of hydrophobicity increasing the recovery of non- sulfides in the flotation concentrate. Experience at Macraes and at other plants worldwide indicates that the autoclave pressure oxidation under normal oxidising conditions tends to further activate the carbonaceous material. Macraes has adopted technology developed by Newmont Limited of the US that allows passivation of the carbonaceous material by introducing limestone into the feed to the autoclave. This, along with the use of a fouling agent in the CIL circuit and judicious management of the activated carbon in the CIL circuit has provided an effective means of controlling and mitigating the preg-robbing effect.
In addition to information from future ores testing, models have been developed from process data over the life of the operation from treating previous pit stages utilising Matlab software to provide input to the Life of Mine plan for key parameters.
13.2Throughput
Throughput predicted for each month is based on mill utilization and historical data on similar mined material. The main SAG mill processes approximately 70% of the total feed at a maximum throughput rate of 550-570 tph processing soft to medium ore hardness material. ML-500 throughput is limited to 250 tph due to infrastructure design. The target grind size in the plant remains in the 130-140 μm P80 range.
13.3Mass Pull
Approximately 2.5% of total feed tonnes is recovered to the concentrate stream, the tailings tonnage is 97.5% of feed tonnes. The split proportion of contained gold is used to determine flotation recovery.
| | | | | | | | |
| Released: March 27, 2026 | Page 93 of 213 |
The mass pull to the concentrate stream is calculated from a model based on feed sulfur grade, which is generated from daily process data of the active pit and underground ore sources and is utilised primarily for autoclave scheduling.
13.4Flotation Tails Gold Grade
The tails gold grade is calculated from a model based on recent plant performance of the active open pit and underground ore sources.
13.5CIL Recoveries
The average Macraes CIL recovery, 95.5%, is based on CIL performance and historical tail grades and the achievable oxidation in the autoclave. For low Total Organic Carbon (TOC) concentrate, oxidation extent is not significant but on higher TOC levels slightly lower oxidation extent targeting 96-97% minimised the impact of preg-robbing. Figure 13-1 demonstrates the actual plant CIL recovery achieved over the last seven years of plant operation against the budget model with under-performance in 2020 from the Covid-induced operating restrictions and 2022 when treating the Deepdell North pit at elevated blends above 50% of mill feed. With the more aggressive organic carbon in the Deepdell North pit, ore blend control was utilised with traditional operating strategies to minimise the effect for the remainder of the year. Whilst this pit source has been exhausted the strategy is now embedded for dealing with higher risk ore sources in the future.
Since 2023, improvements in the type and dosing of organic foulant in the autoclave discharge has proved effective at further mitigation of the preg-robbing nature of the organic carbon present in the ore leading to higher CIL recoveries.
Figure 13-1 Plant CIL recovery comparison between budget and actual CIL recovery from 2019-2025
| | | | | | | | |
| Released: March 27, 2026 | Page 94 of 213 |
13.6Flotation Recovery
Flotation recovery is calculated using the feed grade-recovery curve relationships based on recent plant performance and from plant operating data from treating adjacent pit stages. Figure 13-2 demonstrates the actual plant flotation recovery of gold over the last ten years compared to the budget forecast. Decreasing head grade over the last six years has not had a substantial impact on flotation recovery. Flotation recovery has tracked well with the budget models over this time frame with variability related to the performance of individual ore sources and variation in the gold to sulfur ratio and changes in pyrite association of the gold present.
Figure 13-2 Plant flotation recovery comparison between budget and actual flotation recovery
13.7Overall Recovery
The flotation and CIL recoveries for the open pit and underground ore sources at Macraes are combined. Yearly forecast recoveries for Macraes open pit and underground mines are presented in Table 13-1 for the Life of Mine plan. Variation in overall recovery is driven by expected flotation circuit performance for different feed sources scheduled over this period.
| | | | | | | | |
| Released: March 27, 2026 | Page 95 of 213 |
Table 13-1 Forecast recoveries used for production planning
| | | | | | | | | | | | | | |
Year | Flotation Recovery (%Au) | Cil Recovery (%Au) | Overall Recovery (%Au) | |
2026 | 85.3 | 96.2 | 82.0 | |
| | | | |
2027 | 78.8 | 95.6 | 75.3 | |
| | | | |
2028 | 79.9 | 95.7 | 76.4 | |
| | | | |
2029 | 76.2 | 95.2 | 72.6 | |
| | | | |
2030 | 83.7 | 96.1 | 80.9 | |
| | | | |
2031 | 86.5 | 95.5 | 82.6 | |
| | | | |
2032 | 75.5 | 95.5 | 72.1 | |
| | | | |
13.8Future Ore Testing Program
The purpose of metallurgical testing of the future ore samples is to determine metallurgical performance of new future planned ore sources such as mill throughputs, flotation recovery and CIL recovery, and to benchmark performance in the laboratory to other ore sources that have been processed through the plant to assist in validating the model inputs to planning. It also provides valuable information to understand any variations in ore hardness and address any potential process risk that may affect current process plant performance.
The future ore test programme is only performed on diamond core samples of existing and new ore sources. The future programme involves a series of tests:
•Grind Determination Test. This test assesses the time taken in the laboratory rod mill to achieve a P80 of 106 μm for the flotation testwork from core samples stage crushed to -3.35 mm. This test work provides data on relative hardness in relationship to SAG and ball mill throughput;
•Kinetic flotation testing. This is a float test that produces four concentrates and one tail stream for assay. Concentrates are floated off over a one-, four-, eight- and 13-minute time period using the standard OceanaGold laboratory float procedure and reagent doses. This float test indicates the expected rougher-scavenger flotation performance;
•Release analysis flotation testing. This is a two-staged cleaner float test that produces a primary, cleaner and re-cleaner concentrate as well as a primary, cleaner and re-cleaner tail. Three concentrates are floated off over 26 minutes for the primary float. The times are three-, eight- and 15-minutes time period. For the cleaner and re-cleaner, three concentrates are floated off over three-, eight- and 10-minutes time period. This test produces a grade recovery curve to determine the ‘optimum’ grade and recovery of the Macraes flotation plant. The test products are analyzed for Au, S, As, Fe and TOC; and
•Standard bottle roll Preg-Robbing Factor (PRF) leach testing. This test assesses the preg-robbing characteristics and leach recovery of the ore prior to the pressure oxidation process. This is a leach of a concentrate produced using a bulk float test. The concentrate is then bead milled to a P80 of 15 μm for a standard PRF leach to be conducted. While the
| | | | | | | | |
| Released: March 27, 2026 | Page 96 of 213 |
test cannot determine a CIL recovery, it highlights the impact of high PRF areas within the orebody for budget planning and forecasting.
13.9Golden Point Underground Testing
During 2019/20 as part of the Golden Point Underground Prefeasibility Study a series of ore composites were prepared from diamond drilling of the proposed Golden Point Underground (GPUG) Resource for metallurgical testing. Between 1998 and 2003, ore from the Golden Point open pit Resource was processed through the Macraes plant with flotation reported recoveries of 87-89% for gold. This period coincided with the installation of the Pressure Oxidation circuit leading to improved leach recoveries of 95%.
Four lithologically-based composites were prepared from geological interpretation of the predominant domains expected for the mining method planned. The overall estimate of mined mill feed by lithology type was estimated as:
•Lode Schist 43%;
•Quartz Cataclasite/Silicified Breccia/Quartz Vein 18%; and
•Other Lithologies 39%.
These were subjected to grind determinations, kinetic flotation testing and the two stage release analysis tests described above to provide estimates of flotation recovery at a target 8% sulfur concentrate grade. The key conclusions of the test work on these samples were:
•Grind determination showed the sampled material to be highly competent, although consistent with FRUG ore grindability, so should not cause a restriction when being treated through ML-500;
•The sampled material responded reasonably well to flotation, although kinetics were variable. Despite the observed variability between samples, it was possible to upgrade the concentrate to 8% sulfur while achieving relatively high recovery rates;
•TOC concentrations indicate that PRF will be low which may result in higher CIL recovery. Nonetheless, leach testing is required to better understand the aggressiveness of the TOC; and
•The ROM recovery rate of 83.7% can be used as an approximation of expected performance, although given the limited data set, a significantly larger second stage programme is required to better define the ore source and improve confidence in recovery rates.
Table 13-2 summarizes the results of the testing programme. Estimated flotation recovery is used when targeting an 8% sulfur concentrate grade required for autoclave feed, and an estimated ROM recovery at a 95% CIL recovery was used based on the low TOC assays. The weighted recovery from this programme is based on a geological assessment of the proportion of each lithology.
| | | | | | | | |
| Released: March 27, 2026 | Page 97 of 213 |
Table 13-2 Results of GPUG round 1 composites
| | | | | | | | | | | | | | | | | | | | |
Composite | Grind time to 106um | Flotation Recovery @ 8% Sulfur | CIL Recovery % | ROM Recovery % | Resource Weighting % | |
GPM004 | 6’46” | 89.2 | 95 | 84.7 | 43 | |
| | | | | | |
GPM005 | 5’06” | 83.3 | 95 | 79.1 | 19.5 | |
| | | | | | |
GPM006 | 8’28” | 91.9 | 95 | 87.3 | 18 | |
| | | | | | |
GPM008 | 6’32” | 87.0 | 95 | 82.7 | 19.5 | |
| | | | | | |
Weighted Average | 6’43” | - | - | 83.7 | - | |
| | | | | | |
A subsequent variability programme was undertaken with a further eight composites prepared from drill core representing stope intercept lengths commensurate with the expected extracted grades based upon assumed mining selectivity. Intercepts were selected across the GPUG deposit for this round of testing capturing a larger portion of the contained gold in the mine design and representing expected mill feed grades from stope extraction. The results of the second round of variability testing is outlined in Table 13-3.
Table 13-3 Results of GPUG round 2 variability composites
| | | | | | | | | | | | | | | | | |
Composite | Grind time to 106um | Flotation Recovery @ 8% Conc Grade | CIL Recovery % | ROM Recovery % | |
GPM011 | 7’11” | 91.1 | 95.0 | 86.5 | |
GPM014 | 7’42” | 91.0 | 95.0 | 86.5 | |
GPM022 | 6’36” | 89.7 | 95.0 | 85.3 | |
GPM038 | 6’04” | 90.2 | 95.0 | 85.7 | |
GPM043 | 6’58” | 89.8 | 95.0 | 85.3 | |
GPM046 | 6’27” | 87.4 | 95.0 | 83.0 | |
GPM048 | 4’58” | 85.6 | 95.0 | 81.3 | |
GPM050 | 7’00” | 91.3 | 95.0 | 86.8 | |
Average | 6'37" | 89.5 | 95.0 | 85.0 | |
From this round of variability testing, the results continued to show similar grind times to the initial programme, in line with those for GPUG samples tested previously. Current practice of feeding GPUG ore to the ML-500 SAG mill up to 50% of its feed, similar to the historical approach with FRUG, has proved successful without any significant issues.
Flotation recovery from the release analysis test indicates an average of 89.5% over the 8 composites. Some variability was seen in flotation recovery as interpreted at the target 8% sulfur concentrate grade, in practice GPUG provides a maximum of 15% of the overall flotation feed, with the remainder being sourced from other open pit sources. At these blend ratios there appears no issue with being able to generate a target concentrate grade at high flotation recovery on the proposed Resource. Overall low TOC levels indicate that a low to moderate level of organic pre-
| | | | | | | | |
| Released: March 27, 2026 | Page 98 of 213 |
robbing material is expected. Given the inclusion of the autoclave, current practice typically achieves a 95% leach recovery.
The overall recovery of 85.0% remains in line with both historical plant performance on previously mined Golden Point open pit material as well as results of the initial programme of testwork. The improved result from the second round of testing was not available at the time assumptions were finalised for cut-off grade determination. This value exceeds the 83.7% that has been assumed for the cut-off grade calculations, economic analysis and reserve calculations, and shows a robust assumption was used relative to laboratory testwork.
13.10Innes Mills
During 2021/2022 metallurgical testing on available diamond drill core samples was conducted to support additional cutbacks of the Innes Mill open pit for Stages 6 through to 8. Historically the Innes Mills pit was mined and processed through the process plant from 1998-2003 and responded well to the current flowsheet. Laboratory grind times were in the 4.5 to 5 minute range and regarded as soft to average for Macraes ore types.
The recovery performance of the 2022 programme is summarized below in Table 13-4 with head grades spanning the range from 0.51 to 3.43 g/t gold and with overall gold recoveries ranging from 68.4% to 84.5%. Two of the composites in the programmes did not make the target 8% concentrate grade and flagged that treating a 100% feed of Innes Mills material to the mill would be problematic. As the mill feed is generally a blend of open pit and underground ore this was not considered a significant risk operationally.
Head grades tested focused on primarily >0.5 g/t gold aligned with economic cut-off grade estimates at the time rather than higher head grades typical of the historical future ore test programmes circa 1996-2000 with lower flotation and overall recovery associated with the lower head grades. The TOC levels in the concentrate varied depending on location from <1.3% considered low risk for preg-robbing to in excess of 2.5% is expected to have a higher preg-robbing impact. For recovery predictions the lower post autoclave CIL assumption of 94.5% was used based on plant operating performance.
| | | | | | | | |
| Released: March 27, 2026 | Page 99 of 213 |
Table 13-4 Innes Mills 2022 composite summary results
| | | | | | | | | | | | | | | | | | | | | | | | | | |
Composite ID | Domain | Grade Bin | Head Grade | Flotation Recovery | Conc TOC % | CIL Recovery % | ROM Recovery % |
Au (g/t) | S (%) | @ 8% S (%Au) | | | |
MET_IM2022_001 | Stockwork | Low Grade | 0.57 | 0.27 | 80.2 | 0.60 | 95 | 74.9 |
MET_IM2022_002 | Stockwork | Low Grade | 0.65 | 0.11 | - | - | - | - |
MET_IM2022_003 | Stockwork/Lode | Low Grade | 0.83 | 0.21 | 74.9 | 1.10 | 94.5 | 68.4 |
MET_IM2022_004 | Mainly Stockwork | Low Grade | 0.59 | 0.19 | 77 | 1.60 | 94.5 | 71.6 |
MET_IM2022_005 | Stockwork | Super Low Grade | 0.51 | 0.21 | 82.2 | 2.10 | 64 | 73.2 |
MET_IM2022_006 | Stockwork/Lode | Medium Grade | 0.81 | 1.36 | 85 | 0.96 | 95 | 80.3 |
MET_IM2022_007 | Stockwork/lode | Hight Grade | 121 | 0.50 | 85.2 | 0.85 | 95 | 80.6 |
MET_IM2022_008 | Stockwork | High Grade | 1.02 | 0.18 | 86.4 | 1.40 | 94.5 | 80.3 |
MET_IM2022_009 | Stockwork/lode | High Grade | 1.63 | 0.26 | 79.3 | 1.10 | 94.5 | 84.5 |
MET_IM2022_010 | Mixed lodes, QVS, Stockwork | High Grade | 1.53 | 0.25 | 80.6 | 1.10 | 94.5 | 74.5 |
MET_IM2022_011 | Stockwork | Medium Grade | 1.35 | 0.46 | 86.8 | 1.52 | 94.5 | 82.0 |
MET_IM2022_012 | Stockwork/Lode | Low Grade | 0.57 | 0.22 | 76.8 | 2.45 | 94.5 | 72.6 |
MET_IM2022_013 | Lode | High Grade | 1.37 | 0.32 | 76.7 | 3.57 | 94.5 | 72.5 |
MET_IM2022_014 | Dom 20 Lode | High Grade | 3.43 | 0.39 | 85.9 | 2.67 | 94.5 | 81.2 |
MET_IM2022_015 | Stockwork/Dom 20 | Medium Grage | 1.45 | 0.20 | 64 | - | 94.5 | 60.5 |
MET_IM2022_016 | Dom 20 Lode | High Grade | 1.65 | 0.53 | 87.9 | 1.11 | 95 | 83.5 |
MET_IM2022_017 | Dom 30 Lode | High Grade | 1.30 | 0.24 | 83.5 | 1.94 | 94.5 | 78.9 |
MET_IM2022_018 | Dome 30 Lode | Medium Grade | 0.96 | 0.26 | 86.7 | 1.95 | 94.5 | 81.9 |
MET_IM2022_019 | Stockwork | Low Grade | 0.69 | 0.30 | 79.7 | 1.83 | 94.5 | 75.3 |
MET_IM2022_020 | Stockwork | Super Low Grade | 0.61 | 0.33 | 87.9 | 1.495 | 94.5 | 83.1 |
During 2025 additional testing on Innes Mills core samples was undertaken to include the material scheduled though the Stage 10 pit cutback. A total of 6 composite samples were submitted to AMML in Australia to conduct the flotation test programme in addition to three core samples for ore hardness testing.
Key observations from the IM10 programme are:
•The competency of the three tested composites is low with competency (A*b values) of 83-99 and Drop Weight Index (DWI) of 2.74-3.25 kWh/m3 and represents mid-range for Macraes open pit ore and should not present a challenge to mill throughput rates;
•Rougher kinetics were relatively fast and in line with previous Innes Mills test work with generally 80-90% of gold recovered within the standard residence time;
| | | | | | | | |
| Released: March 27, 2026 | Page 100 of 213 |
•At a targeted 8% cleaner concentrate grade gold recovery ranged from 68 to 93 and averaging 86% and does not present any issues with generating a satisfactory concentrate for feeding the autoclave;
•Head grades of organic carbon varied from 0.7% to 1.2% and in concentrate from 0.8 to 2.3% present a low risk to preg-robbing compared to previous testwork campaigns and hence a 95.5% CIL recovery has been used to estimate overall recovery; and
•Overall recovery for these samples, shown in Table 13-5 is in line with previous Innes Mills testwork and should not present significant challenges given the success of the plant with treating earlier pit stages.
Table 13-5 Innes Mills 2025 test summary results
| | | | | | | | | | | | | | | | | | | | | | | |
Composite ID | Domain | Grade Bin | Head Grade | Flotation Recovery | CIL Recovery | ROM Recovery |
Au (g/t) | S (%) | @ 8% S (%Au) | % | % |
2025_IM10_F01 | Hanging wall | High Grade | 2.91 | 0.69 | 92.9 | 95.5 | 88.7 |
| | | | | | | |
2025_IM10_F02 | Concordant | High Grade | 5.97 | 1.75 | 93.2 | 95.5 | 89.0 |
| | | | | | | |
2025_IM10_F03 | Stockwork | Medium Grade | 0.74 | 0.29 | 68.6 | 95.5 | 65.5 |
| | | | | | | |
2025_IM10_F04 | Stockwork | Medium Grade | 0.78 | 0.26 | 84.8 | 95.5 | 80.9 |
| | | | | | | |
2025_IM10_F05 | Stockwork | Medium Grade | 0.72 | 0.51 | 89.2 | 95.5 | 85.2 |
| | | | | | | |
2025_IM10_F06 | Stockwork | High Grade | 1.29 | 0.27 | 90.9 | 95.5 | 86.8 |
| | | | | | | |
13.11Super Low Grade Testwork
Additional test work was instigated to investigate the potential for overall recovery of lower (0.3-0.5 g/t Au) head grades. Diamond core intercepts were located for the lower head grade targets for both the Innes Mills pit cutbacks and for the Gay Tan pit (stockwork zone mineralization previously categorised as Frasers West pit).
Five composites were tested for the Gay Tan material and results are presented in Table 13-6 with flotation recoveries averaging 73% and overall recovery of 69%. The TOC levels for Gay Tan were elevated at over 2% organic carbon and triggers the use of the lower 94.5% CIL recovery assumption. The lowest grade 0.37 g/t Au sample still achieved a 61% overall recovery.
| | | | | | | | |
| Released: March 27, 2026 | Page 101 of 213 |
Table 13-6 Gay Tan super low grade testwork results
| | | | | | | | | | | | | | | | | | | | | | | |
Composite ID | Head Grade | Flotation Recovery | Conc TOC % | CIL Recovery % | ROM Recovery % | |
Au (g/t) | S (%) | @ 8% S (%Au) | | | | |
MET_GT2020_001 | 0.51 | 0.21 | 64.90 | 2.51 | 94.5 | 61.3 | |
MET_GT2020_002 | 0.50 | 0.18 | 83.80 | 2.65 | 94.5 | 79.2 | |
MET_GT2020_003 | 0.50 | 0.21 | 76.40 | 2.88 | 94.5 | 72.2 | |
MET_GT2020_004 | 0.66 | 0.21 | 71.90 | 2.13 | 94.5 | 67.9 | |
MET_GT2020_005 | 0.37 | 0.13 | 68.75 | 2.96 | 94.5 | 65.0 | |
Average | 0.51 | 0.19 | 73.15 | 2.62 | 94.50 | 69.13 | |
A total of seven composites were identified for the Innes Mills cutback targeting the low grade and super low-grade categories with grades below 0.5 g/t reported for two of these. Flotation recovery averaged 75.6% for gold at the target 8% sulfur grade and with TOC level generally moderate to high given the lower sulfur head grade around 0.2% sulfur. The overall recovery estimates averaged 71.4% ranging from 65.5% for the lowest head grade composite. The results are summarized in Table 13-7.
Table 13-7 Innes Mills super low grade testwork results
| | | | | | | | | | | | | | | | | | | | | | | | | | |
Composite ID | Grade Bin | Head Grade | Flotation Recovery | Conc TOC % | CIL Recovery % | ROM Recovery % | |
Au (g/t) | S (%) | @ 8% S (%Au) | | | | |
MET_IM2021_001 | Super Low Grade | 0.46 | 0.23 | 69.4 | 2.68 | 94.5 | 65.6 | |
MET_IM2021_002 | Super Low Grade | 0.53 | 0.18 | 75.9 | 3.03 | 94.5 | 71.7 | |
MET_IM2021_003 | Low Grade | 0.64 | 0.28 | 75.3 | 1.73 | 94.5 | 71.2 | |
MET_IM2021_004 | Super Low Grade | 0.43 | 0.18 | 76.9 | 2.51 | 94.5 | 72.7 | |
MET_IM2021_005 | Low Grade | 0.64 | 0.2 | 69.9 | 2.09 | 94.5 | 66.1 | |
MET_IM2021_006 | Super Low Grade | 0.72 | 0.2 | 77.2 | 2.95 | 94.5 | 7301 | |
MET_IM2021_007 | Low Grade | 0.77 | 0.31 | 84.6 | 1.59 | 94.5 | 79.9 | |
Average | 0.60 | 0.22 | 75.6 | 2.37 | 94.5 | 71.4 | |
Subsequent to this testwork a full-scale plant trial was conducted in March 2025 during the scheduled autoclave rebrick. Ore blocks were selectively mined from the pit targeting a lower 0.25 g/t cutoff grade and campaign milled over a seven-day period as the sole source from the plant allowing a better estimate of head grade. Over the five-day period from March 5th to 9th 888,418 tonnes were milled at t head grade of 0.32 g/t Au and reported a flotation recovery of 74.8%.
| | | | | | | | |
| Released: March 27, 2026 | Page 102 of 213 |
Factoring a 96.7% CIL recovery based on plant practice in this pit stage would calculate a ROM recovery of 72.4% that was slightly better than core testing had achieved but on a noticeably lower head grade. It should be noted that the concentrate sulfur grade during the trial was elevated at 12% to accommodate concentrate storage requirements during the rebrick, plant experience is that at a lower normal 8.5% target grade flotation recovery would be expected to be 1-1.5% higher.
Overall, this trial has improved confidence that plant performance on lower grades of feed are still acceptable in the low- to mid-70% range for planning purposes with higher metal prices.
Table 13-8 Super low grade plant trial results
| | | | | | | | | | | | | | | | | | | | |
Key Metrics | 5/03/2021 | 6/03/2022 | 7/03/2023 | 8/03/2024 | 9/03/2025 | Summary |
Combined Milled Tonnes (t) | 18,913 | 17,762 | 18,568 | 17,708 | 15,467 | 88,418 |
Calculated Feed Grade (g/t Au) | 0.32 | 0.36 | 0.26 | 0.32 | 0.34 | 0.32 |
Calc Sulfur Grade (%S) | 0.13 | 0.17 | 0.12 | 0.16 | 0.17 | 0.15 |
Flotation Con Grade Sulfur (%S) | 10.6 | 13.3 | 11.9 | 12.6 | 12.6 | 12.3 |
Flot Con Grade Au (g/t Au) | 31.5 | 30.2 | 26.9 | 26.6 | 26.3 | 28.3 |
Flotation Gold Recovery (%) | 72.1 | 79.3 | 70.5 | 74.7 | 76.6 | 74.8 |
Assumed CIL Gold Recovery (%) | 96.7 | 96.7 | 96.7 | 96.7 | 96.7 | 96.7 |
ROM Recovery (%) | 69.7 | 76.7 | 68.2 | 72.2 | 74.1 | 72.4 |
Gold Production (oz) | 137 | 159 | 104 | 132 | 124 | 656 |
13.12Reconciling plant recovery to ore sources
Allocation of gold between Macraes open pit and underground mines can be challenging as the ore is mixed within the crushing process. Higher underground gold grades could reasonably be expected to return higher recoveries and produce concentrates with higher gold grades. However, in practice, measuring actual flotation recovery and concentrate grades produced individually by Macraes open pit and underground ores is not possible. Investigations to accurately measure and attribute gold recovered between Macraes open pit and FRUG ore streams in 2010 concluded that the split was not achievable due to insufficient supply of underground ore required to consistently process in the smaller SAG mill and maintain steady flotation circuit performance.
With the transition of underground operations to the GPUG deposit the previous practice for metal accounting of attributing the average plan recovery to both open pit and underground sources has been maintained along with the practice of head grade estimation to ore sources based on mass balance adjustment of grade control estimates to mill feed grade.
| | | | | | | | |
| Released: March 27, 2026 | Page 103 of 213 |
14Mineral Resource Estimates
14.1Introduction
All Mineral Resource estimates are carried out at Macraes by, or under the supervision of, Matthew Grant, Senior Geologist - Resource Development. All estimates are peer reviewed by OceanaGold’s Resource Development team or site geologists
This section summarizes the methodology used by OceanaGold to prepare and classify the Mineral Resource estimates. The open pit and underground Resource estimates are described separately.
14.2Qualified Persons Responsible for Resource Estimates
Matthew Grant, Senior Geologist - Resource Development is the Qualified Person responsible for all Macraes Operation Resource Estimates.
14.3Open Pit Mineral Resource Estimates
14.3.1Drillhole Database
Drill holes are extracted from the surface drilling acQuire database for each of the areas of Resource estimates as defined by the X, Y, Z coordinates.
Generally, only holes with DDH, DDW, RCD and RCH prefixes are used for Resource estimates. Occasionally select RCL prefixed holes are used. These prefixes are diamond core (DDH), diamond daughter (DDW), Reverse Circulation (RC), reverse circulation pre-collars with diamond tails (RCD), and Grade Control RC holes (RCL) drill holes respectively. Some holes with these prefixes may be excluded, usually where wet sampling may have led to downhole contamination or sampling bias. This will be discussed in the individual Resource estimate sections below.
14.3.2Software Used
Hexagon ‘HxGN MinePlan 3D’ (MinePlan) software and Leapfrog Geo is used for creating the geological models and their wireframe solids. All database drill hole extraction, compositing, and domain coding is completed in MinePlan.
GS3M software is used for geostatistical analysis and large panel recoverable Resource estimation for the majority of the open pit estimates. The block models created are then imported into MinePlan for final reporting.
14.3.3Geologic Model Methodology
3D estimations domains are created in both Leapfrog Geo and MinePlan using both grade and geology. Where practical, logged lithology and/or structures are used, otherwise grade is used to define the upper and lower surfaces for estimation domaining.
Most of the economic mineralization is confined to the Intrashear schist. The top of the Hangingwall shear usually defines the top of the Intrashear schist and the bottom is defined by the Footwall fault. Within the Intrashear schist there may be domains for the Hangingwall shear, one or
| | | | | | | | |
| Released: March 27, 2026 | Page 104 of 213 |
more concordant lodes, and zones of quartz vein arrays with subsidiary shears. Domains will vary from area to area and are discussed for the individual areas below.
14.3.4Compositing and Assay Capping
Compositing
The raw assay data are composited to one metre lengths for Resource estimation.
Outliers for Multiple Indicator Kriging (MIK)
For Resources estimated by Multiple Indicator Kriging (MIK) top caps may be applied to mitigate potential outlier values. Top cap values applied to composites vary between each of the mining areas and are specified for each Resource estimate below. Typically, the top indicator mean is replaced with a value between the mean and median above the indicator threshold.
Outliers for Ordinary Kriging (OK)
For Resources estimated by Ordinary Kriging (OK) top caps are always applied to composites, typically at around the 95 or 97.5 percentile. Top caps applied are specified for each Resource estimate below.
14.3.5Bulk Density
A bulk density of 2.50 t/m³ is assigned to oxide blocks and 2.65 t/m³ to sulfide (fresh) blocks. These are the accepted standard values for the Macraes Goldfield and have been applied to ensure consistency between Resource estimation, grade control and mine planning. They are slightly lower than the experimentally determined density but are thought to more accurately reflect the bulk density of the overall rock mass. The experimental measurements are determined on small pieces of core, which do not include the joints, fractures, and faults present in the overall rock mass.
The density assumptions for all estimates are shown in Table 14-1. These are based upon 751 core immersion test results and are assigned to blocks based on geological coding (Table 14-2).
Table 14-1 Density assumptions
| | | | | | | | |
Material Type | Density (t/m3) | |
Fresh rock | 2.65 | |
Weathered rock | 2.50 | |
Slump material | 2.35 | |
Loose rock fill | 2.18 | |
Tailings | 1.77 | |
| | | | | | | | |
| Released: March 27, 2026 | Page 105 of 213 |
Table 14-2 Bulk density data by area
| | | | | | | | | | | | | | | | | | | | | | | | | | |
Prospect | Oxide Ore | Oxide Waste | Sulfide Ore | Sulfide Waste |
No. | Mean | No. | Mean | No. | Mean | No. | Mean |
Nunns | - | - | - | - | - | - | - | - |
Coronation North | - | - | - | - | 14 | 2.63 | 15 | 2.65 |
Coronation | - | - | - | - | - | - | - | - |
Deepdell | 4 | 2.55 | 7 | 2.49 | 9 | 2.64 | 18 | 2.68 |
Golden Point | - | - | - | - | 12 | 2.74 | - | - |
Round Hill | 6 | 2.61 | 2 | 2.58 | 54 | 2.68 | 64 | 2.68 |
Southern Pit | - | - | - | - | 4 | 2.67 | 3 | 2.66 |
Innes Mills | - | - | 6 | 2.45 | 32 | 2.71 | 37 | 2.70 |
Frasers Pit | 2 | 2.32 | 10 | 2.47 | 62 | 2.69 | 73 | 2.67 |
Frasers Underground | - | - | - | - | 211 | 2.70 | 100 | 2.68 |
Golden Ridge | - | - | - | - | - | - | - | - |
Ounce | - | - | - | - | - | - | - | - |
Golden Bar | - | - | - | - | 3 | 2.63 | 3 | 2.57 |
Stoneburn Group | - | - | - | - | - | - | - | - |
Total/Average | 12 | 2.54 | 25 | 2.48 | 401 | 2.69 | 313 | 2.68 |
14.3.6Variogram Analysis and Modelling
Variogram modelling is carried out in GS3M for each of the domains specified in the Resource estimate. 14 indicator variograms (10, 20, 30, 40, 50, 60, 70, 75, 80, 85, 90, 95, 97.5 and 99th percentiles). Typically, each variogram is modelled in five to 10 directions. An additional non-indicator gold variogram is required for each domain using MIK. So, between 75 and 150 directional variograms are modelled for each domain.
Ordinary kriging only requires a single gold variogram for each domain.
Once completed the Resource estimates are exported out of GS3M in ascii format and imported into MinePlan.
14.3.7Block Model
Block model dimensions will vary for area to area but the standard block size for open pit Resources is:
For large panel recoverable estimates is X = 25 m, Y = 25 m, Z = 2.5 m.
For ordinary kriged estimates is X = 10 m, Y = 10 m, Z = 2.5 m
14.3.8Estimation Methodology
Estimation search distances and directions are derived from a combination of geology, drill spacing, and previous modelling. Drill spacings are typically on approximate multiples of 25 m (i.e. 25 m, 37.5 m, and 50 m) and the primary search distance is generally set at around 25 m.
| | | | | | | | |
| Released: March 27, 2026 | Page 106 of 213 |
Since 2001, large panel recoverable Resource estimation using Multiple Indicator Kriging (MIK) has been the preferred estimation for open pit Resources where there is sufficient data. Ordinary Kriged (OK) E-Type estimates are used where data are sparse and are also the current method for underground Resource estimates. The large panel recoverable estimates selectivity assumptions are not appropriate for UG estimates given the panel dimensions by necessity being commensurate with drill spacing (25m).
Ordinary Kriging (OK)
Ordinary kriging is a form of linear estimation. In simple terms, linear estimation assumes the influence of a sample on the grade of a block is some function of its distance from that block. Inverse distance weighting (IDW) is another example of linear estimation. (Schofield, 2016).
Large Panel Recoverable Resource Estimation using MIK
Large panel recoverable Resource estimation is implemented at Macraes using multiple indicator kriging (MIK), a non-linear approach suited well to skewed gold distributions. Grades are estimated into large blocks (called panels), with dimensions typically reflecting the nominal drill hole spacing. Rather than providing more traditional whole block grade estimates, the estimates are expressed as a series of nested proportions and grades estimated for a range of cut-off grades. Collectively these provide a cumulative histogram for each block. A block support correction is completed in GS3M software with assumed selective mining dimensions. Typically, a non-parametric simulation block support correction is used, a preferred approach for less continuous styles of mineralization at Macraes, such as quartz vein arrays and erratic subsidiary shear-hosted mineralization.
Large panel recoverable Resource estimation has been used successfully at Macraes since 2001 (see section 14.5).
14.3.9Model Validation
Several methods are used to check to Resource estimates.
Visual Comparison
The block model is viewed in MinePlan against the drilling and domains to see that the block grades reasonably represent the input data.
Comparative Statistics
Methods include:
•Check mean composite grade versus average estimate grade for each domain. Results should be reasonably close; and
•Swath plots of mean composite grade against model grade.
| | | | | | | | |
| Released: March 27, 2026 | Page 107 of 213 |
Against Previous Models
The new estimate is compared against previous estimate to identify any areas of unexplained change.
Reconciliations
Where a deposit has been partially mined, the estimate is reconciled against the actual mined tonnage, grade and contained metal (corrected against the mill). See section 14.6.
14.3.10Resource Classification
The Resource classifications for MIK Resource estimates are determined in GS3M during the estimation process using a combination of the search criteria (an expansion factor expands the search distances for Indicated and Inferred Resources relative to Measure Resources), and cut-off grade reporting threshold. These are tabulated in Table 14-3.
Within the Innes Mills model any panels where >75% of the informing composites are wet RC are classified as Inferred. Any wet RC gold grades that have not been replaced by diamond drill hole samples, have been factored, based on relationships established between twinned RC versus diamond core sample grades.
Table 14-3 MIK Resource classification parameters
| | | | | | | | | | | | | | | | | | | | | | | | | | | | | |
Resource Area | Domain | Search | Exp an | Min Data | Min Octants | Max Data | Classification Grade (g/t) | Measured Threshold | Indicated Threshold |
Coronation | Dom1 | 27x27x5 | 0.2 | 16 | 4 | 48 | 0.3 | 100% | 30% |
Dom2 | 27x27x5 | 0.6 |
Dom3 | 27x27x10 | 0.6 |
Coronation | Dom1 | 27x27x5 | 0.2 | 16 | 4 | 48 | 0.3 | 80% | 30% |
Dom2 | 27x27x5 | 0.6 |
Dom3 | 27x27x3 | 0.2 |
Deepdell | Dom10, 11, 12, 31, 32, 33 | 27x27x8 | 0.5 | 8 | 4 | 48 | 0.3 | 80% | 30% |
Dom50 | 37x37x5 | 0.5 | 12 | 4 | 48 |
Innes Mills | Dom10, 12, 14, 18 | 27x27x5 | 0.6 | 16 | 4 | 48 | 0.3 | 100% | 30% |
Dom5, 40, 50 | 23x23x5 | 0.6 |
Golden Bar | Dom1, 29, 47, 48 | 25x25x4 | 0.6 | 16 | 4 | 48 | 0.5 | 80% | 30% |
The parameters used for Resource classification for the OK Resource estimates are shown in Table 14-4.
| | | | | | | | |
| Released: March 27, 2026 | Page 108 of 213 |
Table 14-4 OK Resource classification parameters
| | | | | | | | | | | | | | | | | | | | | | | |
Resource Area | Domain | Resource Classification | Search | Min Data | Min Octants | Max Data | |
Nunns | Dom1 | Ind | 50x50x5 | 16 | 6 | 64 | |
NZGT | Dom1 | Inf | 50x50x5 | 12 | 4 | 32 | |
Dom2 | Inf | 80x80x5 | 12 | 4 | 32 | |
Taylors | Dom1-3 | Ind | 50x50x5 | 12 | 6 | 32 | |
Dom1-3 | Inf | 50x50x5 | 4 | 4 | 32 | |
Most open pit Resources are quoted at a 0.25 g/t cut-off but this lifts to 0.3 g/t or 0.4 g/t gold cut-off for satellite deposits.
14.3.11Resource Estimate Tonnes and Grade
Unless otherwise stated, all reported open pit Resources are constrained within pit shells optimised via Whittle at the Mineral Resource gold price of USD2,450 (NZD4083 at an NZ:US exchange rate of 0.60) and either surface topography or as-mined surface at 31 December 2025.
An open pit cut-off grade of 0.25 g/t Au is based on the USD2,200 gold price, mining costs and recovery assumptions.
14.3.12Nunns
Background
Small scale mining and prospecting in the Nunns and adjacent ‘New Zealand Gold and Tungsten’ (NZGT) area occurred intermittently from 1868 to 1918, yielding around 650 oz of gold and 29 tons of scheelite (Williamson, 1939).
Modern exploration commenced in 1985 by BP Oil followed by Kiwi International who between them drilled 49 shallow holes (1,981.9 m). OceanaGold conducted drilling campaigns in 2002/2003 and again in 2016/2017.
Metallurgical testwork was completed on six diamond core samples collected in 2017.
Geology & Mineralization
Mineralization at Nunns is mostly confined to a single, shallowly-dipping lode of low angle grey-white quartz veins with associated silicified and brecciated schist containing arsenopyrite, pyrite, scheelite and gold.
Resource Estimation
•Last Resource estimate completed in 2017;
•0.2 g/t Au cut-off grade used to define the lode horizon for kriging;
•Drill spacing 37.5 m or 50 m;
•OK estimation was used with search distances of X, Y = 50 and 80 m, Z = 5 m;
•Only RCH holes drilled by OceanaGold are used in the estimation; and
•A gold top cut of 8 g/t was applied affecting 5 assays (0.7% of the data).
| | | | | | | | |
| Released: March 27, 2026 | Page 109 of 213 |
14.3.13Coronation North
Background
Discovered in 2014, the first Resource estimate for Coronation North was released at the end of 2015. Drilling continued through 2016 and mine planning commenced. Following the granting of resource consent, pre-stripping commenced in April 2017, and first ore was excavated in June 2017. Infill drilling continued through 2017 and 2018 to reduce the drilling spacing variably to 37.5 m and 25 m spacing.
Mining of Stage 4 was completed in March 2022. Further pit expansions are underway with Stage 5 cutback started in December 2025.
Geology & Mineralization
The Coronation North deposit differs from previously mined areas along the Hyde-Macraes Shear Zone with the main mineralization steeply dipping (~40) towards the Northeast (Mine Grid). The bulk of contained metal is where a steeper-dipping lower lode intersects the Hangingwall Shear and includes the mineralization that extends down along the lower lode.
Figure 14-1 Cross section through Coronation North showing original topography, geology and domaining Grade control grade shells >0.3g/t and >1.0g/t included
Resource Estimates
•Last updated in October 2025;
•Only holes prefixed RCH, RCD, DDH or DDW used in Resource estimation;
•Drill spacings mainly 25 m or 37.5 m;
•Simple two domain model is used within the Intrashear Schist dividing the mineralization into high (‘Domain 3’) and lower (‘Domain 2’) grade domains (Figure 14-1); and
•MIK used for the estimation.
| | | | | | | | |
| Released: March 27, 2026 | Page 110 of 213 |
Mining & Reconciliation
Mining commenced in June 2017 at a 0.4 g/t Au cut-off, however, in January 2020 the cut-off was lowered to 0.3 g/t Au. Reconciliations against Resource estimates have been carried out on a monthly basis until March 2022 when mining of Stage 4 stopped.
To date 12.4 Mt @ 1.02 g/t for 404 kozs of gold have been mined.
Through this period of mining the Coronation North Resource estimate consistently underestimated the contained gold due to greater geological complexity than can be resolved at Resource drilling scale. Wall movement and floor heave from October 2020 has further impacted reconciliation. However, the overall reconciliation is positive: more tonnes were mined than indicated by the Resource estimate and at a 6% higher grade, resulting in 8% more contained ounces.
14.3.14Coronation
Background
The Coronation area was first worked in 1886 with a second period of activity in 1911/12. During the 1980s the landowner at Coronation dug a series of trenches and pits. In 1992 12 RC holes were drilled by Sigma Resources. Between 1998 and 2001 OceanaGold’s predecessor company GRD Macraes drilled 31 holes and the first Resource estimate was produced.
OceanaGold conducted further drilling campaigns in 2008, 2011, 2012 and 2014. Mining commenced in 2014. Infill drilling of Stage 5 and a potential Stage 6 was undertaken in 2015, 2016 and 2018. Mining of Stage 5 commenced in 2019 and was completed in September 2020.
Geology and Mineralization
The HMSZ at Coronation is a predominately pelitic package of schist up to 90 m thick. The package is constrained above by the Hanging wall Shear and below by the Footwall Fault as shown on Figure 14-2. The geology of the Coronation deposit is comparatively simple. It comprises the Hangingwall Shear which has a generally planar geometry and dips 15° to 20° to the east. A second, less
| | | | | | | | |
| Released: March 27, 2026 | Page 111 of 213 |
extensive shear has been interpreted immediately below the Hangingwall Shear. Quartz vein arrays and subsidiary shears styles of mineralization are generally absent at Coronation.
Figure 14-2 Coronation cross section Looking North showing two mineralized lodes associated with the hangingwall shear
Resource Estimate
•Last updated in May 2025;
•Only hole prefixed RCH, RCD, DDH and DDW used in Resource estimate;
•Drill spacings 37.5 m or 50 m;
•The two lodes were combined into a single domain for modelling cut by North-south fault; and
•MIK used for the estimation.
Mining and Reconciliation
Pre-stripping commenced at the end of September 2014 with the first ore mined in December 2014. Mining commenced at a 0.4 g/t cut-off grade. Mining has progressed in stages with Stage 5 finishing in 2020.
To the end of 2022, 8.09 Mt at a grade of 1.00 g/t Au and containing 260 koz of gold have been mined.
In January 2020 the cut-off grade was lowered to 0.3 g/t Au.
During the mining of Stages 1 to 4 at Coronation the Resource estimate consistently under-estimated the contained gold due to insufficient drilling density (initially on 50 m x 50 m) to representatively test a series of 10 m to 20 m wide high-grade shoots. The drilling spacing was infilled to 37.5 m x 37.5 m and modelling parameters were reviewed prior to commencement of mining Coronation Stage 5
| | | | | | | | |
| Released: March 27, 2026 | Page 112 of 213 |
14.3.15Deepdell
Background
Alluvial mining on Horse Flat to the north of Deepdell Creek was first recorded in 1892. Quartz mining started in 1901 and continued intermittently until 1924 as the lines of lode were followed south to Deepdell creek.
There have been several phases of drilling at Deepdell leading up to the start of mining in 2001. The first phase of modern exploration commenced in 1985 when Homestake drilled five percussion and seven diamond holes. This was followed by another six phases of drilling by OceanaGold’s predecessor companies Macraes Mining and GRD Macraes.
Mining of the north pit commenced in 2001 and continued to 2003. Mining of the south pit concluded in October 2003. The north pit was subsequently backfilled with waste rock.
Drilling for down-dip extensions to the north pit began in 2013 and further infill drilling was conducted in 2017 and 2018 following which the Resource estimate was updated.
A resource consent application was lodged in 2019 to re-open the Deepdell North pit. The resource consent was approved towards the end of 2020 and pre-stripping commenced in December 2020 with first ore produced in January 2021.
Mining of Deepdell North Stages 3, 4, and 5 was completed in October 2023 and has yielded 5.70 Mt of ore @ 0.80 g/t Au for 146 kozs of gold at a 0.3 g/t cut-off.
Geology & Mineralization
The HMSZ at Deepdell consists of a 50 m to 60 m thick pelite, constrained by the Hangingwall and Footwall shears. The geology of Deepdell North is comparatively simple. It comprises the Hangingwall shear, which has a planar geometry and dips 15° to 20° to the east. Beneath the Hangingwall shear, up to three subparallel shears have been identified. These shears are generally thin (less than 3 m thick), weakly mineralized, and do not have the continuity of the Hangingwall shear.
At Deepdell South the Hangingwall shear geometry has been rotated into a south to southeast orientation and is cut by a northeast-southwest striking fault. The western portion of the Hangingwall dips at 20° to 25° to the southeast while the eastern section dips at 35° to 40° to the southwest. The Hangingwall shear is well developed to approximately 70,400 m E where it is either offset by a north-south trending faults or is pinched out against a fault. At both Deepdell North and Deepdell South quartz vein arrays and subsidiary shear development beneath the Hangingwall is relatively poor.
A complex fault zone separates Deepdell South from Deepdell North. Four east-west trending faults, which terminate the northeast – southwest trending fault in Deepdell South, have been interpreted. From Deepdell South to Deepdell North the effect of these faults is to uplift the Hangingwall and progressively displace the Hangingwall outcrop position to the west.
| | | | | | | | |
| Released: March 27, 2026 | Page 113 of 213 |
Resource Estimate
The current Resource lies under and down dip of the mined-out pits.
•Last updated in March 2022 – DD2203;
•Only holes prefixed RCH, RCD, RDDH and DDW used in Resource estimate;
•Drill spacings 25 m or 37.5 m, out to 50 m or more on the outside;
•Four lode domains in Deepdell North, two lode domains in Deepdell South; and
•MIK used for the estimation.
Mining & Reconciliation
The original Deepdell pits produced 2.55 Mt @ 1.44 g/t Au for 0.117 Mozs at a 0.5 g/t Au cut-off grade.
Mining re-commenced in Deepdell North in January 2021 (Stages 3, 4, and 5) and was completed in October 2023, producing 5.7 Mt @ 0.80 g/t for 0.15 Mozs at a 0.3 g/t cut-off for this period. Compared to the Resource model DD2203, 12% more tonnes were mined but at 6% less grade for 7% more ounces.
14.3.16Round Hill/Golden Point Open Pit
Background
Quartz reefs were mined in the area from the 1860s and with the discovery of the Golden Point Lodes in 1889 the area surrounding Round Hill became a significant producer of gold and scheelite at the time.
Round Hill was the focus of exploration and drilling in the 1980s and mining commenced in 1990. By 1998 mining was completed and the pit partly backfilled as the adjacent Golden Point and Southern Pit deposits were mined. Mining of these pits was completed in mid-2002. A small cut-back of Round Hill was mined in 2003 and the combined deposits produced 1.3 Moz.
The remaining open pit inventory was removed from Mineral Resources and Reserves in 2024 due to an economic assessment indicating low prospects for eventual extraction completed in 2023. The assessment was completed at the OceanaGold Mineral Reserve and Resource prices at the time of US$1,500 /oz. and US$1,700 /oz respectively. Round and Hill and Golden Point remain subject to further assessment.
14.3.17Innes Mills
Background
The earliest prospecting shaft and adit is thought to date back to around 1900 (Hamel, 1991) with report of an “80 ft” shaft and “150 ft” drive. From 1915 the landowner, Mr. A. Innes, worked the property in partnership with others. Mining via shafts, adits or small open cuts continued intermittently until 1944. No records of production have been located.
OceanaGold and its predecessor company Macraes Mining, mined the area as an open cut from 1996 to 2004 producing 8.11 Mt @ 1.58 g/t Au for 0.41 Moz. The open cuts were then backfilled. A
| | | | | | | | |
| Released: March 27, 2026 | Page 114 of 213 |
small extension, Innes Mills West, was mined in 2016 and was backfilled to allow realignment of the Macraes-Dunback road to cross it.
From 2004 to 2014 only a limited amount of drilling was conducted at Innes Mills. In 2005, 2011 and 2012 small drilling campaigns tested for extensions down-dip of the mined-out pit. Drilling resumed at the end of 2014 and continued in 2015, defining the Innes Mills West Resource, subsequently mined in 2016. Limited drilling was conducted in 2017, targeting quartz vein arrays / subsidiary shears in the west wall of the mined-out pits. Infill and step-out drilling re-commenced in 2021 and continued through 2022 covering the proposed Stages 6, 7 and 8 open pits. Mining of Stage 6 commenced in 2022 and Stages 7 and 8 in 2023. Innes Mills has been the main open pit ore source since 2024. Extensive infill and step out drilling to define additional resources has resumed from mid-2025 and is expected to be ongoing in 2026.
Geology & Mineralization
Innes Mills represents a set of stacked mineralized lodes north of the Macraes Fault Zone, which is a 150-200 m wide structure representing post-mineralization faulting across which the Hangingwall shear has apparent vertical offset of ~150 m (up-to-the-north). The fault zone is a complex zone of broken schist and gouge, but the disrupted trace of the Hangingwall Shear and associated mineralization can be roughly traced through it.
The Hangingwall Shear, or uppermost Concordant Lode, is offset (down-to-the-east) downdip. . Additional subparallel lodes beneath the Hangingwall Shear are more extensive in Innes Mills segment compared to Frasers to the south, and there is also evidence of extensive linking structures dipping at a higher angle between the concordant lodes.
Instead of using tightly-constrained geological domains for modelling, broad mineralized domains were used to enclose multiple stacked lodes and stockwork mineralization.
Gold Resource Estimate
The latest Resource estimate (gold only) was completed in November 2025;
•Drill spacing 25 m in the core out to 50 m on the periphery;
•Surface Holes prefixed RCH, RCD, DDH and DDW used from surface, UDH diamond holes from underground also included in the southern margin;
•Wet Bias correction factors applied to gold;
•Four broad mineralization domains used; and
•MIK used for the estimation.
The Innes Mills Resource estimate was externally audited in 2025 (De-Vitry, 2025). Several issues related to the estimation methodology and Resource classification were identified that collectively had the potential to be material. As a result of the audit, the following improvements were incorporated into the updated estimate, the combined results of which were minor :
•All missing samples replaced with zero for grade estimation, previously they were all treated as null;
•The threshold for Measured classification was lifted from 0.80 panel proportion of ore, to 1.0;
•Where a significant number of Wet RC samples are used in estimating an individual panel (>75% of all the informing composites) then the panel is categorised as Inferred; and
| | | | | | | | |
| Released: March 27, 2026 | Page 115 of 213 |
•Cut-off criterion for classification was dropped from 0.4 g/t to 0.3 g/t.
Relevant Factors
Re-alignment of the Macraes-Dunback road will be required in the future to allow the mining of the northern quarter of the Resource.
Like Frasers and Round Hill, in the deeper sections of Innes Mills, some historical RC drill holes were sampled under wet conditions. To mitigate the potential for wet sample bias, a set of gold grade factors were generated for factoring down wet RC sample grades to between 30-90% of raw value. In addition, recent diamond drilling has replaced many older wet RC holes which are removed from the dataset used for estimation. As a result, the residual Resource estimation risk for Innes Mills is considered low.
14.3.18Ounce
Background
The first recorded mining activity at Ounce dates to 1898 but alluvial mining in the creek bed may have occurred as early as 1862. Mining by various parties continued intermittently until 1952.
The area was first drilled by BP Minerals (NZ) Ltd in 1985. Macraes Mining Company followed in 1994 and 1997. The last campaign was by OceanaGold in 2010/2011. Only three diamond holes have been drilled (1985 and 1994). No metallurgical test work has been completed.
Geology & Mineralization
The Ounce deposit lies along HMSZ, to the south of Frasers. The Ounce structure is a low-angle thrust zone with an unusual orientation for the HMSZ, dipping 28° towards the southeast and cross-cutting dominantly psammitic schists (Figure 14-3). The main package is bound by a weakly-mineralized cataclastic upper concordant shear with another mineralized horizon located approximately 30 m structurally above this zone. Mineralization is hosted by concordant, sigmoidal and rare quartz vein arrays. Sigmoidal veins merge with, and are truncated by, concordant structures providing evidence of repeated cycles of vein formation/activation.
| | | | | | | | |
| Released: March 27, 2026 | Page 116 of 213 |
Figure 14-3 Ounce and Golden Bar geology and deposits
| | | | | | | | |
| Released: March 27, 2026 | Page 117 of 213 |
Resource Estimation
The last Resource estimate was completed in 2017. A schematic cross-section showing the domains used is in Figure 14-4. Domain 20 is the lode domain and is defined by a 0.2 g/t cut-off. Scattered mineralization does occur outside this zone.
Figure 14-4 Ounce schematic cross section with 2017 Resource domain
•Drill spacing 50 m;
•OK estimation was used with search distances of X, Y =75 m, Z = 5 m;
•Only RCH, RCD and DDH prefixed drill holes used in the estimation;
•A gold top cut at the 97.5 percentile was applied. This was 2.6 g/t Au gold for domain 20; and
•Entire Resource is classified as Inferred.
Relevant Factors
While OceanaGold owns the land on which the Resource is located, OceanaGold does not currently hold the necessary resource consents to undertake mining.
14.3.19Golden Bar
Background
The Golden Bar Resource area is centred on the small historic Golden Bar workings, approximately 9 km south of Macraes. These were worked at various times from 1889-1942, producing approximately 5,000 oz and a minor amount of scheelite.
The area was drilled initially by BP Minerals (NZ) Ltd in 1985 and then by OceanaGold from 1994-1997. The main drilling phase was completed in 1997 with drilling on 25 m x 25 m centres.
| | | | | | | | |
| Released: March 27, 2026 | Page 118 of 213 |
During 2002 several RC and diamond holes were drilled to twin previously drilled wet RC percussion holes.
OceanaGold mined Golden Bar from February 2004 to October 2005. The open cut yielded 1.74 Mt @ 1.72 g/t Au for 0.096 Mozs at a 0.5 g/t Au cut-off grade for oxide ore and a 0.7 g/t Au cut-off grade for sulfide ore.
Geology & Mineralization
The Golden Bar prospect is inferred to lie some 400 m vertically above the interpreted position of the HMSZ Footwall Fault and located within the Hangingwall psammites. By this interpretation Golden Bar is grouped with the Eastern Lodes, which outcrop 2-3 km to the east of the main shear zone. The main shear zone thins to the south of the Ounce deposit, which is coincident with the start of the Golden Bar shear zone (Figure 14-5).
An alternative interpretation has the Hangingwall Lode at Golden Bar is in the same structural position as the Hangingwall lodes seen at Ounce and further north and may be an offset of this main lode system. Doyle and Stewart (1997) suggested that the main Hangingwall Lode at Golden Bar lies at the contact between psammitic schist above and pelitic schist which is a typical Hangingwall lode position.
Two distinctive structural styles have been identified at Golden Bar:
•Concordant lodes which anastomose and are generally thinly developed, and
•sigmoidal vein structures. The sigmoidal veins are strongly mineralized and dominated by quartz veining. These structures link between the upper and lower concordant lodes.
The concordant lodes vary in style from thin (<1 m) discrete cataclastic shears to thick (15 m) quartz rich lode schist. South or south-easterly dipping shears are generally thin, highly sheared, while flat or northerly dipping shears are thick, strongly mineralized and show evidence of extension.
Two major shears are present as illustrated in Figure 14-5. These structures are 40 m apart at surface but converge into a single structure at depth with the line of intersection trending northeast. The lower shear to the west of this splitting is thickly developed and strongly mineralized. The rock between the shears contains several sigmoidal extension veins. Although no gross lithological differences could be clearly identified from logging, it is likely that this rock is more competent than the surrounding rock mass and has accommodated deformation by brittle extension, thus creating sites for development of the sigmoidal veins.
| | | | | | | | |
| Released: March 27, 2026 | Page 119 of 213 |
Figure 14-5 Golden Bar schematic cross section 5575 m N
The sigmoidal vein packages have a curved tabular geometry, striking to the northeast and dipping to northwest (Mine Grid) at around 25°. The vein dip is steepest (and most dilatational) where the intra-shear distance between upper and lower concordant structures is larger. In areas where these structures converge, the sigmoidal veins are more concordant.
The sigmoidal veins were the target of historic underground mining. All accessible mine workings have been mapped in detail and the observations included in interpretation of the geological wire frame.
Resource Estimate
The current Resource estimate GB2110 was completed in 2021 and provided an update of the previous model completed in 2002.
A broad zone, called the Golden Bar Mineralized Zone (GBMZ) was defined on a 0.1 g/t cut-off to capture the mineralization (Domain 47). Three north-west dipping lodes within this zone were wireframed separately but treated together for estimation together as Domain 29, these have been largely mined out. Two weakly mineralized zones above and below the GBMZ were defined (Domain one and Domain 48 respectively).
Mining and Reconciliation
Golden Bar was mined by open pit from February 2004 to October 2005. A total of 1.74 Mt @ 1.72 g/t Au for 0.096 Mozs was mined at a 0.5 g/t cut-off for oxide ore and 0.7 g/t cut-off for sulfide ore.
| | | | | | | | |
| Released: March 27, 2026 | Page 120 of 213 |
The current model under-estimates tonnes by 8% and grade by 3% for a net underestimation of contained gold by 11% at the mined cut-offs but is expected to perform better at lower cut-offs.
Relevant Factors
•Most of the land under MP41 064 is owned by OceanaGold, however the land to the east of the Golden Bar road as shown on Figure 14-5 containing the Resource extension is privately owned. OceanaGold does not have an access agreement/option to purchase on this land; and
•A further cut-back at Golden Bar would require the Golden Bar public road to be re-located and an application for resource consents to mine.
The current pit optimization is to a degree drilling limited. Step-out drilling would allow evaluation of a potential cut back.
14.3.20Taylors
Background
The Taylor’s gold deposit is one of several small gold deposits found at the southern end of the Hyde-Macraes Shear Zone. Other deposits include Wilsons North and South, Shaws and Home Reef and these are referred to collectively as the Stoneburn Resource Group.
A few historic workings are present but there is no record of production.
BHP drilled 14 shallow percussion holes in the 1980s from Home Reef down to Taylors. Between 1994 and 1999, Macraes Mining Company drilled 29 RC holes in the Stoneburn area including Taylors. In 2003, 39 RC holes were drilled at Taylors on a 25 m spacing.
No diamond drilling or metallurgical test work has been completed at Taylors.
Geology & Mineralization
Aldrich (2003) describes the mineralization at Taylors as two sub-concordant mineralized shears (“lodes”) that are thought to be the southern extension of the Home Reef and Golden Bar structures.
The upper lode is 1-3 m thick and lies 25-30 m above the lower lode. The lower lode is more extensive and thicker (up to 8 m). There are no indications that these 2 shears link as at Golden Bar. The shear zones strike 350° and dip 12-20° to the east. An NNE plunging ore shoot on the lower lode has been identified and remains open at depth. Mineralization in the shear zones is dominated by quartz veining with minor arsenopyrite and pyrite. The few tungsten assays available indicate some scheelite is present (up to 1.46% W recorded in assay). No quartz vein array mineralization has been identified below the lower zone.
Resource Estimation
The lode mineralized zones were defined based on a 0.2 g/t Au cut-off grade and a minimum 2 m mining width. Each drill interval had to include at least 1 m of waste below the 0.4 g/t Au economic cut-off grade.
| | | | | | | | |
| Released: March 27, 2026 | Page 121 of 213 |
Surfaces were created for both the upper and lower lodes and for the surrounding schist and oxide zones and these were used to construct the lode solids for coding. The interpretations were in general extended 25 m beyond the last drill hole or halfway to next drill hole if that hole was unmineralized.
A schematic cross-section is shown in Figure 14-6.
Figure 14-6 Taylors schematic cross section line 1400 n M
•Drill spacing 25 m to 50 m;
•Only RCH prefixed holes used in the estimation;
•Top cut of 8 g/t Au applied affecting 6 assays; and
•OK estimation with search distances of X, Y = 50 m, Z = 5 m.
14.3.21Stoneburn Group
Background
The Stoneburn group refers to five small gold Resources in the Stoneburn area: Wilsons North, Wilsons South, Home Reef, Shaw’s and Shaw’s South as shown on Figure 14-7.
Historic mining in the area is generally limited to pits, trenches and adits along strike of the lode traces with minor alluvial workings throughout.
Production records from the Stoneburn area are poor. In 1902, 60 tons of quartz from the “Stoneburn Mine” was crushed and returned 4.2 g/t gold. Between 1915 and 1917 a further 2,264 tons of quartz was treated returning 1.7 g/t Au. Apparently mining ceased in 1917 as the gold grade was too low and only scheelite was worth recovering. The location of the “Stoneburn Mine” is not known but was probably the combined workings of Wilsons and Shaws (Aldrich 2003).
BHP conducted percussion drilling from 1988 to 1989 along the strike of the lodes targeting the shallow areas of the lodes (<20 m) with 25 m drilling traverses across the trace of the lode spaced 50 m apart. In 1996 and 1998 RC drilling by OGL tested the deeper sections of the lodes (up to 200 m) on a 100 m x 100 m drilling grid, with localised 50 m x 50 m infill. There is no diamond drilling, and no metallurgical test work was completed.
| | | | | | | | |
| Released: March 27, 2026 | Page 122 of 213 |
Geology & Mineralization
Mineralization in the Stoneburn Resource area is associated with shallow east-dipping shears, slightly oblique to the regional penetrative schistosity. These structures consist of four concordant shears within a 450 m package of finer grained schists forming the southern continuation of the HMSZ Zone.
The Wilson’s Lode structures have been mapped through scattered shallow pits and adits, outcrops and float of mineralized quartz, cataclasite and sheared pelitic schist for 8 km. The Wilson’s Lode is thought to be the extension of the Hangingwall shear from Ounce to the north and extends to the south until it is obscured by overlying sediments. The Footwall Fault is interpreted to lie immediately below the lower Lode structure at Wilsons (Bleakley, 1996, Aldrich, 2003). At least two lodes are present with potentially more concordant lodes at the northern end of the Wilsons North area.
Shaw’s Lode and Shaw’s Lode South consist of structures hosted by narrow semi-pelitic to semi-psammitic units 1.5 km east of the Hangingwall-Footwall contact. The Home Reef structure is thought to be a continuation of the Golden Bar structure and extends over a strike length of 3.3 km. In places it occurs as a series of stacked lodes as at Taylor’s. Individual shears consist of quartz veins generally less than 1 m thick within concordant lode structures from one to seven metres thick. The Shaw’s Lode, a single concordant shear from one to five metres thick, has a strike length of at least 4.5 km.
Two styles of mineralization are evident at Stoneburn: quartz veins up to 1 m thick within concordant lode structures up to 8 m thick and broad zones of shearing with associated mineralized quartz, cataclasite and lode schist situated above the Footwall Fault on the Wilsons lode structure.
Gold-scheelite-pyrite-arsenopyrite mineralization occurs within the lode structures. Silicification is the dominant form of alteration. As a rule, the higher the lode quartz content, the stronger the gold mineralization. Argillic alteration is present within lode schist associated with quartz veining.
| | | | | | | | |
| Released: March 27, 2026 | Page 123 of 213 |
Figure 14-7 Stoneburn geology and Resource area
Resource Estimation
The lode zones wireframes were based on a combination of lithology and a 0.2 g/t gold cut-off. All the drill holes were used in the interpretation but only RCH prefixed holes were used in the Resource estimation:
•Drill spacing generally 100 m;
•Only RCH prefixed holes used in the estimation;
| | | | | | | | |
| Released: March 27, 2026 | Page 124 of 213 |
•Top caps applied at the 97.5 percentile (gold grades 2.5-5 g/t Au); and
•OK estimation with search distances of X, Y=150 m, Z = 5 m.
Relevant Factors
The Stoneburn deposits are small shallow Resources with a high proportion of oxide ore.
No resource consents have been applied for to mine the Stoneburn Resources and no access agreements are in place with the private landowners in the area.
14.4Underground Mineral Resource Estimate
14.4.1Drillhole Database
Resource estimation uses a combined dataset of both surface and underground drilling.
Exploration holes from surface (diamond core and percussion RC) are combined with diamond drill holes completed from underground.
14.4.2Software Used
Geological domains are created in Leapfrog Geo software and the wireframes and surfaces exported into MinePlan for composite coding and final Resource reporting.
Pangeos software is used for geostatistical analysis and block grade estimation. The block models created are then imported into MinePlan for domain compilation and final reporting.
14.4.3Geologic Modelling
Domain boundaries are based on geology and structure rather than grade.
Each domain represents an interpreted lode of shear mineralization broadly sub-parallel to the regional metamorphic foliation. Mineralized lithologies within the lodes are mostly ‘quartz cataclasite’ and ‘silicified breccia’ but intervals of ‘lode schist’ are also included along with segments of ‘stockwork’ veining where constrained between quartz cataclasite or silicified breccia units.
14.4.4Assay Capping and Compositing
Outliers
The underground Resources are estimated using Ordinary Kriging (OK). Top caps are always applied. For gold, this varies for each domain but is usually between the 97.5 and 99th percentiles.
Compositing
The raw assay data are composited to one metre lengths for Resource estimation.
14.4.5Density
A density of 2.65 t/m3 is assigned based upon average core immersion test results.
| | | | | | | | |
| Released: March 27, 2026 | Page 125 of 213 |
14.4.6Variogram Analysis and Modelling
Prior to spatial analysis, the composite sample locations are ‘flattened’ (essentially unfolded and un-faulted) by assigning a relative elevation equivalent to the elevation difference of each composite midpoint to a reference surface defined by the geological model. This is done primarily to preserve the vertical grade trends observed in the drill hole sample grades and to allow orientation of search directions to the geological structures.
Variograms and grade estimations are completed on the ‘flattened’ composites. Block grades are first estimated using Ordinary Kriging into 10 m x 10 m x 1 m parent blocks and subsequently divided into four 5 m x 5 m x 1 m daughter cells.
14.4.7Block Model
Gold grades are estimated into blocks with dimension X= 10 m, Y= 10 m, Z= 1 m for the underground model. These are subsequently divided into four 5 m x 5 m x 1 m size blocks. The smaller blocks are then re-aligned back into real space using Pangeos software, exported in ASCII text format and imported into MinePlan/Compass.
14.4.8Estimation Methodology
Ordinary Kriging (OK) was used for the underground Resource estimate with search ranges between 25 – 120 m.
14.4.9Model Validation
Model validation is like that described in Section 14.3.9.
14.4.10Resource Classification
Resource categories are defined by a combination of data density and within constrained geological domains. A minimum of at least 8 informing composites is required for any classified block. Horizontal extents are defined by kriging search parameters (32 m for Indicated and 62 m for Inferred) for most geological domains. However, these distance criteria were expanded (to 62 m Indicated and 120 m Inferred) within domains considered to represent the main ‘Hangingwall Shear’ of the Hyde-Macraes Shear Zone where the regional continuity is well established. The vertical extent of all classified Resources is restricted to geological domain limits.
Measured Resources are defined only within domains representing the main Hangingwall Shear and further restricted to within areas of extensive development.
14.4.11Golden Point Underground (GPUG) Resource Estimate
Background
The Golden Point Mine was the largest hard rock producer in the Otago Schist belt yielding approximately 13,000 oz. of gold and 800 tonnes of scheelite from underground workings up to 1934.
A Pre-Feasibility study on underground mining at Golden Point commenced in 2019 and was completed in July 2020. Infill and step-out diamond drilling commenced in 2017 and is ongoing.
| | | | | | | | |
| Released: March 27, 2026 | Page 126 of 213 |
The Golden Point underground is immediately down-dip of the Golden Point and Round Hill open pits which were mined by OceanaGold between 1990 and 2002 producing approximately 1.3 Moz. As a result of this mining, most of the historic underground mine was unearthed. The only remaining part of the historic workings are in the north wall of the Golden Point pit which is not proposed to be mined.
Geology & Mineralization
OceanaGold’s open pit mining at Golden Point encountered several stacked lodes 2-10 m thick dipping gently (10-15 °) to the east. Further down dip there are stacked west-dipping lodes as well as the east-dipping lodes (see Figure 14-8). At depth the stacked lodes disappear, and mineralization becomes focused along the Hangingwall shear. The Golden Point lodes are more distinct (less diffuse boundaries) than lodes elsewhere at Macraes and quartz vein array mineralization is noticeably absent.
The lodes contain a variable mix of silicified breccia, quartz cataclasite breccia and lode schist with pyrite, arsenopyrite, scheelite and occasionally visible gold.
Figure 14-8 Golden Point lode domains
Wet Bias Factors
Like Frasers and Innes Mills, in the deeper sections of Round Hill, some RC drill holes were sampled under wet conditions to mitigate the potential for wet sample bias Diamond twin holes were completed and a set of gold grade factors generated for factoring wet RC sample grades. Given this approach, the residual Resource estimation risk is low.
Resource Estimation
•Completed May 2025;
•Only surface drill holes prefixed RCH, RCD, DDH and DDW used. 15 RCH holes excluded due to excessive wet sample bias and down hole contamination;
•Drill spacing 25-50 m;
•Top caps at between 97.5 and 99 percentiles for most domains. Domain 30 top capped at 6 g/t. Domains 18, 19, 20, 22, 24, 31 and 32 top capped at 8 g/t Au. Domains 11,16 and 17 top
| | | | | | | | |
| Released: March 27, 2026 | Page 127 of 213 |
capped at 10 g/t Au, Domain 15 and 21 top capped at 12 g/t Au, and Domain 23, 25 and 26 top capped at 15 g/t Au; and
•Ordinary Kriging used for Resource estimation.
Relevant Factors
Drilling is currently ongoing and there is a reasonable expectation that the Resource will be extended down-dip.
14.5Resource Model to Mine Reconciliation
The combined open-pit and UG Resource model to mill-adjusted mine reconciliation for the five years to 2025 shows variable performance from year to year, albeit the long-term average performance for this period has been reasonable; + 25% for tonnes, - 4% for grade and + 19% for contained gold above cut-off.
In 2025, there was a 24% positive reconciliation in ore tonnage, an 4% positive grade reconciliation, and a 28% positive contained gold reconciliation above cut-off.
Annual Resource model to Mine reconciliation tables are presented for Macraes Open Pit Resources in Table 14-5, Underground Resources in Table 14-6. Results are presented for cut-off grades above 0.3 g/t and 0.5 g/t which has been the ROM cut-offs for Open Pit and Underground.
While annual reconciliation fluctuations are expected to continue, the Macraes open pit and underground Resource estimates are believed to provide an acceptable basis for medium to long term mine planning purposes.
Table 14-5 Open Pit Resource estimate versus mill adjusted truck estimates at 0.3g/t cut-off
| | | | | | | | | | | | | | | | | | | | | | | | | | | | | |
Year | Resource Model (OP) | Mill-Adjustment Mine | Mine/Model Factor (%) |
Mt | Au | Au Moz | Mt | Au | Au Moz | Mt | Au | Au Moz |
2025 | 5.12 | 0.72 | 0.12 | 6.20 | 0.70 | 0.14 | 121% | 97% | 117% |
2024 | 2.45 | 0.74 | 0.06 | 2.82 | 0.68 | 0.06 | 115% | 92% | 106% |
2023 | 3.74 | 0.91 | 0.11 | 4.84 | 0.81 | 0.13 | 129% | 89% | 115% |
2022 | 3.57 | 0.85 | 0.10 | 5.11 | 0.78 | 0.13 | 143% | 92% | 131% |
2021 | 3.55 | 0.94 | 0.11 | 4.18 | 0.85 | 0.11 | 118% | 90% | 106% |
Total | 18.43 | 0.83 | 0.49 | 23.15 | 0.77 | 0.57 | 126% | 92% | 116% |
Inferred Resources at Macraes are considered too low confidence to include in the annual reconciliation process. Nonetheless, allowance for Inferred Resources would improve the open pit reconciliation metrics from 126%, 92% and 116% to 109%, 97.5% and 107% for tonnes, grades and contained gold respectively.
| | | | | | | | |
| Released: March 27, 2026 | Page 128 of 213 |
Table 14-6 Underground Resource estimate versus mill adjusted trucked estimates
| | | | | | | | | | | | | | | | | | | | | | | | | | | | | |
Year | Resource Model (UG) | Mill-Adjustment Mine | Mine/Model Factor (%) |
Mt | Au | Au Moz | Mt | Au | Au Moz | Mt | Au | Au Moz |
2025 | 0.70 | 1.59 | 0.04 | 1.02 | 1.77 | 0.06 | 146% | 111% | 168% |
2024 | 0.61 | 1.53 | 0.03 | 0.71 | 1.67 | 0.04 | 117% | 109% | 127% |
2023 | 0.55 | 1.46 | 0.03 | 0.60 | 1.62 | 0.03 | 109% | 111% | 121% |
2022 | 0.79 | 1.70 | 0.04 | 0.96 | 1.76 | 0.05 | 122% | 104% | 126% |
2021 | 0.56 | 1.79 | 0.03 | 0.60 | 1.85 | 0.04 | 107% | 103% | 111% |
Total | 3.12 | 1.62 | 0.17 | 3.89 | 1.75 | 0.22 | 121% | 108% | 131% |
The combined Open Pit and Underground Macraes Resource models to Mine reconciliation for the last five years are in Table 14-7.
Table 14-7 Combined OP and UG Resource estimate versus mill adjusted trucked estimates
| | | | | | | | | | | | | | | | | | | | | | | | | | | | | |
Year | Resource Model (OP+UG) | Mill-Adjustment Mine | Mine/Model Factor (%) |
Mt | Au | Au Moz | Mt | Au | Au Moz | Mt | Au | Au Moz |
2025 | 5.82 | 0.83 | 0.16 | 7.22 | 0.86 | 0.20 | 124% | 104% | 128% |
2024 | 3.06 | 0.90 | 0.09 | 3.54 | 0.88 | 0.10 | 116% | 98% | 113% |
2023 | 4.29 | 0.98 | 0.14 | 5.44 | 0.90 | 0.16 | 127% | 92% | 116% |
2022 | 4.36 | 1.01 | 0.14 | 6.04 | 0.94 | 0.18 | 139% | 93% | 129% |
2021 | 4.11 | 1.06 | 0.14 | 4.78 | 0.97 | 0.15 | 116% | 92% | 106% |
Total | 21.63 | 0.95 | 0.66 | 27.01 | 0.91 | 0.79 | 125% | 96% | 119% |
•While annual reconciliation fluctuations are expected to continue, Macraes Resource open pit and underground Resources estimates are considered appropriate for medium and long term mine planning purposes.
14.6Open Pit and Underground Combined Mineral Resource Statement
Mineral Resource estimates for the Macraes Operation as of December 31st, 2025, by Resource category and deposit are shown in Table 14-8. The Mineral Resources have been prepared in accordance with CIM standards and guidelines.
| | | | | | | | |
| Released: March 27, 2026 | Page 129 of 213 |
Table 14-8 Macraes Resource inventory as at December 31, 2025
| | | | | | | | | | | | | | | | | | | | | | | | | | | | | | | | | | | | | | |
Gold | Measured | Indicated | Measured & Indicated | Inferred |
| Tonnes (Mt) | Au (g/t) | Contained Ozs (Moz) | Tonnes (Mt) | Au (g/t) | Contained Ozs (Moz) | Tonnes (Mt) | Au (g/t) | Contained Ozs (Moz) | Tonnes (Mt) | Au (g/t) | Contained Ozs (Moz) |
Macraes | | | | | | | | | | | | |
Nunns/NZGT | - | - | - | 0.27 | 0.81 | 0.01 | 0.27 | 0.81 | 0.01 | 0.8 | 0.9 | 0.0 |
Coronation North | 0.14 | 1.23 | 0.01 | 3.06 | 0.63 | 0.06 | 3.19 | 0.66 | 0.07 | 1.0 | 0.4 | 0.0 |
Coronation | 0.27 | 1.14 | 0.01 | 5.84 | 0.69 | 0.13 | 6.1 | 0.71 | 0.14 | 2.5 | 0.6 | 0.1 |
Deepdell | 0.36 | 1.17 | 0.01 | 0.66 | 0.9 | 0.02 | 1.03 | 0.99 | 0.03 | 0.5 | 0.6 | 0.0 |
Innes Mills | 1.91 | 1.32 | 0.08 | 24.3 | 0.64 | 0.50 | 26.2 | 0.69 | 0.58 | 7.5 | 0.5 | 0.1 |
Ounce | - | - | - | - | - | - | - | - | - | 1.3 | 0.7 | 0.0 |
Golden Bar | 0.19 | 1.31 | 0.01 | 1.34 | 0.94 | 0.04 | 1.52 | 0.98 | 0.05 | 4.7 | 1.1 | 0.2 |
Stoneburn | - | - | - | - | - | - | - | - | - | 6.1 | 0.6 | 0.1 |
Taylors | - | - | - | 0.29 | 0.81 | 0.01 | 0.29 | 0.81 | 0.01 | 0.3 | 0.7 | 0.01 |
Stockpiles | 9.73 | 0.42 | 0.13 | - | - | 0.00 | 9.73 | 0.42 | 0.13 | - | - | - |
Golden Point Underground | 0.08 | 3.02 | 0.01 | 6.37 | 2.28 | 0.47 | 6.45 | 2.29 | 0.47 | 2.4 | 1.8 | 0.1 |
Macraes Total | 12.7 | 0.63 | 0.26 | 42.1 | 0.91 | 1.23 | 54.8 | 0.85 | 1.49 | 27 | 0.8 | 0.7 |
All figures are rounded to reflect the relative accuracy of the estimates. Totals may not sum due to rounding;
•Mineral Resources are reported inclusive of Mineral Reserves. Mineral Resources that are not Mineral Reserves do not have demonstrated economic viability;
•All Resources are based on metal prices of USD2,450 /oz gold, NZD/USD exchange rate of 0.60;
•Open Pit Resources are constrained by optimised shells based upon economic assumptions above;
•Open Pits cut-off grades between 0.25 g/t Au and 0.30 g/t Au;
•Golden Point underground cut-off grade is 0.97 g/t Au.
•Underground Resources are reported within volumes guided by conceptual stope designs which are based upon economic assumptions above. Reported underground Resources exclude dilution; and
•Matthew Grant, Senior Geologist – Resource Development at Macraes is the Qualified Person for the Mineral Resource Estimates.
| | | | | | | | |
| Released: March 27, 2026 | Page 130 of 213 |
15Mineral Reserve Estimates
15.1General
A Mineral Reserve estimate was generated for the open pit and underground mining methods. The following sections explain the open pit and underground Mineral Reserve estimate separately. A combined Mineral Reserve statement is provided in Section 15.4.
15.2Open Pit Mineral Reserve Estimate
15.2.1Conversion Assumptions, Parameters and Methods
The Macraes Mineral Reserve estimate represents that part of the Measured and Indicated Resource which can be economically mined and for which the necessary design work and mine planning have been carried out. Proven and Probable Reserve blocks are based on Measured and Indicated Resource blocks respectively. Inferred blocks are inadequately defined and therefore are not included in reported Reserves. When the Inferred blocks fall within pit outlines, they represent potential additions to ore mined if confirmed by grade control drilling. The Reserves are included within the overall Resource figures.
Macraes open pit Mineral Reserve tonnages and grades are estimated from designs guided by Whittle 4X pit optimizations. Optimizations use projected costs, slope angles based on geotechnical studies, processing recoveries and USD2,200 /oz gold price at 0.60 USD:NZD exchange rate. An ad valorem royalty of 1% is payable to the New Zealand government and refining and handling charges are included at USD4.76 /oz.
Reserve tonnages and grades are reported in accordance with CIM criteria and include any anticipated mining losses and mining dilution.
For open pit inventory, the Resource block model estimation methodology incorporates adequate dilution and provides a reasonable estimate of mined tonnage and grades. No additional dilution or mining losses are applied during Whittle 4X optimizations.
Pit optimization and design inputs and methodologies are described in section 16.
15.2.2Relevant Modifying Factors
•CIM (2014) definitions were followed for Mineral Reserves;
•The effective date of the Mineral Reserves is December 31, 2025;
•The Qualified Person for open-pit Mineral Reserves at Macraes is Knowell Madambi MAusIMM CP(Mining), an employee of OceanaGold (New Zealand) Limited; and
•Not all required permits and consents are in place to enable mining of the entire Mineral Reserve. However, there are reasonable expectations that such permits and consents will be granted. Resource consent applications will be submitted in Q3 2026 for those areas in the life-of-mine plan presented in Section 16 that do not currently have all the required consents for mining.
| | | | | | | | |
| Released: March 27, 2026 | Page 131 of 213 |
15.3Underground Mineral Reserve Estimate
15.3.1Conversion Assumptions, Parameters and Methods
Mining Dilution and Recovery
The Macraes underground mine (Golden Point Underground) is an operating mine and has experienced the stope modifying factors summarized in Table 15-1. Mining recovery is expected to be poor during regional pillar extraction (pillar robbing) due to open stope instability. In this case the mining recovery factor was reduced. Reverse fire open stope (RFOS) methodology is used in areas with poor geotechnical characteristics in order to reduce loader exposure. RFOS is described further in Section 16.3.1.
Table 15-1 Stope modifying factors
| | | | | | | | | | | | | | | | | |
Method | Insitu Recovery (%) | Stope Dilution (%) | Stope Dilution Grade (g/t) | Mining Recovery (%) | |
Long hole open stope (LHOS) | 89.5 | 19.3 | 0.80 | 92.0 | |
Reserve fire open stope (RFOS) | 73.2 | 27.4 | 0.73 | 94.5 | |
Pillar robbing long hole open stope (PRLHOS) | 89.5 | 19.3 | 0.80 | 60.0 | |
Mineral Reserves Derivation
The full mine designs were depleted for:
•Areas outside the bounds of the Measured and Indicated classification shells in plan view; and
•Areas for which a mining consent is not currently granted (e.g. due to a requirement for further technical work before applying for a consent).
Stopes were assessed individually to determine if they met the relevant cut-off grade. The grade of each stope was determined as the measured and indicated ounces distributed across the tonnes of the entire stope solid, including any inferred and unclassified tonnes near the backs or floors.
Three cut-off grades are used at Golden Point Underground:
•minimum grade to warrant ore drive development;
•minimum grade to warrant stoping if the ore development drive is already in place; and
•minimum grade to warrant processing for development material that has been hauled to surface.
These cut-off grade scenarios are shown in Table 15-2.
| | | | | | | | |
| Released: March 27, 2026 | Page 132 of 213 |
Table 15-2 Golden Point underground cut-off grade calculations
| | | | | | | | | | | | | | |
Parameter | Unit | Ore Drive Development Cut-off | Stoping Cut-off when Development in Place | Process Cut-off when Material is at Surface |
Mining cost | NZD/t | 74.82 | 61.63 | 0.00 |
Ore re-handle cost (portal to mill, including ROM loader) | NZD/t | 2.12 | 2.12 | 2.12 |
Processing (including tailings dam construction) | NZD/t | 14.40 | 14.40 | 14.40 |
Sustaining capital | NZD/t | 8.94 | 8.94 | 0.00 |
G&A | NZD/t | 4.32 | 4.32 | 0.00 |
Gold price | NZD/oz Au | 3,667 | 3,667 | 3,667 |
NZD/g Au | 117.89 | 117.89 | 117.89 |
Processing plant recovery | % | 83.24 | 83.24 | 60.00 |
Selling cost (refining and royalties) | NZD/g Au | 1.54 | 1.54 | 1.54 |
Calculated cut-off grade | g/t Au | 1.08 | 0.94 | 0.24 |
Cut-off grade used | g/t Au | 1.08 | 0.94 | 0.50 |
In addition, a profit/loss assessment was completed for each stope. This included the cost of any access development attributable to that stope.
Stopes that made money on measured and indicated ounces (only) after including access development costs, satisfied the cut-off grade requirements and were either within the current consent footprint or have a reasonable expectation of being granted consent were included in the Mineral Reserves.
15.4Macraes Combined Mineral Reserves Statement
Mineral Reserves were classified using the 2014 CIM Definition standards. The combined Macraes Mineral Reserve estimate is presented in Table 15-3.
| | | | | | | | |
| Released: March 27, 2026 | Page 133 of 213 |
Table 15-3 Macraes combined Mineral Reserve estimate as at December 31, 2025
| | | | | | | | | | | | | | | | | | | | | | | | | | | | | | | | |
Gold | Proven | Probable | Proven & Probable | |
Tonnes (Mt) | Au (g/t) | Contained Ozs (Moz) | Tonnes (Mt) | Au (g/t) | Contained Ozs (Moz) | Tonnes (Mt) | Au (g/t) | Contained Ozs (Moz) | |
Macraes | |
Coronation | 0.22 | 1.23 | 0.01 | 4.9 | 0.66 | 0.10 | 5.12 | 0.69 | 0.11 | |
Coronation North | 0.11 | 1.12 | 0.00 | 3.34 | 0.58 | 0.06 | 3.46 | 0.6 | 0.07 | |
Innes Mills | 1.28 | 1.3 | 0.05 | 10.3 | 0.61 | 0.20 | 11.6 | 0.69 | 0.26 | |
Golden Bar | 0.14 | 1.25 | 0.01 | 1.15 | 0.94 | 0.03 | 1.29 | 0.97 | 0.04 | |
Stockpiles | 9.73 | 0.42 | 0.13 | - | - | 0.00 | 9.73 | 0.42 | 0.13 | |
Sub-total-Open Pit | 11.5 | 0.55 | 0.20 | 19.70 | 0.64 | 0.40 | 31.20 | 0.61 | 0.61 | |
Goden Point Underground | 0.04 | 2.01 | 0.00 | 2.57 | 1.9 | 0.16 | 2.62 | 1.90 | 0.16 | |
Total Macraes | 11.5 | 0.56 | 0.21 | 22.3 | 0.78 | 0.56 | 33.8 | 0.71 | 0.77 | |
All figures are rounded to reflect the relative accuracy of the estimates. Totals may not sum due to rounding;
•Mineral Reserves are reported based on a cut-off grade based on metal price assumptions, exchange rates and mining, processing, general and administrative costs;
•Open pit reserves for Innes Mills, Coronation and Coronation North are stated using a 0.25 g/t Au cut-off and for Golden Bar using a 0.30 g/t Au cut-off;
•Underground reserves are stated using 1.08 g/t Au where ore drive development is required and 0.94 g/t Au where development is in place;
•Reserves are based on a USD2,200 /oz gold price, NZD/USD exchange rate of 0.60;
•The Macraes processing plant recovery varies based on ore source and feed grade – an average recovery of 77% is estimated. Open pit dilution and recovery estimates are built into the underlying Resource models and no further adjustments are made;
•Underground insitu recovery, mining recovery and dilution modifying factors have been applied to designs resulting in an average underground mining recovery of 89% of the designed tonnage and 77% of the designed grade;
•Mineral Reserves have been estimated based on mine designs and plans consolidated into a Life of Mine schedule;
•Knowell Madambi, Manager - Technical Services & Projects at Macraes is the Qualified Person for the Open Pit Mineral Reserve Estimate; and
•Euan Leslie, Group Mining Engineer based in Australia is the Qualified Person for the Underground Mineral Reserve Estimate.
| | | | | | | | |
| Released: March 27, 2026 | Page 134 of 213 |
16Mining Methods
16.1General
The following sections explain the open pit and underground mining methods separately. A combined open pit and underground production schedule is provided in Section 16.5.
16.2Open Pit Mining Methods
16.2.1Current or Proposed Mining Methods
Conventional open cut mining methods are used at Macraes. Pits are excavated on level benches, 2.5 m high, within the ore zone (approx. 2.8 m high after blasting), 4 m high within the waste zone for backhoe excavators and 10 m for the shovel.
Hydraulic backhoe excavators in the 250 t and 360 t class are used for mining ore and waste and a 360 t electric-hydraulic shovel is used for mining waste only.
Ore is mined with different techniques depending on the style of mineralization:
•Hanging wall lode ore is mined by first removing the hanging-wall waste with an excavator under visual control of a geological technician, then mining the exposed ore. Footwall ore is selectively removed from the underlying footwall waste if it can be visually controlled, otherwise the footwall ore is diluted with the wedge of underlying waste.
•Stockwork ore is generally mined within the defined ore blocks. Ore blocks are defined with the guidance from a conditionally simulated grade control model.
For this mining method and equipment, the smallest selective mining unit (SMU) used when defining ore blocks is 4 m by 4 m by 2.5 m high (approximately 100 t), however blocks are generally a minimum of 500 t to minimise dilution.
16.2.2Parameters Relevant to Mine or Pit Designs and Plans
Geotechnical
The risk based slope design philosophy is adopted, managing minor localised slope instability rather than incurring the additional costs of designing conservative slopes to guarantee a zero-failure rate. It is accepted that on average 20% of any wall may experience some minor bench scale failures, however these will largely be contained on berms and will not adversely affect production. To optimise pits and reduce costs, slope angles are designed specifically for each pit, based on kinematic analysis and interpretation of existing geotechnical data. For new pit excavations, data are collected from air photo interpretation; surface trenching and diamond drill holes, whilst wall performance and in-pit mapping are used to further refine and optimise staged and final pit walls. This practice has proven to be successful over many years of demonstrated performance. Overall slope angles vary by deposit, and these are stated in each individual deposit section.
Generally, mining is restricted by the 25 m off-set from the footwall. Over the 35 years of mining at Macraes, it has been demonstrated that mining within the footwall fault off-set results in west
| | | | | | | | |
| Released: March 27, 2026 | Page 135 of 213 |
wall movement. Macraes open pit operation has a variety of slope monitoring equipment and process that has successfully been utilised to monitor and control wall movement.
Mining Dilution and Recovery
Resource models are recoverable indicator kriged models. Dilution is accounted for in the Resource model calculations by adding a waste veneer to the hanging wall contact and using dilution estimation during the kriging process. The result is a dilution/recovery factor of close to 2%, which is realistic considering the control techniques applied during mining. To avoid double accounting, Macraes models do not add dilution during optimization.
Selective ore mining procedures are utilised. This is done to maximise ore recovery and minimise mining dilution. Grade control blasthole assays are used as the input data to a conditional simulation grade control process. The results of bench grade estimates are then used in conjunction with detailed geological mapping to produce mining blocks. Ore mining is supervised by geologists and ore spotters. Mining of the ore waste contacts is done by backhoe excavator and this is only done during day shift.
16.2.3Pit Optimization
Open pit optimizations are completed in-house using Whittle 4X software.
Mineral Resource Models
Resource models are prepared by the site Resource geologists, and this includes classification into Measured, Indicated, and Inferred categories (see Section 14). Some additional manipulation is performed by the mining engineers to construct a ‘Reserve model’ ready for further mine planning work. These manipulations include:
•removal of all in-situ blocks above the chosen ‘as-mined’ topography surface;
•classification of blocks as fill that are below the ‘as-built’ surface and above the ‘as-mined’ surface;
•calculation of tonnes and grade for each material type, where material types are defined by Weathering, Classification, basic geology (hanging wall / stockwork), and grade classification (0.25-0.7, 0.7-1.0, 1.0+ g/t Au);
•identification of majority geology zone for the purposes of assigning slope angles; and
•assigning positional mining and processing costs.
The open pit Resource models at Macraes are recoverable Resource models built using GS3 estimation techniques and constructed in MinePlan. Each block in the model reports the proportion and the grade that can be recovered at various cut-offs. A summary of the underlying Resource models used in optimizations is shown in Table 16-1.
| | | | | | | | |
| Released: March 27, 2026 | Page 136 of 213 |
Table 16-1 Resource models used in pit optimizations
| | | | | | | | | | | | | | |
Area | Innes Mills | Coronation North | Coronation South | Golden Bar |
Resource model name | 251115.dat | 251015.dat | 250515.dat | Gb15.dat |
Date published | 2/12/2025 | 5/11/2025 | 12/05/2025 | 19/11/2021 |
Block size | 25x25x2.5 | 25x25x2.5 | 25x25x2.5 | 25X2.5X2.5 |
Northing Extent (Macraes grid) | 12,000 m N to 16,125 m N | 18,750 m N to 20,450 m N | 18,750 m N to 20,450 m N | 5,250 m N to 6,500 m N |
Topography cut to (date) | As mined 31/10/2025 | 30/04/2022 | 30/04/2024 | 30/04/2021 |
Costs current at (date) | Dec-25 | Dec-25 | Dec-25 | Dec-25 |
Reserve model name | 251115.wt5 | 251015.wh3 | 250515.wh2 | 251215.wh3 |
Optimization Constraints
Pit optimizations are normally limited by the Footwall Fault 25 m stand-off and the boundary of the underlying Resource model to avoid optimization shells artificially daylighting into space. For Innes Mills the optimization is further constrained by the public road and bridge corridor to the north (see Figure 16-1).
Optimization Parameters
Individual blocks in the block models were coded with mining and processing costs. Block model mining cost adjustment factors (MCAF) and processing cost adjustment factor (PCAF) fields were coded with mining and processing costs respectively.
A summary of the optimization inputs for each deposit is shown in the appropriate deposit section. Note that the block processing cost (PCOST) is the base cost to mine and process a tonne of ore and is made up of:
•Any additional (or lesser) mining costs associated with mining ore compared to waste;
•ROM ore re-handle into the crushers;
•Ore processing;
•General and administration overhead charges; and
•Sustaining capital and financing charges (includes tails dam construction).
Geotechnical Parameters
Slope angles used in optimizations are coded into the block model, based on block rock type, and slope rosettes are used to control those angles that depend on the wall orientation. At Macraes, final ramps can usually be sited within the footwall of the ore so additional slope laybacks are not needed to allow for pit ramps. A summary of the overall slopes used for each rock type and slope domain for each deposit is shown in the appropriate deposit section.
| | | | | | | | |
| Released: March 27, 2026 | Page 137 of 213 |
Innes Mills Optimization
Optimization Parameters
Innes Mills pit is an active pit and was the main open pit mining area in 2025. The pit is constrained to the South by the FTSF and to the North by the Macraes-Dunback public road and SP11 TSF. The FTSF is treated as a hard boundary as it is an active tailings storage facility that was commissioned in Q1 2025. Two scenarios were considered during the optimization:
•Optimization with restriction on both the FTSF and SP11 sides; and
•Optimization with restriction on only the FTSF side to allow re-mining of the SP11 tailings and realignment of the Macraes-Dunback public road.
Material within the Footwall Fault (FF) stand-off zone and FTSF and SP11 TSF was excluded from optimization for the first scenario by coding a high MCAF into the blocks. For the second scenario, the SP11 tailings were coded with a realistic tailings hydro-mining cost.
A summary of the optimization inputs for Innes Mills deposit is shown in Table 16-2.
Table 16-2 Innes Mills optimization inputs
| | | | | | | | |
Area | Innes Mills (in-situ) | |
Metallurgical Recovery (%) | Sulfide = 83%/Hanging Wall=77% | |
PCOST (NZD/t) | 20.50 | |
Indicative waste mining cost at design basis shell (NZD/t) | 2.54 | |
Tailings hydro mining cost (NZD/t) | 3.00 | |
Gold price used for shell generation & analysis (NZD/oz) | 3,667 | |
Selling costs | 1% royalty and NZD7.93 /oz refining cost | |
Shell selection method | Maximum specified case cash flow at a 50 Mtpa mining/2.8 Mtpa process rate (ex-pit) | |
Geotechnical Parameters
A summary of the overall slopes used for each rock type and slope domain is shown in Table 16-3.
Table 16-3 Innes Mills pit slopes used in optimizations
| | | | | | | | | | | |
Area | Material/Location | Overall Angle (degrees) | |
Innes Mills | Oxide schist | 37 | |
Fresh Schist/NE and SW wall | 43-49 | |
Fresh Schist/SE and NW wall | 43-49 | |
Backfill Waste | 37 | |
Optimization Results
Summary pit optimization results are shown in Table 16-4 below for Measured and Indicated (M+I) material classifications only, Inferred or Unclassified material is treated as waste in the pit optimization.
| | | | | | | | |
| Released: March 27, 2026 | Page 138 of 213 |
Table 16-4 Innes Mills optimization results
| | | | | | | | |
Area | Innes Mills tailings restricted (in-situ) | Innes Mills unrestricted (in-situ) |
Gold price used for analysis (NZD/oz) | 3,667 | 3,667 |
Shell selected for design (NZD/oz) | 3,667 | 3,667 |
M+I shell inventory (Mt processed) | 22.81 | 44.64 |
M+I shell gold grade (g/t processed) | 0.58 | 0.54 |
M+I shell strip ratio (t:t) | 6.26 | 6.47 |
Active Mining? | Yes | Yes |
Optimising without the SP11 restriction results in double the ore resource, however hydro mining of tailings needs further studies to demonstrate feasibility, as a result the pit expansion to the North and North-East is not included in pit designs and Life of Mine schedule. The Northern expansion will be the subject of further study in 2026. This is referred to as the Southern Pit Innes Mills (SPIM) project. Pit expansion into the SP11 tailings storage facility is shown in Figure 16-1.
| | | | | | | | |
| Released: March 27, 2026 | Page 139 of 213 |
Figure 16-1 Pit expansion into the SP11 tailings storage facility
Golden Bar Optimization
Optimization Parameters
Golden Bar pit is an inactive pit last mined in 2005. A summary of the optimization inputs for Golden Bar deposit are shown in Table 16-5.
| | | | | | | | |
| Released: March 27, 2026 | Page 140 of 213 |
Table 16-5 Golden Bar optimization inputs
| | | | | | | | |
Area | Golden Bar (in-situ) | |
Metallurgical Recovery (%) | Sulfide = 82%/Hanging Wall =77% | |
PCOST (NZD/t) | 25.95 | |
Indicative waste mining cost at design basis shell (NZD/t) | 1.88 | |
Gold price used for shell generation & analysis (NZD/oz) | 3,667 | |
Selling costs | 1% royalty and NZD7.93 /oz refining cost | |
Shell selection method | Maximum specified case cash flow at a 50 Mtpa mining/2.8 Mtpa process rate (ex-pit) | |
Geotechnical Parameters
A summary of the overall slopes used for each area is shown in Table 16-6.
Table 16-6 Golden Bar pit slopes used in optimizations
| | | | | | | | | | | |
Area | Material/Location | Overall Angle (degrees) | |
Golden Bar (in-situ) | Oxide schist | 37 | |
Fresh Schist/NE and SW wall | 43 | |
Fresh Schist/SE and NW wall | 45 | |
Backfill Waste | 37 | |
Optimization Results
Summary pit optimization results are shown in Table 16-7 below, for Measured and Indicated (M+I) material classifications only, Inferred or Unclassified material is treated as waste in the pit optimizations.
Table 16-7 Golden Bar optimization results
| | | | | | | | |
Area | Golden Bar (in-situ) | |
Gold price used for analysis (NZD/oz) | 3,667 | |
Shell selected for design (NZD/oz) | 3,667 | |
M+I shell inventory (Mt processed) | 1.49 | |
M+I shell gold grade (g/t processed) | 0.99 | |
M+I shell strip ratio (t:t) | 23.16 | |
Active Mining? | No | |
Coronation Optimization
Optimization Parameters
Coronation pit is an inactive pit last mined in 2020.
A summary of the optimization inputs for Coronation deposit is shown in Table 16-8.
| | | | | | | | |
| Released: March 27, 2026 | Page 141 of 213 |
Table 16-8 Coronation optimization inputs
| | | | | | | | |
Area | Coronation (in-situ) | |
Metallurgical Recovery (%) | Sulfide = 82% | |
PCOST (NZD/t) | 21.74 | |
Indicative waste mining cost at design basis shell (NZD/t) | 2.31 | |
Gold price used for shell generation & analysis (NZD/oz) | 3,667 | |
Selling costs | 1% royalty and NZD7.93 /oz refining cost | |
Shell selection method | Maximum specified case cash flow at a 50 Mtpa mining/2.8 Mtpa process rate (ex-pit) | |
Geotechnical Parameters
A summary of the overall slopes used for each area is shown in Table 16-9.
Table 16-9 Coronation pit slopes used in optimizations
| | | | | | | | | | | |
Area | Material/Location | Overall Angle (degrees) | |
Coronation (in-situ) | Oxide schist | 37 | |
Fresh Schist/NE and SW wall | 43-49 | |
Fresh Schist/SE and NW wall | 43-49 | |
Backfill Waste | 37 | |
Optimization Results
Summary pit optimization results are shown in Table 16-10 below for Measured and Indicated (M+I) material classifications only, Inferred or Unclassified material is treated as waste in the pit optimizations.
Table 16-10 Coronation optimization results
| | | | | | | | |
Area | Coronation (in-situ) | |
Gold price used for analysis (NZD/oz) | 3,677 | |
Shell selected for design (NZD/oz) | 3,677 | |
M+I shell inventory (Mt processed) | 4.8 | |
M+I shell gold grade (g/t processed) | 0.74 | |
M+I shell strip ratio (t:t) | 15.8 | |
Active Mining? | No | |
Coronation North Optimization
Optimization Parameters
Coronation North is an active pit. Mining restarted in December 2025. A summary of the optimization inputs for Coronation North deposit is shown in Table 16-11.
| | | | | | | | |
| Released: March 27, 2026 | Page 142 of 213 |
Table 16-11 Coronation North optimization inputs
| | | | | | | | |
Area | Coronation North (in-situ) | |
Metallurgical Recovery (%) | Sulfide = 83% | |
PCOST (NZD/t) | 22.9 | |
Indicative waste mining cost at design basis shell (NZD/t) | 1.91 | |
Gold price used for shell generation & analysis (NZD/oz) | 3,667 | |
Selling costs | 1% royalty and NZD7.93 /oz refining cost | |
Shell selection method | Maximum specified case cash flow at a 50 Mtpa mining/2.8 Mtpa process rate (ex-pit) | |
Geotechnical Parameters
A summary of the overall slopes used for each area is shown in Table 16-12.
Table 16-12 Coronation North pit slopes used in optimizations
| | | | | | | | | | | |
Area | Material/Location | Overall Angle (degrees) | |
Coronation North (in-situ) | Oxide schist | 37 | |
Fresh Schist/N and E wall | 37 | |
Fresh Schist/SE wall | 33 | |
Fresh Schist/SW wall | 28 | |
Backfill Waste | 37 | |
Optimization Results
Summary pit optimization results are shown in Table 16-13 below, for Measured and Indicated (M+I) material classifications only, Inferred or Unclassified material is treated as waste in the pit optimizations.
Table 16-13 Coronation North optimization results
| | | | | | | | |
Area | Coronation North (in-situ) | |
Gold price used for analysis (NZD/oz) | 3,667 | |
Shell selected for design (NZD/oz) | 3,667 | |
M+I shell inventory (Mt processed) | 2.63 | |
M+I shell gold grade (g/t processed) | 0.72 | |
M+I shell strip ratio (t:t) | 18.5 | |
Active Mining? | Yes | |
| | | | | | | | |
| Released: March 27, 2026 | Page 143 of 213 |
16.2.4Design Criteria
Generic design parameters used in pit and waste rock stack designs are shown in Table 16-14.
Table 16-14 Generic pit design parameters
| | | | | | | | |
Parameter | Value | |
Mining width of lowest 5 m cut | 30 m | |
Minimum mining width of cutbacks | 60 m | |
Ramp width (including 1 x window) | 30 m | |
Inside turning radius on switchbacks | 15 m | |
Maximum ramp gradient | 10% | |
Maximum bench height | 20 m | |
Minimum berm width | 7.5 m (15 m berm interval) | |
| 9.9 m (20 m berm interval) | |
16.2.5Waste Rock Storage
Sufficient locations exist to store the anticipated waste rock quantities expected from the various open pits. These are grouped into geographical areas and summarized in Table 16-15.
Table 16-15 Waste rock storage
| | | | | | | | | | | | | | |
Waste Sources | Source Quantity (Mt) | Waste Storage Options | Sink Capacity (Mt) | |
Coronation North | 59.0 | Coronation North WRS | 35.7 | |
| Coronation North Backfill 2 | 24.7 | |
Coronation | 75.8 | Coronation WRS | 5.1 | |
| Trimbles WRS | 7.5 | |
| Coronation Backfill | 32.9 | |
| Coronation North Backfill 3 | 51.4 | |
Innes Mills | 122.5 | Frasers Backfill | 43.0 | |
| Frasers South Backfill/WRS | 36.4 | |
| Frasers West WRS | 90.8 | |
| Frasers West Backfill | 4.2 | |
Golden Bar | 32.9 | Golden Bar WRS | 33.0 | |
| | | | | | | | |
| Released: March 27, 2026 | Page 144 of 213 |
The location of the various waste rock stacks is shown in Figure 16-2.
Figure 16-2 Existing and proposed open pits and waste rock stacks
| | | | | | | | |
| Released: March 27, 2026 | Page 145 of 213 |
16.2.6Mine Production Schedule
Scheduling Method
Open pit mine scheduling is undertaken using RPMGlobal’s MinePlanner software. The scheduling method integrates the mining and dumping schedule with haulage modelling. The MinePlanner scheduling model was implemented at Macraes in 2016 and is a successor of the Xpac scheduling model that had been used at Macraes since 1998.
Scheduling Objectives
Schedules aim to:
•ensure that the process plant can run at its capacity in all schedule periods and at the maximum mill head grade possible;
•minimise truck haulage cycle time and therefore haulage costs; and
•operate within the loading and hauling fleet capacity constraints.
Scheduling Parameters and Assumptions
Key schedule assumptions are noted in Table 16-16.
Table 16-16 Key open pit schedule assumptions
| | | | | | | | |
Parameter | Value | |
Mill feed target | UG material has priority for mill feed due to higher grades, typical OP targets are approx. 5.5 Mtpa | |
Cut-off grade | 0.25 g/t for IM, CN and CO and 0.30 g/t for GB | |
Starting topography | 31-Dec-25 | |
Operating time | Max 5,700 hrs/yr for both loading and hauling units | |
Truck payloads | 184 dry tonnes | |
Excavator productivity | EX3600: 2,590 dry tph | |
EX2500: 1,790 dry tph | |
Vertical advance | 10 m per month in ore zone | |
15 m per month in waste zone | |
Excavator proximity (minimum distance between operating excavators) | 50 m | |
The open pit mining areas included in the schedule are:
•Innes Mills (IM);
•Coronation North (CN);
•Coronation (CO);
•Golden Bar (GB); and
•Stockpiles (SP).
The location of the pits are shown in Figure 16-3.
| | | | | | | | |
| Released: March 27, 2026 | Page 146 of 213 |
Figure 16-3 Open pit mining areas
| | | | | | | | |
| Released: March 27, 2026 | Page 147 of 213 |
Scheduling Results
The open pit mine is scheduled after the underground mine schedules are completed. Open pit mining quantities by year are shown in Table 16-17 and Figure 16-4.
Table 16-17 Open pit mining quantities by year
| | | | | | | | | | | | | | | | | | | | | | | | | | | | | |
Materia; Type | Units | 2026 | 2027 | 2028 | 2029 | 2030 | 2031 | 2032 | Total |
Ore Mined | Mt | 4.46 | 3.43 | 3.60 | 2.89 | 3.06 | 3.85 | 0.16 | 21.4 |
Waste Mined | Mt | 47.2 | 47.4 | 52.4 | 49.6 | 46.5 | 46.9 | 0.94 | 291 |
Total Mined | Mt | 51.7 | 50.8 | 56.0 | 52.5 | 49.5 | 50.8 | 1.10 | 312 |
Figure 16-4 Mined quantities by material type
Annual total movement by the main excavator and truck mining fleet averages 54 Mt between 2026 and 2031.
Mining movement by area is shown in Figure 16-5.
| | | | | | | | |
| Released: March 27, 2026 | Page 148 of 213 |
Figure 16-5 Movement by sources
Figure 16-6 shows the mill feed makeup by material source including Golden Point Underground (GPUG).
Figure 16-6 Ore milled by sources
Ore processing continues at 6.4 Mt per annum up to 2029 when the main sulfide stockpiles are depleted, and before IM Stage 12 ore is fully exposed. In 2030 processing tonnes reduce to 3.7 Mt and 2.9 Mt in 2031 respectively, mainly due to depletion of underground ore and reduced pit size at depth. Innes Mills mining stages are shown in Figure 16-7.
| | | | | | | | |
| Released: March 27, 2026 | Page 149 of 213 |
Figure 16-7 Innes Mills open pit stages
| | | | | | | | |
| Released: March 27, 2026 | Page 150 of 213 |
Stockpile movements are shown in Figure 16-8. The mine scheduling strategy is to maximise the gold grade to the process plant and hence elevated gold cut-over grades are used when sufficient quantities of high-grade ore is available. The material below the process plant gold cut-over grade in each period is stockpiled and then reclaimed in later schedule periods.
Figure 16-8 Stockpile movements
16.2.7Mining Fleet and Requirements
General Requirements and Fleet Selection
The mine fleet used in this schedule assumes no change to the existing fleet configuration. This fleet configuration is well suited to the Macraes mining operations based on the 35 years the mine has been in operation.
Drilling and Blasting
Drilling and blasting requirements differ depending on the material zone. Ore zone material includes all material within the main hanging wall shear zone, including all ore grade material, and the waste zone is the overlying overburden waste rock.
Summary drill and blast parameters are shown in Table 16-18.
| | | | | | | | |
| Released: March 27, 2026 | Page 151 of 213 |
Table 16-18 Open pit drill and blast parameters
| | | | | | | | | | | | | | |
Parameter | Units | Ore Zone | Waste Zone | |
Drill Type (model) used | | Top hammer percussion | Rotary | |
(Weller D560) | (Sandvik D45KS) | |
Hole diameter | mm | 102 | 200 | |
Sampling Frequency | T | 128 | No Sampling | |
Bench height | m | 7.5 | 15.0 | |
Burden x spacing | m x m | 4.5 X 4.0 | 7.0 x 8.0 | |
Blasting powder factor | Kg/m3 | 0.40 | 0.52 | |
Loading
The primary mine loading fleet consists of three Hitachi EX3600 hydraulic backhoe excavators, one Hitachi EX3600 electric shovel (22 m3 capacity) and one Hitachi EX2500 hydraulic excavator (15 m3 capacity).
These machines are rated at 2,590 dry tph and 1,790 dry tph respectively.
Hauling
A haulage fleet consisting of Caterpillar 789C and 789D mechanical drive rear-dump trucks are used for all mine haulage duties. These trucks match up with the 22 m3 and 15 m3 hydraulic excavators/shovel with a nominal four and six passes per truck respectively. Truck rated payload is 184 dry tonnes.
The mine scheduling software dynamically accumulates the truck hours for every source/destination increment and is constrained by the number of available trucks.
Crusher Feed
Caterpillar 988, 990, and 992 wheel loaders are used to re-handle ore from the ROM blending stockpiles into the crushers.
Ancillary Equipment
A fleet of other equipment is used to support the primary production fleet. This consists of:
•Caterpillar D10 track dozers;
•Caterpillar 18 motor graders;
•Caterpillar 844 wheel dozer; and
•Caterpillar 773, 777 & 785 water trucks.
Ancillary equipment allocations are made based on historic actual usage and is either a fixed allocation per time interval or factored from the total truck hours.
Open pit equipment requirements by year are shown in Table 16-19.
| | | | | | | | |
| Released: March 27, 2026 | Page 152 of 213 |
Table 16-19 Major open pit equipment fleet by year
| | | | | | | | | | | | | | | | | | | | | | | |
Equipment Model | 2026 | 2027 | 2028 | 2029 | 2030 | 2031 | 2032 |
Drill – Montabert CPA | 2 | 2 | - | - | - | - | - |
Drill – Weiler D560 | 2 | 2 | 4 | 4 | 4 | 4 | 1 |
Drill – Sandvik D45 | 2 | 2 | 2 | 2 | 2 | 2 | - |
Excavator – Hitachi EX2500 | 1 | 1 | 1 | 1 | 1 | 1 | - |
Excavator – Hitachi EX3600 | 3 | 3 | 3 | 3 | 3 | 3 | 1 |
Excavator – Hitachi EX3600-7E LD | 1 | 1 | 1 | 1 | 1 | 1 | - |
Truck – Cat 789C/D | 23 | 23 | 24 | 24 | 22 | 21 | 5 |
Track dozer - Cat D10 | 5 | 5 | 5 | 5 | 5 | 5 | 2 |
Wheel dozer – Cat D10 | 1 | 1 | 1 | 1 | 1 | 1 | 1 |
Grader – Cat 18 | 3 | 3 | 3 | 3 | 3 | 3 | 1 |
Water carts (785/777/773) | 2 | 2 | 2 | 2 | 2 | 2 | 1 |
Wheel loader – Cat 992 | 1 | 1 | 1 | 1 | 1 | 1 | - |
Wheel loader – Cat 990 | 1 | 1 | 1 | 1 | 1 | 1 | 1 |
Wheel loader – Cat 988 | 1 | 1 | 1 | 1 | 1 | 1 | - |
During the term of the mine schedule, a Cat 789D haul tuck will be added to the fleet in 2028.
Table 16-20 shows replacement and additional equipment schedule from 2026 to 2029.
Table 16-20 Major open pit equipment fleet addition and replacement schedule
| | | | | | | | | | | | | | | | | | | | | | | |
Equipment Model | 2026 | 2027 | 2028 | 2029 | 2030 | 2031 | 2032 |
Drill – Weiler D560 | | | 2 | | | | |
Excavator – Hitachi EX2500 | | 1 | | | | | |
Excavator – Hitachi EX3600 | 1 | | | | | | |
Truck – Cat 789C/D | 5 | 1 | 11 | | | | |
Grader – Cat 18 | 1 | | | | | | |
Track dozer – Cat D10 | 1 | 1 | | 1 | | | |
Water carts (785) | 1 | | | | | | |
•1 Additional Fleet
•Make/model to be confirmed at time of purchase
16.2.8Mine Water
Ground Water
Open pits at Macraes produce only a small quantity of groundwater. Dewatering wells are not used, with the occasional exception of depressurisation bores to reduce the risk of slope instability. Groundwater is managed by pumping from pit sumps to the surface water management network.
Runoff Water Management
Surface water is managed by:
•diverting clean water away from active working areas; and
| | | | | | | | |
| Released: March 27, 2026 | Page 153 of 213 |
•collecting runoff water in pit sumps or silt ponds and either using it for dust suppression or pumping into the site water network where it is used as process water in the mill.
16.3Golden Point Underground
16.3.1Mining Methods
The Golden Point Underground orebody encompasses the down dip continuation of the Hangingwall shear mined in the Golden Point and Round Hill open pits. The orebody is relatively shallow dipping (15° – 20°) to the east. Most of the orebody is tabular with undulations and has a thickness varying between 5 m – 20 m. In addition, some concordant lodes are present in the west of the mine extents parallel to the main shear. The Golden Point Underground mine targets the higher-grade zone at the top of the main tabular orebody and within the concordant lodes.
The mining method used is based on the method that has been successfully used at Frasers Underground i.e. retreat uphole open stoping. At Golden Point this method entails 11 m and 15 m wide open stopes with 5 m yielding pillars between stopes.
In areas of expected poorer ground (RQD < 50) a method termed reverse fired open stopes (RFOS) is used. This involves firing material back towards the brow. Each firing has a rise at the back of the blast away from the existing stope void, into which the remaining rings are fired. This deposits more material at the brow reducing the distance a loader must travel into the stope to recover the blasted rock, thus reducing exposure of the loader to potentially unstable ground.
16.3.2Mine Design Criteria
The decline and access drives are mined to a 5.5 m W x 6.0 m H arched profile. Ore drives are mined to a 5.5 m W x 5.5 m H half arch profile. This allows enough space for services, secondary fans, vent ducts and mobile equipment.
Stoping panels are design from minable target areas using Deswik Stope Optimiser (DSO). Panels are designed based on the main considerations below:
•Minimum mining height of 4m;
•Ore drives placed at 20 m centres to allow for 15 m wide stopes with 5 m yielding pillars between them. In areas of RQD<50 ore drives are placed at 16 m centres, allowing for 11 m wide stopes with 5 m yielding pillars between them. There are no secondary stopes designed to be extracted following the mining of the primaries;
•Ore drives positioned such that they have a gentle uphill gradient for water drainage but not orientated for a long distance on a 350° bearing, parallel to the strike of many of the faults present, to maintain drive stability;
•Regional pillars of 25 m width and containing no development are designed between panels. A 60 m wide regional pillar is maintained around the permanent declines;
•Hydraulic radius of each panel is limited to 25 m where possible but never exceeds 30 m; and
•Panel accesses designed in conjunction with primary ventilation return loops and secondary egress routes and positioned such that they will stay intact following stoping of nearby areas.
| | | | | | | | |
| Released: March 27, 2026 | Page 154 of 213 |
A typical panel layout is shown in Figure 16-9. The resource recovery is less than 100% due to yielding pillars, lower gold grade on the periphery of the resource and ore loss and dilution in stopes. Stope ore loss and dilution assumptions are documented in Table 15-1.
Figure 16-9 Panel layout
16.3.3Mine Production Schedule
Scheduling Method
Underground mine scheduling is undertaken using Deswik Sched software. After establishing task dependencies, mining priorities, task and resource rates and capacity constraints the schedule is generated using the software’s auto-scheduler.
Scheduling Objectives
The schedule aims to:
•ensure monthly stoping rate is consistent;
•ensure monthly development advance is consistent; and
•maintain a sufficient number of active headings and stopes to meet the desired development and stoping rates.
Scheduling Parameters and Assumptions
Key schedule assumptions are noted in Table 16-21.
| | | | | | | | |
| Released: March 27, 2026 | Page 155 of 213 |
Table 16-21 Key underground schedule assumptions
| | | | | | | | | | | |
Parameter | Units | Value | |
Maximum single heading advance rate (decline in good ground) | m/month | 56 | |
Maximum single heading advance rate (decline in poor ground) | m/month | 30 | |
Maximum single heading advance rate (non-decline in good ground) | m/month | 65 | |
Maximum single heading advance rate (non-decline in poor ground) | m/month | 27 | |
Maximum advance rate per development jumbo | m/month | 200 | |
Maximum drilling rate per automated LH drill | m/day | 270 | |
Maximum drilling rate per diamond drill | m/day | 30 | |
Maximum productivity per remote loader | t/day | 1,248 | |
16.3.4Underground Mining Schedule Results
A summary of the scheduled physicals is presented Table 16-22.
Table 16-22 Schedule physicals
| | | | | | | | | | | | | | | | | | | | |
Schedule Physical | Units | Year | |
2026 | 2027 | 2028 | 2029 | |
Total Ore Tonnes | kt | 835 | 760 | 749 | 273 | |
Total Ore Grade | g/t Au | 2.02 | 1.87 | 1.88 | 1.68 | |
Total Mined Ounces | koz | 54 | 46 | 45 | 15 | |
Total Mill Ounces | koz | 54 | 46 | 45 | 15 | |
Total Waste Tonnes | kt | 454 | 140 | 55 | 1 | |
Total Movement Tonnes | kt | 1,288 | 900 | 804 | 274 | |
Stope Ore Tonnes | kt | 420 | 569 | 654 | 271 | |
Stope Ore Grade | g/t Au | 1.78 | 1.76 | 1.77 | 1.67 | |
Stope Ore Ounces | koz | 24 | 32 | 37 | 15 | |
Development – Lateral | m | 9,245 | 3,454 | 1,588 | 33 | |
Devt Ore Tonnes | kt | 415 | 191 | 96 | 2 | |
Devt Ore Grade | g/t Au | 2.28 | 2.20 | 2.68 | 1.96 | |
Devt Ore Ounces | koz | 30 | 14 | 8 | 0 | |
Production Drill | m | 134,077 | 101,054 | 116,585 | 56,984 | |
Cable Drill | m | 38,643 | 45,091 | 41,612 | 20,865 | |
Total Haulage | Tkm | 3,017,028 | 2,253,010 | 1,979,845 | 645,856 | |
16.3.5Mining Fleet and Requirements
General Requirements and Fleet Selection
The mine fleet used in the schedule is based on the existing operation and utilises existing equipment items.
| | | | | | | | |
| Released: March 27, 2026 | Page 156 of 213 |
Drive Development
Development drilling uses Sandvik DD420, DD421 and DD422 twin boom drill jumbos, taking 3 m rounds and includes installing friction bolts and mesh in the backs and walls. Normet Spraymecs and Normet Concrete Agitator trucks are used to apply shotcrete in areas of friable ground and Normet Charmecs are used to load development face blast holes.
Stope Drilling and Blasting
Sandvik DS420 Cable Bolters are used to install cable bolts at planned brow positions in ore drives. A Tamrock Solo 7 and Sandvik DL432 are used to drill blind upholes for stope production. A Normet Charmec is used to load production blast holes.
A summary of the designed drill and blast parameters are shown in Table 16-23.
Table 16-23 Underground drill and blast parameters
| | | | | | | | | | | |
Parameter | Units | Open Stopes | |
Drill type (model) used | - | Tamrock Solo7/Sandvik DL420C | |
Hole diameter | mm | 76 | |
Ring burden | M | 1.8 | |
Toe spacing | M | 2.2 | |
Blasting power factor | kg/m3 | 0.3 | |
Loading
The primary mine loading fleet consists of Sandvik LH517 LHDs. These remove ore from stopes on remotes, bog out development headings and load trucks.
Hauling
The underground haulage fleet consists of Sandvik TH550 & TH551 articulated rear dump trucks. Ore and waste is hauled to the surface by the underground haul fleet and dumped in stockpiles near the access portal. Material is then rehandled by the surface mining fleet to the final destination (ROM or waste storage areas).
Ancillary Equipment
Ancillary equipment is used to support the primary production fleet. Key ancillary equipment includes:
•a Caterpillar 12H motor grader;
•Volvo L120 integrated tool carriers;
•T-Rex water truck; and
•Jacon flatbed truck.
The underground equipment requirements by year are shown in Table 16-24.
| | | | | | | | |
| Released: March 27, 2026 | Page 157 of 213 |
Table 16-24 Major underground equipment fleet by year
| | | | | | | | | | | | | | | | | |
Equipment Model | 2026 | 2027 | 2028 | 2029 | |
Drills – Sandvik DD420/DD421/DD422 | 4 | 2 | 1 | 1 | |
Drills – Tamrock Solo7/Sandvik DL432 | 2 | 2 | 2 | 1 | |
Drills – Sandvik DS420C | 2 | 2 | 2 | 2 | |
LHDs – Sandvik TH550/TH5511/Caterpillar 730 | 5 | 4 | 3 | 2 | |
Dump Trucks – Sandvik TH550/TH551/Caterpillar 730 | 5 | 4 | 3 | 1 | |
Charge Vehicles – Normet Charmec | 3 | 3 | 3 | 2 | |
Shotcrete Sprayers – Normet Charmec | 2 | 2 | 2 | 1 | |
Shotcrete Agitator Trucks – Normet Transmix/Komatsu HM300 | 3 | 2 | 2 | 1 | |
Grader – Caterpillar 12H | 1 | 1 | 1 | 1 | |
Integrated Tool Carrier – Volvo L120 | 5 | 5 | 5 | 4 | |
Service Truck – Jacon flat deck | 1 | 1 | 1 | 1 | |
Water Truck - T Rex | 1 | 1 | 1 | 1 | |
16.3.6Mine Ventilation Requirements
The ventilation requirements for the key mobile equipment used are shown in Table 16-25. This is based on a minimum air quantity requirement of 0.05 m3/s per kW of maximum engine power. Equipment numbers shown are maximum concurrent units during mine life.
Table 16-25 Mine ventilation Requirements
| | | | | | | | | | | | | | |
Equipment Item | Engine Power (kW) | Number Utilised | Ventilation Requirements (m3/s) | |
Sandvik TH550 truck | 429 | 1 | 21 | |
Sandvik TH551 truck | 515 | 4 | 103 | |
Caterpillar R1700 LHD | 263 | 1 | 13 | |
Sandvik LH517 LHD | 310 | 4 | 62 | |
Caterpillar 12H grader | 104 | 1 | 5 | |
Volvo L120IT (underground units only) | 180 | 3 | 27 | |
Total | | | 232 | |
The primary fans required for the Life of Mine (3 x 250 kW) are installed on the surface at the ventilation return portal and the primary ventilation circuit is established. Fresh air is drawn through
| | | | | | | | |
| Released: March 27, 2026 | Page 158 of 213 |
the main portal and down the haulage decline. The primary ventilation circuit as of September 2025 is shown in Figure 16-10.
Figure 16-10 Primary Ventilation Circuit
16.3.7Mine Services
Water
Mine water is sourced from the Round Hill pit sump. Water services are run into the portal via a single 110 mm PN16 polyethylene pipe. Pressure reducers are placed along the length of the pipe where required. Panel accesses are serviced by 110 mm PN16 pipe branching off the decline, ore drives are serviced by 63 mm polyethylene pipe branching off the access.
The main underground dewatering pumping system utilises WT103 helical rotor pumps linked in series and ultimately reports to the Round Hill pit sump. Each pump cuddy contains two separate pumps, each feeding into a separate 110 mm PN16 polyethylene pipe pump line for system redundancy. Additional pump cuddies will be established as the mine expands downdip. Average ground water make is 5 L/s.
| | | | | | | | |
| Released: March 27, 2026 | Page 159 of 213 |
Compressed Air
Compressed air is supplied to the portal via a 110 mm PN16 polyethylene pipe from a compressor and receiver on the surface. 110 mm pipes are used in declines and accesses and 63 mm pipes used in ore drives to distribute compressed air to the working areas.
16.4Combined Open Pit and Underground Production Schedule
The combined open pit and underground ore processing schedule is shown in Table 16-26 and Figure 16-11.
Table 16-26 Combined open pit and underground ore processing schedule
| | | | | | | | | | | | | | | | | | | | | | | | | | | | | | | | |
| Units | 2026 | 2027 | 2028 | 2029 | 2030 | 2031 | 2032 | LoM | |
Open Pit Schedule | |
Total ore milled quantity | Mt | 5.37 | 5.64 | 5.65 | 6.13 | 3.85 | 2.94 | 1.60 | 31.18 | |
Total milled gold grade | g/t | 0.72 | 0.49 | 0.51 | 0.53 | 0.66 | 0.91 | 0.57 | 0.61 | |
Total milled contained gold | koz | 124 | 88 | 93 | 104 | 82 | 86 | 29 | 607 | |
Underground Schedule | |
Total ore milled quantity | Mt | 0.83 | 0.76 | 0.75 | 0.27 | - | - | - | 2.62 | |
Total milled gold grade | g/t | 2.02 | 1.87 | 1.88 | 1.68 | - | - | - | 1.90 | |
Total milled contained gold | koz | 54 | 46 | 45 | 15 | - | - | - | 160 | |
Combined Open Pit and Underground | |
Total ore milled quantity | Mt | 6.21 | 6.40 | 6.40 | 6.40 | 3.85 | 2.94 | 1.60 | 33.80 | |
Total milled gold grade | g/t | 0.89 | 0.65 | 0.67 | 0.58 | 0.66 | 0.91 | 0.57 | 0.71 | |
Total milled contained gold | koz | 178 | 134 | 139 | 118 | 82 | 86 | 29 | 768 | |
Figure 16-11 Combined open pit and underground ore processing schedule
| | | | | | | | |
| Released: March 27, 2026 | Page 160 of 213 |
17Recovery Methods
17.1Introduction
The Macraes processing facility is projected to treat 6.4 Mtpa of gold bearing sulfide ore sourced from the Macraes Open Pit and Underground projects. The metallurgical processes of treating the gold bearing sulfide ore is crushing, milling, flotation, pressure oxidation, Carbon in Leach (CIL), elution and electrowinning unit operations to extract maximum value. One of the principal risks of this processing is the fact that the Macraes sulfide ore is partially refractory containing preg-robbing carbonaceous material.
Up to 88% of the gold present can be recovered to a flotation concentrate at a primary grind P80 of 120-140 μm targeting a sulfur content above 8.5% for pressure oxidation feed. The Reserves in the updated Life of Mine plan (LoM) are from cutbacks or underground extensions of pits previously mined with operating experience treating the ore types in the plant.
17.2Plant Description
The Macraes Process Plant recovers gold by concentrating the metal into a relatively small fraction of flotation concentrate, regrinding the concentrate to a P80 of 15 μm, oxidising the reground concentrate in a pressure oxidation autoclave, washing the oxidised residue and then utilising a carbon-in-leach process to recover gold from the residue. The overall process flowsheet is shown in Figure 17-1.
| | | | | | | | |
| Released: March 27, 2026 | Page 161 of 213 |
Figure 17-1 Macraes process plant flowsheet
In detail the plant comprises the following components and stages:
•Two single stage jaw crushing circuits, which reduce the ore to a top size of approximately 200 mm; the products from these two circuits are directly fed to the two SAG mills and an emergency feeder on the conveyor system feeding the higher capacity circuit provides continuity of feed to the grinding circuit if the jaw crusher feed is interrupted;
•A complex grinding circuit to reduce the particle size of the ore to 80% passing at 130 µm; the original, higher capacity crushing circuit feeds a 2,300 kW SAG mill and the new crushing circuit feeds a 1,500 kW SAG mill; discharge from the two SAG mills is combined with the discharge from one of the two ball mills (2,300 kW) and directed to the primary cyclone cluster. Discharge from the higher capacity ball mill (2,500 kW) is fed to the secondary cyclone cluster. The underflows from both cyclone clusters ire combined and fed in parallel to the flash flotation circuit and two ball mills (2,300 kW and 2,500 kW);
•Re-introduction of a crusher on the pebble recycle stream from the SAG trommel screen to reduce the recycle of competent material;
•A flash flotation circuit made up of roughing and cleaning stages. The circuit is fed from the circulating load of the grinding circuit via cyclone underflows to recover the bulk of fast floating sulfide minerals containing high gold content in the coarser size;
| | | | | | | | |
| Released: March 27, 2026 | Page 162 of 213 |
•This flash floatation circuit utilises two Outotec SK-500 flash flotation roughers and two Outotec TC-6 cleaner cells;
•The main flotation circuit made up of roughers, scavengers, cleaners, recleaners and cleaner scavenger flotation cell trains to produce a gold bearing sulfide concentrate at optimum sulfur grade for the downstream pressure oxidation circuit;
•Regrind of the flotation concentrate is performed in a 900 kW ball mill to 80% passing of 15 µm to improve pressure oxidation kinetics; limestone is added to the regrind circuit discharge to control net acid generation in the pressure oxidation circuit;
•Pressure oxidation is performed in a 77 m3 autoclave operating at 3,150 kPa and 225°C to achieve greater than 96% oxidation of the sulfide component of the Macraes concentrate; oxygen is supplied to the autoclave from a cryogenic plant operated by BOC Gas New Zealand;
•Washing and thickening of the oxidised residue post the pressure oxidation (POX) process is performed in a two-stage counter current decantation thickener circuit to cool the temperature and dilute acidity of the hot oxidised residue, remove presence of iron and arsenic, and increase pulp density preparation for downstream CIL process;
•Neutralisation of the acidic, cooled oxidised residue is conducted using quicklime in an agitated opened tank; solvent is also added to passivate the carbonaceous surfaces of oxidised residue;
•Leaching of the gold from the oxidised residue is performed in the CIL circuit using cyanide. The leached gold liquor is adsorbed by high concentrations of activated carbon to mitigate the impact of preg-robbing by the carbonaceous species in the ore;
•Destruction of the cyanide ions prior to CIL tailings disposal is performed using the INCO process with chemical reagents of sodium metabisulphite, source of sulfur dioxide (SO2); and chemical reaction catalyst, copper sulfate;
•Tailings disposal after further neutralisation of the acidic liquor from the pressure oxidation process performed using flotation tailings and lime and then combined with CIL tailings after the INCO cyanide detoxification process and discharged into the tailings storage facility; and
•Recovery of concentrated, adsorbed gold from the loaded activated carbon is performed using the AARL elution process and single pass electrowinning circuit, followed by smelting to produce gold doré.
The pressure oxidation process uses technology that minimises formation of gold chloride complexes in the autoclave. Formation of these soluble gold complexes in the presence of naturally occurring carbonaceous species has the potential to preg-rob soluble gold prior to contact with cyanide in CIL circuit. Minimising the chloride content in the reground concentrate is achieved through monitoring of the process and selection of key reagents with minimal chloride content to maintain low levels in the process water. The acidity of the oxidised residue is controlled by the addition of limestone in the regrind circuit when required. The sulfur oxidation extent in the autoclave is typically targeted at 98% to maximise gold extraction in the CIL circuit downstream, with higher preg-robbing material this target can be relaxed to 96% to minimise activation of the organic carbon.
| | | | | | | | |
| Released: March 27, 2026 | Page 163 of 213 |
The process plant utilises a Yokogawa CentumVP DCS control system for all operational control. In addition, a number of analyzers and systems complement the DCS to improve process control including:
•FLS LoadIQ mill load sensors on both the composite lined ML-500 and steel lined ML-01;
•FrothSense cameras to control the TC-300 scavenger flotation circuit;
•Courier 5i on stream analyzer; and
•Gekko carbon scout to monitor key CIL circuit parameters.
17.3Plant Performance
The Macraes process plant has been in operation since 1991 with progressive upgrades completed to debottleneck the plant and improve recovery. The current plant operating circuit has been in place largely unchanged since 2015 with an experienced workforce, maintenance strategies and planning teams in place. The process plant performance is fairly consistent with a well-established process for production planning in place to estimate mill utilization, throughput, recovery and operating cost parameters.
Recent plant performance over the last 10 years is summarized in Figure 17-2 and Figure 17-3 below.
Figure 17-2 Actual milled tonnages and combined mill throughput
| | | | | | | | |
| Released: March 27, 2026 | Page 164 of 213 |
Figure 17-3 Actual overall circuit, flotation and CIL recoveries
Mill throughput from 2016 to 2023 has generally targeted 5.7-6 Mtpa with variations in ore hardness and overall utilization affecting the total tonnes milled. The exception to this was the impacts in 2020/21 from Covid-19 restrictions to site operations, and the failure of the smaller ML-500 SAG mill motor in first half of 2021, reducing throughput by 0.4-0.6 Mt in these years. The throughput rate in terms of tonnes per operating hour (tpoh) over the year has been steady around 710 tpoh in these years. With the reintroduction of pebble crushing into the grinding circuit in 2023 throughput targets for the mill have been increased to a 6.3-6.7 Mtpa rate target with an increase in throughput rate of 780-800 tpoh.
Overall plant recovery of gold has been fairly consistent over the same ten-year period averaging 82.6% compared to the budget average of 82.3%, with flotation recovery driven primarily by variations in gold to sulfur ratio in the different pits and CIL recovery by the relative level of organic preg-robbing material in the feed. Feed head grades have declined over the last five years without an appreciable impact on overall recovery and grind size has been maintained in the 120-140 μm range.
Since Q3 2022 the throughput rate has increased on a monthly basis to 801 tpoh in 2024 and 770 tph in the first 9 months of 2025 following the installation of a crusher on the SAG mill scats recycle screen along with modifications to the SAG grates and ball mill classification circuit. In addition, the installation of the FLS LoadIQ sensor on the composite lined smaller ML-500 has allowed increased throughput with better charge load estimation increasing from an average 185 tpoh prior to 2022 to 220-240 tpoh since. Figure 17-4 below shows the monthly milled tonnes and throughput rate as the operation of the pebble crusher and improvement in ML-500 performance has matured. Outside of these periods milling rates in excess of the 6.4 Mt planned in the LoM have been exceeded (as represented by the red line indicating the average 777tpoh required to meet this production target).
| | | | | | | | |
| Released: March 27, 2026 | Page 165 of 213 |
Figure 17-4 Mill throughput post pebble crushing installation
Overall mill utilization above 92.9% has been achieved over the ten-year period and in excess of 93.9% when the impacts of unplanned events of 2020/21 related to Covid-19 restrictions are excluded and is calculated on the tonnage weighted utilization of the two primary SAG mills. Unit costs over the last 10 years are shown in Figure 17-5 along with the budgeted unit cost. Overall, the process plant unit cost has tracked well with budget models when allowing for the deferment of the planned autoclave rebrick in 2024 was able to be pushed into 2025 with its associated costs indicating a fairly robust process for estimating the unit cost.
Figure 17-5 Overall mill utilization and unit costs for 2016-2025
| | | | | | | | |
| Released: March 27, 2026 | Page 166 of 213 |
17.4Process Costs
Process costs are derived from a first principals model based on drivers developed against milled tonnes, operating hours and fixed cost components. Drivers for key consumables are benchmarked against plant consumption rates and unit prices are derived from current supply contracts and exchange rate assumptions. Table 17-1 outlines the key consumables used in the process plant along with the relevant throughput driver and consumption rate.
Table 17-1 Consumable consumption rates
| | | | | | | | | | | |
Consumable | UOM | Rate | |
SIBX | kg/t total mill tonnes | 0.188 | |
Flotanol 60 | kg/t total mill tonnes | 0.004 | |
Flotanol 63500 | kg/t total mill tonnes | 0.007 | |
Copper Sulfate | kg/t total mill tonnes | 0.046 | |
| kg/t CIL feed tonnes | 0.242 | |
Cyanide | kg/t total mill tonnes | 2.128 | |
MET_IM2022_009 | kg/t oxide CIL feed tonnes | 6.000 | |
Activated Carbon | kg/t CIL feed Tonnes | 0.228 | |
Antisc alent, Milsperse 830 | L/strip | 3.970 | |
Caustic Soda | L/strip | 275 | |
LPG | L/strip | 766 | |
Nitric Acid | L/strip | 91.2 | |
Quicklime | kg/t total mill tonnes | 0.222 | |
| kg/t CIL feed tonnes | 15.373 | |
| kg/t oxide CIL feed tonnes | 6.000 | |
Sodium Metabisulfite | kg/t CIL feed tonnes | 3.918 | |
Rheomax 1030 | kg/t flot con tonnes | 0.007 | |
Antisc alent, Milsperse 803P | L/t Total milled tonnes | 0.001 | |
Antisc alent, Solutrix 100 | kg/t Total mill tonnes | 0.001 | |
A long-term maintenance schedule is used to forecast relines and major rebuilds of equipment and to calculate plant operating hours. Contractor hours and maintenance consumables are calculated for each process area based on operating hours.
In addition to the long-term maintenance schedule, reliability assessments on major equipment has been used to identify sustaining capital requirements to improve reliability or reduce ongoing maintenance costs. Reviews of critical equipment such as the grinding mills, large motors, transformers etc have been progressed to develop the replacement schedules and capital cost forecast.
The key processing metrics over the Life of Mine plan are outlined in Table 17-2. Mill throughput is maintained at approximately 6.4 Mtpa up until end of 2029 when milling operations reduce due to reduced ore feed from open pit and underground operations.
| | | | | | | | |
| Released: March 27, 2026 | Page 167 of 213 |
Table 17-2 Life of Mine processing metrics
| | | | | | | | | | | | | | | | | | | | | | | | | | | | | |
| Unit | 2026 | 2027 | 2028 | 2029 | 2030 | 2031 | 2032 | |
Milled Tonnes | kt | 6,206 | 6,400 | 6,400 | 6,400 | 3,816 | 2,939 | 1,604 | |
Feed Grade | g/t Au | 0.89 | 0.65 | 0.67 | 0.58 | 0.66 | 0.91 | 0.57 | |
Gold Recovery | % | 81.63 | 74.47 | 75.72 | 71.82 | 79.62 | 82.51 | 71.25 | |
Unit Cost | NZD/t | 15.37 | 15.40 | 14.68 | 14.32 | 14.56 | 11.02 | 16.42 | |
| | | | | | | | |
| Released: March 27, 2026 | Page 168 of 213 |
18Macraes Operation Infrastructure
18.1Roads
18.1.1Site Access Roads
The site is well serviced with existing bitumen road connections to the west (Middlemarch & Ranfurly) and to the east (Palmerston, Dunedin, Christchurch).
The Macraes-Dunback Road, which is the main road into the site, was realigned in 2020 to allow access to Frasers West. This realignment consists of a bridge to cross the mine haul road and about 2.4 km of new public road pavement. In 2026, the Golden Bar road, east of Innes Mills pit will be realigned to make way for IM Stage 10 and in 2027, another realignment of the Macraes-Dunback road east of the bridge will be carried out to make way for Innes Mills Stage 12. The total length of the Golden Bar realignment and Macraes-Dunback realignment is approximately 1.1 km and 0.7 km respectively.
18.1.2Mine Haul Roads
The site already has an established haul road network to connect the pits to the waste rock stockpiles, ore stockpiles and the process plant. Some additions to this network will be required when new mining areas are developed.
Haul roads are generally constructed from materials already available on site and using the site mining equipment.
18.2Mine Services Facilities
18.2.1Electrical Power
Electricity requirements on site are serviced by the national grid. Most power comes from Ranfurly on a 66 kV line, and a secondary connection is available from Palmerston on a 33 kV line. Incoming power is transformed down to 11 kV for distribution around the site.
The incoming transmission line capacity is currently 37 MVA but is currently limited to 28 MVA due to upstream equipment limits. The Macraes site currently requires 22 MVA, most of the site demand is from the process plant and underground mine.
18.2.2Open Pit Mine
All major facilities are in place and no significant new construction is required during the current mine life. Minor support infrastructure will be required for new pits, for example lunchrooms for operators and portable fuel tanks.
Maintenance Workshops
The primary maintenance facility is located about 1.3 km south of the processing plant. This facility consists of a fully enclosed multi-bay heavy vehicle workshop, boilermaker bay, light vehicle workshop, parts and component storage, tyre maintenance and repair facility, wash-down facility, and offices.
| | | | | | | | |
| Released: March 27, 2026 | Page 169 of 213 |
Offices
Open pit management and technical services staff are located at the main administration office located on Golden Point Road.
18.2.3Underground Mine
All major facilities are in place, and no significant new construction is required during the current mine life.
Maintenance Workshops
The maintenance facility consists of an enclosed workshop with service pit, boilermaker bay, parts storage and a wash-down facility.
Concrete Batching Plant
The site includes a self-contained Simen Zingo Plus 50 m3/hr concrete batching plant. This plant is portable and is primarily used for fibrecrete batching. Aggregates are sourced from suppliers within Otago.
Offices
Management and technical services staff are located within the main underground infrastructure area.
Electricity
The underground mine requires electricity for ventilation, pumping and drilling. Electricity is supplied from the National Grid at 33kV and is stepped down for the underground feed at 11 kV which is further stepped down to 1,000 V for the underground equipment with a series of transformers located at various points within the underground workings.
Electrical supply is fed underground via the main (haulage) portal. The mine currently consumes 1.5 MW.
Ventilation
Golden Point Underground has 3 x 250 kW fans located on the surface at the ventilation return portal. Fresh air is drawn through the main portal and down the haulage decline. Currently only two of the fans are required. The third will be turned on as the primary ventilation circuit extends with further underground mine development.
Secondary ventilation is carried out using axial fans and ventilation ducts hung from the backs to achieve a minimum of 8.7 m3/s of fresh air at each working face.
18.2.4Assay Laboratory
An on-site assay laboratory is operated by SGS and is accredited to ISO standards. This facility consists of sample preparation and Photon Assay analysis. The lab runs on a 24 hr /7 day a week basis and can process a nominal 650 samples per day.
| | | | | | | | |
| Released: March 27, 2026 | Page 170 of 213 |
18.2.5Fuel Storage and Dispensing
Diesel fuel is transported to site using road tankers. Total site diesel storage capacity is about 400,000 L, which represents about six days of consumption. Substantial diesel supplies are available at Port Chalmers in Dunedin, and this is the primary buffer to supply chain disruptions.
Site dispensing is primarily through an electronic tag system for each authorised equipment item. Secondary dispensing occurs via the site fuel trucks.
18.2.6Explosives
Red Bull Powder Company Ltd have an on-site emulsion plant, with a capacity of about 10,000 tonnes of emulsion per year. Other precursor ingredients and ready-made explosives are delivered and stored on-site shown in Table 18-1.
Table 18-1 Explosives used on site
| | | | | | | | | | | |
Explosive Type | Where Used | Origin | |
Blast Initiation | OP & UG | Delivered ready-made, stored on site | |
Bulk Emulsion | OP & UG | OP manufactured on site. UG delivered ready-made and stored on site | |
Heavy ANFO | OP | Manufactured at the delivery point from AN prill and site sourced emulsion | |
Packaged (various types) | Primarily UG | Delivered ready-made, stored on site | |
| | | |
18.2.7Communications
The site has various communications connections:
•Fibre optic connections for voice and data;
•Mobile phone coverage to offices; and
•Mobile radio network that covers the entire open pit mining area and the underground mine via a leaky feeder system.
18.3Tailings Storage
18.3.1Design Criteria
All tailings embankments and impoundments at the Macraes site are designed and operated in accordance with guidance provided in the New Zealand Dam Safety Guidelines published by the New Zealand Society on Large Dams (NZSOLD) and in alignment with the Global Industry Standard on Tailings Management (GISTM) published by the International Council on Mining and Metals, United Nations Environmental Programme and Principles for Responsible Investment. Design requirements are related to the Potential Impact Classification (PIC). A dam’s classification is a function of the consequences of a hypothetical failure breach or uncontrolled release of tailings (NZSOLD, 2024). The PIC classification is as follows:
•High PIC – Dam breach causes potential for more than 10 lives to be lost, impacts residential areas, sensitive ecosystems, critical lifelines, or causes long-term environmental damage;
| | | | | | | | |
| Released: March 27, 2026 | Page 171 of 213 |
•Medium PIC – Dam breach causes potential for 1 to 10 lives lost, significant but not severe economic loss, or localised minor to moderate environment damage; and
•LOW PIC – Dam breach does not result in loss of life, and any damage is minor or localised.
For earthquake design, NZSOLD state that medium and high impact potential dams must be designed to two levels of earthquake, the Safety Evaluation Earthquake (SEE) and the Operating Basis Earthquake (OBE). Design earthquake parameters and inflow flood design parameters for all TSFs are shown in Table 18-2.
In terms of flood protection, the storage facilities are required to be designed and operated to completely contain the runoff from a 72-hour probable maximum precipitation (PMP) rainfall event with a 1.0 m freeboard. The PMP for this site is 0.761 m (EGL, 2024). Shows
Settled tailings bulk density has been observed to increase over time as the tailings consolidate, and the void space reduces. Density parameters adopted for design purposes are:
•Year 1: 1.25 dry t/m3;
•Year 2-4: 1.30 dry t/m3; and
•Year 5 onwards 1.35 dry t/m3.
18.3.2Existing Facilities
There are currently four tailings storage facilities (TSF) at Macraes. Two of the TSFs are progressing towards closure, namely the Mixed Tailings Impoundment (MTI) and the Southern Pit 11 A (SP11A) Impoundment as shown in Table 18-2.
| | | | | | | | |
| Released: March 27, 2026 | Page 172 of 213 |
Table 18-2 Macraes Tailings Storage Facilities
| | | | | | | | | | | | | | |
| MTI | SP11A | TTTSF | FTSF |
|
General Dam Type | Tailings impounded by zoned rockfill embankment | Tailings impounded by zoned rockfill (N) & lined waste rock backfill (S) | Tailings impounded by zoned rockfill embankment | Tailings impounded by zoned bulk waste rockfill |
| | | | |
Current Status | Active closure in progress | Active closure in progress | Embankment to design, ongoing backup tailings deposition | Under construction, active tailings deposition |
| | | | |
Potential Impact Classification (PIC) | High | High | High | Low (Stage 2) |
| | | | |
Design Earthquake | 1 in 10,000 | 1 in 10,000 | 1 in 10,000 | 1 in 1,000 |
| | | | |
Inflow Design Flood | 72-hour PMP | 72-hour PMP | 72-hour PMP | 72-hour PMP |
| | | | |
Construction and Active Deposition | 1991-2013 | 2002-2013 | 2012-Present | 2025-Present |
| | | | |
Dam Location and Layout | Ex-pit, initial valley-fill, extending to side-slope partial ring dam | In-pit, with downstream shoulder on deep waste rock pit backfill | Ex-pit, initial valley-fill extending to partial ring dam | In-pit with waste rock backfill beneath and on three sides |
| | | | |
Embankment Construction Type* | Down Stream to RL 515 | Down Stream to RL 530 | Down Stream to RL 560 | Down Stream bulk waste rockfill |
| Combination of Up Stream and Down Stream to 548 | Up Stream to RL 544 | Modified Centreline to 570 | |
| | | | |
Embankment | Complete | Complete | Complete | In Construction |
Crest Elevation (m) | RL 548 | RL 544 | RL 570 | RL 480 (Permitted) |
| | | | RL510 (Application in progress) |
Crest Width (m) | W = 6 m | W = 6 m | W = 4 m | W = 100 m |
Impounded Vol (m³) | V = 53M m³ | V = 20M m³ | V = 50M m³ | V = 26 Mm³ (Permitted) |
Max Tails Depth (m) | D = 140 m | D = 84 m | D = 70 m | D = 125 m |
| | | | |
| | | | | | | | |
| Released: March 27, 2026 | Page 173 of 213 |
Figure 18-1 Existing and proposed tailings storage facilities
| | | | | | | | |
| Released: March 27, 2026 | Page 174 of 213 |
The currently active facilities are the Top Tipperary TSF (TTTSF), which has been the primary point of discharge since 2012 and the Frasers TSF (FTSF) which was commissioned in Q1 2025. The currently consented crest height of the TTTSF is 570 m RL and FTSF is 480 m RL.
The FTSF crest height was approximately 371 m RL at the end of 2025, and the company is in the process of consenting an extension to 510 m RL. The extended FTSF is to have sufficient storage volume to support processing operations to beyond Life of Mine, up to approximately 2036.
Figure 18-1 shows existing tailings storage facilities.
Table 18-3 Future tailings storage options
| | | | | | | | | | | | | | |
Name | Crest Level (mRL) | Approximate Volume Capacity (Mm3) | Approximate Tonnage Capacity (Mt) | Comment |
Frasers Tailings Storage Facility – Stage 3 | 510 | 62 | 83 | Final FTSF raise with storage based upon tailings filling to 510 mRL. Design and resource consent application in progress. |
The FTSF is being consented as a staged development. Stage 1 and 2 resource consents and building consents were granted in 2024 and 2025 respectively. Application for Stage 3 resource consent will be submitted in Q3 2026.
18.3.3Tailings Deposition Plan
The deposition plan for this schedule is two-fold:
•Complete deposition of tails into TTTSF to design capacity till ready for capping and closure; and
•dispose tailings into FTSF until the end of the mine life.
The planned deposition quantities are shown in Table 18-4.
Table 18-4 Tailings deposition plan
| | | | | | | | | | | | | | |
Year | Source | Destination | Destination | |
Milled Tails (Mt) | Frasers TSF (Mt) | TTTSF (Mt) | |
2026 | 6.4 | 5.1 | 1.3 | |
2027 | 6.4 | 6.4 | | |
2028 | 6.4 | 6.4 | | |
2029 | 6.4 | 6.4 | | |
2030 | 3.7 | 3.7 | | |
2031 | 2.9 | 2.9 | | |
2032 | 1.6 | 1.6 | | |
Total | 33.8 | 32.5 | 1.3 | |
Construction of the FTSF Stage 3 is planned to commence in 2027 to cater for future potential extension to the current mine life.
| | | | | | | | |
| Released: March 27, 2026 | Page 175 of 213 |
18.4Water
18.4.1Surface Water Management
Water used for mining purposes is predominantly dust suppression water for the site haul roads. This water is typically sourced from pit and waste rock stack runoff water that is collected in sumps and pumped to storage ponds.
Stormwater runoff water is diverted away from the active mining areas where possible. All water that cannot be diverted is collected and used for dust suppression as a priority. Excess water is pumped into the overall site water system.
Where there is excess stormwater collected on site, this is disposed of in two ways:
•evaporated with surface sprinklers during summer months; or
•discharged into local waterways during periods of high flow in order to dilute any elevated sulfate or nitrate levels in accordance with consent conditions.
18.4.2Underground Water Management
Water used underground for mining activities flows under gravity back to sumps or is pumped to sumps using portable submersible electric pumps. From the sumps water is pumped by submersible electric pumps to high head helical rotor pumps, which in turn send water to the Round Hill Pit sump for re-use underground.
18.4.3Process Plant Water Management
Water required for processing purposes is primarily sourced from the decant pond at the tailings storage facility. Additional make-up water is required to allow for water contained within the tailings and that lost in evaporation. Most make-up water is sourced from the Taieri River and this is stored in the Lone Pine reservoir. A combination of Lone Pine reservoir, various seepage collection points around site and mined-out pits, is sufficient to last during a summer drought period.
| | | | | | | | |
| Released: March 27, 2026 | Page 176 of 213 |
19Market Studies and Contracts
19.1General
The mine has been operational continuously for the last 35 years and has current contracts in place for doré refining and other goods and services required to operate an underground mine and open pit mine.
Contracts are in place covering the provision of goods and services to support open pit and underground mining, transportation and refining of doré, and the purchase and delivery of fuel, electricity supply, water supply, explosives and other commodities. These agreements conform to industry norms.
19.2Doré Production and Sales
A contract to refine the produced doré is with Perth Mint. This contract sets prices for transporting and refining the doré under conditions which comply with industry norms.
OceanaGold has agreements at typical industry benchmark terms for metal payables and refining charges for doré produced from the Macraes Operation. Gold and silver bearing doré are shipped to an Australian refinery for further processing under a toll refining agreement.
19.3Hedging and Forward Sames Contracts
OceanaGold has periodically entered short and long-term hedges, both on a company wide basis and directly for Macraes. Currently there are no hedging contracts in place for gold sales.
19.4Contracts and Status
19.4.1Open Pit Mining
Open pit and underground mining at Macraes are carried out by OceanaGold personnel using mining equipment leased or owned by OceanaGold. Leasing facilities are supplied by Caterpillar Financial. Mining equipment is maintained by OceanaGold and is supported by several OEMs or dealers:
•Terra Cat;
•Sandvik; and
•Cable Price Hitachi.
Tyres for rubber-tyred mobile mining equipment are sourced directly from local suppliers Tyreline Distributors Ltd (Michelin brand) and Bridgestone Firestone New Zealand Limited with a minimum number of branded tyres secured by a long-term supply agreement.
All the mining contracts in place and under negotiation are structured, and include terms and conditions and pricing arrangements, which comply or are expected to comply with industry norms.
| | | | | | | | |
| Released: March 27, 2026 | Page 177 of 213 |
19.4.2Explosives
The supply of Ammonium Nitrate is provided by Orica Mining Service and mixing of explosives for mining is provided by Redbull Powder Company Limited under a contract through to 31 December 2027. Orica Mining Services contract of supply of explosives to underground expires 31 December 2027.
19.4.3Diesel
Diesel is supplied by BP under a long-term contract. BP has been the supplier to the operation since 2012. The current contract expires 30 November 2027. OceanaGold has a 12-month diesel hedge in place for 80% of diesel volume.
19.4.4Power Supply
Electricity is supplied by Genesis Energy Limited. The current contract expires 31 December 2028.
19.4.5Water Supply
Water supply is provided via a water permit granted by the Otago Regional Council.
19.5Bonds
Rehabilitation bonds are provided through the Oceana Gold Corporate Banking facilities. All bond values are approved by the relevant authority.
19.6Comments on Market Studies and Contracts
In the opinion of the Qualified Persons:
•OceanaGold can market the doré products produced from the Macraes Operation; and
•The terms contained within the sales contracts are typical and consistent with standard industry practice and are like contracts for the supply of doré elsewhere in the world.
| | | | | | | | |
| Released: March 27, 2026 | Page 178 of 213 |
20Environmental Studies, Permitting, Social or Community Impact
20.1General
Macraes currently has 400 consents, permits, or Authorities which are operational or partially operational dating back to 1996. Table 20-1 summarizes the type of permits and the relevant issuing authority.
Table 20-1 Operational permits at Macraes Operation
| | | | | | | | | | | |
Type of Authority/Permit | Quantity | Issuing Authority | |
Land use Consents | 22 | Waitaki District Council | |
35 | Otago Regional Council | |
1 | Dunedin City Council | |
Water Permits | 83 | Otago Regional Council | |
Discharge Permits | 91 | Otago Regional Council | |
Building Consents | 161 | Waitaki District Council/ECAN | |
Heritage Authorities | 1 | Heritage New Zealand | |
Wildlife Authorities | 3 | Department of Conservation | |
Permits are managed in the corporate database, InForm, which includes tracking of obligations associated with issued permits and expiry dates. Where activities have not been completed within the life of the permit, renewals are sought from the relevant Authority.
20.2Required Permits and Status
To achieve the current Life of Mine, the Fast Track application for Macraes Phase 4 comprising a mixture of new or replacement of consents/permits is required. Table 20-2 provides a summary of these permits and the current status.
Table 20-2 Required permits and status
| | | | | | | | | | | |
Project Description | Types of permits | Status | |
Macraes Phase 4 (Fast Track) | Land use Consent | Application in preparation for submission in Q3 2026 | |
Discharge Permits | |
Water Permits | |
Building Consents | |
Wildlife Authorities | |
The key risks and opportunities identified with future permitting at Macraes pertains to the evolving and continually changing expectations of the New Zealand Government, regional and local councils and expectations of iwi and the wider community.
| | | | | | | | |
| Released: March 27, 2026 | Page 179 of 213 |
20.3Environmental Study Results
On-going permitting dictates the need for environmental studies to be required. The nature and scale of activities requiring permitting determines the complexity of studies needed to fulfil the requirements of Assessment of Environmental Effects (AEEs) for resource consenting purposes.
Many consent applications require the submission of independent environmental assessments or studies to support the application in the following fields:
•Surface Water;
•Groundwater;
•Terrestrial Ecology;
•Aquatic Ecology;
•Erosion and Sediment Control;
•Geotechnical Stability;
•Noise and vibrations assessment;
•Air Quality assessment;
•Economic Effects;
•Traffic Effects;
•Heritage & Archaeology;
•Social Impacts; and
•Cultural values and impacts.
Smaller scale activities will require one or more of the studies outlined above depending on the location and complexity of the activity. Typically, these studies are not as comprehensive as those required for large-scale consent applications.
In all cases specialists are engaged to undertake the environmental studies. In cases where there is the potential to be challenged on issues, a third-party specialist is used to add further rigour to the studies outcome.
The preparation of the Macraes Phase 4 Fast Track application involves the preparation of a number of these technical reports/studies to be completed and submitted with the application.
20.4Environmental and Social Issues
There are two material issues related to environmental and social management currently experienced by the Macraes Operation:
•Land use; and
•Long term water quality.
These are both outlined in more detail below.
20.4.1Land Use
With evolving expectations around the management of effects to biodiversity, OceanaGold has established over 600 ha of covenants (i.e. parcels of land protected in perpetuity) for the purposes of conservation since 2012. Although these covenants are viewed as having a positive impact on protecting and enhancing biodiversity, the local farming community do not share this view and in 2017 chose to appeal the Coronation North consent, in part due to the establishment of covenants that would prevent some land being returned for farming use at the end of the mine life. Although
| | | | | | | | |
| Released: March 27, 2026 | Page 180 of 213 |
the appeal was negotiated through mediation there remains an underlying tension between farming and conservation; a tension that exists more widely across New Zealand and is not specific to the Macraes Operation.
In 2018/2019 the University of Otago conducted a stakeholder study which sought the views of the farmers, the Councils, Department of Conservation and the OceanaGold and endeavoured to draw out the fundamental values associated with land use held by each stakeholder. The study found that there are basically three views on land use (land as economic, land as biodiverse and hence protected, land as multifaceted), and although stakeholder groups aligned with values as expected, there was also a fluidity for individual stakeholders crossing into values that they were not traditionally aligned to. These findings remain in the community today.
There are ongoing central and regional Government reforms relevant to land use across New Zealand. Proposed for 2026, these reforms include changes to the RMA and will also result in an overhaul of several National Standards and Policies. These changes impact the National Policy Statements for Indigenous Biodiversity, Highly Productive Land and Freshwater Management; each of them impacting land use. The recent introduction of the fast-track consenting regime through the Fast Track Approvals Act 2024 outlined in section 4.7.1, means OceanaGold will continue to work with landholders and local iwi to minimise the potential for negative impacts on the business.
20.4.2Long Term Water Quality
In 2020, the New Zealand Government brought in the National Policy Statement for Freshwater Management (NPS-FW). The requirements of the National Policy Statement for Freshwater are:
•Manage water in a way that gives effect to Te Mana o te Wai (the Maori term for the health and well-being of water resources);
•Improve degraded water bodies;
•Avoid any further loss or degradation of wetlands and streams; and
•Identify and work toward outcomes for fish abundance, diversity and passage.
For the Macraes Operation, the avoidance of further loss or degradation of wetlands and streams is challenging when planning, consenting and preparing for open pit mine expansions.
In December 2025, changes were made to the Resource Management Act (RMA) which comes into effect from 15 January 2026. These changes allow for more consistent and enabling regulation in the management of quarrying and mining activities. Previously the NPS-FW was highly restrictive on quarrying and mining activities. The 2025 update has added an ‘operational need’ to the ‘functional need’ in the consent pathways making it easier for mining projects such as Macraes Phase 4 to meet the gateway tests. The gateway tests themselves have also been amended to allow broader consideration of benefits (including private and regional benefits) and maintain the effects management hierarchy (avoid, remedy, mitigate, offset and compensate).
Changes in environmental standards and expectations of water quality throughout New Zealand, notwithstanding current Government proposals to revisit aspects of previously signalled reforms in this area, are expected to result in a future lowering of contaminant limits in waterways. These limits are irrespective of whether the activity giving rise to the discharge was already consented at a higher level.
To ensure that OceanaGold and the Macraes Operation remain ahead of these potential changes, and to lower the potential for non-compliance as a result of them, trials of passive water treatment
| | | | | | | | |
| Released: March 27, 2026 | Page 181 of 213 |
systems are being undertaken and incorporated into the design of water management for the Macraes Phase 4 Fast Track Application.
20.5Stakeholder and Iwi Engagement
Stakeholder and iwi (indigenous peoples) engagement is an integral part of, and often considered good practice for, operating a business in New Zealand, particularly for businesses who require resource consents and permits to operate. The RMA does not require engagement be conducted prior to the lodging of resource consent applications, but it does require the Councils to engage with parties affected by the application.
At Macraes, iwi and stakeholder engagement is undertaken as part of general operations and, where possible, pro-actively for consenting / permitting purposes i.e. prior to lodging of resource consent applications, in order to ensure that affected parties can voice their concerns and there is sufficient time to integrate these concerns into the Project Design.
Key Stakeholders for Macraes Operation are:
•The local Macraes Village community including surrounding farming families;
•The local and regional councils;
•Iwi with a special relationship to the area and their representative agents;
•Department of Conservation;
•Heritage New Zealand; and
•Fish and Game, a community-based organization responsible for managing fishing and hunting resources.
Aside from resource consent-based engagement, OceanaGold also endeavours to collaborate with stakeholders on areas where mutual benefits can be derived. Examples of such engagement include:
•Research on water, ecology and social science undertaken by University of Otago;
•Restoration of heritage sites in partnership with Middlemarch Historical Society and Heritage New Zealand;
•Foundational Sponsorship of the Waitaki Whitestone Geopark, with the Waitaki Whitestone Geopark Trust; and
•Partnership with the Macraes Community Incorporated on maintenance of the Macraes Village assets.
20.6Operating and Post Closure Requirements and Plans
Resource consents dictate operational requirements which are then translated to management plans. Currently at Macraes, operational management plans include the following items:
•Dust Management Plan;
•Noise, Vibration and Air Blast Management Plans;
•Operations, Maintenance and Surveillance Management Plans for Tailings Storage Facilities;
•Emergency Action Plans for Tailings Storage Facilities;
•Dam Safety Assurance Plan for the Top Tipperary Tailings Storage Facility;
•Closure Plan for the Top Tipperary Tailings Storage Facility;
| | | | | | | | |
| Released: March 27, 2026 | Page 182 of 213 |
•Waste Rock Stack Operations, Maintenance and Surveillance Plans;
•Erosion and Sediment Control Plans;
•Heritage Management Plan;
•Ecology Management Plans;
•Weed and Pest Control Management Plans; and
•Water Quality Management Plan.
These management plans are reviewed annually and updated on issue of new resource consents.
Post Closure requirements are detailed in resource consents and covered in the Assurance Bond (see section 22.2). A Contingency Closure Plan covers actions to be undertaken in the event of unplanned or forced closure.
20.7Rehabilitation Measures during Operations
Rehabilitation activities are conducted concurrently with operations. To date (31 Dec 2025) approximately 775 ha of land has been rehabilitated to its final land use, which in most cases is land for pastoral purposes, while the remaining area requiring rehabilitation is 1052.8 ha.
20.8Mine Closure
A contingency closure plan has been developed which includes detailed calculations formulated for the purposes of the Assurance Bond (a consent requirement that includes risks associated with Closure) and the Rehabilitation Provision (see section 20.11). Closure concerns have been identified by the local community and, while a closure plan for Macraes Operation has been developed, it now requires updates for the Macraes Phase 4 consenting application, which will then enable it to be discussed with local Iwi and the local community.
The contingency plan indicates that for closure, open pits will be allowed to fill naturally with water, waste rock stacks will be rehabilitated to pasture for future grazing, consistent with the surrounding landscape.
20.9Post-Performance or Reclamations Bonds
A contingency closure plan has been developed which sets out the assumptions to be used in detailed calculations for the purposes of the Assurance Bond (a consent requirement that includes risks associated with Closure) and the Rehabilitation Provision (see section 20.11).
The Assurance Bond for Macraes is based on a calculation which includes the following:
•Reclamation works to make good the site and comply with resource consent conditions. Reclamation works include all works outstanding for the next 12-month period;
•Environmental monitoring to be conducted during the period of reclamation works and for a period of 20 years after the cessation of works; and
•Closure risks which have been identified through a collaborative process and are based on current uncertainties or gaps in knowledge, including poor long-term water quality and geotechnical instability.
Assurance Bonds are held as bank guarantee for the quantum of the bond. Councils can draw on the bond facility at any time should it be deemed necessary. The bond quantum is divided between
| | | | | | | | |
| Released: March 27, 2026 | Page 183 of 213 |
the three Councils with the territorial Councils (Waitaki District and Dunedin City) having responsibility for most of the reclamation works, whilst Otago Regional Council is responsible for the environmental monitoring and long-term management of effects on water.
The council approved Assurance Bond for the Macraes site in 2025/2026 is NZD85.63 million.
20.10Closure Monitoring
A closure monitoring calculation has been developed as part of the Assurance Bond/Rehabilitation Provision. The calculation includes identifying resources and supervision needed for undertaking monitoring of surface water, groundwater, aquatic biota, dust, vegetation/rehab, geotechnical stability, tailing storage surveillance monitoring and review, and administration and miscellaneous costs. Cost estimates are updated annually and consider changes in consent conditions.
20.11Reclamation and Closure Cost Estimate
The Rehabilitation Provision is updated annually for internal purposes to determine the financial liability associated with operations and closure. The Rehabilitation Provision differs from the Bond in that it estimates costs based on the Life of Mine of the operation, whereas the Bond assumes unplanned closure within the next 12 months.
The Rehabilitation Provision is currently NZD83.0 million, including a 10% contingency.
| | | | | | | | |
| Released: March 27, 2026 | Page 184 of 213 |
21Capital and Operating Costs
21.1Introduction
The capital and operating costs have been estimated to deliver the LoM plan. This section of the report details the basis of the capital and operating cost estimates. All estimates are based on annual inputs of physicals and all currency is in NZ dollars (NZD) unless otherwise stated.
21.2Capital Expenditure Estimates
21.2.1Basis of Estimate
The range of accuracy for the capital cost estimate is +/- 15%.
Capital expenditures are required for open pit, underground, and processing activities to achieve the LoM plan. Sustaining capital expenditures included in this report relate primarily to open pit pre‑stripping, capitalised underground decline development, and new or refurbished mobile equipment required to maintain ongoing operations.
Non‑sustaining expenditures, including closure and rehabilitation costs and long‑term monitoring, are estimated separately and are included in the economic analysis but are not classified as sustaining capital.
Capital cost estimates are based on a combination of equipment supplier quotations and historical costs for similar activities at the Macraes Operation. The costs associated with site rehabilitation, long‑term monitoring, and the sale of excess landholdings are included in the estimates where applicable.
21.2.2Labour Assumptions
Construction labour costs have been included to account for installation costs.
21.2.3Material Costs
All materials required for facilities construction are included in the capital cost estimate. Material costs include freight to the site.
All earthworks quantities were assumed to be in situ volumes, with allowance for swell, waste or compaction of materials. Industry-standard allowances for swell and compaction were incorporated into the unit rates.
21.2.4Mine Capital Expenditures – Underground
This item accounts for the capital costs associated with underground mine development, mining equipment fleet leases and supporting infrastructure and services.
The underground mine development costs were estimated based on development quantities obtained from the reserves-only mine design and schedule. Unit costs were estimated by OceanaGold based on prior underground mining experience.
| | | | | | | | |
| Released: March 27, 2026 | Page 185 of 213 |
Resource drilling for Measured and Indicated definition and infill drilling has been included. Costs for conversion of Inferred Resources, not included in Mineral Reserve, have not been included in the analysis.
21.2.5Mine Capital Expenditures – Open Pit
This item accounts for the capital expenditure associated with the surface mine development, pre-stripping, mining equipment fleet, haul roads and supporting infrastructure and services. The capital expenditure for surface mining is shown in Table 21-1.
The site preparation and haul roads costs were mainly based on earthworks quantities estimated from the general site layout and unit costs sourced from OceanaGold’s internal database.
The open pit pre-stripping costs were estimated based on the pre-strip quantities obtained from the mine design and schedule, and costs estimated by OceanaGold based on prior surface mining experience.
21.2.6Infrastructure Expenditures
Infrastructure areas include:
•TSF embankment and water management system;
•Waste rock stacks;
•Internal access roads;
•On-site general facilities; and
•External access road.
21.2.7Capital Expenditure Summary
Capital expenditures include the direct costs for project execution, as well as the indirect costs associated with design, construction and commissioning
Indirect project capital expenditures include third-party consultants, construction facilities and services, and vendor support. Percentage factors based on OceanaGold’s experience with similar projects were used to determine indirect project costs, based on the project direct cost.
The capital expenditure is outlined in Table 21-1 and shown by year in Figure 21-1.
No contingency was applied to the underground decline development, pre-strip, mobile equipment leases and site surface and underground infrastructure costs due to demonstrated reliability of estimation methods over the past 35 years.
Other capital cost items include 20-30% contingency.
| | | | | | | | |
| Released: March 27, 2026 | Page 186 of 213 |
Table 21-1 LoM sustaining capital expenditures
| | | | | | | | | | | | | | | | | | | | |
Capital Expenditure | LoM Plan Total (NZD M) | LoM Plan Total (USD M) |
| Open Pit | Underground | Total | Open Pit | Underground | Total |
Pre-strip | 420.6 | | 420.6 | 243.9 | | 243.9 |
Tailings | 3.1 | | 3.1 | 1.8 | | 1.8 |
Underground decline development | | 53.9 | 53.9 | | 31.2 | 31.2 |
Processing facilities | 20.2 | | 20.2 | 11.7 | | 11.7 |
Exploration capital | 3.9 | | 3.9 | 2.3 | | 2.3 |
General capital | 108.5 | 11.6 | 120.1 | 62.9 | 6.7 | 69.7 |
Asset sales | (63.8) | | (63.8) | (37.0) | | (37.0) |
Total capital expenditure | 492.5 | 65.5 | 557.9 | 285.6 | 38.0 | 323.6 |
Lease payments & interest | 78.9 | 40.6 | 119.6 | 45.8 | 23.6 | 69.4 |
•Exchange rate – USD:NZD is 0.58
•Tailings, processing facilities, exploration capital, and a portion of general capital are presented under the open pit column for simplicity of presentation. In practice, these expenditures support and are shared across the Macraes site, including both open pit and underground operations.
Figure 21-1 LoM annual sustaining capital costs
21.3Operating Cost Estimates
21.3.1Basis of Estimate
The operating cost estimate is based on the historical operating costs and continuation of the current operating practices and procedures. It has an expected accuracy range of ±15%, attributed to the site operating history over a range of conditions and is expressed in 2026 NZD.
| | | | | | | | |
| Released: March 27, 2026 | Page 187 of 213 |
Separate cost models were developed for open pit and underground mining and processing, based on unit costs from historical performance and first principles using physical inputs as drivers and demonstrated unit rates sourced from site and suppliers.
The cost structure is split into fixed and variable components, which form the basis for the operating cost estimate.
The estimate includes underground mining, open pit mining, processing and G&A costs. It excludes inflation beyond 2026, currency fluctuations, interest charges and taxes. No contingency has been included in the operating costs.
21.3.2Mining Operating Costs
Open pit operating costs include drill and blast, load, haul, ancillary and mine overheads. Underground mining operating costs include lateral and vertical ore and waste development, stoping costs, backfilling costs and mine overheads.
The mining operating cost estimate accounts for the operating and maintenance costs associated with the open pit and underground mining operations and supporting services infrastructure.
Mining operating costs were estimated using the following cost categories: power, labour, fuel, explosives, ground support, tyres, other consumables, maintenance supplies and services.
Mining operating costs are activity driven and are modelled in RPM Global’s XERAS software (Xeras). Mine scheduling output is used in Xeras to derive mining operations costs based on labour, fuel, power, explosives, maintenance, ground support and other consumables unit rates.
21.3.3Processing Operating Costs
Operating costs associated with the process plant include crushing, SAG and ball mill crushing and grinding, flotation, CIL, autoclave, gold room, operating and maintenance, water treatment and tailings disposal.
The processing operating cost estimate accounts for the operating and maintenance costs associated with the 6.4 Mtpa process plant operation, water treatment, supporting services infrastructure, and tailings disposal to the various TSFs.
Process plant operating costs were estimated using the following cost categories: power, labour, reagents and consumables, maintenance supplies and services. In general, the process operating cost estimate is based on the following: mass balance, mechanical equipment list, list of reagents and consumables, long term maintenance shutdown plan and a staffing plan.
Power consumption was estimated based on the power requirements by the major and secondary processing plant equipment (excluding stand-by equipment) and adjusted using benchmark factors to account for auxiliary and minor equipment power demand. Assumptions included:
•94% annual availability; and
•A unit power cost of NZD 0.17 /kWh.
Reagent consumption and crushing and grinding consumables were estimated based on the results of metallurgical testwork and previous experience at the Macraes plant.
| | | | | | | | |
| Released: March 27, 2026 | Page 188 of 213 |
General consumables for the process plant (personnel protective equipment, metallurgical laboratory, chemical laboratories, maintenance, office supplies and others) were estimated from the total consumable and reagent costs.
Labour costs were estimated based on the ongoing staffing plan for the operation and maintenance of the process plant based on OceanaGold’s experience at the site. The estimate accounts for management personnel, plant operators and supervisors, as well as maintenance personnel.
Services costs include the following areas: chemical assays, maintenance services by contractors, personnel mobilisation, as well as water and compressed air supply and distribution and other general services.
Assay costs were estimated based on previous operating experience with knowledge of required sample points and frequency for process monitoring, metallurgical accounting and expected future ores programs. This was used to generate sample volumes and contracted rates.
Maintenance services costs associated with the replacement of mill liners and grinding media were estimated based on previous experience at the process plant and a long-term outage plan covering the reline/overhaul schedule over the LoM. Costs associated with personnel mobilisation, scheduled maintenance for plant shutdowns (carried out by contractors) and other general services are included based on scheduled hours and contractor rates.
21.3.4General and Administrative Operating Costs
The G&A operating cost was estimated, based on previous costs at the Macraes Operation and include general on-site infrastructure operating costs.
21.3.5Operating Cost Summary
Table 21-2 summarizes the estimated operating costs per tonne of ore processed and the operating costs by year are shown in Figure 21-2.
Table 21-2 Operating cost summary
| | | | | | | | | | | | | | | | | |
Operating Expenditure | NZD | USD | |
LoM Total $M | $/t | LoM Total $M | $/t | |
Open Pit Mining | 502.3 | 2.96 | 291.3 | 1.72 | |
GPUG Underground Mining | 212 .0 | 81.38 | 123.0 | 47.20 | |
Processing Costs | 493.8 | 14.62 | 286.4 | 8.48 | |
General and Administration Costs | 284.1 | 8.41 | 164.8 | 4.88 | |
Total Direct Costs | 1,492.2 | - | 865.5 | - | |
•Exchange rate – USD:NZD is 0.58
| | | | | | | | |
| Released: March 27, 2026 | Page 189 of 213 |
Figure 21-2 LoM direct operating costs
| | | | | | | | |
| Released: March 27, 2026 | Page 190 of 213 |
22Economic Analysis
All costs, prices, and financial indices in Section 22 are presented in United States Dollars unless otherwise noted. The economic analysis has been undertaken in real terms, expressed in constant 2026 dollars, with no allowance for inflation or escalation beyond 2026.
22.1Principal Assumptions and Input Parameters
The economic results summarized in this section are based upon work performed by OceanaGold in 2025 and 2026. The assumptions applied are consistent with those used by OceanaGold for internal evaluation purposes and are considered appropriate for the level of study.
All costs incurred prior to 1 January 2026 are considered sunk for the purposes of this analysis. The financial model commences on 1 January 2026 and reflects a mine life of seven years, ending in the first quarter of 2032. Closure and post-mining activities continue from 2032 through to 2044, including closure and rehabilitation activities.
A discount rate of 5%, based on industry benchmark has been applied. As the analysis reflects the continuation of an operating asset with historical capital treated as sunk, an Internal Rate of Return (IRR) has not been presented.
Two pricing scenarios have been evaluated: an OceanaGold Reserves Case and an Alternative Price Case. The Alternative Price Case reflects commodity prices closer to current market conditions and is summarized in Table 22-1. Silver is produced as a minor by-product of gold production; however, historical production has been immaterial and has therefore been excluded from the economic analysis.
A USD:NZD exchange rate of 0.58 has been applied and held constant over the LoM Plan, consistent with the use of real‑terms modelling. Operating and capital cost assumptions reflect current estimates for labour, electricity, diesel, consumables, and other key inputs, based on recent operating experience, forecast production schedules, and supporting engineering cost estimates for the Macraes Operation.
Table 22-1 Financial Parameters
| | | | | | | | |
Description | Reserves Case | Alternative Price Case |
Gold ($/oz) | 2,200 | 4,000 |
Exchange Rate (USD:NZD) | 0.58 | 0.58 |
Discount Rate | 5% | 5% |
Tax Rate | 28% | 28% |
22.2Taxes, Royalties and Other Interests
22.2.1Taxation
The corporate income tax rate applied in the economic analysis is 28%, consistent with New Zealand taxation legislation. Income tax has been applied on a project basis and treated as a cash expense in the year incurred for the purposes of the economic analysis. Timing differences associated with tax payments have not been modelled. Any tax losses generated are assumed not
| | | | | | | | |
| Released: March 27, 2026 | Page 191 of 213 |
to be recoverable or carried back and are therefore forfeited, consistent with the absence of a tax loss carry‑back mechanism in New Zealand.
22.2.2Royalties
The Macraes Operation is subject to New Zealand Crown royalties payable to the New Zealand Government in accordance with the Crown Minerals royalty regulations. The Crown royalty has been modelled as the higher of 1% of net gold sales revenue or 5% of accounting profits, as defined under the applicable Crown Minerals provisions.
A separate local royalty agreement applies to limited areas outside the Reserve Case LoM plan evaluated in this NI 43‑101 technical report. As no mining is planned within these areas under the Reserve Case, no additional local royalties have been included in the economic analysis.
Under the Reserve Case economic assumptions, the accounting profits royalty is not triggered, and the Crown royalty is effectively calculated on an ad valorem basis at 1% of net sales revenue. Under higher gold price scenarios, including the Alternative Case, the accounting profits royalty may apply in certain years where accounting profits exceed the ad valorem royalty.
22.2.3Financing Costs
Financing costs, including principal and interest associated with finance leases, have been included in the economic analysis. Finance lease principal and interest payments have been treated as capital‑equivalent expenditures to ensure consistent economic treatment between leased and purchased equipment and to maintain neutrality with respect to equipment acquisition methods.
22.3Pricing Model Results Reserve Case
At Reserve prices of $2,200 /oz gold price, Macraes delivers post-tax financial metrics of:
•($24.8) million undiscounted cashflow;
•($19.0) million NPV;
•$1,520 /oz Cash Costs (C1); and
•$2,155 /oz AISC.
| | | | | | | | |
| Released: March 27, 2026 | Page 192 of 213 |
Annualised financial performance is summarized in Figure 22-1 and Table 22-2.
Figure 22-1 Macraes Reserve Case Project Metrics
| | | | | | | | |
| Released: March 27, 2026 | Page 193 of 213 |
| | | | | |
NI 43-101 Technical Report – Macraes Operation, Otago, New Zealand | |
| |
| |
Table 22-2 Financial Performance Summary (Reserve Case)
| | | | | | | | | | | | | | | | | | | | | | | | | | | | | | | | |
| Unit | Total | 2026 | 2027 | 2028 | 2029 | 2030 | 2031 | 2032 | 2033 |
Market Prices | | | | | | | | | | |
Gold | $/oz | 2,200 | 2,200 | 2,200 | 2,200 | 2,200 | 2,200 | 2,200 | 2,200 | 2,200 |
Produced Metal | | | | | | | | | | |
Payable Gold | koz | 598 | 145 | 100 | 105 | 85 | 65 | 77 | 21 | - |
Revenue | | | | | | | | | | |
Gross Gold Revenue | $k | 1,315,160 | 319,000 | 220,023 | 230,813 | 187,187 | 142,272 | 169,906 | 45,960 | - |
Total Gross Revenue | $k | 1,315,160 | 319,000 | 220,023 | 230,813 | 187,187 | 142,272 | 169,906 | 45,960 | - |
Operating Costs | | | | | | | | | | |
Mining | $k | 414,275 | 68,034 | 79,467 | 92,969 | 47,676 | 38,304 | 78,421 | 9,404 | - |
Processing | $k | 286,404 | 55,316 | 57,151 | 54,504 | 53,149 | 32,231 | 18,780 | 15,272 | - |
General & Administration | $k | 164,776 | 30,786 | 29,352 | 30,173 | 26,706 | 23,769 | 16,645 | 7,347 | - |
Direct Operating Costs | | 865,454 | 154,135 | 165,971 | 177,646 | 127,530 | 94,304 | 113,846 | 32,023 | - |
Selling Costs | $k | 3,350 | 851 | 559 | 578 | 469 | 354 | 424 | 114 | - |
Royalties | $k | 13,152 | 3,190 | 2,200 | 2,308 | 1,872 | 1,423 | 1,699 | 460 | - |
Inventory (Cash) | $k | 34,013 | 2,425 | 5,668 | 5,216 | 7,694 | 2,481 | 4,418 | 6,111 | - |
Operating Cash Flow (Pre-Tax) | $k | 399,191 | 158,399 | 45,625 | 45,064 | 49,622 | 43,711 | 49,519 | 7,251 | |
Income Tax | $k | 12,254 | 12,254 | - | - | - | - | - | - | - |
Working Capital | $k | (34,431) | (2,494) | (5,737) | (5,286) | (7,763) | (2,550) | (4,488) | (6,111) | - |
Capital Expenditure (Sustaining) | $k | 323,593 | 107,391 | 63,700 | 43,249 | 72,861 | 62,331 | 496 | (11,368) | (7,823) |
Closure and Rehabilitation Costs | $k | 53,262 | 1,929 | 1,855 | 1,958 | 3,399 | 1,455 | 1,633 | 12,816 | 10,266 |
Lease Payments & Interest | $k | 69,361 | 8,811 | 10,203 | 11,118 | 11,491 | 12,170 | 15,568 | | |
After-Tax Net Cash Flow | $k | (24,848) | 30,508 | (24,395) | (5,975) | (30,365) | (29,694) | 36,310 | 11,915 | (2,443) |
After-Tax NPV @ 5% | $k | (18,995) | 29,772 | (22,673) | (5,289) | (25,599) | (23,841) | 27,764 | 8,677 | (1,694) |
LoM AISC Metric | $ /oz Au | 2,155 | 1,889 | 2,446 | 2,253 | 2,559 | 2,641 | 1,716 | 1,309 | - |
•Closure and Rehabilitation Costs extend beyond 2033 and has been included in the Total.
| | | | | | | | |
| Released: March 27,2026 | Page 194 of 214 |
•Variances between 2026 Full-Year Guidance and the NI 43-101 Technical Report case reflect differences in metal price assumptions impacting royalty costs.
| | | | | | | | |
| Released: March 27, 2026 | Page 195 of 213 |
| | | | | |
NI 43-101 Technical Report – Macraes Operation, Otago, New Zealand | |
| |
| |
22.4Sensitivity Analysis
22.4.1Operational Sensitivity
After-tax sensitivity analyses for key operational parameters are presented in Figure 22-2. The Project is most sensitive to gold price assumptions, with sensitivities to capital and operating costs broadly similar, although the Project shows slightly greater sensitivity to operating cost variations. Operating cost sensitivities have been applied to direct operating costs only (Mining, Processing, and G&A costs). Capital cost sensitivities include pre-strip and decline development, noting that these costs originate from activities otherwise classified as operating costs. Capital costs also include finance lease principal and interest payments.
All sensitivity analyses are presented on an after-tax basis. For modelling purposes, taxation impacts associated with changes in revenue, operating costs and capital expenditures have been applied in the same financial year as the underlying cash flow. In practice, certain tax deductions, particularly those associated with capital expenditures, would be recognised over the applicable depreciation or amortisation periods, resulting in timing differences in tax payments. This simplification does not materially affect the relative sensitivity outcomes but may result in minor differences in the timing of after-tax cash flows compared to a detailed tax depreciation model.
Figure 22-2 Reserve Case Sensitivity Analysis
22.4.2Gold Price Sensitivity
Additional gold price sensitivity analyses have been completed showing after-tax Project NPV (5%) at the Reserve Case gold price of $2,200 /oz. Sensitivities of ±25% relative to the Reserve Case gold price have been modelled to illustrate the Project’s exposure to changes in gold price assumptions. An additional Alternative Case has also been evaluated at a gold price of $4,000 /oz.
For the ±25% sensitivity cases, royalties and income tax have been explicitly calculated and applied to reflect changes in project cash flows associated with the revised gold price assumptions. Selling costs have not been adjusted in these cases as the impact is considered
| | | | | | | | |
| Released: March 27,2026 | Page 196 of 213 |
immaterial to the sensitivity outcomes. The ±25% cases are intended to demonstrate relative project sensitivity to changes in gold price rather than represent fully re-optimised economic scenarios.
For the $4,000 /oz Alternative Case, the economic model has been fully re-run, including the application of royalty and selling cost calculations consistent with the Reserve Case assumptions. At this gold price, the Crown royalty alternates between the ad valorem royalty of 1% of revenue and the accounting profits royalty of 5% of accounting profits in individual years, depending on project profitability.
Figure 22-3 presents the gold price sensitivity analysis.
Figure 22-3 Gold Price Sensitivity Analysis
22.4.3Pricing Model Results For Alternative Case
For the Alternative Price Case ($4,000 /oz gold price) Macraes delivers post-tax financial metrics of:
•$822.0 million undiscounted cashflow;
•$722.2 million NPV;
•$1,568 /oz Cash Costs (C1); and
•$2,203 /oz AISC.
The modelled indicative economic results are presented in Table 22-3 at the Alternative price profile.
| | | | | | | | |
| Released: March 27, 2026 | Page 197 of 213 |
Table 22-3 Indicative Economic Results at Alternative Price Profile
| | | | | | | | |
Description | US$000’s | |
|
Scenario | Alternative Price | |
Market Prices |
| |
Gold (US$/oz) | 4,000 | |
Payable Gold (Moz) | 0.6 | |
Revenue |
| |
Gross Gold Revenue | 2,391,200 | |
Operating Costs |
| |
Total Operating Costs | 944,913 | |
Operating Margin (EBITDA) | 1,446,287 | |
Taxes |
| |
Income Tax | 212,497 | |
Operating Cash Flow | 1,233,790 | |
Capital |
| |
Sustaining Capital | 392,954 | |
Closure and Rehabilitation | 53,262 | |
Total Capital | 446,216 | |
Metrics |
| |
Pre-Tax Free Cash Flow | 1,034,502 | |
After-Tax Free Cash Flow | 822,005 | |
Pre-Tax NPV at 5% | 912,326 | |
After-Tax NPV at 5% | 722,205 | |
| | | | | | | | |
| Released: March 27, 2026 | Page 198 of 213 |
| | | | | |
NI 43-101 Technical Report – Macraes Operation, Otago, New Zealand | |
| |
| |
23Adjacent Properties
There are no other historical or operating hard rock gold mines of comparable size in the district.
| | | | | |
Released: March 27,2026 | Page 199 of 214 |
24Other Relevant Data and Information
24.1Topography
The surface topography used for the Coronation North, Coronation, Deepdell, Innes Mills, and Golden Bar Mineral Resource estimates was a combination of 2.5 m contour information derived from a detailed aerial survey completed in early 1994 by the Department of Survey and Land Information (DOSLI) on behalf of OceanaGold, surveyed drill hole collars, and the December 31, 2025 end of month mine survey.
The surface topography for Nunns, Ounce, Taylors and the Stoneburn estimates was derived from the 20 m DOSLI contour data and drill hole collars. This topography is very coarse and needs to be resurveyed at 2.5 m contours prior to any mining.
| | | | | | | | |
| Released: March 27, 2026 | Page 200 of 213 |
25Interpretation and Conclusion
25.1Geology
The Macraes tenement area is a mature exploration area and much of the near-surface, along-strike exploration potential has been tested. Numerous studies have been completed on the mineralization, and the geological setting and controls are generally well understood.
The immediate Resource potential is downdip/plunge of the known Resources in the open pits and that has been the focus of exploration in recent times. Exploration potential exists between the Coronation North and Nunns deposits to the north. The areas to the south of Golden Bar also contain several known gold deposits that have seen little exploration since 2003. Further work on these areas may be warranted.
While the geological setting and mineralization styles are well understood, the current limit on immediate expansion to known Resources is the extent of drilling. In many of the current or previously mined areas the Resource estimates have reached the limits of the drill data. There is significant opportunity with increased drilling in targeted areas to increase the potentially minable Resources and thereby increase the mine life in the long term.
The OceanaGold sampling procedures adopted for the drilling activities are considered appropriate and the programmes are well supervised by suitably qualified technical personnel.
The drill hole and sampling data quality is acceptable for Resource estimation purposes. Much of the Resource based upon these earlier drilling campaigns has now been mined out. The residual risk associated with this early drilling is considered to be low.
Prior to 1998 some of the reverse circulation (RC) drill holes were sampled under wet drilling conditions leading to the potential for sampling bias and contamination. Much of the legacy risk associated with wet RC sampling has been mitigated by subsequent replacement of wet RC drill holes by diamond twins. Where however, wet RC drill holes have not been replaced, RC sample grades have been factored, based on relationships between twinned RC versus diamond core sample grades. This approach has been applied by OceanaGold for several pits at Macraes and has resulted in acceptable Resource estimate to mine reconciliations. The relatively low proportions of remaining wet RC samples, and previous mining history are the basis for OceanaGold considering the residual risk to the Resource estimates to be low.
Reconciliation data indicate the Resource models represent robust estimates of metal and are generally acceptable estimators of tonnage and grade. The Resource modelling process is well established and a process for internal review and sign-off was implemented in 2018.
The Mineral Resource statement determined as at December 31, 2025, has been prepared and reported in accordance with Canadian National Instrument 43-101, ‘Standards of Disclosure for Mineral Projects’ of June 2011 (the Instrument) and the classifications adopted by CIM Council in December 2011.
25.2Mining
Macraes is mined by a combination of conventional open pit and underground retreat uphole open stope and reverse fire open stope methods along the line of strike.
| | | | | | | | |
| Released: March 27, 2026 | Page 201 of 213 |
The open pit mining operation utilises hydraulic excavators and rear dump diesel trucks to extract both overburden and ore. Blasting requires relatively light powder factors compared with some other operations due to the comparatively weak and fractured rock mass. Ore is blasted in 7.5 m high benches and excavated in three, nominally 2.5 m high flitches. Waste is blasted in 15 m benches and excavated in four flitches.
The underground retreat uphole stope mining operation utilises electro-hydraulic development jumbos, diesel load-haul-dump units, diesel haul trucks and longhole drill rigs to extract both waste and ore. The uphole retreat stope voids are not backfilled. Instead, the mine design utilises yielding pillars between adjacent extracted stopes to gradually deform over a timeframe that permits ore extraction.
The open pit operation and the underground operation is owner-operated by OceanaGold. A range of other contracts support the mining operations. OceanaGold’s performance at Macraes has demonstrated that the mining equipment and mining methods are suited to the required mining rates and deposit geometry. Open pit and underground mine design procedures are appropriate and have been conducted in accordance with established industry standards and with input from appropriately qualified geotechnical specialists, hydrological specialists and consultants. Historical productivity and safety records are generally in line with or better than industry standards.
The open pit and underground Life of Mine plan schedule has been prepared to 2032. The schedules rely only on Mineral Reserves and are considered appropriate and reasonable.
The mining and ore processing schedules have factors applied to account for poor weather, public holidays, equipment availability, equipment utilization, historically justified limitations on mine production and historically justified limitations on mill throughput.
The mining schedules contain other ore sources that are not currently in production. The Innes Mills Stages 11 and 12, Golden Bar Stages 2 and 3, Coronation Stages 6 and 7and some sections of the Golden Point underground are under resource consent application as at the Effective Date. OceanaGold has a reasonable expectation that these resource consents will be granted.
There are studies underway which have the potential to extend the production schedule from 2030 onwards. These studies include a combination of existing resources and results from planned drilling programs:
•Expansion of the Innes Mills pit to the North East, referred to as the Southern Pit-Innes Mills project, or SPIM;
•Down dip expansion of the Golden Point Underground;
•Expansion of the Coronation and Coronation North pits;
•New pits at Stoneburn, south of Golden Bar and at Nunns, north of Coronation North; and
•Expansion of the Golden Bar open pit.
25.3Mineral Processing
Over the last thirty-five years OceanaGold has developed considerable experience in development and operation of the complex ore processing technology required to optimise gold recovery from the Macraes refractory ores.
| | | | | | | | |
| Released: March 27, 2026 | Page 202 of 213 |
Emphasis is placed on the control of costs. The relatively high tonnage processed, the simple flotation reagent regime, and economies resulting from concentration of the gold into a flotation product comprising between 1.5% and 3% of the ore mass treated, reduce operating cost. Labour costs are also lower than in most comparable developed countries. The operating cost of the core sulfide process is due to low comminution costs (contributed to by the coarse grind, and relatively soft ore).
Plant utilization has been maintained at about 92-94% which is at the high end of typical industry benchmarks. Gold recovery on open pit ore and underground combined, for 2025 averaged 84.8%. Overall, recoveries are considered reasonable given the refractory nature of the ores.
The Processing Plant has the capacity to treat 6.4 Mt of ore per annum. The forward Life of Mine plan does not require capacity above this established level.
25.4Project Infrastructure
OceanaGold continues to maintain appropriate infrastructure at Macraes, including road access, power, water supplies and administration facilities.
Tailings and waste rock disposal facilities are maintained and managed on an ongoing basis. Progressive rehabilitation is ongoing. Tailings capacity of FTSF is sufficient for Life of Mine and an extra raise to 510 mRL will increase capacity for continued operations well beyond 2032.
The project Mineral Reserves, plant site, tailings dams, and waste rock stacks are on land covered by mining permits, and which OceanaGold owns or has access to mine. All material tenements and landholder agreements are in good standing.
Environmental management and mitigation infrastructure is maintained to ensure compliance with relevant consents and permits.
25.5Environmental Studies, Permitting and Tenement Status
The Macraes Operation is fully consented for current operations, with actual and potential environmental effects regularly monitored and reported to the relevant agencies.
The project Mineral Reserves, plant site, tailings dams and waste rock stacks are located on land covered by mining permits, and which OceanaGold owns or has access to mine. All material permits and landholder agreements are in good standing.
The mineral permits are in good standing, and their duration is sufficient to allow future mining of the Resource within the permits as MP 41 064 expires in 2030 and MP 52 738 expires in 2045.
The site environmental documentation is appropriate and follows Environment Management System (EMS) principles, although a full EMS is not in place. Documentation is reviewed and updated regularly.
Resource consent applications will be lodged in a submission titled Macraes Phase 4 Fast Track (MP4Fast) in Q3 2026 for the:
•Innes Mills Stage 11 and 12 pits;
•Golden Bar Stages 2 and 3 pits;
•Coronation Stages 6 and 7 pits;
| | | | | | | | |
| Released: March 27, 2026 | Page 203 of 213 |
•Golden Point underground extension; and
•Frasers Tailings Storage Facility Stage 3.
There are no material compliance issues relating to the principal mining and processing operations. OceanaGold is in partnership with Otago Fish and Game, a semi-government organization, to manage a Trout Hatchery on the Macraes mine site.
Overall, no material environmental issues have been identified to limit the ongoing operation of the mine within the planned schedule.
25.6Production
OceanaGold has prepared Life of Mine production plans from Mineral Reserves which cover 2026-2032 for Macraes. This schedule is based on open pit mining at Innes Mills, Coronation, Coronation North and Golden Bar from 2026 to 2032. Underground production from Golden Point Underground runs until 2029. The mine production plans are considered reasonable for the purpose of long-term scheduling.
The fleet includes one Hitachi EX3600 electric shovel, three Hitachi EX3600 and one Hitachi EX2500 backhoe excavators to load 21-24 Caterpillar 789C/D haul trucks. OceanaGold is satisfied that there are enough working areas for the excavators to operate.
The current underground fleet will be maintained from 2026 to 2028, reducing to one truck and two loaders in 2029.
The underground ore is dumped at an in-pit stockpile for periodic re-handling by the open pit fleet to the process plant's run of mine stockpile. OceanaGold is satisfied with the accuracy of the dilution factors, ore loss factors and constraints placed upon the mining schedule, which are supported by extensive operating experience.
25.7Capital and Operating Costs
Capital expenditures estimation and forecasting are considered reasonable and consistent with proposed development programmes and ongoing requirements. Capital expenditures over the period will vary against the forecast due to unforeseen problems, modifications, upgrades and introduction of new technology.
Capital expenditure provisions (2026 to 2032) include expenditures for capitalised mining costs and sustaining capital of NZD631.5 million and are considered accurate to within ±15%.
Plant operating cost estimates for Macraes are generally considered reasonable and consistent with recent experience and trends and are regarded as accurate to ±10%.
Capital and operating costs were estimated in NZD and then converted to USD using an exchange rate of 0.58 USD: NZD.
| | | | | | | | |
| Released: March 27, 2026 | Page 204 of 213 |
26Recommendations
26.1Recommended Work Programmes
The recommended work programme costs are included in the operating and capital costs for Macraes.
Exploration programmes and budget are determined annually for the following year as part of the budgeting process. The approved Exploration budget for 2026 is NZD3.9 million.
26.1.1Exploration & Resource Conversion
•Complete infill drilling at Innes Mills, Coronation, Coronation North, Golden Bar and GPUG as planned in 2026 for a total cost of around NZD3.9 million;
•Maintain annual exploration investment to define viable Resources made available by an increasing gold price, seeking to replace mining depletion through discovery and delineation of additional ore sources;
•Complete Resource definition drilling at GPUG, Innes Mills and Golden Bar; and
•Evaluate potential mine planning / processing benefits of including sulfur grades and other geometallurgical attributes in the Resource estimates.
26.1.2Mineral Processing and Metallurgical Testing
Complete testwork on metal recoveries for any additional potential mineable inventory identified to allow risk mitigation and support conversion to Mineral Reserves. The processing operational budget includes provision for both diagnostic testing and future ores testing in the on site metallurgical laboratory.
26.1.3Mining and Reserves
•Complete Feasibility study of the Southern Pit Innes Mills (SPIM) Project;
•Continue assessment of potential mineable targets along strike; and
•Continue assessment of the tungsten extraction potential.
26.1.4Macraes Operation Infrastructure
•Progress FTSF Stage 3 resource consent design and lodge permit application in Q3 2026;
•Complete Golden Bar road realignment in Q4 2026; and
•Completed Macraes-Dunback realignment in 2027
26.1.5Environmental Studies and Permitting
•Keep the current permits and consents in good standing by continuing with the established monitoring and compliance practices; and
•Complete submission of the MP4Fast consent submission in Q3 2026.
| | | | | | | | |
| Released: March 27, 2026 | Page 205 of 213 |
27References
Adams, C.J., Bishop, D.G. & Gabites, J.E. 1985: Potassium-argon age studies of a low-grade, progressively metamorphosed greywacke sequence, Dansey Pass, South Island, New Zealand. Journal of the Geological Society of London, 142, pp 339-349.
Aldrich S., 2003: Stoneburn EP40-472. Taylors Prospect Drilling programme February 2003. Unpublished report for GRD Macraes.
Allibone, A., Jones, P., Blakemore, H., Craw. C., MacKenzie, D., Moore, J., 2018: Structural Setting of Gold Mineralization within the Hyde-Macraes Shear Zone, Southern New Zealand. Economic Geology, 113 pp. 347-375.
Angus, P.V.M., 1993: Structural controls on gold deposition in the Hyde-Macraes Shear Zone at Round Hill, Otago, New Zealand. Proceedings, Australasian Institute of Mining and Metallurgy New Zealand Branch 27th Annual Conference, 85-95.
Angus, P.V.M., de Ronde, C.E.J. and Scott, J.G., 1997: Exploration along the Hyde Macraes Shear. Proceedings, New Zealand Minerals and Mining Conference, 151-157.
Bishop, D.G., Bradshaw, J.D. & Landis, C.A., 1985: Provisional terrane map of South Island, New Zealand. In Howell, D.G. (ed), Tectonostratigraphic Terranes of the Circum-Pacific Region, Earth Sci. Ser., vol. 1, American Association of Petroleum Geologists Circum-Pacific Council for Energy and Mineral Resources, Tulsa, Okla.
Bleakley P.A., 1994: Final report, Prospecting Licence 31-1760, Waihemo. Unpublished Macraes Mining Company Limited report to Ministry of Commerce.
Bleakley P.A., 1996: Stoneburn Project Exploration Permit 40 149 Annual Report. Unpublished report for Macraes Mining Company Limited. MR3453.
Brown I.R., 1988: Macraes Joint Venture, Macraes Flat proposed gold mine. A preliminary assessment of Round Hill pit slope stability. Unpublished Macraes Mining Company Limited report.
CIM (2014). Canadian Institute of Mining, Metallurgy and Petroleum Standards on Mineral Resources and Reserves: Definitions and Guidelines, May 10, 2014.
Coochey D.V., 1986: Technical report on the 1985-1986 exploration programme in the Macraes gold- tungsten district, Otago. Unpublished BHP Oil New Zealand Limited (Minerals Division) report.
Craw, D., 2002: Geochemistry of late metamorphic hydrothermal alteration and graphitisation of host rock, Macraes gold mine, Otago Schist, New Zealand. Chemical Geology, 191, 257-275.
Craw D. and Norris R.J., 1991: Metamorphic Au-W veins and Regional Tectonics: mineralization throughout the uplift history of the Haast Schist, New Zealand. NZ Journal of Geology and Geophysics, 34, 373-383.
Craw, D., Windle, S.J. and Angus, P.V.M., 1999: Gold mineralization without quartz veins in a ductile- brittle shear zone, Macraes mine, Otago Schist, New Zealand. Mineralium Deposita, 34, 382-394.
Crown Minerals Act, 1991: Statute of the Government of New Zealand.
| | | | | | | | |
| Released: March 27, 2026 | Page 206 of 213 |
De-Vitry, C. 2025: Audit of the IM2505 Innes Mills Resource Estimate. Unpublished report for Oceanagold by Manna Hill Geoconsulting.
Edwards, P.W, 2015: MP53-738 Round Hill. Exploration Report for 1st Nov 2010 to 31st December 2014. Ministry of Economic Development New Zealand unpublished report. OceanaGold (NZ) Ltd.
EGL, 2024: Top Tipperary Tailings Storage Facility Proposed Raising to RL570 Design Report, Macraes Gold Project, Oceana Gold (NZ) Ltd.
Farmer, L. 2016: The Temporal and spatial relationship between tungsten and gold mineralization in the Otago Schist, New Zealand. Unpublished PhD thesis, University of Otago.
Forsyth, P. J. (compiler) 2001: Geology of the Waitaki area. Institute of Geological & Nuclear Sciences 1:250,000 geological map 19. 1 sheet + 64p. Lower Hutt, New Zealand. Institute of Geological & Nuclear Sciences Limited.
Grant, M., Moore, J., Madambi, K., Leslie, E., Carr, D., 2024. NI 43-101 Technical Report Macraes Gold Mine, Otago, New Zealand. Report for OceanaGold Corporation and OceanaGold (New Zealand) Limited.
Grieve, P.L., 1991: Report on geological data within MLA 32-3218, 32-3219, 32-3238 and 3239. Unpublished Macraes Mining Company Limited report.
Groves, D.I., Goldfarb, R.J., Gebre-Mariam, M., Hageman, S.G. & Robert, F., 1998: Orogenic gold deposits: a proposed classification in the context of their crustal distribution and relationship to other gold deposit types. Ore Geology Reviews, 13, 7-27.
Groves, D. I., Goldfarb, R. J., Robert, F., Hart, C. J. R., 2003: Gold Deposits in Metamorphic Belts: Overview of Current Understand, Outstanding Problems, Future Research, and Exploration Significance. Economic Geology, 98 pp 1-29.
Hamel, G.E, 1992: Macraes Extended Project, Golden Point Mine and Battery, An Unpublished Supplementary Report to Macraes Mining Company Limited.
Lee, M.C, Batt, W.D. & Robinson, P.C., 1989: The Round Hill gold-scheelite deposit, Macraes Flat, Otago, New Zealand. Australian Institute of Mining and Metallurgy, Monograph 13, 173-179.
Little, T.A., Mortimer, N. & McWilliams, M. 1999: An episodic Cretaceous cooling model for the Otago- Marlborough Schist, New Zealand, based on 40Ar/39Ar white mica ages. New Zealand Journal of Geology and Geophysics, 42, 305-325.
MacKenzie, D. 2015: Scheelite Study: Different Styles of Scheelite Mineralization at Round Hill and Comparisons to the FRUG Metallurgical Trail Site. Unpublished report for OceanaGold (NZ) Ltd.
McKeag, S.A. & Craw, D., 1989: Contrasting fluids in gold-quartz vein systems formed progressively in a rising metamorphic belt, Otago Schist, New Zealand. Economic Geology, 84, 22-33.
McKeag, S.A., Craw, D. & Norris, R. J., 1989: Origin and deposition of a graphitic schist-hosted metamorphogenic Au-W deposit, Macraes, East Otago, New Zealand. Mineralium Deposita, 24, 124-131.
Mining Act, 1979: Statute of the Government of New Zealand.
Mitchell, M., Maw, L., Angus, P.V. and Craw, D., 2006: The Macraes gold deposit, east Otago. In: Christie, A.B. and Brathwaite, R. (Eds) Geology and exploration of New Zealand mineral deposits. Australasian Institute of Mining and Metallurgy, Monograph 25, 313-318.
| | | | | | | | |
| Released: March 27, 2026 | Page 207 of 213 |
Mitchell, M., Craw, D., Landis, C. A. and Frew, R. 2009: Stratigraphy, provenance, and diagenesis of the Cretaceous Horse Range Formation, east Otago, New Zealand. New Zealand Journal of Geology & Geophysics, 52 pp 171-183.
Molnar, P., Atwater, T., Mammerick, J. & Smith, S.M., 1975: Magnetic anomalies, bathymetry and the tectonic evolution of the South Pacific since the Late Cretaceous. Geophysical Journal of the Royal Astronomical Society, 40, 383-420.
Moore C.E., 1986: IP/Resistivity survey, Golden Ridge, Macraes SE. Unpublished BP Oil New Zealand Limited (Minerals Division) report.
Moore C.E., 1987: BPB demonstration geophysical log for GRC-14 Dead Horse Gully, Macraes Flat, South Island. Unpublished Macraes Mining Company Limited report.
Mortimer, N., 1993: Geology of the Otago Schist and adjacent rocks. Institute of Geological and Nuclear Sciences 1:500 000 geological sheet, Lower Hutt, New Zealand.
NZSOLD, 2024: New Zealand Dam Safety Guidelines
Phillips, G.N., 1991: Pressure-temperature environments and the causes of gold deposition [abs], in Robert, F., Sheahan, P.A., and Greens, S.B., (eds.), Greenstone gold and crustal evolution. St. John’s, Geological Association of Canada, 193.
Pitcairn, I. K., Teagle, D. A. H., Craw, D., Oliver, G. R., Kerrich, R. and Brewer, T. S., 2006: Sources of Metals and Fluids in Orogenic Gold Deposits: Insights from the Otago and Alpine Schists, New Zealand. Economic Geology, 101, pp 1525-1546.
Powell, R., Will, T.M., and Phillips, G.N., 1991: Metamorphism in Archean greenstone belts: Calculated fluid compositions and implications for gold mineralization . Journal of Metamorphic Geology, 9, 141-150.
Redden, R & Moore, J.G. 2010: Technical Report for the Macraes Project located in the province of Otago New Zealand. NI 43-101 Report for OceanaGold Corporation and OceanaGold (New Zealand) Limited.
Resource Management Act, 1991: Statute of the Government of New Zealand.
Robinson, P.C, 1986: Homestake-Home Reef Joint Venture, PL's 31-537, 31-595, 31-1339, ML 32-322, geophysics report, April 1985. Unpublished Macraes Mining Company Limited report.
Rodger, S., 2026: NI43 101 – Environmental and social performance content.
Roser, B.P., Mortimer, N., Turnbull, I. & Landis, C., 1993: Geology and geochemistry of the Caples Terrane, Otago, New Zealand: Compositional variations near a Permo-Triassic arc margin. In: P. F. Ballance (ed.) South Pacific Sedimentary Basins. Sedimentary Basins of the World, 2, 3-19.
Schofield, N., 2016: Short Course Notes on Mineral Resource Grade Control Modelling with Geostatistical Methods. FSSA International Consultants (Australia).
Shah, N., 2026: NI 43-101 Technical Report Macraes Operation, Effective Date December 31, 2025: Economic Assumptions
St John, J., 2026: NI 43-101 Technical Report Macraes Operation, Effective Date December 31, 2025: Legal Assumptions
| | | | | | | | |
| Released: March 27, 2026 | Page 208 of 213 |
Stats NZ., 2024. 2023 Census population, dwelling, and housing highlights. Retrieved from https://www.stats.govt.nz/infographics/2023-census-national-and-regional-data/
Valmin Committee, 2015: Code for the Technical Assessment and valuation of Mineral and Petroleum Assets and Securities for Independent Expert Reports (The VALMIN Code).
Williamson, J.H., 1939: Geology of the Naseby Subdivision, Central Otago, New Zealand. New Zealand Geological Survey Bulletin, 39.
Yardley, B.W.D., 1982: The early metamorphic history of the Haast Schists and related rocks of New Zealand. Contributions to Mineralogy and Petrology, 81, 317-327
| | | | | | | | |
| Released: March 27, 2026 | Page 209 of 213 |
28Glossary
The Mineral Resources and Mineral Reserves have been classified according to CIM (CIM, 2014). Accordingly, the Resources have been classified as Measured, Indicated or Inferred, the Reserves have been classified as Proven, and Probable based on the Measured and Indicated Resources as defined below.
28.1Mineral Resources
A Mineral Resource is a concentration or occurrence of solid material of economic interest in or on the Earth’s crust in such form, grade or quality and quantity that there are reasonable prospects for eventual economic extraction. The location, quantity, grade or quality, continuity and other geological characteristics of a Mineral Resource are known, estimated or interpreted from specific geological evidence and knowledge, including sampling.
An Inferred Mineral Resource is that part of a Mineral Resource for which quantity and grade or quality are estimated based on limited geological evidence and sampling. Geological evidence is sufficient to imply but not verify geological and grade or quality continuity. An Inferred Mineral Resource has a lower level of confidence than that applying to an Indicated Mineral Resource and must not be converted to a Mineral Reserve. It is reasonably expected that most of the Inferred Mineral Resources could be upgraded to Indicated Mineral Resources with continued exploration.
An Indicated Mineral Resource is that part of a Mineral Resource for which quantity, grade or quality, densities, shape and physical characteristics are estimated with sufficient confidence to allow the application of Modifying Factors in sufficient detail to support mine planning and evaluation of the economic viability of the deposit. Geological evidence is derived from adequately detailed and reliable exploration, sampling and testing and is sufficient to assume geological and grade or quality continuity between points of observation. An Indicated Mineral Resource has a lower level of confidence than that applying to a Measured Mineral Resource and may only be converted to a Probable Mineral Reserve.
A Measured Mineral Resource is that part of a Mineral Resource for which quantity, grade or quality, densities, shape, and physical characteristics are estimated with confidence sufficient to allow the application of Modifying Factors to support detailed mine planning and final evaluation of the economic viability of the deposit. Geological evidence is derived from detailed and reliable exploration, sampling and testing and is sufficient to confirm geological and grade or quality continuity between points of observation. A Measured Mineral Resource has a higher level of confidence than that applying to either an Indicated Mineral Resource or an Inferred Mineral Resource. It may be converted to a Proven Mineral Reserve or to a Probable Mineral Reserve.
28.2Mineral Reserves
A Mineral Reserve is the economically mineable part of a Measured and/or Indicated Mineral Resource. It includes diluting materials and allowances for losses, which may occur when the material is mined or extracted and is defined by studies at Pre-Feasibility or Feasibility level as appropriate that include application of Modifying Factors. Such studies demonstrate that, at the time of reporting, extraction could reasonably be justified.
| | | | | | | | |
| Released: March 27, 2026 | Page 210 of 213 |
The reference point at which Mineral Reserves are defined, usually the point where the ore is delivered to the processing plant, must be stated. It is important that, in all situations where the reference point is different, such as for a saleable product, a clarifying statement is included to ensure that the reader is fully informed as to what is being reported. The public disclosure of a Mineral Reserve must be demonstrated by a Pre-Feasibility Study or Feasibility Study. A Probable Mineral Reserve is the economically mineable part of an Indicated, and in some circumstances, a Measured Mineral Resource. The confidence in the Modifying Factors applying to a Probable Mineral Reserve is lower than that applying to a Proven Mineral Reserve.
A Proven Mineral Reserve is the economically mineable part of a Measured Mineral Resource. A Proven Mineral Reserve implies a high degree of confidence in the Modifying Factors.
28.3Definition of Terms
The following general mining terms may be used in this report.
Table 28-1 Definition of Terms
| | | | | |
Term | Definition |
|
AARL Elution | Anglo American Research Laboratories Elution system |
AISC | All-In Sustaining Cost (AISC) represents the total cost required to sustain ongoing production and maintain current operations, including operating costs, sustaining capital, royalties, and other sustaining expenditures, but excluding growth capital and financing costs. |
Assay | The chemical analysis of mineral samples to determine the metal content. |
Capital Expenditure | All other expenditures not classified as operating costs. |
Cash Costs(C1) | Cash costs represent the direct cash operating costs incurred in the production of gold over the Life of Mine. Cash costs include mining, processing, general and administrative costs, direct operating costs, selling costs, royalties, and cash movements associated with metals inventory. |
Composite | Combining more than one sample result to give an average result over a larger distance. |
Concentrate | A metal-rich product resulting from a mineral enrichment process such as gravity concentration or flotation, in which most of the desired mineral has been separated from the waste material in the ore. |
Crushing | Initial process of reducing ore particle size to render it more amenable for further processing. |
Cut-off Grade (CoG) | The grade of mineralized rock, which determines as to whether it is economic to recover its gold content by further concentration. |
Dilution | Waste, which is unavoidably mined with ore. |
Dip | Angle of inclination of a geological feature/rock from the horizontal. |
Fault | The surface of a fracture along which movement has occurred. |
Fire Assay | A destructive high-temperature metallurgical technique used to quantify the gold grade in assay samples. |
Footwall | The underlying side of an orebody or stope. |
Gangue | Non-valuable components of the ore. |
Grade | The measure of concentration of gold within mineralized rock. |
Hangingwall | The overlying side of an orebody or slope. |
| | | | | | | | |
| Released: March 27, 2026 | Page 211 of 213 |
| | | | | |
Term | Definition |
Term | Definition |
Haulage | A horizontal underground excavation which is used to transport mined ore. |
Hydro cyclone | A process whereby material is graded according to size by exploiting centrifugal forces of particulate materials. |
Igneous | Primary crystalline rock formed by the solidification of magma. |
Kriging | An interpolation method of assigning values from samples to blocks that minimises the estimation error. |
Level | Horizontal tunnel the primary purpose is the transportation of personnel and materials. |
Lithological | Geological description pertaining to different rock types. |
LoM Plans | Life-of-Mine plans. |
LRP | Long Range Plan. |
Material Properties | Mine properties. |
Milling | A general term used to describe the process in which the ore is crushed and ground and subjected to physical or chemical treatment to extract the valuable metals to a concentrate or finished product. |
Mineral/Mining Permit | A lease area for which mineral rights are held. |
Mining Assets | The Material Properties and Significant Exploration Properties. |
Ongoing Capital | Capital estimates of a routine nature, which is necessary for sustaining operations. |
Ore Reserve | See Mineral Reserve. |
Photon Assay | A non-destructive assay method using high-powered X-rays to 'excite' any gold atoms present in a sample. The emitted photons of activated gold atoms are detected to determine the gold grade. |
Pillar | Rock left behind to help support the excavations in an underground mine. |
RoM | Run-of-Mine. |
Sedimentary | Pertaining to rocks formed by the accumulation of sediments, formed by the erosion of other rocks. |
Shaft | An opening cut downwards from the surface for transporting personnel, equipment, supplies, ore and waste. |
Sill | A thin, tabular, horizontal to sub-horizontal body of igneous rock formed by the injection of magma into planar zones of weakness. |
Smelting | A high temperature pyrometallurgical operation conducted in a furnace, in which the valuable metal is collected to a molten matte or doré phase and separated from the gangue components that accumulate in a less dense molten slag phase. |
Stope | Underground void created by mining. |
Stratigraphy | The study of stratified rocks in terms of time and space. |
Strike | Direction of line formed by the intersection of strata surfaces with the horizontal plane, always perpendicular to the dip direction. |
Sulfide | A sulfur bearing mineral. |
Tailings | Finely ground waste rock from which valuable minerals or metals have been extracted. |
Thickening | The process of concentrating solid particles in suspension. |
Total Expenditure | All expenditures including those of an operating and capital nature. |
Variogram | A statistical representation of the characteristics (usually grade). |
| | | | | | | | |
| Released: March 27, 2026 | Page 212 of 213 |
28.4Abbreviations
The following abbreviations may be used in this report.
| | | | | | | | |
| Released: March 27, 2026 | Page 213 of 213 |
Table 28-2 Abbreviations
| | | | | |
Abbreviation | Unit or Term |
|
% | Percent |
° | degree (degrees) |
°C | Temperature in Degrees Centigrade |
2D | two-dimensional |
3D | three-dimensional |
AISC | All-In Sustaining Cost |
AGP or AP | acid generating potential |
ARD | acid rock drainage |
AT | after tax |
Au | Gold |
BT | before tax |
BTS | Brazilian tensile strength |
ca | Circa |
cfm | cubic feet per minute |
CIL | Carbon-In-Leach |
CoG | cut-off grade |
CPS | Coastal Plan Sand |
CRF | cemented rock fill |
DSS | direct shear strength |
ELOS | equivalent linear overbreak/slough |
EPCM | Engineering, Procurement and Construction Management |
FF/m | frequency fracture per metre |
GPa | Gigapascal |
HDPE | height density polyethylene |
hp | Horsepower |
IRR | initial rate of return |
IRS | intact rock strength |
ISRM | International Society of Rock Mechanics |
Ja | joint alteration |
Jn | joint number |
Jr | joint roughness |
kN | Kilonewton |
kN/m3 | kilonewton per cubic metre |
koz | thousand troy ounce |
kt | thousand tonnes |
kV | Kilovolt |
kW | Kilowatt |
LHD | long-haul-dump |
| | | | | | | | |
| Released: March 27, 2026 | Page 214 of 213 |
| | | | | |
Abbreviation | Unit or Term |
Abbreviation | Unit or Term |
LoM | life-of-mine |
m | Metre |
m3 | cubic metre |
ML | metal leaching |
MPa | Megapascal |
Mt | million tonnes |
MW | million watts |
NGO | non-governmental organization |
NI 43-101 | Canadian National Instrument 43-101 |
NNP | net neutralisation potential |
NPV | net present value |
OP | open pit |
OSA | overburden storage area |
oz | troy ounce |
PAG | potential acid generating |
PEA | preliminary economic assessment |
PLT | point load test |
PMP | Probable Maximum Precipitation |
ppb | parts per billion |
ppm | parts per million |
Q | rock mass rating (according to the Barton 1974 criteria) |
Q’ | Barton’s (1974) Q with the JW and SRF both set to a value of 1 |
QA/QC | Quality Assurance/Quality Control |
RMR | rock mass rating (according to the Bieniawski 1989 criteria) |
RoM | run-of-mine |
RQD | rock quality designation |
S.G. | Specific Gravity |
sec | Second |
SRF | stress reduction factor |
STD | standard deviation |
t/d | metric tonnes per day |
TCC | total cash costs |
TCR | total core recovery |
TCS | triaxial compressive strength |
TSF | tailings storage facility |
UCS | uniaxial compressive strength |
UG | Underground |
USD | United States Dollar |
V | Volts |
| | | | | | | | |
| Released: March 27, 2026 | Page 215 of 213 |
| | | | | |
Abbreviation | Unit or Term |
Abbreviation | Unit or Term |
VFD | variable frequency drive |
W | Watt |
y | Year |
| | | | | | | | |
| Released: March 27, 2026 | Page 216 of 213 |
Appendix A: Certificates of Qualified Persons
| | | | | | | | |
| Released: March 27, 2026 | Page 217 of 213 |
CERTIFICATE OF QUALIFIED PERSON
I, Euan Leslie, MAusIMM (CP), do hereby certify that:
1.I am the Group Mining Engineer of OceanaGold Corporation (“OceanaGold”) which has its head office at Suite 1020, 400 Burrard Street, Vancouver, British Columbia, V6C 3A6, Canada.
2.This certificate applies to the technical report titled “NI43-101 Technical Report, Macraes Operation, Otago, New Zealand” with an effective date of December 31st, 2025 (the “Technical Report”).
3.I graduated with a Bachelor of Engineering (Mining) and a Bachelor of Commerce (Economics) from Curtin University. I am a member and Charted Professional of the Australian Institute of Mining and Metallurgy (Member Number: 221022). I have worked as a Mining Engineer since 2009 in various underground hard rock environments including those relevant for the Macraes site.
4.I have read the definition of “qualified person” set out in National Instrument 43-101 (“NI 43- 101”) and certify that by reason of my education, affiliation with a professional/technical association, (as defined in NI 43-101) and past relevant work experience, I fulfill the requirements of a "qualified person" for the purposes of NI 43-101.
5.I have visited the site on September 2023.
6.I have been employed by OceanaGold or its subsidiaries since October 2021.
7.I am responsible for the preparation of Sections 15.3, 16.4 and 16.5 of the Technical Report.
8.I am not independent of the issuer applying all the tests in Section 1.5 of NI 43-101 as I have been a full time employee of OceanaGold since October 2021.
9.Prior to my employment with OceanaGold, I had no prior involvement with the property that is the subject of the Technical Report.
10.I have read NI 43-101 and Form 43-101F1 and the sections of the Technical Report I am responsible for have been prepared in compliance with NI 43-101 and Form 43-101F1.
11.As of the aforementioned effective date, to the best of my knowledge, information and belief, the sections of the Technical Report I am responsible for contain all scientific and technical information that is required to be disclosed to make the Technical Report not misleading.
Dated: March 27, 2026
| | | | | |
“Signed and Sealed” |
|
Euan Leslie, BEng Mining, BCom Economics, MAusIMM CP (Min) |
| | | | | |
OceanaGold Corporation | 1 |
www.oceanagold.com | |
CERTIFICATE OF QUALIFIED PERSON
I, Knowell Madambi, BSc Eng (Hons) Mining, MAusIMM CP (Min), do hereby certify that:
1.I am the Manager – Technical Services and Projects at OceanaGold’s Macraes Operation, Golden Point Rd, Macraes Flat, 9483, East Otago, New Zealand.
2.This certificate applies to the technical report titled “NI 43-101 Technical Report – Macraes Operation, Otago, New Zealand” with an effective date of December 31, 2025 (the “Technical Report”).
3.I graduated with a degree in Mining Engineering from the University of Zimbabwe in 1994. I am a Chartered Professional Mining Engineer (CP) registered with the Australian Institute of Mining and Metallurgy (AusIMM, #227753). I have worked as a mining engineer for a total of 33 years since my graduation from university. My relevant experience includes open-pit operational management, mine design and implementation, short- and long-term planning, haulage analysis, equipment selection, and cost estimation.
4.I have read the definition of “qualified person” set out in National Instrument 43-101 (“NI 43- 101”) and certify that by reason of my education, affiliation with a professional/technical association, (as defined in NI 43-101) and past relevant work experience, I fulfill the requirements of a "qualified person" for the purposes of NI 43-101.
5.I am based at Macraes Operation.
6.I have been employed by OceanaGold or its subsidiaries since March 28, 2023.
7.I am responsible for the preparation of Sections 1, 2, 3, 18, 19, 20, 21, 22, 23, 25, 26 and the open pit portions of Sections 15 and 16 of the Technical Report.
8.I am not independent of the issuer applying all the tests in Section 1.5 of NI 43-101 as I have been a full-time employee of OceanaGold since March 28, 2023.
9.Prior to my employment with OceanaGold, I had no prior involvement with the property that is the subject of the Technical Report.
10.I have read NI 43-101 and Form 43-101F1 and the sections of the Technical Report I am responsible for have been prepared in compliance with NI 43-101 and Form 43-101F1.
11.As of the aforementioned effective date, to the best of my knowledge, information and belief, the sections of the Technical Report I am responsible for contain all scientific and technical information that is required to be disclosed to make the Technical Report not misleading.
Dated: March 27, 2026
Knowell Madambi, BSc Eng (Hons) Mining, MAusIMM CP (Min)
| | | | | |
OceanaGold Corporation | 1 |
www.oceanagold.com | |
CERTIFICATE OF QUALIFIED PERSON
I, Matthew Lloyd Grant, PhD, MAIG, MAusIMM do hereby certify that:
1.I am the Senior Geologist - Resource Development at OceanaGold’s Macraes Operation, Golden Point Rd, Macraes Flat, 9483, East Otago, New Zealand.
2.This certificate applies to the technical report titled “NI43-101 Technical Report, Macraes Operation, Otago, New Zealand”, with an effective date of December 31, 2025 (the “Technical Report”).
3.I graduated with a Doctor of Philosophy in Applied Geology from Curtin University of Technology in 2005. I am a Member of the Australian Institute of Mining and Metallurgy (Member number: 1010687) and a Member of the Australian Institute of Geoscientists (Member number: 3508). I have worked as a Geologist for 20 years. My relevant experience includes mineral exploration, mine geology and resource estimation.
4.I have read the definition of “qualified person” set out in National Instrument 43-101 (“NI 43- 101”) and certify that by reason of my education, affiliation with a professional/technical association, (as defined in NI 43-101) and past relevant work experience, I fulfill the requirements of a "qualified person" for the purposes of NI 43-101.
5.I am a full-time employee based on site at the Macraes Operation.
6.I have been employed by OceanaGold or its subsidiaries from November 2007 to January 2013 and from April 2018 to present.
7.I am responsible for the preparation of Sections 1, 4, 5, 6, 7, 8, 9, 10, 11, 12, 14 and 24.1 of the Technical Report.
8.I am not independent of the issuer applying all the tests in Section 1.5 of NI 43-101 as I have been a full time employee of OceanaGold since April 2018.
9.Prior to my employment with OceanaGold, I had no prior involvement with the property that is the subject of the Technical Report.
10.I have read NI 43-101 and Form 43-101F1 and the sections of the Technical Report I am responsible for have been prepared in compliance with NI 43-101 and Form 43-101F1.
11.As of the aforementioned effective date, to the best of my knowledge, information and belief, the sections of the Technical Report I am responsible for contain all scientific and technical information that is required to be disclosed to make the Technical Report not misleading.
Dated: March 27, 2026
“Signed and Sealed”
Matthew Lloyd Grant, PhD (Applied Geology), MAIG, MAusIMM
| | | | | |
OceanaGold Corporation | 1 |
www.oceanagold.com | |
CERTIFICATE OF QUALIFIED PERSON
I, David Read Carr, MAusIMM CP (Met), do hereby certify that:
1.I am the Head of Metallurgy of OceanaGold Corporation (“OceanaGold”), Suite 1020, 400 Burrard Street,
Vancouver, British Columbia, V6C 3A6, Canada.
2.This certificate applies to the technical report titled “NI43-101 Technical Report, Macraes Operation, Otago, New Zealand” with an effective date of December 31, 2025 (the “Technical Report”).
3.I graduated with a degree in Bachelor of Engineering in Metallurgical Engineering (Hons) from the University of South Australia in 1993. I am a Member and Chartered Professional of the Australasian Institute of Mining and Metallurgy. I have worked as a metallurgist for a total of 33 years since my graduation from university. My relevant experience includes base metal flotation, flotation and leaching of gold ores, pressure oxidation of refractory sulphide ores, ultrafine grinding, process plant design, project evaluation and plant commissioning.
4.I have read the definition of “qualified person” set out in National Instrument 43-101 (“NI 43- 101”) and certify that by reason of my education, affiliation with a professional/technical association, (as defined in NI 43-101) and past relevant work experience, I fulfill the requirements of a "qualified person" for the purposes of NI 43-101.
5.I have visited the site in numerous times from 2003 to 2025 with the most recent visit from November 19, 2025.
6.I have been employed by OceanaGold or its subsidiaries since January 21, 2023.
7.I am responsible for mineral processing, all of Sections 13 and 17, the process plant capital and operating costs of section 21, and portions of Sections 1, 25 and 26 summarized therefrom, of this Technical Report.
8.I am not independent of the issuer applying all the tests in Section 1.5 of NI 43-101 as I have been a full time employee of OceanaGold since January 21, 2023.
9.Prior to my employment with OceanaGold, I had no prior involvement with the property that is the subject of the Technical Report.
10.I have read NI 43-101 and Form 43-101F1 and the sections of the Technical Report I am responsible for have been prepared in compliance with NI 43-101 and Form 43-101F1.
11.As of the aforementioned effective date, to the best of my knowledge, information and belief, the sections of the Technical Report I am responsible for contain all scientific and technical information that is required to be disclosed to make the Technical Report not misleading.
Dated: March 27, 2026
| | | | | |
“Signed and Sealed” |
|
David Read Carr, MAusIMM CP (Met) | |
| | | | | |
OceanaGold Corporation | 1 |
www.oceanagold.com | |