NI 43-101 Technical Report
Haile Gold Mine
Lancaster County, South Carolina
Effective Date: December 31, 2025
Report Date: March 27, 2026
Report Prepared by:
OCEANAGOLD
Suite 1020, 400 Burrard Street
Vancouver, BC V6C 3A6
Canada
Signed by Qualified Persons:
David Carr, Beng Metallurgical (Hons), MAusIMM (CP), (OceanaGold Head of Metallurgy)
Gregory Hollett, BEng (Mining Engineering), P.Eng (EGBC), (OceanaGold Head of Mine Engineering)
Brianna Drury, BSc Mining Engineering, RM-SME (OceanaGold Underground Engineering Superintendent)
Jonathan Moore, BSc Geology (Hons), MAusIMM (CP), (OceanaGold Head of Resource Development)
Douglas Corley, BSc Geology (Hons), MAIG (RPGeo), (OceanaGold Principal Geologist, Resource Development)
Larry Standridge, PE, MSE Geotechnical, (Call & Nicholas Principal Engineer, Geotechnical Engineer)
Robert Cook, PE, RM-SME, (Call & Nicholas Principal II Geological Engineer)
Jay Newton Janney-Moore, PE, RM-SME (NewFields Senior Project Manager I)
William Lucas Kingston, MSc, PG, RM-SME, Hydrogeology & Groundwater Management, (NewFields Senior Hydrogeologist)
Brooke J. Miller, MSc., CPG (SRK Principal Consultant, Geology)
| | | | | | | | |
NI 43-101 Technical Report – Haile Gold Mine, South Carolina, United States |
| |
| |
Cautionary Note Regarding Forward-Looking Statements
This report contains certain “forward-looking statements” and “forward-looking information” (collectively, “forward-looking statements”) within the meaning of applicable Canadian securities laws which may include, but is not limited to, statements with respect to: future financial and operating performance; cash flow forecasts; projected capital, operating and exploration expenditures; targeted cost reductions; mine life and production rates; potential mineralization and metal or mineral recoveries; information pertaining to potential improvements to financial and operating performance and mine life at the Haile Gold Mine; future metals prices; the estimation of Mineral Reserves and Mineral Resources; the realization of Mineral Reserves and Mineral Resources estimates; costs of production; costs and timing of the development of new deposits; costs and timing of future exploration and drilling programs; timing of filing of updated technical information; requirements for additional capital; governmental regulation of mining operations and exploration operations; timing and receipt of approvals; consents and permits under applicable legislation; environmental risks; title disputes or claims; and the timing and possible outcome of current and pending litigation and regulatory matters. All statements in this report that address events or developments that OceanaGold Corporation (“OceanaGold”) expects to occur in the future are forward-looking statements. Forward-looking statements are statements that are not historical facts and are generally, although not always, identified by words such as “may”, “plans”, “expects”, “projects”, “is expected”, “scheduled”, “potential”, “estimates”, “forecasts”, “intends”, “targets”, “aims”, “anticipates” or “believes” or variations (including negative variations) of such words and phrases, or may be identified by statements to the effect that certain actions, events or results “may”, “could”, “would”, “should”, “might” or “will” be taken, occur or be achieved.
Forward-looking statements involve known and unknown risks, uncertainties and other factors which may cause OceanaGold’s actual results, performance or achievements to be materially different from any future results, performance or achievements expressed or implied by the forward-looking statements. Such risks include, among others: the risk of not achieving OceanaGold’s production estimates, forecasts or Guidance; inaccuracy of Mineral Reserves, Mineral Resources and operating and capital cost estimates; the actual results of current and future production, development and/or exploration activities; possible variations of ore grade, metallurgy or recovery rates; changes in mine plans, project parameters or assumptions as plans continue to be refined; delays in, or inability to complete, development or construction or expansion activities or to re-commence or sustain operations as planned; failures or underperformance of plant, equipment, infrastructure or processes; geotechnical risks or events, including open pit wall stability, crown pillar failure, land subsidence and tailings dam failures; challenges associated with effective water management; environmental, health and safety and climate-related risks; risks related to community acceptance, stakeholder engagement and social licence to operate; competition for mineral properties and other growth opportunities; legal and regulatory challenges to current and future permits, certifications, approvals or licences; adverse judicial, regulatory or governmental decisions; delays in, or inability to obtain, financing or governmental approvals on acceptable terms; changes in laws, regulations, taxation regimes, regulated accounting standards or their interpretation or application; the risks associated with operating in foreign jurisdictions, including political instability, changes in policy or law, civil unrest or conflict; fluctuations in the prices of gold, copper and silver; general business, economic and market conditions (including changes in global, national or regional financial, credit, currency or
| | | | | | | | |
Released: March 27, 2026 | | Page 2 of 275 |
| | | | | | | | |
NI 43-101 Technical Report – Haile Gold Mine, South Carolina, United States |
| |
| |
securities markets); changes or developments in global, national or regional political and social conditions; fluctuations in foreign exchange rates, including the value of the U.S. dollar relative to the Canadian dollar, the New Zealand dollar or the Philippine peso; inflationary pressure; labour availability, retention and turnover; accidents, labour disputes and other operational risks of the mining industry; limitations of insurance coverage or uninsured risks; the conclusions of economic evaluations, studies and models; and those other factors identified and described in more detail in the section entitled “Risk Factors” contained in OceanaGold’s most recent Annual Information Form and OceanaGold’s other filings with Canadian securities regulators, which are available under OceanaGold’s profile on SEDAR+ at sedarplus.com and on OceanaGold’s website at oceanagold.com. The list is not exhaustive of the factors that may affect OceanaGold’s forward-looking statements.
OceanaGold’s forward-looking statements are based on the applicable assumptions and factors Management considers reasonable as of the date hereof, based on the information available to Management at such time. These assumptions and factors include, but are not limited to, assumptions and factors related to our ability to carry on current and future operations, including: exploration and development activities; the timing, extent, duration and economic viability of such operations; the accuracy and reliability of estimates, projections, forecasts, studies and assessments; our ability to meet or achieve guidance, estimates, projections and forecasts; the availability and cost of inputs; the price and market for outputs, including gold, copper and silver; foreign exchange rates; taxation levels; the timely receipt of necessary approvals, permits or certifications; the ability to meet current and future obligations; the ability to obtain timely financing on reasonable terms when required; the current and future social, economic and political conditions; and other assumptions and factors generally associated with the mining industry.
OceanaGold’s forward-looking statements are based on the opinions and estimates of OceanaGold management and reflect their current expectations regarding future events and operating performance and speak only as of the date hereof. OceanaGold does not assume any obligation to update forward-looking statements if circumstances or management’s beliefs, expectations or opinions should change other than as required by applicable law. There can be no assurance that forward-looking statements will prove to be accurate, and actual results, performance or achievements could differ materially from those expressed in, or implied by, these forward-looking statements. Accordingly, no assurance can be given that any events anticipated by the forward-looking statements will transpire or occur, or if any of them do, what benefits or liabilities OceanaGold will derive therefrom. For the reasons set forth above, undue reliance should not be placed on forward-looking statements.
| | | | | | | | |
Released: March 27, 2026 | | Page 3 of 275 |
| | | | | | | | |
NI 43-101 Technical Report – Haile Gold Mine, South Carolina, United States |
| |
| |
Table of Contents
| | | | | | | | | | | |
1 | Summary | 19 |
| 1.1 | Property Description, Location, Access and Ownership | 19 |
| 1.2 | History | 19 |
| 1.3 | Geological Setting, Mineralization and Deposit Types | 20 |
| 1.3.1 | Geology | 20 |
| 1.3.2 | Mineralization and Deposit Types | 20 |
| 1.4 | Mineral Permits and Regulatory Matters | 21 |
| 1.5 | Exploration | 22 |
| 1.6 | Drilling | 22 |
| 1.7 | Sampling, Analysis and Data Verification | 22 |
| 1.8 | Mineral Processing and Metallurgical Testing | 23 |
| 1.9 | Mineral Resources Estimate | 24 |
| 1.9.1 | Combined Open Pit and Underground Resource Estimate | 25 |
| 1.10 | Mineral Reserve Estimate | 27 |
| 1.10.1 | Open Pit Mineral Reserves Estimate | 27 |
| 1.10.2 | Underground Mineral Reserves Estimate | 28 |
| 1.10.3 | Combined Open Pit and Underground Reserves Estimate | 30 |
| 1.11 | Mining Methods | 32 |
| 1.11.1 | Open Pit Mining Methods | 32 |
| 1.11.2 | Underground Mining Methods | 34 |
| 1.11.3 | Combined OP and UG Production Schedule | 34 |
| 1.12 | Processing and Recovery Methods | 36 |
| 1.13 | Infrastructure | 37 |
| 1.14 | Environment Studies and Permitting | 38 |
| 1.15 | Capital and Operating Costs | 38 |
| 1.16 | Economic Analysis | 40 |
| 1.17 | Conclusions and Recommendations | 41 |
| 1.17.1 | Conclusions | 41 |
| 1.17.2 | Recommendations | 42 |
| | | | | | | | |
Released: March 27, 2026 | | Page 4 of 275 |
| | | | | | | | |
NI 43-101 Technical Report – Haile Gold Mine, South Carolina, United States |
| |
| |
| | | | | | | | | | | |
2 | Introduction | 43 |
| 2.1 | Sources of Information and Data | 43 |
| 2.2 | Qualifications of Consultants | 43 |
| 2.3 | Site Visits and Scope of Personal Inspection | 44 |
| 2.4 | Units of Measure | 45 |
| 2.5 | Effective Date | 45 |
3 | Reliance on Other Experts | 46 |
4 | Property Description and Location | 47 |
| 4.1 | Property Location | 47 |
| 4.2 | Ownership | 49 |
5 | Accessibility, Climate, Local Resources, Infrastructure and Physiography | 50 |
| 5.1 | Accessibility | 50 |
| 5.2 | Climate | 50 |
| 5.3 | Local Resources and Infrastructure | 50 |
| 5.4 | Physiography | 50 |
| 5.5 | Infrastructure Availability and Sources | 51 |
6 | History | 52 |
7 | Geological Setting and Mineralization | 54 |
| 7.1 | Regional Geology | 54 |
| 7.2 | Local Geology | 56 |
| 7.2.1 | Lithology | 56 |
| 7.2.2 | Structure | 61 |
| 7.2.3 | Mineralization and Alteration | 63 |
8 | Deposit Types | 65 |
| 8.1 | Haile Genetic Model | 65 |
| 8.2 | Haile Geological Model | 66 |
9 | Exploration | 67 |
| 9.1 | Pre-Romarco | 67 |
| 9.2 | Romarco | 67 |
| 9.3 | OceanaGold | 67 |
| 9.3.1 | Geologic Mapping and Surface Sampling | 68 |
| | | | | | | | |
Released: March 27, 2026 | | Page 5 of 275 |
| | | | | | | | |
NI 43-101 Technical Report – Haile Gold Mine, South Carolina, United States |
| |
| |
| | | | | | | | | | | |
| 9.3.2 | Geophysics | 68 |
10 | Drilling | 70 |
| 10.1 | Type and Extent | 70 |
| 10.2 | Sample Collection | 71 |
| 10.3 | Collar Locations and Downhole Surveys | 72 |
11 | Sample Preparation, Analyses and Security | 74 |
| 11.1 | Sample Preparation for Analysis | 74 |
| 11.1.1 | Off-Site Sample Preparation | 75 |
| 11.2 | Sample Analysis | 76 |
| 11.3 | Check Assays | 76 |
| 11.4 | Quality Assurance/Quality Control Procedures | 76 |
| 11.4.1 | Certified Reference Material | 76 |
| 11.4.2 | Blanks | 77 |
| 11.4.3 | Duplicates | 77 |
| 11.4.4 | Actions and Results | 77 |
| 11.5 | Opinion on Adequacy (Security, Sample Preparation, Analysis) | 77 |
12 | Data Verification | 79 |
| 12.1 | Data Validation of Pre-Romarco Holes | 79 |
| 12.2 | Verification of Romarco and OceanaGold Data | 79 |
| 12.2.1 | Romarco Data Verification | 80 |
| 12.2.2 | Horseshoe Data Verification 2016 | 80 |
| 12.3 | Haile QA/QC ALS July 2017- December 2025 | 81 |
| 12.3.1 | July 2017 to December 2025 CRM Performance | 81 |
| 12.3.2 | Contamination Monitoring | 85 |
| 12.3.3 | Statement of Data Adequacy | 85 |
13 | Mineral Processing and Metallurgical Testing | 86 |
| 13.1 | Testing and Procedures | 87 |
| 13.1.1 | Comminution | 87 |
| 13.1.2 | Throughput Estimate Assumptions | 93 |
| 13.1.3 | Flotation and Cyanidation | 94 |
| 13.1.4 | Sample Representativeness | 105 |
| | | | | | | | |
Released: March 27, 2026 | | Page 6 of 275 |
| | | | | | | | |
NI 43-101 Technical Report – Haile Gold Mine, South Carolina, United States |
| |
| |
| | | | | | | | | | | |
| 13.2 | Palomino Deposit | 106 |
| 13.3 | Ledbetter Underground Deposit | 112 |
| 13.4 | Recovery Estimate Assumptions | 120 |
14 | Mineral Resource Estimates | 122 |
| 14.1 | Drillhole Database | 122 |
| 14.1.1 | Data Cut-Off Date – Mineral Resource Models | 123 |
| 14.2 | Geologic Model Concepts | 123 |
| 14.3 | Lithology | 124 |
| 14.3.1 | Silicification | 125 |
| 14.3.2 | Pyrite | 125 |
| 14.4 | Domaining | 125 |
| 14.4.1 | Gold | 125 |
| 14.4.2 | Silver | 126 |
| 14.5 | Compositing | 127 |
| 14.6 | Top-Capping | 128 |
| 14.7 | Bulk Density | 128 |
| 14.8 | Mineral Resource – Open Pit | 128 |
| 14.8.1 | Block Model | 130 |
| 14.8.2 | Estimation Methodology | 131 |
| 14.8.3 | Open Pit Geometallurgical Model | 131 |
| 14.9 | Mineral Resource - Horseshoe Underground | 132 |
| 14.9.1 | Block Model | 133 |
| 14.9.2 | Estimation Methodology | 134 |
| 14.10 | Mineral Resource - Palomino Underground | 134 |
| 14.10.1 | Block Model | 135 |
| 14.10.2 | Estimation Methodology | 136 |
| 14.11 | Mineral Resource – Ledbetter Underground | 137 |
| 14.11.1 | Block Model | 139 |
| 14.11.2 | Estimation Methodology | 140 |
| 14.11.3 | Ledbetter Underground Geometallurgical Model | 140 |
| 14.12 | Open Pit and Underground Resource Classification | 141 |
| | | | | | | | |
Released: March 27, 2026 | | Page 7 of 275 |
| | | | | | | | |
NI 43-101 Technical Report – Haile Gold Mine, South Carolina, United States |
| |
| |
| | | | | | | | | | | |
| 14.13 | Open Pit and Underground Model Validation | 141 |
| 14.13.1 | Open Pit and Underground Model Reconciliation | 145 |
| 14.13.2 | Open Pit and Underground Model Reviews | 146 |
| 14.13.3 | Open Pit and Underground Combined Mineral Resource Statement | 148 |
| 14.14 | Relevant Factors | 149 |
15 | Mineral Reserve Estimates | 150 |
| 15.1 | Open Pit Mineral Reserve Estimate | 150 |
| 15.1.1 | Introduction | 150 |
| 15.1.2 | Conversion Assumptions, Parameters and Methods | 150 |
| 15.1.3 | Reserve Estimate | 151 |
| 15.2 | Underground Mineral Reserve Estimate | 153 |
| 15.2.1 | Introduction | 153 |
| 15.2.2 | Conversion Assumptions, Parameters and Methods | 154 |
| 15.2.3 | Reserve Estimate | 155 |
| 15.3 | Open Pit and Underground Combined Reserves Statement | 156 |
16 | Mining Methods | 158 |
| 16.1 | Open Pit Mining Methods | 158 |
| 16.1.1 | Current or Proposed Mining Methods | 158 |
| 16.1.2 | Geotechnical | 159 |
| 16.1.3 | Optimization | 165 |
| 16.1.4 | Ledbetter Open pit vs Underground Study | 169 |
| 16.1.5 | Mine Design | 171 |
| 16.1.6 | Overburden/Geochemical | 172 |
| 16.1.7 | Mine Production Schedule | 177 |
| 16.1.8 | Mining Fleet and Requirements | 182 |
| 16.1.9 | Open Pit Mine Dewatering | 183 |
| 16.2 | Underground Mining Methods | 184 |
| 16.2.1 | Cut-off Grade Calculations | 184 |
| 16.2.2 | Underground Geotechnical | 185 |
| 16.2.3 | Mine Design | 199 |
| 16.2.4 | Geochemical Classification | 201 |
| | | | | | | | |
Released: March 27, 2026 | | Page 8 of 275 |
| | | | | | | | |
NI 43-101 Technical Report – Haile Gold Mine, South Carolina, United States |
| |
| |
| | | | | | | | | | | |
| 16.2.5 | Mining Operations | 202 |
| 16.2.6 | LOM Production Schedule | 204 |
| 16.2.7 | Mine Equipment | 207 |
| 16.2.8 | Hydrogeology and Mine Dewatering | 207 |
| 16.3 | Combined Production Schedule | 208 |
17 | Recovery Methods | 210 |
| 17.1 | Processing Methods | 210 |
| 17.2 | Processing Flowsheet | 213 |
| 17.3 | Operational Results | 213 |
| 17.4 | Processing Schedule and Unit Costs | 217 |
| 17.5 | Contact Water Treatment Plant | 219 |
| 17.6 | Concentrate Leach Circuit Upgrade | 219 |
18 | Project Infrastructure | 221 |
| 18.1 | Tailing Storage Facility | 221 |
| 18.2 | Overburden Storage | 224 |
| 18.3 | Potential Acid Generating (PAG) Overburden Storage Areas | 224 |
| 18.4 | Site Wide Water Management | 226 |
| 18.5 | Site Wide Water Balance | 228 |
| 18.6 | Water Supply | 229 |
| 18.7 | Surface roads and Bridges | 229 |
| 18.8 | Underground Surface Infrastructure | 229 |
| 18.9 | Power Supply | 231 |
19 | Market Studies and Contracts | 232 |
20 | Environmental Studies, Permitting, and Social or Community Impact | 234 |
| 20.1 | Required Permits and Status | 237 |
| 20.2 | Environmental Studies | 237 |
| 20.3 | Environmental Bond | 237 |
21 | Capital and Operating Costs | 238 |
| 21.1 | Capital Expenditure Estimates | 238 |
| 21.2 | Operating Cost Estimates | 238 |
| | | | | | | | |
Released: March 27, 2026 | | Page 9 of 275 |
| | | | | | | | |
NI 43-101 Technical Report – Haile Gold Mine, South Carolina, United States |
| |
| |
| | | | | | | | | | | |
22 | Economic Analysis | 240 |
| 22.1 | Principal Assumptions and Input Parameters | 240 |
| 22.2 | Taxes, Royalties and Other Interests | 241 |
| 22.2.1 | Taxation | 241 |
| 22.2.2 | Royalties | 241 |
| 22.2.3 | Financing Costs | 242 |
| 22.3 | Pricing Model Results – Reserves Case | 242 |
| 22.4 | Sensitivity Analysis | 244 |
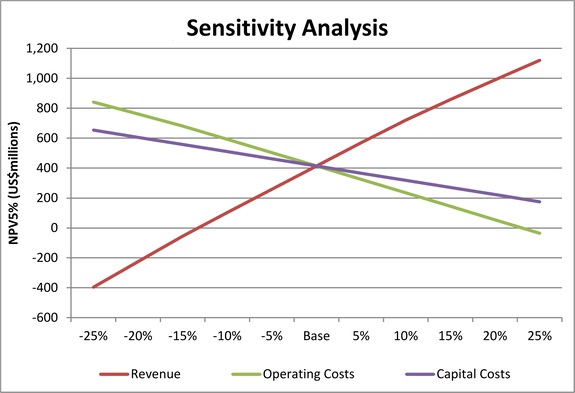
| 22.4.1 | Operational Sensitivity | 244 |
| 22.4.2 | Gold Price Sensitivity | 244 |
| 22.4.3 | Discount Rate Sensitivity | 245 |
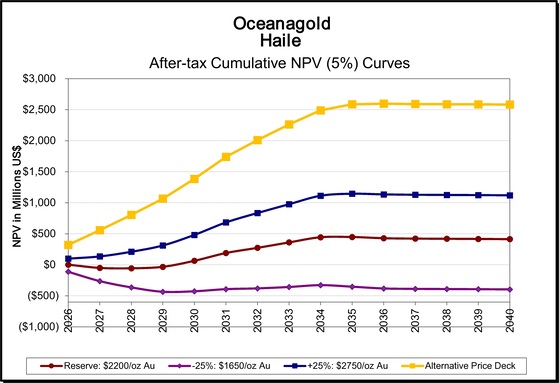
| 22.4.4 | Alternative Pricing Model Result | 246 |
23 | Adjacent Properties | 247 |
| 23.1 | Ridgeway Mine | 248 |
| 23.2 | Brewer Mine | 248 |
| 23.3 | Barite Hill Mine | 249 |
24 | Other Relevant Data and Information | 250 |
25 | Interpretation and Conclusions | 251 |
| 25.1 | Geology and Mineralization | 251 |
| 25.2 | Resource Estimation | 251 |
| 25.2.1 | Open Pit | 251 |
| 25.2.2 | Underground | 252 |
| 25.3 | Status of Exploration, Development and Operations | 252 |
| 25.4 | Mining Reserves | 252 |
| 25.4.1 | Open Pit | 253 |
| 25.4.2 | Underground | 253 |
| 25.5 | Mineral Processing and Metallurgical Testing | 254 |
| 25.6 | Recovery Methods | 254 |
| 25.7 | Project Infrastructure | 255 |
| 25.8 | Environmental Studies and Permitting | 255 |
| 25.9 | Economic Analysis | 255 |
| | | | | | | | |
Released: March 27, 2026 | | Page 10 of 275 |
| | | | | | | | |
NI 43-101 Technical Report – Haile Gold Mine, South Carolina, United States |
| |
| |
| | | | | | | | | | | |
26 | Recommendations | 257 |
| 26.1 | Recommended Work Programs | 257 |
| 26.1.1 | Exploration | 257 |
| 26.1.2 | Resource Estimation | 257 |
| 26.1.3 | Status of Exploration; Development and Operations | 257 |
| 26.1.4 | Mining and Reserves | 258 |
| 26.1.5 | Mineral Processing and Metallurgical Testing | 258 |
| 26.1.6 | Project Infrastructure | 258 |
| 26.1.7 | Environmental Study Results | 259 |
| 26.1.8 | Economic Analysis | 259 |
| 26.2 | Recommended Work Program Costs | 259 |
27 | References | 261 |
28 | Glossary | 266 |
| 28.1 | Mineral Resources | 266 |
| 28.2 | Mineral Reserves | 266 |
| 28.3 | Definition of Terms | 267 |
| 28.4 | Abbreviations | 269 |
Tables
| | | | | | | | |
Table 1-1: | Haile Open Pit and Underground Resource Statement as of December 31, 2025 | 26 |
Table 1-2: | Haile Open Pit Mineral Reserves Estimate as of December 31, 2025 | 28 |
Table 1-3: | Haile Underground Reserves Estimate as of December 31, 2025 | 30 |
Table 1-4: | OP and UG Reserve Statement for Haile Gold Mine as of December 31, 2025 | 31 |
Table 1-5: | Major Equipment Required to Achieve the Mine Schedule | 33 |
Table 1-6: | Haile Underground Annual Production | 34 |
Table 1-7: | Combined OP and UG Mining Production and Processing Schedule | 35 |
Table 1-8: | Total Capital Expenditure Summary (US$000’s) | 39 |
Table 1-9: | LoM Operating Cost Summary | 39 |
Table 1-10: | LoM Indirect Costs Summary | 40 |
Table 1-11: | Indicative Economic Results | 41 |
| | | | | | | | |
Released: March 27, 2026 | | Page 11 of 275 |
| | | | | | | | |
NI 43-101 Technical Report – Haile Gold Mine, South Carolina, United States |
| |
| |
| | | | | | | | |
Table 2-1: | Site Visit Participants | 45 |
Table 7-1: | Geological Summary of Major Gold Deposits of SE USA | 56 |
Table 10-1: | Haile Drilling Campaigns by Year, Owner and Lab | 71 |
Table 13-1: | Bond Ball Mill Work Indices for Haile Samples | 87 |
Table 13-2: | Bond Rod and Ball Mill Work Indices for Haile Composite | 88 |
Table 13-3: | Rod and Ball Mill Work Indices for Ledbetter Extension Samples | 88 |
Table 13-4: | Rod and Ball Mill Work and Abrasion Indices for Horseshoe Samples | 88 |
Table 13-5: | ALS Comminution Tests on Horseshoe Samples | 89 |
Table 13-6: | ALS Comminution Tests on Mill Zone Pit Samples | 89 |
Table 13-7: | ALS Comminution Test Results for 2018 Infill Sample Program | 90 |
Table 13-8: | SGS Comminution Test Results for 2022 Variability Program | 91 |
Table 13-9: | Geopyora Competency Test Results | 93 |
Table 13-10: | RDi Whole-Ore Leach Test Results | 95 |
Table 13-11: | Flotation Test Results – Averages by Grind | 95 |
Table 13-12: | Flotation Test Results Average by Grade and Grind | 96 |
Table 13-13: | Flotation Tailing Leach Test Results Average by Grade and Grind | 97 |
Table 13-14: | Leaching Tests Conducted on the Flotation Concentrates and Flotation Tailings .100 Table 13-15: Gold Recovery by Ore Zone and Ore Grade | 99 |
Table 13-16: | CIL Test Results for Fine Ground Flotation Concentrate | 101 |
Table 13-17: | Tests Results for Composites from Mill Zone and Snake Areas | 102 |
Table 13-18: | Test Results for Horseshoe Samples | 103 |
Table 13-19 | Test Results for Horseshoe Samples | 104 |
Table 13-20: | Palomino Metallurgical Composite Plan | 106 |
Table 13-21: | Palomino Competency Testing Results | 107 |
Table 13-22: | Geochemical Analysis of Palomino Composites | 109 |
Table 13-23: | Palomino Leach Test Results | 111 |
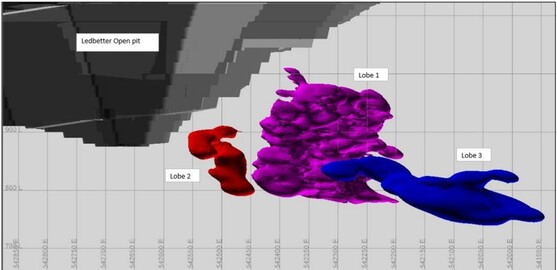
Table 13-24: | Ledbetter Underground Lobe 1 Sample Distribution | 113 |
Table 13-25: | Ledbetter Underground Prefeasibility Program Sample Source Summary | 114 |
Table 13-26: | Geochemical Analysis of Ledbetter Underground Composites | 115 |
Table 13-27: | Ledbetter Underground First Round Recovery Results | 116 |
Table 13-28: | Ledbetter Underground Second Round Recovery Results | 117 |
| | | | | | | | |
Released: March 27, 2026 | | Page 12 of 275 |
| | | | | | | | |
NI 43-101 Technical Report – Haile Gold Mine, South Carolina, United States |
| |
| |
| | | | | | | | |
Table 13-29: | Ledbetter Underground Third Round Recovery Results | 118 |
Table 14-1: | Data Cut-Off Dates for Resource Models | 123 |
Table 14-2: | Hard Boundaries Au Domain Thresholds | 125 |
Table 14-3: | Assigned Lithological Bulk Density Values | 128 |
Table 14-4: | Haile Open Pit Indicator Gold Class Thresholds and Means | 130 |
Table 14-5: | HA0725OLM_V6 Block Model Dimensions | 131 |
Table 14-6: | Horseshoe UG 3m composite Statistics Comparison by Domain | 133 |
Table 14-7: | Block Model Dimensions and Origin | 133 |
Table 14-8: | Palomino UG Basic Statistics for 3 m Composites by Domain | 135 |
Table 14-9: | Palomino Block Model Dimensions and Origin | 136 |
Table 14-10: | Ledbetter UG Basic Statistics for 3 m Au Composites by Domain | 139 |
Table 14-11: | Ledbetter UG Basic Statistics for 3 m Ag Composites (Based Only on Actual Ag Data) by Ag Domains | 139 |
Table 14-12: | Ledbetter UG Basic Statistics for 3 m Ag Composites (Based on Actual and Simulated Ag Data) by Ag Domains | 139 |
Table 14-13: | Block Model Dimensions and Origin Setup | 140 |
Table 14-14: | Haile Open Pit and Underground Resource classification Criteria | 141 |
Table 14-15: | Open Pit Resource Model Reconciliation | 146 |
Table 14-16: | Underground Resource Model Reconciliation | 146 |
Table 14-17: | Haile Open Pit and Underground Resource Statement as of December 31, 2025 .145 Table 15-1: Pit Optimization Parameters | 148 |
Table 15-2: | Haile Open Pit Mineral Reserves Estimate as of December 31, 2025 | 152 |
Table 15-3: | Dilution ELOS Assumptions | 154 |
Table 15-4: | Mine Design Dilution Factors | 155 |
Table 15-5: | Haile Underground Reserves Estimate as of December 31, 2025 | 156 |
Table 15-6: | Combined Reserve Statement for OceanaGold’s Haile Gold Mine as of December 31, 2025 | 157 |
Table 16-1: | ISA Recommendations for Near Surface Materials | 162 |
Table 16-2: | Mill Zone ISA Recommendations for Metasediments and Diabase Dikes | 162 |
Table 16-3: | Mill Zone ISA Recommendations for Metavolcanics | 163 |
Table 16-4: | ISA Recommendations for Metasediments and Diabase Dikes – Snake, Haile, and Ledbetter Pits | 163 |
Table 16-5: | ISA Recommendations for Metavolcanics – Snake, Haile, and Ledbetter Pits | 164 |
| | | | | | | | |
Released: March 27, 2026 | | Page 13 of 275 |
| | | | | | | | |
NI 43-101 Technical Report – Haile Gold Mine, South Carolina, United States |
| |
| |
| | | | | | | | |
Table 16-6: | Summary of Rock Mass Properties | 164 |
Table 16-7: | Pit Optimization Parameters | 166 |
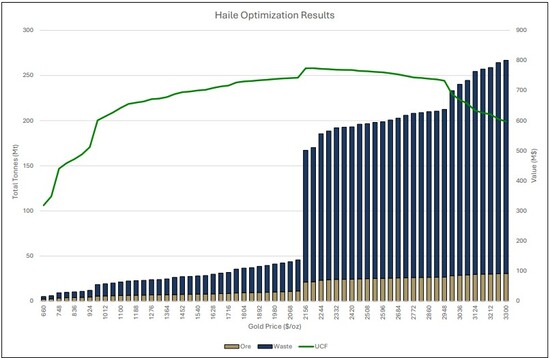
Table 16-8: | Optimization Results for Selected Shell on US$44 Gold Price Increments | 168 |
Table 16-9: | Overburden Classification at Haile | 175 |
Table 16-10: | Cut-off Grade Calculation | 177 |
Table 16-11: | Tonnage and Grade Multipliers for Application of Mining Dilution and Ore Recovery | 178 |
Table 16-12: | Phase Inventory (1/1/2026 to End of Mine Life) | 179 |
Table 16-13: | Open Pit Production Summary | 180 |
Table 16-14: | LoM Yearly Bench Sinking Rates (10 m bench equivalents) | 181 |
Table 16-15: | Factors in Estimation of Potential Operating Hours for a Typical Year | 182 |
Table 16-16: | Major Equipment Required to Achieve the Mine Schedule | 183 |
Table 16-17: | Underground Cut-off Grade Calculation | 184 |
Table 16-18: | Drillhole Data Used in Underground Geotechnical Block Models | 185 |
Table 16-19: | In Situ Stress Measurement Summary | 188 |
Table 16-20: | Summary of the Laboratory Testing | 188 |
Table 16-21: | Summary of Strength Properties (mi and σci) | 192 |
Table 16-22: | Summary of Permanent Support Categories for Palomino and Ledbetter | 198 |
Table 16-23: | Summary of Production Support Categories for Palomino and Ledbetter | 199 |
Table 16-24: | Underground Stope Design Dimensions | 199 |
Table 16-25: | Underground Production Summary | 205 |
Table 16-26: | Horseshoe Underground Production Summary | 206 |
Table 16-27: | Palomino Underground Production Summary | 206 |
Table 16-28: | Ledbetter Underground Production Summary | 206 |
Table 16-29: | Mobile Equipment Fleet | 207 |
Table 16-30: | Combined Open Pit and Underground Mining Schedule and Processing Schedule | 209 |
Table 17-1: | Key Consumable Consumption Rates | 218 |
Table 19-1: | Key Contracts and Status Requirements | 233 |
Table 20-1: | Mine Permits | 236 |
Table 21-1: | Total Capital Expenditure Summary (US$000’s) | 238 |
Table 21-2: | LoM Operating Cost Summary | 239 |
| | | | | | | | |
Released: March 27, 2026 | | Page 14 of 275 |
| | | | | | | | |
NI 43-101 Technical Report – Haile Gold Mine, South Carolina, United States |
| |
| |
| | | | | | | | |
Table 21-3: | LoM Indirect Costs Summary | 239 |
Table 22-1: | Basic Model Parameters | 240 |
Table 22-2: | Haile Tax Deductions (US$000’s) | 241 |
Table 22-3: | Financial Performance Summary (Reserve Case) | 243 |
Table 22-4: | Indicative Economic Results at Alternative Price Profile | 247 |
Table 26-1: | Summary of Costs for Recommended Work | 260 |
Table 28-1: | Definition of Terms | 267 |
Table 28-2: | Abbreviations | 269 |
Figures
| | | | | | | | | | | |
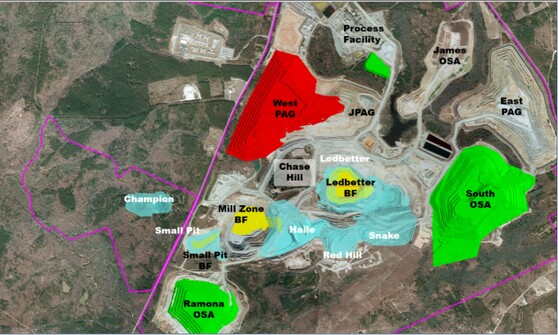
Figure 1-1: | Final Pit Design and Site Layout | 32 |
Figure 1-2: | LoM Production Schedule | 33 |
Figure 1-3: | Combined OP and UG Ore Production Schedule | 36 |
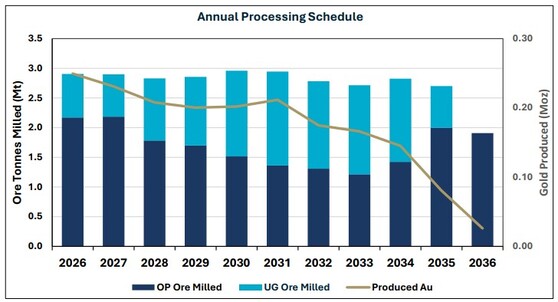
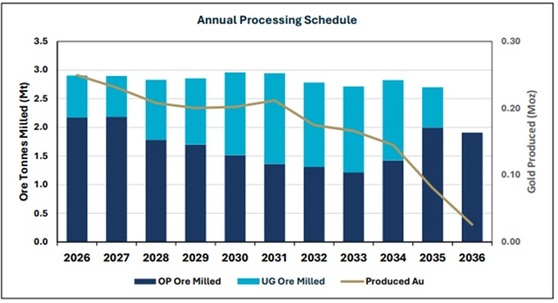
Figure 1-4: | Annual Processing Schedule | 37 |
Figure 4-1: | General Location Map of the Haile Gold Mine | 47 |
Figure 4-2: | Site Map of the Haile Gold Mine | 48 |
Figure 4-3: | Land Tenure Map | 49 |
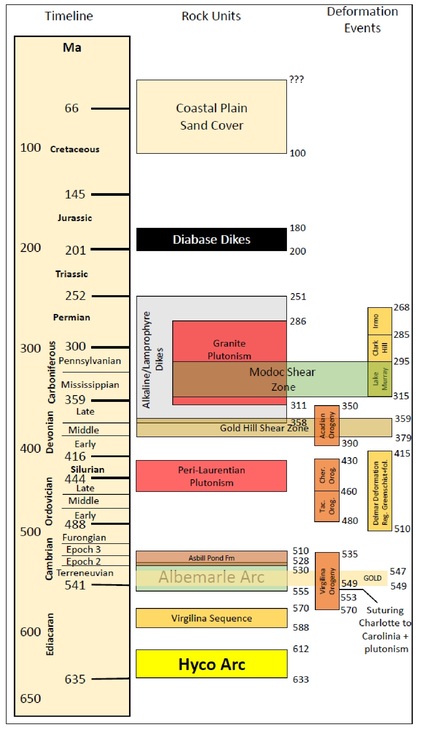
Figure 7-1: | Time Distribution of Major Geological Events in the Carolinas | 55 |
Figure 7-2: | District Geology of North-Central South Carolina (UTM NAD83 Z17N) | 58 |
Figure 7-3: | Geologic Map of the Haile Area with Gold Zones (UTM NAD83 Z17N) | 59 |
Figure 7-4: | Haile Stratigraphic Column | 60 |
Figure 7-5: | High Strain Fabrics in Core Samples | 62 |
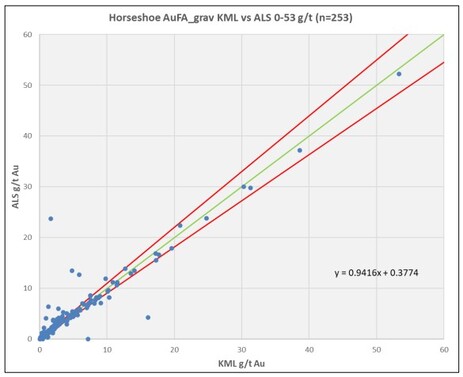
Figure 12-1: | Horseshoe AuFA_grav KML vs. ALS 0-53 g/t (n=253) | 81 |
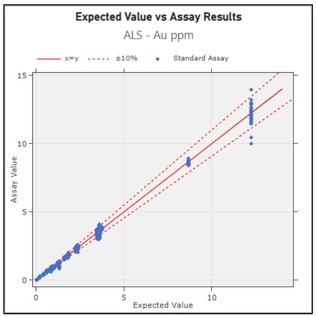
Figure 12-2: | July 2017- December 2025 CRM Analyses vs. Expected Value | 82 |
Figure 12-3: | July 2017 to December 2025 CRM Analyses vs. Expected Value <4 g/t | 82 |
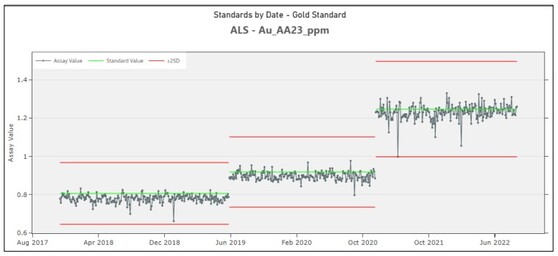
Figure 12-4: | July 2017- December 2022 CRMs: OxF125 (Au=0.806), OxG124 (Au=0.918), and OxH122 (Au=1.247) | 83 |
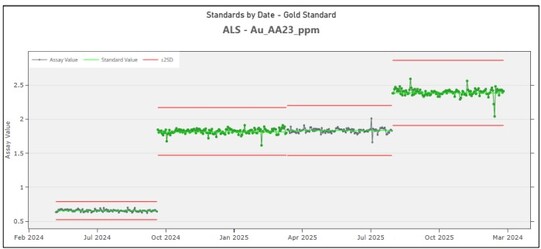
Figure 12-5: | January 2024 - December 2025 CRMs: OXE150 (Au=0.658), OXI177 (Au=1.811), OXI121 (Au=1.834), and OXJ176 (Au=2.385) | 84 |
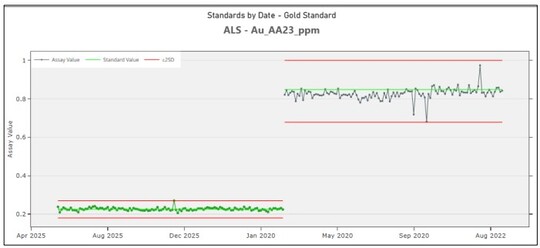
Figure 12-6: | October 2019 to December 2025 CRMs: SC127 (Au=0.225) and SF85 (Au=0.848) | 84 |
| | | | | | | | |
Released: March 27, 2026 | | Page 15 of 275 |
| | | | | | | | |
NI 43-101 Technical Report – Haile Gold Mine, South Carolina, United States |
| |
| |
| | | | | | | | | | | |
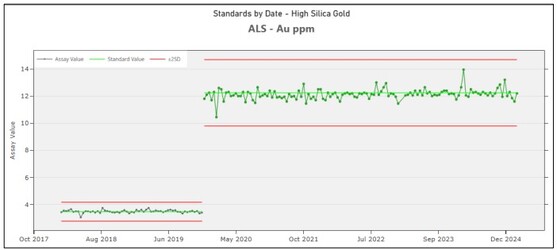
Figure 12-7: | October 2017 to December 2025 CRMs: HiSilK2 (Au=3.474) and HiSilP3 (Au=12.240) | 85 |
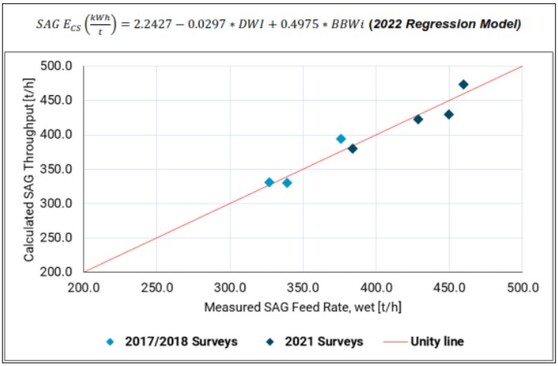
Figure 13-1: | Updated Modeled vs. Measured SAG Specific Energy Values | 92 |
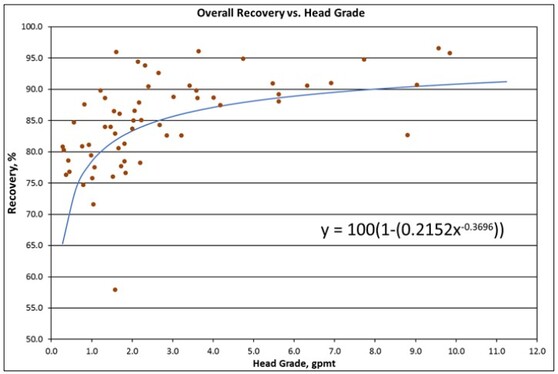
Figure 13-2: | Overall Percent Recovery vs. Head Grade | 105 |
Figure 13-3: | Haile Global Recovery Database Results by Source | 112 |
Figure 13-4: | Relationship Between Gold Deportment and Concentrate Leach Recovery at 24 hours | 119 |
Figure 13-5: | Overall Gold Recovery Estimation from Gold Telluride Deportment at Varying Concentrate Leach Residence Times | 120 |
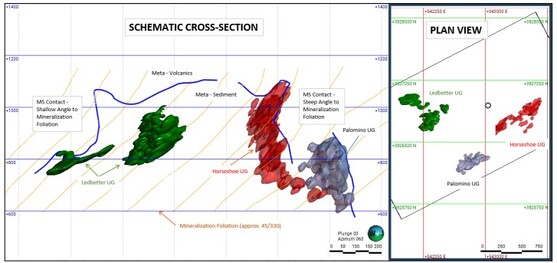
Figure 14-1: | Schematic Cross-Section Looking NE – Showing Relationship of UG deposits to MS/MV contact (Blue line) and Regional Foliation (Orange Line) | 124 |
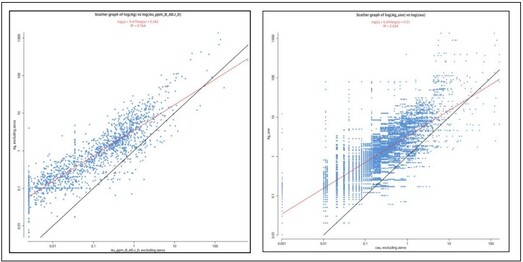
Figure 14-2: | Ledbetter UG deposit log-scale scatter plot of Ag (Original / Simulated) vs Au | 127 |
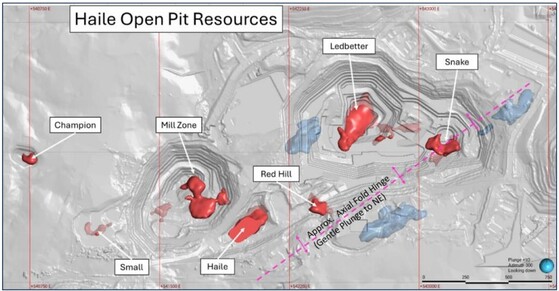
Figure 14-3: | Haile Open Pit | 129 |
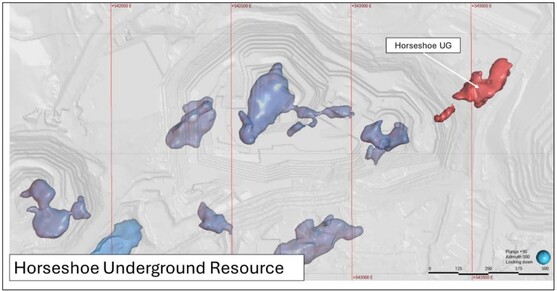
Figure 14-4: | Plan View showing Horseshoe (Red) Relative to Open Pit Areas | 132 |
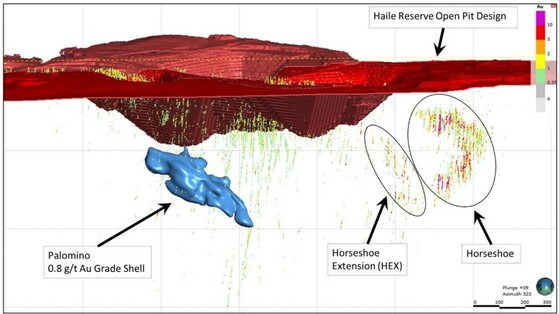
Figure 14-5: | Long-Section Looking NNW, showing Palomino Mineralization, Horseshoe, HEX and, Entire Haile Drilling Intercept Dataset Shown (colored by Au g/t) | 134 |
Figure 14-6: | Ledbetter UG Lithology Slice View, along Strike of Mineralization (striking NW), looking NE | 137 |
Figure 14-7: | Looking South – Ledbetter UG deposit, relative to the final Ledbetter open pit | 138 |
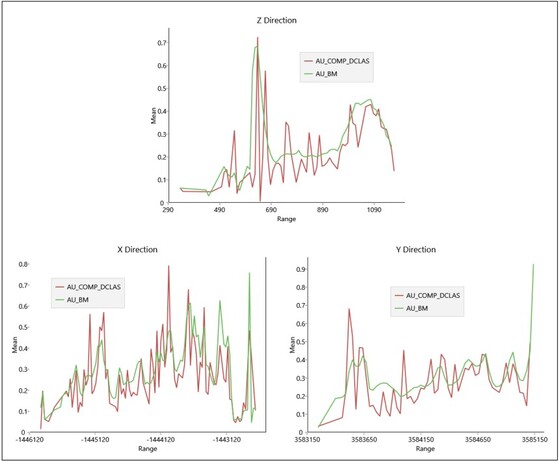
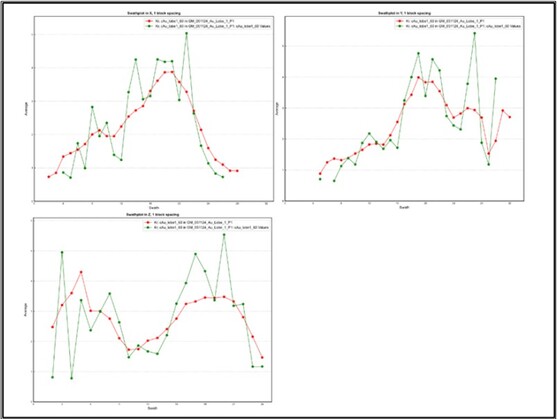
Figure 14-8 | Swath Plot Open Pit (Domain 1) Block Model Grade (vol weighted) vs. 2.5 m Top Capped Composite (Declustered Weighting) | 142 |
Figure 14-9 | Swath Plot Horseshoe UG (Domain 1) Block Model Grade (vol weighted) vs. 3 m Top Capped Composite (length Weighted) | 143 |
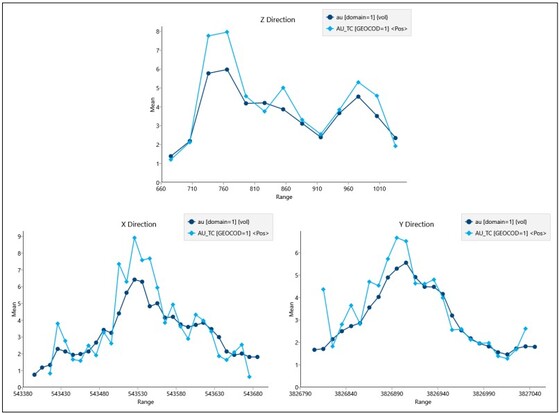
Figure 14-10 | Swath Plot Ledbetter UG (Lobe 1) Block Model Grade (vol weighted) vs. 3 m Top Capped Composite | 144 |
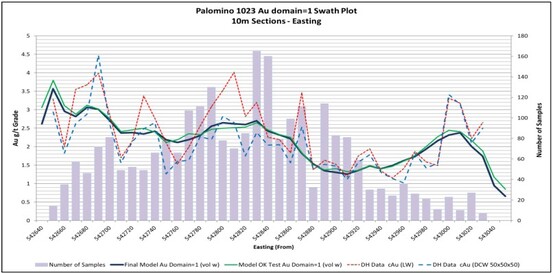
Figure 14-11 | Swath Plots Palomino UG (Easting only) Domain 1 Block Model Grade (vol. weighted) vs. 3 m Top Capped Composite (Length and declustered weighting) | 145 |
Figure 15-1: | General Site Layout and Location of the UG Reserve Area (in blue) | 153 |
Figure 16-1: | Haile Open Pit Naming Convention | 158 |
Figure 16-2: | Pit Optimization Results by Gold Price | 167 |
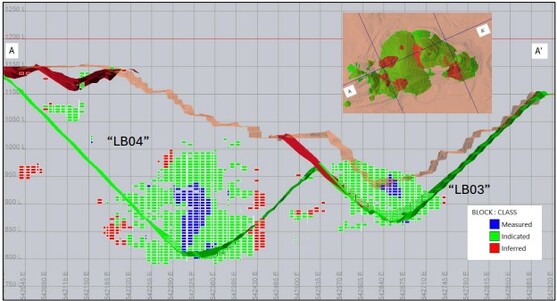
Figure 16-3: | Cross-Section, Ledbetter optimization shell showing revenue factor step change and resource model block >0.5 g/t Au | 169 |
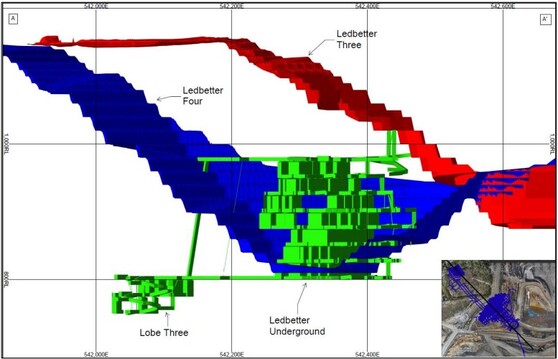
Figure 16-4: | Cross-Section, Footprint of Ledbetter Phase 4 Open Pit vs Ledbetter Underground | 170 |
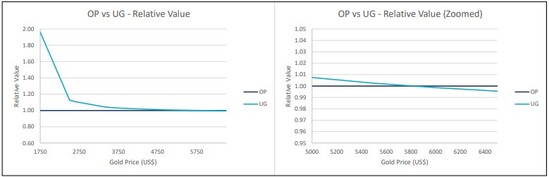
Figure 16-5: | Incremental Value – Relative valuation of Ledbetter Phase 4 OP vs UG | 171 |
| | | | | | | | |
Released: March 27, 2026 | | Page 16 of 275 |
| | | | | | | | |
NI 43-101 Technical Report – Haile Gold Mine, South Carolina, United States |
| |
| |
| | | | | | | | | | | |
Figure 16-6: | LoM Ultimate Pit Design | 172 |
Figure 16-7: | Final Pit Design and Ultimate Overburden Storage Site Plan | 176 |
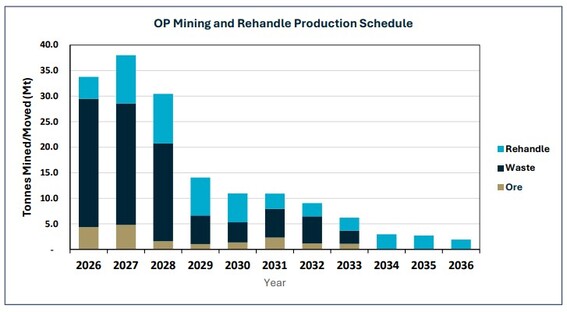
Figure 16-8: | Open Pit Annual Production Schedule | 180 |
Figure 16-9: | OP Mined Material Type Annual Schedule | 181 |
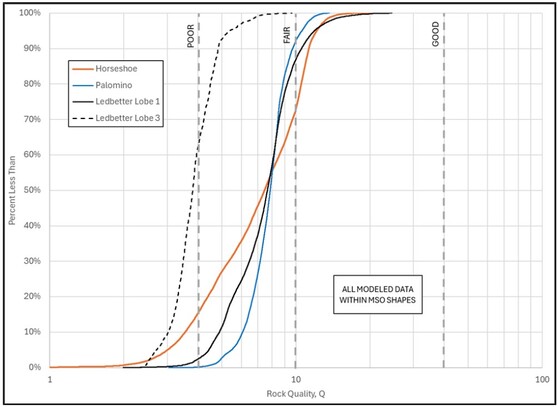
Figure 16-10: | Rock Quality Distributions within the HUG, PUG, and LUG MSO Shapes | 186 |
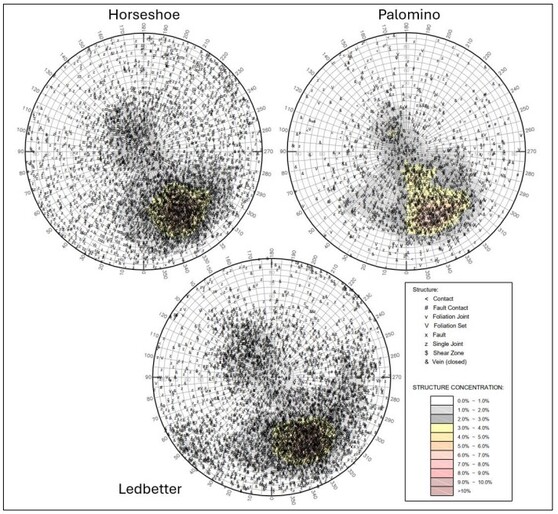
Figure 16-11: | Horseshoe, Palomino, and Ledbetter UG Stereonets | 187 |
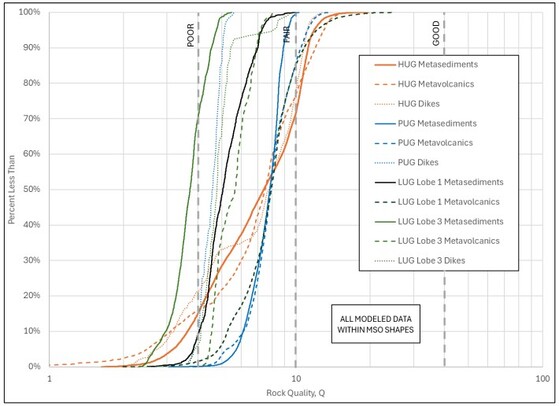
Figure 16-12: | HUG, PUG, and LUG Rock Qualities by Rock Type | 189 |
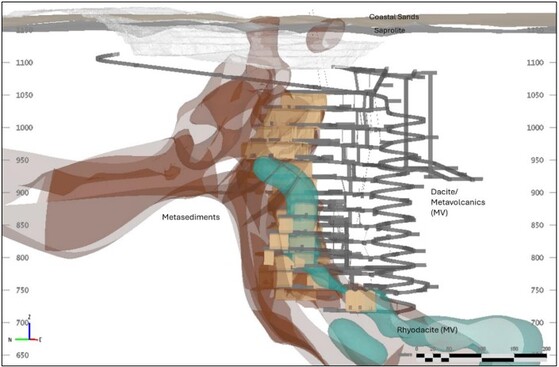
Figure 16-13: | Generalized Geotechnical Cross Section – Horseshoe (Looking NE) | 190 |
Figure 16-14: | Generalized Geotechnical Cross Section – Palomino (Looking NE) | 191 |
Figure 16-15. | Generalized Geotechnical Cross Section - Ledbetter (Looking NE) | 192 |
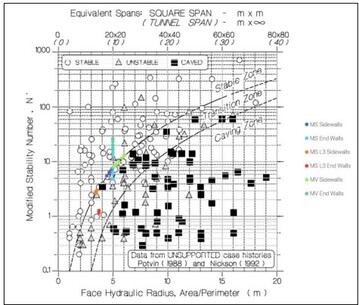
Figure 16-16: | Stability Graph Results – Horseshoe | 194 |
Figure 16-17: | Stability Graph Results – Palomino | 195 |
Figure 16-18: | Stability Graph Results – Ledbetter | 195 |
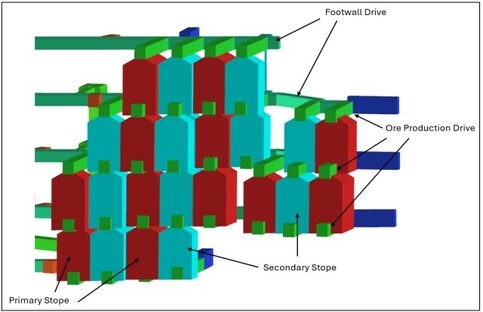
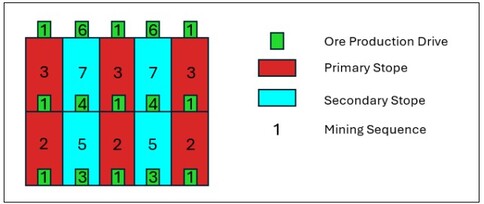
Figure 16-19: | Long Hole Stoping Method Schematic | 200 |
Figure 16-20: | Typical Stoping Sequence | 200 |
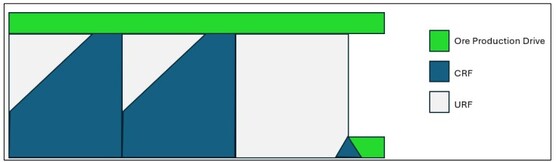
Figure 16-21: | Typical Secondary Stope Line Backfill | 201 |
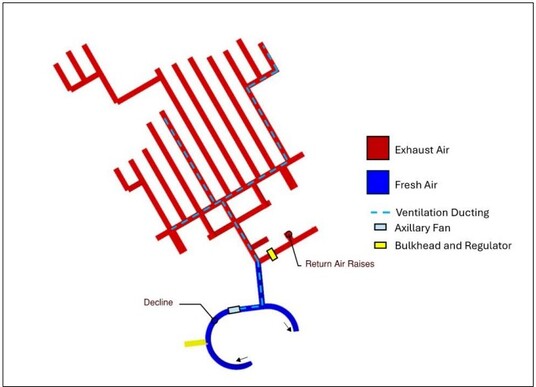
Figure 16-22: | Typical Level Ventilation Overview | 203 |
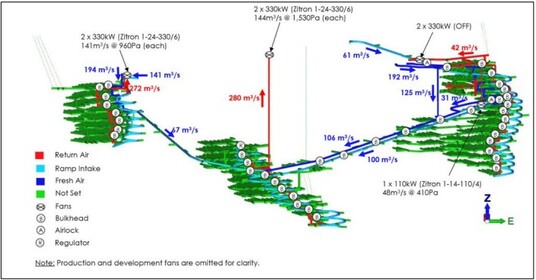
Figure 16-23: | Underground Life of Mine Ventilation Model | 204 |
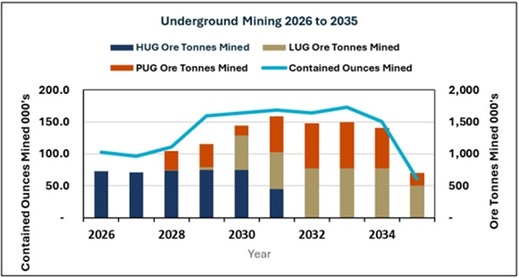
Figure 16-24: | Annual Underground Ore Production Schedule | 205 |
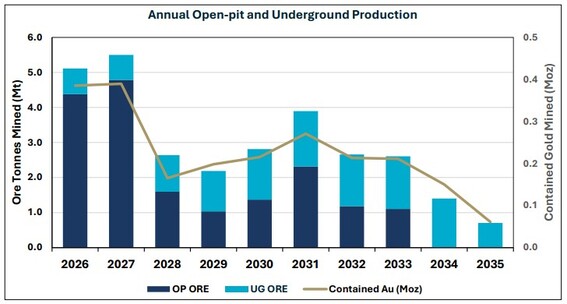
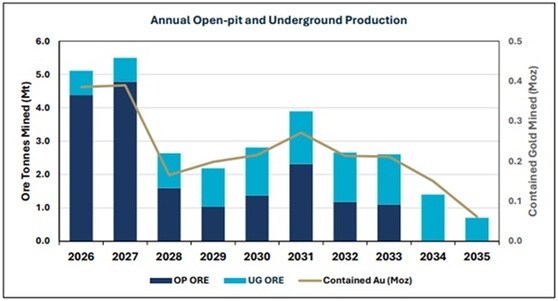
Figure 16-25: | Annual Open Pit and Underground Production | 208 |
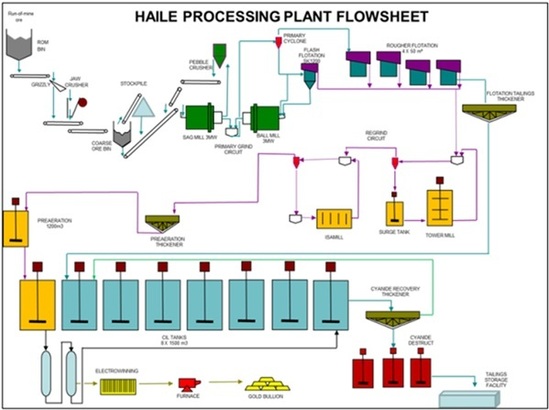
Figure 17-1: | Haile Process Flow Sheet | 213 |
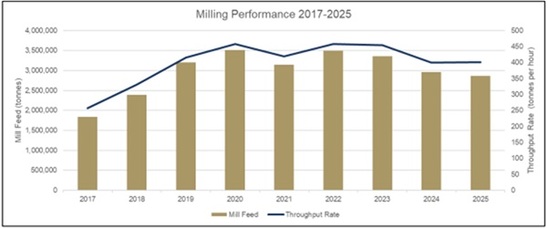
Figure 17-2: | Mill Throughput Performance Since Startup | 214 |
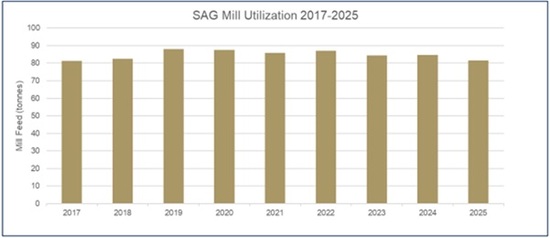
Figure 17-3: | SAG Mill Utilization Since Startup | 215 |
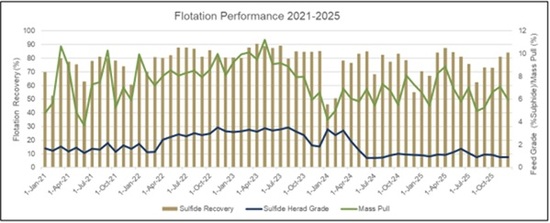
Figure 17-4: | Flotation Circuit Recovery | 216 |
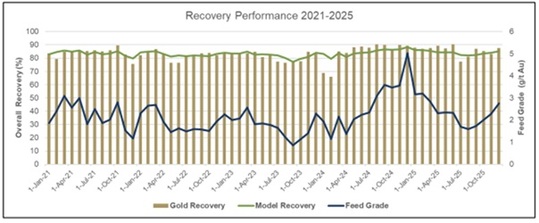
Figure 17-5: | Gold Recovery Performance 2021-2025 | 217 |
Figure 17-6: | Process and Gold Production Schedule | 217 |
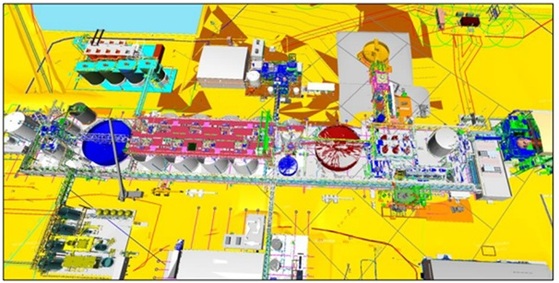
Figure 17-7 | Proposed new Concentrate Leach CIP circuit location | 220 |
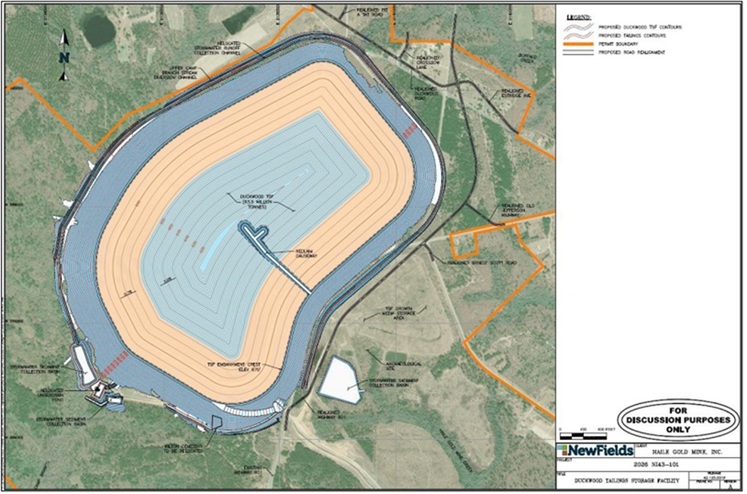
Figure 18-1: | Tailing Storage Facility Layout | 222 |
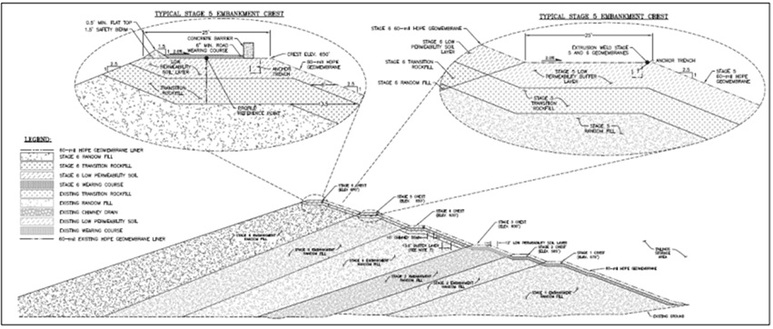
Figure 18-2: | Tailing Storage Facility Typical Section | 223 |
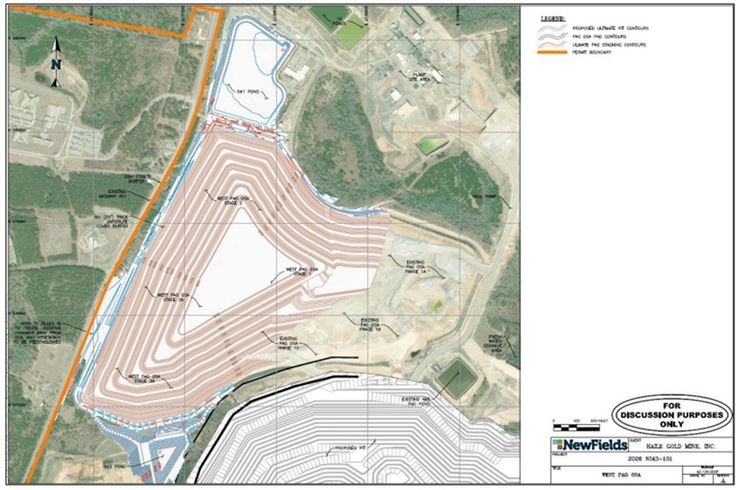
Figure 18-3: | West PAG Overburden Storage Area | 225 |
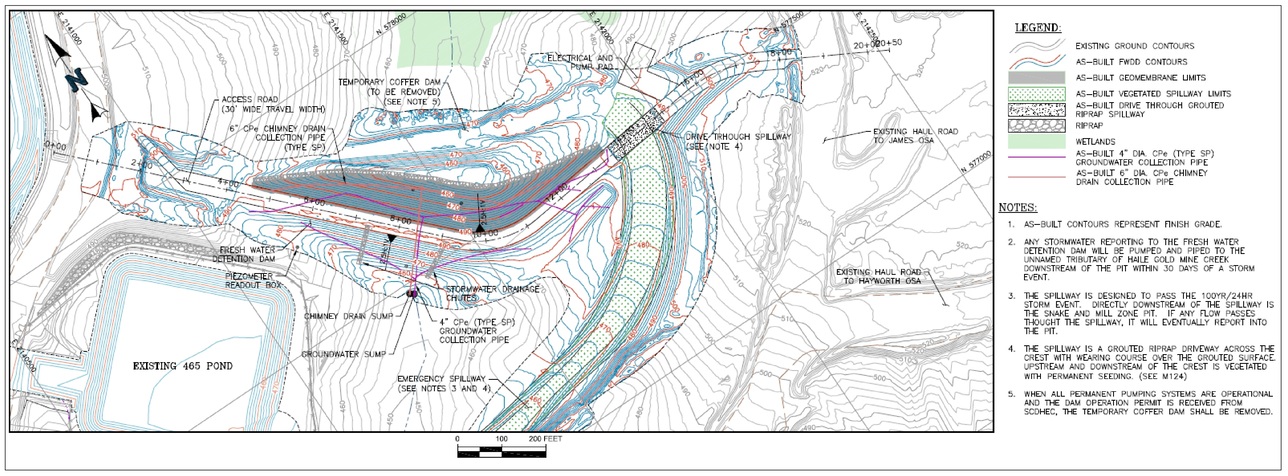
Figure 18-4: | As Built Fresh Water Storage Dam | 227 |
| | | | | | | | |
Released: March 27, 2026 | | Page 17 of 275 |
| | | | | | | | |
NI 43-101 Technical Report – Haile Gold Mine, South Carolina, United States |
| |
| |
| | | | | | | | | | | |
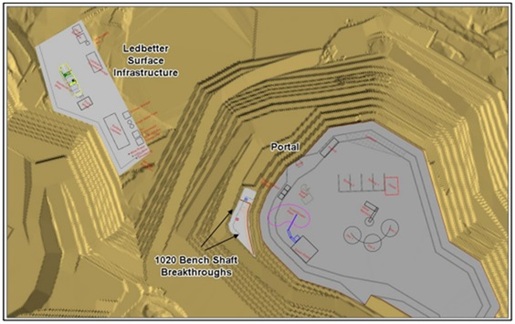
Figure 18-5: | Underground Surface Infrastructure Detail | 230 |
Figure 18-6: | Proposed Ledbetter Underground Surface Infrastructure | 230 |
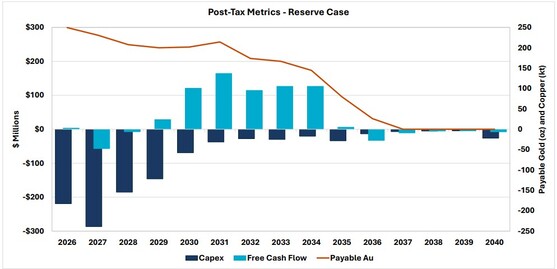
Figure 22-1: | Project After-Tax Metrics Summary | 242 |
Figure 22-2: | Operational Sensitivity Analysis | 244 |
Figure 22-3: | Gold Price Sensitivity Analysis | 245 |
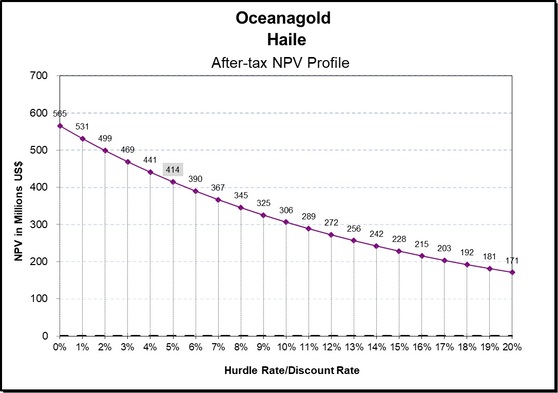
Figure 22-4: | Discount Rate Sensitivity Analysis | 246 |
Appendices
| | | | | |
Appendix A: Certificates of Qualified Persons | 246 |
| | | | | | | | |
Released: March 27, 2026 | | Page 18 of 275 |
| | | | | | | | |
NI 43-101 Technical Report – Haile Gold Mine, South Carolina, United States |
| |
| |
1Summary
OceanaGold Corporation (OceanaGold) has prepared this National Instrument 43-101 (NI 43-101) Technical Report (Technical Report) on the Haile Gold Mine (Haile or Project) to support disclosures in OceanaGold’s Annual Information Form for the year (Y) ended December 31, 2025.
This report includes both open pit (OP) and underground (UG) mining components and a single economic analysis based on Mineral Reserves. Underground mining components include previously reported Horseshoe Underground (HUG) and Palomino Underground (PUG). This report also includes technical data from a Feasibility Study (FS) to support the initial Mineral Reserve for the Ledbetter Underground (LUG), first reported in the OceanaGold Mineral Reserve Statement for End of Year 2025.
1.1Property Description, Location, Access and Ownership
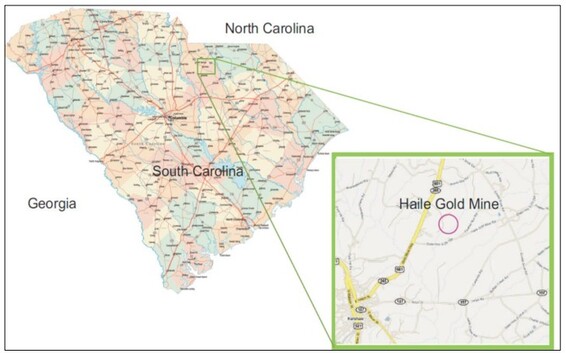
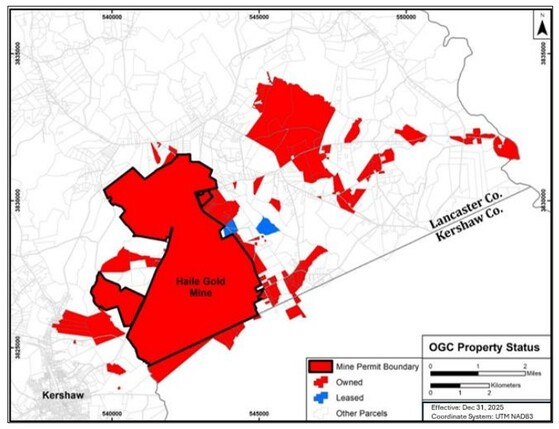
The Haile Gold Mine is located 5 kilometres (km) northeast of Kershaw in southern Lancaster County, South Carolina. It is 30 km southeast of Lancaster, the county seat, and 80 km northeast of Columbia, the state capital of South Carolina. As of December 31, 2025, Haile Gold Mine Inc. (HGM) owns a total of 10,978 acres in South Carolina. Of this total, 5,469 acres are within the mine permit boundary.
The Haile property is accessible by U.S. Highway 601, with the main access via Snowy Owl Road.
The Haile Gold Mine, (HGM), is 100% (percent) owned and operated by OceanaGold through its wholly owned subsidiary. HGM owns or controls all land associated with Haile and within the mining permit boundary. Its interest in the properties includes surface, water and mineral rights with no associated royalties, and is free of all claims and access restrictions.
1.2History
Haile is situated in the Carolina Terrane, which was the location of the first gold (Au) rush in the U.S. in the early 1800’s. Gold was first discovered in 1827 near Haile in the gravels of Ledbetter Creek (now the Haile Gold Mine Creek (HGMC)), which led to placer mining and prospecting until 1829.
In 1882, a sixty-five-stamp mill was constructed and operated continuously until 1908. From mid-1937 to 1942, larger scale mining was undertaken on site by the Haile Gold Mines Company and was shut down in 1942 because of World War II. By this time, the Haile Gold Mine had produced over US$6.4 million worth of gold (in 1940 U.S. dollars).
Between 1981 and 1985, Piedmont Land and Exploration Company (later Piedmont Mining Company (Piedmont)) explored the historic Haile Gold Mine and surrounding properties. Piedmont mined the Haile deposits from 1985 to 1992, producing 85,000 ounces (oz) of gold from open pit heap leach operations that processed oxide and transitional ores.
In May 1992, Amax Gold Inc. (Amax) and Piedmont entered into a joint venture agreement and established the Haile Mining Company (HMC). At the end of the Amax / HMC program in 1994, a gold reserve estimate was prepared, but due to unfavourable economic conditions at the time, Amax did not proceed with mining.
| | | | | | | | |
Released: March 27, 2026 | | Page 19 of 275 |
| | | | | | | | |
NI 43-101 Technical Report – Haile Gold Mine, South Carolina, United States |
| |
| |
Kinross Gold Corporation (Kinross) acquired Amax in 1998, assumed Amax’s portion of the HMC joint venture and later purchased Piedmont’s interest. Kinross decided not to reopen the mine.
Romarco Minerals, Inc. (Romarco or RMI) acquired the Haile property from Kinross in October 2007. It completed a confirmation drilling program and began infill and exploration drilling programs during its ownership.
OceanaGold acquired Haile through the acquisition of Romarco in 2015 and commenced commercial production in early 2017.
1.3Geological Setting, Mineralization and Deposit Types
1.3.1Geology
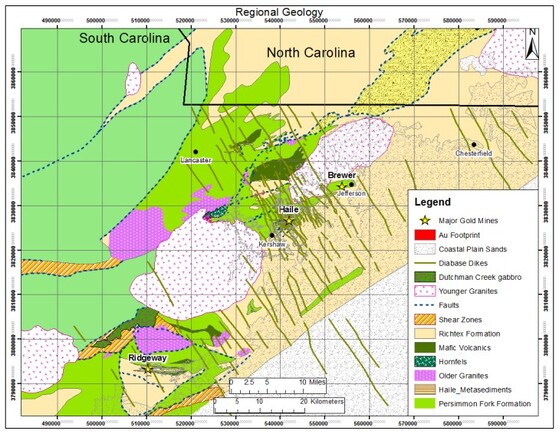
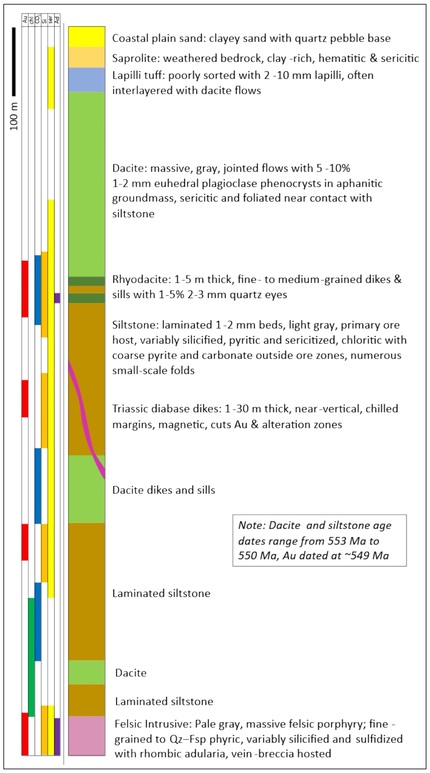
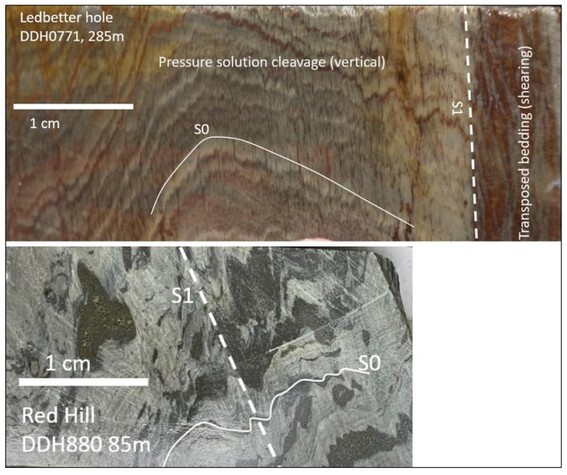
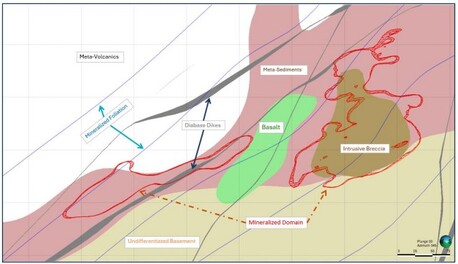
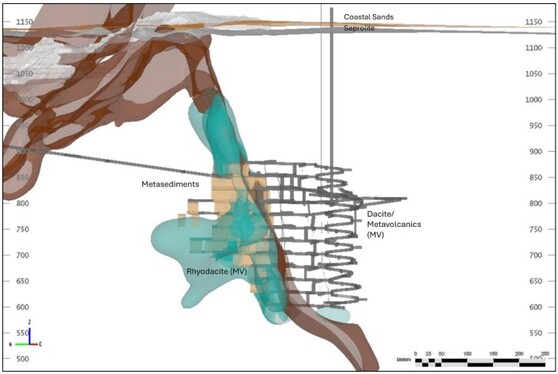
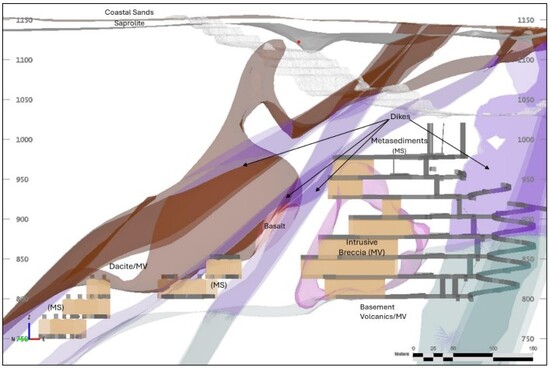
Haile is the largest operating gold mine in the eastern U.S. It is situated within the northeast-trending Carolina Terrane, also known as the Carolina Slate Belt, which hosts the past-producing Ridgeway, Brewer, and Barite Hill gold mines in South Carolina. Mineralization at Haile is currently interpreted as a structurally modified, low-sulfidation, disseminated gold deposit. The Haile property consists of eleven gold deposits within a 4 km x 1 km area. The deposits occur within a variably deformed ENE-trending structural zone at or near the contact between metamorphosed Neoproterozoic volcanic and sedimentary rocks. The deposits are hosted in metamorphosed laminated siltstones and volcanic rocks of the Upper Persimmon Fork Formation and are dissected by barren NNW striking diabase dikes. Deformation includes brittle and ductile styles with ENE trending foliation, faults, brecciation, and isoclinal folds. Sedimentary rocks are folded within an ENE trending anticlinorium with a steep SE limb and a gentle NW limb. Foliation dips to NW.
1.3.2Mineralization and Deposit Types
The age of gold mineralization is assumed at ~ (approximately) 549 Ma (mega-annum), based on closely associated molybdenite dated using Rhenium-Osmium (Re-Os) isotopes (Mobley et al., 2014), which postdates peak volcanism. Pressure shadows around pyrite grains, stretched pyrite and pyrrhotite grains, and flattened hydrothermal breccia (brecciated rocks) clasts indicate that some deformation has occurred subsequent to sulphide mineralization whereas the bulk geometry and orientation of the deposits is difficult to reconcile with pre-folding emplacement. The Re-Os date coincides with a major tectonostratigraphic change from intermediate volcanism and tuffaceous to epiclastic sedimentation to basinal turbiditic sedimentation. Quartz-sericite-pyrite (QSP) alteration is overprinted by regional greenschist facies metamorphism with carbonate-chlorite-pyrite alteration.
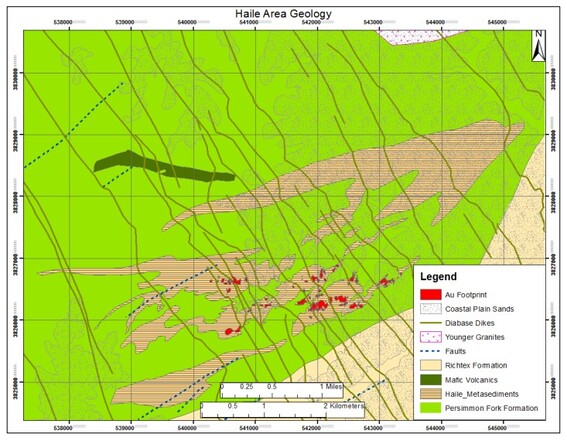
Haile gold mineralization occurs as an en-echelon 4 km long x 1 km wide cluster of northeast-striking moderately to steeply dipping ore lenses. Ore body geometry, depth, size, grade, mineralogy and alteration vary between deposits and is strongly controlled by post-mineral shearing and rotation. Some of the deposits coalesce, especially in the central part of the district around the large Ledbetter deposit. Ore lenses are typically 50 to 300 metres (m) long, 20 to 100 metres wide, and 5 to 30 m thick. Gold mineralization is mostly hosted by laminated siltstone and intermediate volcanics of the upper Persimmon Fork Formation and is overlain by volcanic rocks. Mineralization is typically within 100 m of the main sediment volcanic contact. Haile is currently interpreted as a tectonically modified, low-sulfidation, disseminated gold deposit.
| | | | | | | | |
Released: March 27, 2026 | | Page 20 of 275 |
| | | | | | | | |
NI 43-101 Technical Report – Haile Gold Mine, South Carolina, United States |
| |
| |
1.4Mineral Permits and Regulatory Matters
Haile is subject to the Haile Mine Operating Permit, SCDES 401 Water Quality Certification, National Pollutant Discharge Elimination System (NPDES) permit, Title V Air Quality permit, and the permit under Section 404 of the Clean Water Act (404 Permit). The current permits for Haile expire in December 2039.
HGM owns or controls all land associated with Haile and within the mining permit boundary. Its interest in the properties includes surface, water and mineral rights with no associated royalties, and is free of all claims and access restrictions.
Haile is relatively unique in that mining occurs wholly on private land owned by HGM and does not impact federal or public (United States Department of the Interior Bureau of Land Management (USBLM) or United States Forest Service (USFS)) lands that would be subject to modifications from these surface management agencies.
In May 2018, HGM applied to the United States Army Corps of Engineers (USACE) to initiate the National Environmental Policy Act (NEPA) process and launch a Supplemental Environment Impact Statement (SEIS). The USACE has jurisdictional responsibility for all waters of the U.S. and works cooperatively with the U.S. Environmental Protection Agency (EPA) and South Carolina Department of Environmental Services (formerly the South Carolina Department of Health and Environmental Control) (SCDES) for modifications that have impacts to wetlands, groundwater and surface water conditions, and air emissions. HGM submitted a Project Description, Alternatives Analysis, and additional technical reports in support of this application. These technical reports covered a wide range of matters, including impact assessments to the wetlands, air, land, vegetation, groundwater, surface water, flora and fauna, cultural heritage sites, socioeconomic conditions, and reclamation plans.
To adjust current and supplemental mine plans, a modified application of the 404 Permit under the Clean Water Act of 1972 was submitted in the Q4 2020. The final SEIS was published in August 2022. The Supplemental Environmental Impact Statement Record of Decision (SEIS ROD) and modified 404 Permit were received in December 2022. Various permitting approvals and certifications were also required from SCDES, including modification of the Haile Mine Operating Permit, which was received in December 2022, and 401 Water Quality Certification which was received in November 2022. Other federal and state agencies included in the review process during the SEIS included EPA, United States Fish and Wildlife Service, South Carolina Department of Natural Resources, South Carolina State Historic Preservation Office, South Carolina Department of Transportation and Catawba Indian Nation. The NEPA process also allows non-government or civil society groups (NGOs) and other interested parties an opportunity for review and comment on the anticipated impacts.
Since December 2022, SCDES has approved two additional modifications to the Haile Mine Operating Permit. An expansion of the Horseshoe Underground operation was approved on February 21, 2024, and the Palomino Underground operation was approved on March 15, 2024. The permit modification for the method of mining change for Ledbetter Phase 4 to an underground is classed as a minor modification and is expected to be completed in 2027 before mining takes place in 2028.
| | | | | | | | |
Released: March 27, 2026 | | Page 21 of 275 |
| | | | | | | | |
NI 43-101 Technical Report – Haile Gold Mine, South Carolina, United States |
| |
| |
1.5Exploration
Geologic mapping and surface sampling are key tools for exploration at Haile despite the fact that mapping is challenged by poor bedrock exposure due to extensive saprolitic weathering, Coastal Plains Sands (CPS) cover, and dense vegetation.
Historical mapping has been scanned and loaded into three-dimensional (3D) software for structural interpretation, exploration planning, and geologic modeling. The use of the structural dataset in conjunction with the drilling dataset has provided the foundation for a 3D digital geologic model. Over 5,000 surface samples have been compiled based on location, sample type (rock chip, saprolite (Sap), soil, stream sediment), rock type, alteration, and assay to further the geological knowledge. However, quality analysis / quality control (QA/QC) data were generally lacking for these surface samples, and most were assayed only for gold.
In 2016, HGM conducted proprietary inversion modeling to depths of 1,500 m using airborne magnetic and electromagnetic (EM) data. In 2023, HGM engaged a third party to reprocess previous surface induced polarization (IP) / resistivity data and to perform additional downhole IP surveys.
1.6Drilling
Resource definition drilling at Haile by Romarco and subsequently OceanaGold has significantly increased the resources since 2007. Reserve growth has resulted from continued drilling, project development, and higher gold prices. Initial Mineral Reserves for Horseshoe and Palomino undergrounds were declared in 2017 and 2023, respectively. This Technical Report includes an initial Mineral Reserve for Ledbetter Underground which replaces Ledbetter Phase 04 open pit.
The Haile database includes 3,754 holes in the Haile district which are securely stored in an acQuire database. Drillhole collar locations, downhole surveys, geological logs, geotechnical logs, density values and assays have been verified and used to build 3D geological models and are used for grade and tonnage interpolations. Geologic interpretation is based on structure, lithology, and alteration as logged in the drillholes. Robust geological models enable better prediction of the nature and behaviour of the disseminated style of gold mineralization at Haile. Resource drilling at Haile has predominantly been conducted by core and RC drilling, with drillhole spacing typically ranging from 25 to 40 m. Hole depths have ranged from 50 to 700 m. Sample interval lengths average 1.5 m and can vary based on geological logging. QA/QC results were validated from assay labs and showed excellent precision and accuracy relative to certified reference materials (CRMs).
1.7Sampling, Analysis and Data Verification
Drill core is cleaned, measured, and photographed at HGM’s on-site core shed. Geotechnical and geologic logging are completed on the whole core. All logging and sampling handling is conducted by HGM personnel. Data collecting during core logging includes structure, rock type, alteration, mineralogy, Rock Quality Designation (RQD), core recovery, hardness, and joint condition. Standardized templates are used for logging consistency. HGM’s geologists routinely review core together and compare notes to ensure accuracy and continuous improvement.
Density samples are collected every ten metres and use the water immersion method to measure specific gravity. Competent core at Haile does not require plastic or wax coatings for density measurements. Sample collection, preparation, and analysis are according to industry standards.
| | | | | | | | |
Released: March 27, 2026 | | Page 22 of 275 |
| | | | | | | | |
NI 43-101 Technical Report – Haile Gold Mine, South Carolina, United States |
| |
| |
Core is primarily prepared and assayed at the independent ALS Limited (ALS) laboratory in Tucson, Arizona and Reno, Nevada, U.S., both of which are ISO-9001 certified and 17025 accredited. At times, samples have been prepared and assayed by HGM’s Kershaw Mineral Lab (KML) facility in Kershaw, South Carolina and the independent Alfred H. Knight (AHK) Geochem preparation facility in Spartanburg, South Carolina.
Certified Standards are routinely inserted at a rate of one in 20 samples (5%). Standards used are purchased from and certified by Rocklabs. Blanks are routinely inserted at a rate of one in 20 samples (5%). Such blanks include commercially available marble, sand, and quartz pebble.
Core, pulp, and reverse circulation (RC) samples are stored securely. Sample transport is by HGM personnel between secure facilities and by approved couriers to external labs. No significant risks have been identified for sample contamination or sample exchange.
All Haile drillhole data (assays, logs, surveys) are stored in a secure acQuire database which is managed by HGM’s senior database geologist. Assay data are imported by HGM’s exploration and geology personnel and checked by HGM’s senior database geologist. Strict data importing and verification protocols are followed to avoid, for example, overlapping or missing intervals, mismatched hole depths in different fields, duplicate hole IDs, or sample numbers and invalid logging codes.
1.8Mineral Processing and Metallurgical Testing
Samples of ore have been collected by HGM for metallurgical testing since 2010, which indicates that the ore will respond to flotation and direct agitated cyanide leaching technology to extract gold.
Laboratory testing on ore composite samples demonstrated that the mineralization was readily amenable to flotation and cyanide leaching process treatment. A conventional flotation and cyanide leaching flow sheet was subsequently used as the basis of process design.
Comminution testwork on mineralized samples was performed by the independent Resource Development, Inc. (RDi), ALS Global, and Société Générale de Surveillance (SGS) laboratories. Tests included Bond work indices (Wi), SAG Mill Comminution (SMC), and JK Drop Weight impact testing. The results of the test work were used for additional power modeling to predict circuit throughputs with a modified SAG–Ball Mill-Pebble Crusher (SABC) grinding circuit that was subsequently commissioned in 2018. Testwork on core samples of the remaining open pit reserve indicate an increase in competency and hardness at depth to levels similar to that observed in the Horseshoe, Palomino, and Ledbetter UG deposit testwork.
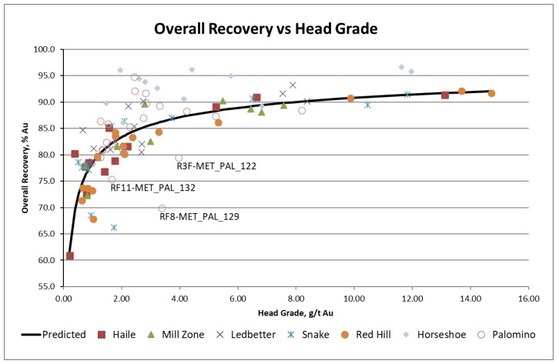
The relative low variability of test work indicates that the different mineralized zones are similar in terms of ore grindability, mineral composition, and flotation and cyanide leaching response. Overall gold recovery will be in the range of 65% to 92% dependent primarily on head grade to the mill and less related to which zone the ore is mined from.
The data developed in the test programs has been used to establish a relationship between overall gold recovery and head grade. Operating experience and metallurgical development programs have indicated this relationship is valid over the life-of-mine (LoM).
| | | | | | | | |
Released: March 27, 2026 | | Page 23 of 275 |
| | | | | | | | |
NI 43-101 Technical Report – Haile Gold Mine, South Carolina, United States |
| |
| |
Testing of core samples from the Horseshoe and Palomino deposits has been undertaken using the same laboratory flowsheet that correlates well with plant performance. Overall results suggest these deposits will respond well to processing in the existing process plant without modification.
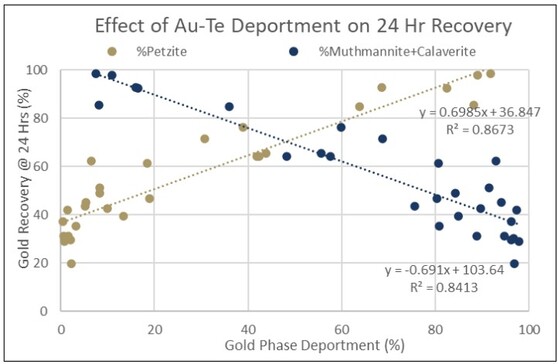
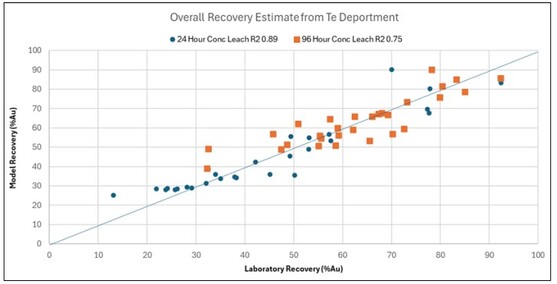
Testwork undertaken on the Ledbetter UG Resource has indicated that the Intrusive Breccia domain has a significantly different deportment of gold which is present in a number of telluride minerals rather than native gold inclusions. The testwork program has indicated an increase in leach residence time from the current 36 hours to 96 hours can significantly offset the impact of the telluride leach kinetics and return acceptable leach recoveries compared to the performance of metasediment (MS) hosted ore domains. Detailed design for the plant modification will be completed in 2026 and construction and commissioning completed in early 2028 with the capital costs incorporated into the LoM capital costs used in the economic analysis.
1.9Mineral Resources Estimate
The Mineral Resources and their classification have been prepared in accordance with the Canadian Institute of Mining, Metallurgy and Petroleum (CIM) Standards on Mineral Resources and Reserves: Definitions and Guidelines, May 10, 2014 (CIM, 2014). Mineral Resources, which are inclusive of Mineral Reserves, are reported in accordance with NI 43-101 – Standards of Disclosure for Mineral Projects. Mineral Resources that are not Mineral Reserves do not have demonstrated economic viability. It is reasonably expected that the majority of Inferred Mineral Resources could be upgraded to Indicated Mineral Resources with continued exploration; however, there is no certainty that Mineral Resources that are not Mineral Reserves will be converted into Mineral Reserves.
OceanaGold has a comprehensive Resource governance process in place, including model validation, peer review, external review, and model to mine to mill reconciliation. OceanaGold continues to develop and improve these processes.
The Resource estimates are based on drilling up to October 2025, interpreted lithologies, and geologic controls. Assays for gold supporting Resource drilling are comprehensive. However, the collection of silver, carbon, and sulfur (S) assay data has largely been retrospective and is significantly sparser than for gold. Sulfur and carbon data are primarily used for the prediction of overburden classification types. Sulfur grades are also used for mill feed sulfur estimates. Silver grade estimates are provided for metallurgical considerations (carbon stripping and electro-winning) as well as for revenue estimation, albeit silver is a minor contributor to revenue. Gold estimation was constrained within implicitly modeled grade shells. Model block estimates for post mineralization dikes were assigned zero gold grades post estimation. Metasediment / metavolcanic (MV) contacts were not used to constrain gold estimation. These approaches are supported by relationships between mineralization, bedding, and dikes observed in open pit grade control sample data. In situ dry densities are based upon lithologically grouped immersion determinations from core samples.
For the open pit estimate, grades were estimated into 10 m E x 10 m N x 5 m RL (reduced level) blocks using 2.5 m composites within the implicit grade domain. Grade estimation was completed in VulcanTM software, using Multiple Indicator Kriging (MIK) to produce E-Type estimates for gold. Top caps of 50 g/t (grams per tonne) Au were used to temper mean grades for the top indicator class threshold.
| | | | | | | | |
Released: March 27, 2026 | | Page 24 of 275 |
| | | | | | | | |
NI 43-101 Technical Report – Haile Gold Mine, South Carolina, United States |
| |
| |
Ordinary Kriging (OK) was used for silver, sulfur and carbon estimates, given the sparser data coverage.
For the underground estimates gold grades were estimated with VulcanTM modeling software into parent 10 m E x 10 m N x 10 m RL blocks (all sub-blocked for better volumetric determination) using OK with 3 m domained composites.
The reported open pit and underground Mineral Resources are classified as Indicated and Inferred Mineral Resources, based primarily on drillhole spacing but also considering kriging variance, slope regression, and geological complexity.
1.9.1Combined Open Pit and Underground Resource Estimate
Table 1-1 presents the combined open pit, stockpiles, and underground Resource statement for the Haile Property.
| | | | | | | | |
Released: March 27, 2026 | | Page 25 of 275 |
| | | | | | | | |
NI 43-101 Technical Report – Haile Gold Mine, South Carolina, United States |
| |
| |
Table 1-1: Haile Open Pit and Underground Resource Statement as of December 31, 2025
| | | | | | | | | | | | | | | | | | | | | | | | | | | | | | | | | | | | | | | | | | | | | | | | | | | | | | | | | | | | | | | | | | | | | | | | | | |
Gold | Measured | | Indicated | | Measured & Indicated | | Inferred | |
Tonnes (Mt) | | Au (g/t) | | Contained Ozs (Moz) | | Tonnes
(Mt) | | Au (g/t) | | Contained Oz (Moz) | | Tonnes
(Mt) | | Au (g/t) | | Contained Oz (Moz) | | Tonnes
(Mt) | | Au (g/t) | | Contained Ozs (Moz) | |
Haile | |
Horseshoe Underground | 1.98 | | | 5.11 | | | 0.33 | | | 2.76 | | | 5.11 | | | 0.45 | | | 4.74 | | | 5.11 | | | 0.78 | | | 0.5 | | | 2.7 | | | 0.0 | | |
Palomino Underground | - | | | - | | | - | | | 4.19 | | | 3.38 | | | 0.45 | | | 4.19 | | | 3.38 | | | 0.45 | | | 0.8 | | | 2.5 | | | 0.1 | | |
Ledbetter Underground | - | | | - | | | - | | | 4.07 | | | 4.12 | | | 0.54 | | | 4.07 | | | 4.12 | | | 0.54 | | | 1.2 | | | 2.9 | | | 0.1 | | |
Open Pits | 2.58 | | | 1.21 | | | 0.10 | | | 16.1 | | | 1.64 | | | 0.85 | | | 18.7 | | | 1.58 | | | 0.95 | | | 0.6 | | | 0.9 | | | 0.0 | | |
Haile Total | 4.56 | | | 2.91 | | | 0.43 | | | 27.1 | | | 2.63 | | | 2.30 | | | 31.7 | | | 2.67 | | | 2.72 | | | 3.1 | | | 2.4 | | | 0.2 | | |
Silver | Measured | | Indicated | | Measured & Indicated | | Inferred | |
Tonnes (Mt) | | Ag (g/t) | | Contained Ozs (Moz) | | Tonnes (Mt) | | Ag (g/t) | | Contained Ozs (Moz) | | Tonnes (Mt) | | Ag (g/t) | | Contained Ozs (Moz) | | Tonnes (Mt) | | Ag (g/t) | | Contained Ozs (Moz) | |
Haile | |
Horseshoe Underground | 1.98 | | | 1.9 | | | 0.1 | | | 2.8 | | | 2.1 | | | 0.2 | | | 4.7 | | | 2.0 | | | 0.3 | | | 0.5 | | | 1.0 | | | 0.0 | | |
Palomino Underground | - | | | - | | | - | | | 4.2 | | | 2.8 | | | 0.4 | | | 4.2 | | | 2.8 | | | 0.4 | | | 0.8 | | | 2.1 | | | 0.1 | | |
Ledbetter Underground | - | | | - | | | - | | | 4.1 | | | 12 | | | 1.6 | | | 4.1 | | | 12 | | | 1.6 | | | 1.2 | | | 7.5 | | | 0.3 | | |
Open Pits | 2.58 | | | 2.2 | | | 0.2 | | | 16 .1 | | 2.5 | | | 1.3 | | | 18.7 | | | 2.5 | | | 1.5 | | | 0.6 | | | 2.4 | | | 0.0 | | |
Haile Total | 4.56 | | | 2.0 | | | 0.3 | | | 27.1 | | | 4.0 | | | 3.5 | | | 31.7 | | | 3.7 | | | 3.8 | | | 3.1 | | | 4.0 | | | 0.4 | | |
Source: OceanaGold, 2025
•Mineral Resources are reported inclusive of Mineral Reserves and are reported on an in situ basis. Mineral Resources that are not Mineral Reserves do not have demonstrated economic viability.
•All Mineral Resources are based on metal prices of US$ (United States Dollar) 2,450/oz gold, US$4.50/lb copper and US$28.50/oz silver.
•It is reasonably expected that most of the Inferred Mineral Resources could be upgraded to Indicated Mineral Resources with continued exploration.
•Open Pit Mineral Resources reported within the Mineral Reserve design pit.
•Open Pit primary cut-off grade (CoG) is 0.50 g/t Au, while oxide CoG is 0.60 g/t Au.
•Underground Mineral Resources are reported within volumes guided by conceptual stope designs which are based upon economic assumptions above and exclude dilution.
•Horseshoe, Ledbetter, and Palomino Underground Mineral Resources at 1.70 g/t Au cut-off.
•All figures are rounded to reflect the relative accuracy and confidence of the estimates and totals may not add correctly.
•The Mineral Resources for the open pits and Horseshoe Underground were estimated under the supervision of Jonathan Moore, MAusIMM CP(Geo) of OceanaGold, a Qualified Person. The Mineral Resources for Palomino Underground and Ledbetter Underground were estimated under the supervision of Douglas Corley, MAIG RPGeo, a QP.
| | | | | | | | |
Released: March 27, 2026 | | Page 26 of 275 |
| | | | | | | | |
NI 43-101 Technical Report – Haile Gold Mine, South Carolina, United States |
| |
| |
1.10Mineral Reserve Estimate
1.10.1Open Pit Mineral Reserves Estimate
Dilution and ore recovery have been applied to the resource block model to account for a portion of mineralized material expected to be mined by face shovel excavators. The resource block model was then used for open pit optimization without further modification, as the block size in the model matched the selective mining unit (SMU) size of 10 m x 10 m x 5 m considered appropriate for the backhoe excavator loading units operating at Haile.
The open pit Mineral Reserves are reported within a pit design based on open pit optimization results (Lerchs-Grossmann algorithm) with a gold price of US$2,200/oz Au and silver price of US$25/oz Ag. Subsequent to pit optimization, inferred material within the final pit design was assigned as waste and given a zero-gold grade. The overall pit slopes (inter-ramp angle slopes) used for the design are based on operational level geotechnical studies and range from 30° to 45° (degrees). This includes a 5° allowance for ramps and geotechnical catch benches.
The open pit area referred to as Ledbetter Phase 4 has been removed from the open pit Mineral Reserve and added to the underground Mineral Reserve based on a trade-off study completed in 2025, which showed that project economics were improved by mining the deposit by underground methods, as well as other improvements including a smoother production profile, reduced waste and tailings storage requirements, and lower total carbon emissions.
Measured Mineral Resources were converted to Proven Mineral Reserves and Indicated Mineral Resources were converted to Probable Mineral Reserves by applying the appropriate modifying factors, as described herein, to potential mining pit shapes created during the mine design process.
The open pit mine design process results in open pit mining Mineral Reserves, including existing stockpiles, of 18.6 million tonnes (Mt) with an average grade of 1.57 g/t Au. The Mineral Reserve statement, as of December 31, 2025, for the Haile Open Pit is presented in Table 1-2.
| | | | | | | | |
Released: March 27, 2026 | | Page 27 of 275 |
| | | | | | | | |
NI 43-101 Technical Report – Haile Gold Mine, South Carolina, United States |
| |
| |
Table 1-2: Haile Open Pit Mineral Reserves Estimate as of December 31, 2025
| | | | | | | | | | | | | | | | | | | | | | | | | | | | | | | | | | | | | | | | | | | | | | | | | | | | | | | | |
Gold | Proven (1) | | Probable | | Proven & Probable | |
Tonnes (Mt) | | Au (g/t) | | Contained Ozs (Moz) | | Tonnes (Mt) | | Au (g/t) | | Contained Ozs (Moz) | | Tonnes (Mt) | | Au (g/t) | | Contained Ozs (Moz) | |
Haile | |
Open Pits | 2.47 | | | 1.23 | | | 0.10 | | | 16.1 | | | 1.62 | | | 0.84 | | | 18.6 | | | 1.57 | | | 0.94 | | |
Haile OP Total | 2.47 | | | 1.23 | | | 0.10 | | | 16.1 | | | 1.62 | | | 0.84 | | | 18.6 | | | 1.57 | | | 0.94 | | |
Silver | Proven (1) | | Probable | | Proven & Probable | |
Tonnes (Mt) | | Ag (g/t) | | Contained Oz (Moz) | | Tonnes (Mt) | | Ag (g/t) | | Contained Oz (Moz) | | Tonnes (Mt) | | Ag (g/t) | | Contained Oz (Moz) | |
Haile | |
Open Pits | 2.47 | | | 2.1 | | | 0.2 | | | 16.1 | | | 2.3 | | | 1.2 | | | 18.6 | | | 2.2 | | | 1.3 | | |
Haile OP Total | 2.47 | | | 2.1 | | | 0.2 | | | 16.1 | | | 2.3 | | | 1.2 | | | 18.6 | | | 2.2 | | | 1.3 | | |
Source: OceanaGold, 2025
(1)Includes 0.8 Mt of stockpile material grading 1.0 g/t Au and 1.0 g/t Ag
•Mineral Reserves are based on a US$2,200/oz Au gold price and US$25/oz Ag silver price.
•Open pit Mineral Reserves are stated using a 0.5 g/t Au cut-off for primary and 0.6 g/t Au cut-off for oxide material.
•Open pit Mineral Reserves include variable dilution and mining recovery that has been applied in the mine schedule to the upper benches of each pit stage to account for assumed mining by face shovel excavator in these areas.
•Metallurgical recoveries for gold are based on a recovery curve for primary material of (1-(0.2152*Au grade^-0.3696)). with +2.5% uplift applied to material > 1.7 g/t Au. Recovery for oxide material is applied at 67%.
•Metallurgical recovery for silver is applied at 70%.
•Mineral Reserves are converted from resources through the process of pit optimization, pit design, production schedule and supported by a positive cash flow model.
•All figures are rounded to reflect the relative accuracy of the estimates. Totals may not sum due to rounding.
•The open pit Mineral Reserves were estimated under the supervision of Gregory Hollett of OceanaGold, a Qualified Person.
Technical risks to the Mineral Reserve have been reviewed and there are two relevant risk areas that have been identified.
A geotechnical risk associated with the south wall of Ledbetter Phase 3 is currently under evaluation and management due to a localized area of instability. Management plans are in the process of being developed for remediation of this area, which will potentially impact the short-term mine schedule and costs. However, this will have relatively minor impact on the long-term mine plan. Therefore, this is not considered to be a material risk to the Mineral Reserve.
The depleted Mill Zone open pit is currently being used for excess water storage. This has the potential to slow or limit access to the Haile Phase 2 open pit, due to the planned mining of the saddle between Haile Phase 1 and Mill Zone. Management plans are in place to remove the water in Mill Zone prior to the planned schedule for mining Haile Phase 2 and is therefore not considered to be a material risk to the Mineral Reserve.
OceanaGold knows of no existing environmental, permitting, legal, socio-economic, marketing, political, or other factors that might materially affect the open pit Mineral Reserve estimate.
1.10.2Underground Mineral Reserves Estimate
The current underground Mineral Reserves consist of three deposits: HUG; LUG; and PUG. These deposits are separated by ~1 km of development and encompass mineralization that extends down at depth and outside the pit extents.
| | | | | | | | |
Released: March 27, 2026 | | Page 28 of 275 |
| | | | | | | | |
NI 43-101 Technical Report – Haile Gold Mine, South Carolina, United States |
| |
| |
Based on the orientation, depth, and geotechnical characteristics of the mineralization, a transverse sublevel open-stoping method (long hole) with ramp access is used for all deposits. The stopes are 15 to 20 m wide at HUG and 15 m wide for LUG and PUG and stope lengths vary based on mineralization grade and geotechnical considerations. A spacing of 25 m between levels is used. Cemented rock fill (CRF), Unconsolidated Rock Fill (URF), and a mixture of the two is planned to be used to backfill the stopes. The CRF has sufficient strength to allow for mining adjacent to backfilled stopes.
The underground mine design process resulted in combined underground mining Mineral Reserves of 7.9 Mt (diluted) with an average grade of 3.56 g/t Au for Horseshoe, Ledbetter, and Palomino. The Mineral Reserve statement, as of December 31, 2025, for the combined underground mines are presented in Table 1-3.
This estimate is based on a mine design cut-off of 1.86 g/t Au. The numbers include a 94% to 100% mining recovery based on type of opening (e.g., stope, development) to the designed wireframes in addition to a 2% to 10% unplanned dilution where the additional material uses a value of zero for the grade of both Au and Ag.
| | | | | | | | |
Released: March 27, 2026 | | Page 29 of 275 |
| | | | | | | | |
NI 43-101 Technical Report – Haile Gold Mine, South Carolina, United States |
| |
| |
Table 1-3: Haile Underground Reserves Estimate as of December 31, 2025
| | | | | | | | | | | | | | | | | | | | | | | | | | | | | | | | | | | | | | | | | | | | | | | | | | | | | | | | |
Gold | Proven | | Probable | | Proven & Probable | |
Tonnes (Mt) | | Au (g/t) | | Contained Ozs (Moz) | | Tonnes
(Mt) | | Au (g/t) | | Contained Ozs (Moz) | | Tonnes
(Mt) | | Au (g/t) | | Contained Ozs (Moz) | |
Haile | |
Horseshoe Underground | 1.52 | | | 4.39 | | | 0.21 | | | 2.63 | | | 4.24 | | | 0.36 | | | 4.14 | | | 4.29 | | | 0.57 | | |
Palomino Underground | - | | | - | | | - | | | 3.62 | | | 2.96 | | | 0.34 | | | 3.62 | | | 2.96 | | | 0.34 | | |
Ledbetter Underground | - | | | - | | | - | | | 4.00 | | | 3.39 | | | 0.44 | | | 4.00 | | | 3.39 | | | 0.44 | | |
Haile UG Total | 1.52 | | | 4.39 | | | 0.21 | | | 10.2 | | | 3.45 | | | 1.14 | | | 11.8 | | | 3.57 | | | 1.35 | | |
Silver | Proven | | Probable | | Proven & Probable | |
Tonnes (Mt) | | Ag (g/t) | | Contained Ozs (Moz) | | Tonnes (Mt) | | Ag (g/t) | | Contained Ozs (Moz) | | Tonnes (Mt) | | Ag (g/t) | | Contained Ozs (Moz) | |
Haile | |
Horseshoe Underground | 1.52 | | | 1.5 | | | 0.1 | | | 2.6 | | | 1.8 | | | 0.2 | | | 4.1 | | | 1.7 | | | 0.2 | | |
Palomino Underground | - | | | - | | | - | | | 3.6 | | | 2.7 | | | 0.3 | | | 3.6 | | | 2.7 | | | 0.3 | | |
Ledbetter Underground | - | | | - | | | - | | | 4.0 | | | 11 | | | 1.3 | | | 4.0 | | | 11 | | | 1.3 | | |
Haile UG Total | 1.52 | | | 1.5 | | | 0.1 | | | 10.2 | | | 5.5 | | | 1.8 | | | 11.8 | | | 5.0 | | | 1.9 | | |
Source: OceanaGold, 2025
•Mineral Reserves are based on a gold price of US$2,200/oz.
•Metallurgical recoveries for gold for Horseshoe and Palomino are based on a recovery curve for primary material of (1-(0.2152*Au grade^-0.3696)). with +2.5% uplift applied to material > 1.7 g/t Au.
•Metallurgical recoveries for Ledbetter Underground are based on a geometallurgical model that correlates recovery with gold mineralogical association.
•The Mineral Reserve estimate is based on a mine design using an elevated cut-off grade of 1.86 Au g/t, with adjacent lower grade stopes included in the design. Incremental material is included in the Mineral Reserves based on an incremental stope cut-off grade of 1.74 g/t Au and an incremental development cut-off grade of 0.59 g/t Au.
•Mining recovery ranges from 94% to 100% depending on activity type. Sill levels use a 75% recovery. Mining dilution is applied using zero grade. The dilution ranges from 2% to 10% unplanned dilution where the additional material uses a value of zero for the grade of both Au and Ag.
•All figures are rounded to reflect the relative accuracy of the estimates. Totals may not sum due to rounding.
•Mineral Reserves have been stated on the basis of a mine design, mine plan, and cash-flow model.
•The Mineral Reserves were estimated under the supervision of by Brianna Drury of OceanaGold, a Qualified Person.
OceanaGold knows of no existing environmental, permitting, legal, socio-economic, marketing, political, or other factors that might materially affect the underground Mineral Reserve estimate.
1.10.3Combined Open Pit and Underground Reserves Estimate
Table 1-4 presents the combined open pit and underground Mineral Reserves statement for Haile.
| | | | | | | | |
Released: March 27, 2026 | | Page 30 of 275 |
| | | | | | | | |
NI 43-101 Technical Report – Haile Gold Mine, South Carolina, United States |
| |
| |
Table 1-4: OP and UG Reserve Statement for Haile Gold Mine as of December 31, 2025
| | | | | | | | | | | | | | | | | | | | | | | | | | | | | |
Gold | Proven (1) | Probable | Proven & Probable |
Tonnes
(Mt) | Au
(g/t) | Contained Ozs (Moz) | Tonnes (Mt) | Au
(g/t) | Contained Ozs (Moz) | Tonnes (Mt) | Au
(g/t) | Contained Ozs (Moz) |
Haile |
Underground | 1.52 | | 4.39 | | 0.21 | | 10.2 | | 3.45 | | 1.14 | | 11.8 | | 3.57 | | 1.35 | |
Open Pits | 2.47 | | 1.23 | | 0.1 | | 16.1 | | 1.62 | | 0.84 | | 18.6 | | 1.57 | | 0.94 | |
Haile Total | 3.99 | | 2.43 | | 0.31 | | 26.3 | | 2.33 | | 1.98 | | 30.3 | | 2.35 | | 2.29 | |
Silver | Proven (1) | Probable | Proven & Probable |
Tonnes
(Mt) | Ag
(g/t) | Contained Ozs (Moz) | Tonnes (Mt) | Ag
(g/t) | Contained Ozs (Moz) | Tonnes (Mt) | Ag
(g/t) | Contained Ozs (Moz) |
Haile |
Underground | 1.52 | | 1.5 | | 0.1 | | 10.2 | | 5.5 | | 1.8 | | 11.8 | | 5.0 | | 1.9 | |
Open Pits | 2.47 | | 2.1 | | 0.2 | | 16.1 | | 2.3 | | 1.2 | | 18.6 | | 2.2 | | 1.3 | |
Haile Total | 3.99 | | 1.9 | | 0.2 | | 26.3 | | 3.5 | | 3.0 | | 30.3 | | 3.3 | | 3.2 | |
Source: OceanaGold
(1) Includes 0.8 Mt of stockpile material grading 1.0 g/t Au and 1.0 g/t Ag
•Mineral Reserves are based on a gold price of US$ 2,200/oz Au and silver price of US$25/oz Ag.
•Metallurgical recoveries are based on a recovery curve for primary material of (1-(0.2152*Au grade^-0.3696)) with +0.025% uplift applied to material > 1.7 g/t Au. Recovery for oxide material is applied at 67%. .
•Metallurgical recoveries for Ledbetter Underground are based on a geometallurgical model that correlates recovery with gold mineralogical association.
•Overall metallurgical recovery for gold equates to 82.7%.
•Metallurgical recovery for silver is applied at 70%.
•Open pit Mineral Reserves are stated using a 0.5 g/t Au cut-off for primary and 0.6 g/t Au cut-off for oxide material. Open pit Mineral Reserves include variable dilution and mining recovery that has been applied in the mine schedule to the upper benches of each pit stage to account for assumed mining by face shovel excavator in these areas.
•Underground Mineral Reserves are based on a mine design using an elevated cut-off grade of 1.86 Au g/t, with adjacent lower grade stopes included in the design. Incremental material is included in the Mineral Reserves based on an incremental stope cut-off grade of 1.74 g/t Au and an incremental development CoG of 0.59 g/t Au. Mining recovery ranges from 94% to 100% depending on activity type. Sill levels use a 75% recovery. Mining dilution is applied using zero grade. The dilution ranges from 2% to 10% depending on activity type.
•All figures are rounded to reflect the relative accuracy of the estimates. Totals may not sum due to rounding.
•Mineral Reserves have been stated on the basis of a mine design, mine plan, and supported by a positive cash-flow model.
•The open pit Mineral Reserves were estimated under the supervision of Gregory Hollett of OceanaGold, a QP. The underground Mineral Reserves were estimated under the supervision of by Brianna Drury of OceanaGold, a QP.
An underground vs. open pit trade-off study has been completed specifically targeting the mineralization within, and in close proximity to, Ledbetter Phase 4. Results of this study showed that changing the mining method for Ledbetter Phase 4 from an open pit to an underground is economically preferable and delivers increased overall project value. This change is reflected in the overall Mineral Reserves.
| | | | | | | | |
Released: March 27, 2026 | | Page 31 of 275 |
| | | | | | | | |
NI 43-101 Technical Report – Haile Gold Mine, South Carolina, United States |
| |
| |
1.11Mining Methods
1.11.1Open Pit Mining Methods
The open pit at Haile is currently being mined using conventional truck and excavator methods.
The open pit that forms the basis of open pit Mineral Reserves and the Life of Mine, (LoM), production schedule is approximately 2.5 km from east to west, 1.25 km north to south with a maximum depth of 300 m. The design consists of multiple pushbacks with ramp locations targeting saddle points between the pit bottoms and also acting as catch benches for geotechnical purposes. Each bench has at least one ramp for scheduling. Generally, the number of benches mined within a pit phase within a given year fall below the target bench sinking rate of one 10 m bench per month.
Overburden and waste material are classified using blasthole sulfur and carbon assays that inform the routing and placement of materials. “Red” potentially acid generating (PAG) material is sent to geomembrane-lined facilities where the material is placed in lifts and compacted by haulage trucks. “Yellow” PAG can be stored in a lined facility or below a prescribed water table level within pits. “Yellow” material in-pit will be mixed with lime during placement in the pit void. “Green” non-PAG material can be placed in unlined facilities or used for construction. Figure 1-1 illustrates the site layout and final pit design.
Source: OceanaGold, 2025
•Current Phases (Blue), in-pit waste storage (yellow) and Final LOM Ex-Pit Facilities – PAG cell (red) and green waste OSA (green)
Figure 1-1: Final Pit Design and Site Layout
Open pit ore production rates are targeted to balance processing rates with underground production and stockpile balance. Processed tonnes average approximately 2.9 million metric
| | | | | | | | |
Released: March 27, 2026 | | Page 32 of 275 |
| | | | | | | | |
NI 43-101 Technical Report – Haile Gold Mine, South Carolina, United States |
| |
| |
tonnes per year (Mt/yr) over LoM. Total open pit fleet material movement, including rehandle, peaks at 38 Mt/yr in 2027 before reducing through to the end of the open pit mine life as underground production becomes the primary feed source for the processing plant. The mine production schedule (Mined + Rehandle) is summarized in the note section in Figure 1-2.
Source: OceanaGold, 2025
•Rehandle includes open pit ore (stockpile to ROM), open pit waste (temporary in-pit to final destination), Underground ore, and waste (portal to final destination)
Figure 1-2: LoM Production Schedule
The open pit loading and hauling equipment fleet consists of hydraulic excavators (Komatsu PC3000 and PC4000 models) and rigid frame haul trucks (Komatsu 730E). Blasthole drilling and wall control drilling is performed with a fleet of Sandvik DR410i and Sandvik Leopard DI650i drills.
Typical ancillary equipment, including small hydraulic excavators, track dozers, wheel dozers, motor graders, water trucks, and small rigid dump trucks (Caterpillar (Cat) 785) for rehandle support the mining operation. Table 1-5 shows the major equipment required annually to achieve the mine schedule.
Table 1-5: Major Equipment Required to Achieve the Mine Schedule
| | | | | | | | | | | | | | | | | | | | | | | | | | | | | |
Machine Type | 2026 | | 2027 | | 2028 | | 2029 | | 2030 | | 2031 | | 2032 | | 2033 | | |
PC4000 Excavator | 2 | | 2 | | 2 | | 1 | | 1 | | 1 | | 1 | | 1 | | |
PC3000 Excavator | 1 | | 1 | | 1 | | 1 | | 1 | | 1 | | 1 | | 1 | | |
Cat 6020B Excavator | 1 | | 1 | | 1 | | 1 | | 1 | | 1 | | 1 | | 1 | | |
Komatsu 730E Trucks | 19 | | 19 | | 17 | | 11 | | 8 | | 8 | | 7 | | 5 | | |
Sandvik Leopard DI650i | 7 | | 7 | | 6 | | 6 | | 6 | | 6 | | 6 | | 2 | | |
Sandvik DR410i Drill | 4 | | 3 | | 1 | | | | | | | |
Source: OceanaGold, 2025
| | | | | | | | |
Released: March 27, 2026 | | Page 33 of 275 |
| | | | | | | | |
NI 43-101 Technical Report – Haile Gold Mine, South Carolina, United States |
| |
| |
1.11.2Underground Mining Methods
Underground mining at Haile is currently being performed via the transverse sublevel open stoping (long hole) method. The Haile underground consists of three deposits that are extensions of the open pit and are named, respectively, Horseshoe, Ledbetter, and Palomino Underground. Access to the three mines will be via portals within the open pits, with Horseshoe via Snake Pit already established, and future Ledbetter via Ledbetter Pit. Palomino will be accessible via a twin decline from Horseshoe and a single decline from Ledbetter Underground.
Stopes are planned to be backfilled with cemented rockfill, unconsolidated rockfill, or a mixture of the two.
The LoM plan uses internal company standards and historic mining rates for the site to establish the schedule and sequence of mining. The latest LoM schedule has underground mining planned to finish in 2035, producing on average 1,600 thousand tonnes (kt) total tonnes per year with two peak years in 2030 and 2031 at just under 2,000 kt total tonnes when all three undergrounds are in full production. Reference Table 1-6 for Haile Underground Annual Production.
All material, both ore and waste, from the underground is hauled out via underground 50 tonne articulated trucks to a surface stockpile where it is then rehandled to its destination via the open pit haulage fleet.
Table 1-6: Haile Underground Annual Production
| | | | | | | | | | | | | | | | | |
Year | Ore Tonnes (kt) | Au (g/t) | Waste Tonnes (kt) | Total Tonnes (kt) | |
2026 | 734 | | 4.37 | | 466 | | 1,199 | | |
2027 | 714 | | 4.18 | | 462 | | 1,176 | | |
2028 | 1,046 | | 3.30 | | 545 | | 1,591 | | |
2029 | 1,156 | | 4.29 | | 447 | | 1,603 | | |
2030 | 1,444 | | 3.54 | | 517 | | 1,961 | | |
2031 | 1,583 | | 3.31 | | 377 | | 1,960 | | |
2032 | 1,476 | | 3.45 | | 69 | | 1,545 | | |
2033 | 1,500 | | 3.60 | | 126 | | 1,626 | | |
2034 | 1,403 | | 3.33 | | 133 | | 1,536 | | |
2035 | 703 | | 2.70 | | 9 | | 713 | | |
LOM Total | 11,757 | | 3.57 | | 3,152 | | 14,909 | | |
Source: OceanaGold, 2025
1.11.3Combined OP and UG Production Schedule
Table 1-7 shows the combined annual open pit and underground ore production and processing schedule, with the ore mined production profile shown in Figure 1-3.
| | | | | | | | |
Released: March 27, 2026 | | Page 34 of 275 |
| | | | | | | | |
NI 43-101 Technical Report – Haile Gold Mine, South Carolina, United States |
| |
| |
Table 1-7: Combined OP and UG Mining Production and Processing Schedule
| | | | | | | | | | | | | | | | | | | | | | | | | | | | | | | | | | | | | | | | | | | | |
Description | Description | Unit | 2026 | | 2027 | | 2028 | | 2029 | | 2030 | | 2031 | | 2032 | | 2033 | | 2034 | | 2035 | | 2036 | | LoM Total |
Underground Mining | Ore | Mt | 0.73 | | 0.71 | | 1.05 | | 1.16 | | 1.44 | | 1.58 | | 1.48 | | 1.50 | | 1.40 | | 0.70 | | - | | 11.8 | |
Au Grade | g/t | 4.37 | | 4.18 | | 3.30 | | 4.29 | | 3.54 | | 3.31 | | 3.45 | | 3.60 | | 3.33 | | 2.70 | | - | | 3.57 | |
Contained Au | Moz | 0.10 | | 0.10 | | 0.11 | | 0.16 | | 0.16 | | 0.17 | | 0.16 | | 0.17 | | 0.15 | | 0.06 | | - | | 1.35 | |
Ag Grade | g/t | 1.6 | | 1.4 | | 1.5 | | 1.9 | | 4.4 | | 4.9 | | 7.6 | | 8.3 | | 6.8 | | 7.6 | | - | | 5.0 | |
Contained Ag | Moz | 0.04 | | 0.03 | | 0.05 | | 0.07 | | 0.20 | | 0.25 | | 0.36 | | 0.40 | | 0.31 | | 0.17 | | - | | 1.9 | |
Open-pit Mining(1) | Ore | Mt | 4.38 | | 4.79 | | 1.59 | | 1.03 | | 1.37 | | 2.32 | | 1.18 | | 1.10 | | - | | - | | - | | 17.8 | |
Au Grade | g/t | 2.01 | | 1.91 | | 1.06 | | 1.16 | | 1.16 | | 1.38 | | 1.30 | | 1.06 | | - | | - | | - | | 1.59 | |
Contained Au | Moz | 0.28 | | 0.29 | | 0.05 | | 0.04 | | 0.05 | | 0.10 | | 0.05 | | 0.04 | | - | | - | | - | | 0.91 | |
Ag Grade | g/t | 2.0 | | 2.7 | | 1.9 | | 2.3 | | 2.0 | | 2.1 | | 2.1 | | 3.4 | | - | | - | | - | | 2.3 | |
Contained Ag | Moz | 0.28 | | 0.42 | | 0.10 | | 0.08 | | 0.09 | | 0.16 | | 0.08 | | 0.12 | | - | | - | | - | | 1.3 | |
Strip Ratio | w t:o t | 5.7 | | 5.0 | | 12.0 | | 5.4 | | 2.9 | | 2.4 | | 4.5 | | 2.3 | | - | | - | | - | | 5.1 | |
Waste | Mt | 25.1 | | 23.8 | | 19.2 | | 5.6 | | 3.9 | | 5.6 | | 5.3 | | 2.6 | | - | | - | | - | | 91.0 | |
Total Mining | Ore | Mt | 5.11 | | 5.50 | | 2.64 | | 2.19 | | 2.81 | | 3.90 | | 2.66 | | 2.60 | | 1.40 | | 0.70 | | - | | 29.5 | |
Au Grade | g/t | 2.35 | | 2.20 | | 1.95 | | 2.82 | | 2.38 | | 2.16 | | 2.50 | | 2.52 | | 3.33 | | 2.70 | | - | | 2.38 | |
Contained Au | Moz | 0.39 | | 0.39 | | 0.17 | | 0.20 | | 0.22 | | 0.27 | | 0.21 | | 0.21 | | 0.15 | | 0.06 | | - | | 2.26 | |
Ag Grade | g/t | 1.9 | | 2.5 | | 1.7 | | 2.1 | | 3.2 | | 3.2 | | 5.1 | | 6.2 | | 6.8 | | 7.6 | | - | | 3.4 | |
Contained Ag | Moz | 0.32 | | 0.45 | | 0.15 | | 0.15 | | 0.29 | | 0.41 | | 0.44 | | 0.52 | | 0.31 | | 0.17 | | - | | 3.2 | |
Mill Feed | Ore Feed (Mt) | Mt | 2.91 | | 2.90 | | 2.83 | | 2.86 | | 2.96 | | 2.95 | | 2.78 | | 2.72 | | 2.83 | | 2.70 | | 1.91 | | 30.3 | |
Ore Feed Au (g/t) | g/t | 3.04 | | 2.86 | | 2.67 | | 2.53 | | 2.45 | | 2.67 | | 2.52 | | 2.46 | | 2.11 | | 1.25 | | 0.61 | | 2.35 | |
Ore Feed Ag (g/t) | g/t | 2.1 | | 2.3 | | 2.0 | | 2.1 | | 3.2 | | 3.7 | | 5.1 | | 5.7 | | 4.4 | | 3.6 | | 2.0 | | 3.3 | |
Gold Recovery | % Au | 87.8 | | 86.7 | | 85.5 | | 86.4 | | 86.6 | | 83.8 | | 77.4 | | 77.3 | | 75.7 | | 74.6 | | 69.2 | | 82.7 | |
Silver Recovery | % Ag | 70 | | 70 | | 70 | | 70 | | 70 | | 70 | | 70 | | 70 | | 70 | | 70 | | 70 | | 70 | |
Gold (Au) Produced | Moz | 0.25 | | 0.23 | | 0.21 | | 0.20 | | 0.20 | | 0.21 | | 0.17 | | 0.17 | | 0.15 | | 0.08 | | 0.03 | | 1.90 | |
Silver (Ag) Produced | Moz | 0.14 | | 0.15 | | 0.13 | | 0.13 | | 0.21 | | 0.24 | | 0.32 | | 0.35 | | 0.28 | | 0.22 | | 0.09 | | 2.26 | |
Source: OceanaGold, 2025
(1) Does not include stockpile material
| | | | | | | | |
Released: March 27, 2026 | | Page 35 of 275 |
| | | | | | | | |
NI 43-101 Technical Report – Haile Gold Mine, South Carolina, United States |
| |
| |
Source: OceanaGold, 2025
Figure 1-3: Combined OP and UG Ore Production Schedule
1.12Processing and Recovery Methods
The processing plant continues to utilize the conventional flowsheet developed comprising:
•Primary Jaw Crushing
•Conventional SABC grinding circuit incorporating flash flotation on the cyclone underflow
•Rougher flotation
•Two stage concentrate regrind with a tower mill followed by an Isamill
•Carbon-in-leach (CIL) leaching of reground concentrate and flotation tailings
•Carbon stripping, electrowinning and smelting of bullion
•Cyanide destruction
Additional equipment was installed in some areas of the plant between 2018 and 2020 to achieve the expanded capacity above the original design of 2.35 Mt/yr with annual rates up to 3.5 Mt achieved and to ensure required concentrate regrind performance to maximize gold recovery at higher throughput rates. The production plan sees annual milling rates between 2.8 and 3.0 Mt/yr being processed with approximately 40% from underground operations and 60% from open pit. Upside potential exists from plant utilization improvement initiatives currently being pursued.
The existing flowsheet has proved to be very successful in recovery of gold from the ore with rates 2.5% above the original feasibility study model at head grades above 1.7 g/t gold. With the presence of gold hosted in tellurides in part of the Ledbetter Underground Resource, a modification to the leach circuit is proceeding to increase residence time to overcome slower leach kinetics in this material.
The annual processing schedule is shown in Table 1-7 and Figure 1-4.
| | | | | | | | |
Released: March 27, 2026 | | Page 36 of 275 |
| | | | | | | | |
NI 43-101 Technical Report – Haile Gold Mine, South Carolina, United States |
| |
| |
Source: OceanaGold, 2025
Figure 1-4: Annual Processing Schedule
Contact water treatment capacity has been expanded on site to account for increased PAG storage and open pit catchment area. The expanded plant has been augmented with the addition of a reverse osmosis stage to ensure compliance with discharge permits across a wider range of contact water hardness. Additional capital costs have been incorporated into the LoM plan to further enhance water treatment capacity.
1.13Infrastructure
Power is available in the area via an existing 44 kilovolt (kV) transmission grid with Duke Energy and a 69 kV transmission grid with Lynches River Electric Cooperative. All incoming power demand for the site is met by the local grid and supplied by Lynches River Electric Cooperative. The total power demand for the site (including underground operations) is estimated to be 23 Mega Volt-Ampere (MVA). The HGM owns and maintains the transmission infrastructure within the operation.
The permitted Duckwood Tailings Storage Facility (TSF) will be progressively expanded, to a total capacity of 63 Mt, to store plant tailings by raising the crest height using downstream construction methods. The existing permitted PAG facility is currently being expanded to store additional PAG material.
The underground infrastructure required to support underground mining includes extension of the ventilation, dewatering, power lines, air, and water supplies. The surface facilities that support the underground mining include a run-of-mine (RoM) stockpile area for underground ore, a batch plant, maintenance shop and warehouse, offices, laydown storage areas, and will host the future metal removal plant. The current facilities utilized for Horseshoe will support Palomino with nominal upgrades required. Mining of Palomino Underground requires an upgrade and extension of a high voltage power line along with a ventilation shaft to the 800 level. Ledbetter Underground is planned
| | | | | | | | |
Released: March 27, 2026 | | Page 37 of 275 |
| | | | | | | | |
NI 43-101 Technical Report – Haile Gold Mine, South Carolina, United States |
| |
| |
to have its own surface facilities consisting of RoM stockpile area with metal removal plant, maintenance shop and warehouse, laydown storage areas, offices and a batch plant.
All other infrastructure that is required for the LoM plan is in place.
1.14Environment Studies and Permitting
In late 2022, HGM received all of the major permits required to begin construction and operation of the mine including: Clean Water Act 404 Dredge and Fill Permit, Mine Operation Permit, 401 Water Quality Certification, TSF Dam Permit, North Fork Dam Permit, Air Permit (to construct), and various NPDES Permits (wastewater treatment and storm water).
In Q1 2024, South Carolina Department of Health and Environmental Control approved mine operating permit modifications for additional Horseshoe underground levels and Palomino. This minor modification took less than three months to complete. The permit modification for the method of mining change for Ledbetter Phase 4 to an underground is classed as a minor modification and is expected to be completed in 2027 before mining takes place in 2028.
1.15Capital and Operating Costs
Capital Cost
The total LoM capital is US$1,113 million as summarized in Table 1-8.
LoM Sustaining capital is US$574 million, the majority of which includes open pit capitalized pre-strip, underground operating capital development, underground project expansion (PUG & LUG), Process Plant Concentrate Leach Circuit Upgrade project and Contact Water Treatment Plant (CWTP). The remaining balance covers surface infrastructure, open pit mine equipment replacements and Social Performance projects.
LoM non-sustaining capital is US$539 million. Major projects in non-sustaining capital include the development of the PUG and LUG mines, process plant upgrades to support processing of LUG ore, plus estimated reclamation costs at closure.
Capital expenditures have been estimated referencing same or similar works at Haile, quotations from suppliers, and estimates provided by consultants with appropriate expertise.
Capital expenditure estimation is consistent with proposed development programs and ongoing requirements and has been undertaken to an appropriate level of estimation accuracy. Actual expenditures are likely to vary over the LoM due to inflation, modifications, upgrades, introduction of new technology and other unforeseen factors.
| | | | | | | | |
Released: March 27, 2026 | | Page 38 of 275 |
| | | | | | | | |
NI 43-101 Technical Report – Haile Gold Mine, South Carolina, United States |
| |
| |
Table 1-8: Total Capital Expenditure Summary (US$000’s)
| | | | | | | | | | | |
Description | Non-Sustaining Capex | Sustaining Capex | Total |
OP Capitalized Pre-Strip |
| 147,541 | 147,541 |
OP Mining Property, Plant, & Equipment (PP&E) |
| 103,320 | 103,320 |
UG Mining PP&E |
| 66,296 | 66,296 |
UG Mine Development Capitalized | 57,372 | 98,363 | 155,735 |
UG PUG – Development Phase | 135,538 |
| 135,538 |
UG LUG – Development Phase | 152,929 |
| 152,929 |
Processing | 67,107 | 66,143 | 133,250 |
Infrastructure(1) | 126 | 92,515 | 92,641 |
External Affairs and Social Performance (EA&SP) | 2,000 |
| 2,000 |
Total Net Capex | 415,072 | 574,178 | 989,250 |
Reclamation/Closure (2) | 123,465 | - | 123,465 |
Total LoM Net Capex | 538,537 | 574,178 | 1,112,715 |
Source: OceanaGold, 2025
1General site infrastructure. Additional infrastructure costs are captured within specific project totals i.e. PUG & LUG Development Phases and Processing
2 Captured as Capex in Cashflow
Operating Cost
The total LoM operating cost (excluding capitalized operating cost) is US$2,455 million. Operating costs have been estimated based on historical performance at Haile, supplier quotations, estimates from consultants with appropriate expertise and otherwise estimated internally by appropriately credentialled HGM staff.
Total LoM unit rate operating cost of US$80.93/ore tonne processed is summarized in Table 1-9.
Table 1-9: LoM Operating Cost Summary
| | | | | | | | |
Description | US$000’s | US$/t Mined |
OP Mining ($/t rock mined (ore and waste)) - All Material | 727,076 | 6.68 |
OP Mining ($/t rock mined (ore and waste)) - (excl. capitalized cost) | 579,535 | 5.33 |
UG Mining ($/t rock mined (ore and waste)) – All Material | 913,855 | 61.29 |
UG Mining ($/t rock mined (ore and waste)) - (excl. capitalized cost) | 758,120 | 50.85 |
US$000’s | US$/t Ore Processed |
Subtotal Mining (Operational Material Only) | 1,337,655 | 44.11 |
Processing | 706,105 | 23.28 |
G&A Cost | 402,627 | 13.28 |
Refining/Freight Costs | 8,209 | 0.27 |
Total Operating Costs | $2,454,596 | $80.93 |
Source: OceanaGold, 2026
There are cost items excluded from the operating cost, as detailed in Table 1-10, which OceanaGold does not consider to be direct operating costs, but is considered under the Indirect
| | | | | | | | |
Released: March 27, 2026 | | Page 39 of 275 |
| | | | | | | | |
NI 43-101 Technical Report – Haile Gold Mine, South Carolina, United States |
| |
| |
costs for the operation and these costs are included in the economic analysis. These include payments related to leasing arrangements of the open pit and underground mobile equipment fleets and other social commitments.
Table 1-10: LoM Indirect Costs Summary
| | | | | | | | | | | |
Description | US$000’s | US$/tonne Ore Processed | |
Reclamation Trust Agreement - Remaining Contributions | 10,080 | 0.33 | |
| Reclamation Trust Agreement - Release | -20,000 | -0.66 | |
Community Contributions | 9,200 | 0.3 | |
Interest Expense - Capital Leases | 3,562 | 0.12 | |
Principal Payment - Capital Leases: Sustaining | 25,877 | 0.85 | |
Principal Payment - Capital Leases: Non-Sustaining | 13,086 | 0.43 | |
Total Non-Operating Costs | 41,805 | 1.38 | |
Source: OceanaGold, 2025
1.16Economic Analysis
The Project consists of operating surface and underground mines with a mill. The milling facility is fed by the open pit mine directly and then through stockpiles in later years. The mill feed is supplemented with ore from underground mines at a 1.6 Mt/yr max annual capacity operation.
Haile is expected to produce 1.9 million ounces (Moz) of payable gold over a 11-year mine life at an average rate of 172 koz Au per year during full production years with a LoM all-in sustaining cost (AISC) of US$1,592/oz Au.
The Project is expected to incur sustaining capital in the amount of US$574 million over the modeled life and a non-sustaining capital spend, including rehabilitation costs, of US$539 million for total capital expenditure of US$1,113 million.
The project cash flow using the Mineral Reserve price of US$2,200/oz Au flat over the LoM and a 5% discount rate results in a pre-tax net present value (NPV) of US$462 million and after-tax NPV of US$414 million. As a result of significant depreciation and depletion, the operation is expected to incur limited income tax liability ($51 million) at the Mineral Reserve price. Existing loss carry-forwards have not been included in the economic model. Inclusion of these items may further reduce the income tax liability of the operation.
An alternative price profile more reflective of current market conditions (refer to section 22.4.2) which consists of a flat US$4,000/oz Au price and US$45.00/oz Ag price over the life of the operation was also evaluated. At these prices and a 5% discount rate, the project is estimated to produce pre-tax and after-tax NPV values of US$3,266 million and US$2,583 million, respectively. In this scenario, income tax liabilities of around $814 million would arise and are included in the above analysis.
As summary of the model results for both the reserve case and the alternative price case is presented in Table 1-11.
| | | | | | | | |
Released: March 27, 2026 | | Page 40 of 275 |
| | | | | | | | |
NI 43-101 Technical Report – Haile Gold Mine, South Carolina, United States |
| |
| |
Table 1-11: Indicative Economic Results
| | | | | | | | | | | |
Scenario | Reserve Case Price | Alternative Price | |
Description | US$000’s | US$000’s | |
Market Prices | |
Gold (US$/oz) | 2,200 | 4,000 | |
Silver (US$/oz | 25 | 45 | |
Payable Gold (Moz) | 1.9 | 1.9 | |
Revenue | |
Gross Gold Revenue | 4,169,596 | 7,581,084 | |
Silver By-Product Credit | 55,899 | 100,618 | |
Total Gross Revenue | 4,225,495 | 7,681,702 | |
Operating Costs | |
Total Operating Costs | (2,496,401) | (2,496,401) | |
Operating Margin (EBITDA) | 1,729,094 | 5,185,301 | |
Taxes | |
Income Tax | (50,932) | (814,474) | |
Operating Cash Flow | 1,678,163 | 4,370,827 | |
Capital | |
Total Capital | (1,112,715) | (1,112,715) | |
Metrics | |
Pre-Tax Free Cash Flow | 616,379 | 4,072,586 | |
After-Tax Free Cash Flow | 565,447 | 3,258,112 | |
Pre-Tax NPV at 5% | 461,753 | 3,265,974 | |
After-Tax NPV at 5% | 414,307 | 2,583,459 | |
Source: OceanaGold, 2026
Because the Project is operational and is valued on a total project basis and not by an incremental analysis, an initial rate of return (IRR) value is not relevant in this analysis. In terms of sensitivity, the Project is most sensitive to gold grade and price, followed by operating costs and capital costs.
1.17Conclusions and Recommendations
1.17.1Conclusions
The following conclusions have been drawn from this Technical Report:
•The Mineral Resources and Mineral Reserves have been estimated in accordance with the Canadian Institute of Mining, Metallurgy and Petroleum Standard Definitions for Mineral Resources and Mineral Reserves dated May 10, 2014, (CIM definitions) and provide a reasonable basis for medium to long term planning.
•The trade-off study for the Ledbetter Phase 4 open pit versus underground has been finalized and the mining method change resulting in improved economics for the site.
•Risks to the open pit plan include geotechnical highwall stability and water management. These are not considered material risks to the Mineral Reserve; however, might present risk to schedule and costs.
| | | | | | | | |
Released: March 27, 2026 | | Page 41 of 275 |
| | | | | | | | |
NI 43-101 Technical Report – Haile Gold Mine, South Carolina, United States |
| |
| |
•Future ores testing programs on new sources has confirmed the ability to recovery gold at current rates from the Horseshoe and Palomino sources and has highlighted the change in gold deportment in a portion of the Ledbetter Underground that would lead to lower recoveries without extending leach residence time.
•Mill throughput rates required in the production plan have been influenced from ore hardness testing and are at rates that have been achieved in recent years.
•Gold recovery from the current process flowsheet has proved effective in achieving rates at or above that predicted from the original feasibility study.
•Horseshoe Underground is ramped up to full production, and the Palomino Underground is starting initial decline development.
•Exploration drilling continues to investigate near-mine targets.
•All permits are up to date, with only a minor modification required for Ledbetter Underground.
•Project is cashflow positive at Mineral Reserve Gold Price of US$2,200/oz Au.
1.17.2Recommendations
•Continued regional and near mine exploration.
•Continued infill drilling programs for both open pit and underground deposits with focus on risk mitigation and conversion drilling to Measured and Indicated Mineral Resources.
•High focus on quality mining and schedule discipline to increase underground mining horizons allowing for de-risking and flexibility.
•The collection of additional metallurgical samples from drilling core to confirm recovery estimates for both Palomino and Ledbetter Underground deposits.
•Continue to develop geometallurgical models for open pit, underground and stockpiles to predict throughput and recovery rates for mine planning.
•Continue to develop and implement mitigation plans for geotechnical anomaly in the South Wall of the Ledbetter open pit.
•Continue to develop and implement management plans for the water currently stored in Mill Zone to mitigate the risk to mining in the Haile open pit.
•Continued focus on active water treatment to achieve at a minimum a neutral water balance year over year.
•Progress the concentrate leach circuit upgrade through detailed design and construction prior to Ledbetter Underground ore production arriving at the plant.
•Complete underground haulage study to further de-risk though identification of bottlenecks to LoM Plan.
•Complete study of utilization of paste versus CRF for backfilling of the underground stopes.
| | | | | | | | |
Released: March 27, 2026 | | Page 42 of 275 |
| | | | | | | | |
NI 43-101 Technical Report – Haile Gold Mine, South Carolina, United States |
| |
| |
2Introduction
This report has been prepared to support disclosures in OceanaGold’s Annual Information Form for the year ended December 31, 2025.
This report provides updated information on the Haile Gold Mine, including an updated Mineral Resources and Mineral Reserves estimate.
References in this report to OceanaGold include OceanaGold Corporation and its wholly owned subsidiary, HGM.
This report uses Mineral Reserve and Mineral Resource classification terms that comply with reporting standards in Canada and the Mineral Reserve and Mineral Resource estimates are made in accordance with the CIM Council – Definition Standards for Mineral Resources & Mineral Reserves adopted by the CIM Council on May 19, 2014, which were adopted by the Canadian Securities Administrators’ NI 43-101 – Standards of Disclosure for Mineral Projects.
This report includes scientific and technical data from a feasibility study to support the initial Mineral Reserves estimate for Ledbetter Underground included herein.
2.1Sources of Information and Data
Reports and documents listed in Section 27 of this report were used to support preparation of the report. Additional information was provided by HGM Staff as requested. Supplemental information was also provided to the QPs by third party consultants retained by OceanaGold in their areas of expertise.
2.2Qualifications of Consultants
The following individuals, by virtue of their education, experience and professional association, are considered QPs as defined in the NI 43-101 standard and are members in good standing of appropriate professional institutions. QP certificates of authors are provided in Appendix A. The QPs are responsible for specific sections as follows:
•David Carr, BEng Metallurgical (Hons), MAusIMM (CP) (OceanaGold Head of Metallurgy) is the QP responsible for mineral processing, all of Sections 13, 17, Section 18.9, and the process plant capital and operating costs of section 21, and portions of Sections 1, 25 and 26 summarized therefrom, of this Technical Report.
•Gregory Hollett, BEng (Mining Engineering), MBA, P.Eng (EGBC), (OceanaGold Head of Mine Engineering) is the QP responsible for environmental and open pit Mineral Reserves, Sections 2, 3, the open pit portions of Section 15 and 16.3, Section 16 opening statements, Sections 16.1, 16.1.1, 16.1.3, 16.1.4, 16.1.5, 16.1.7, 16.1.8, 18.7, 19, 20, the open pit operating costs portion of section 21, the other/G&A portions of the operating costs in section 21, 22, 24, 27, 28, and portions of Sections 1, 25, and 26 summarized therefrom, of this Technical Report.
•Brianna Drury, BSc Mining Engineering, RM-SME (OceanaGold Underground Engineering Superintendent), is the QP responsible for underground Mineral Reserves, the underground portions of Section 15 and 16.3, Sections 16.2, 16.2.1, 16.2.3, 16.2.5, 16.2.6, 16.2.7, 18.8, the capital costs portion of Section 21 with the exception of processing capital, the
| | | | | | | | |
Released: March 27, 2026 | | Page 43 of 275 |
| | | | | | | | |
NI 43-101 Technical Report – Haile Gold Mine, South Carolina, United States |
| |
| |
underground mining operating costs portion of Section 21, and portion of Sections 1, 25, and 26 summarized therefrom, of this Technical Report.
•Jonathan Moore, BSc Geology (Hons), MAusIMM (CP), (OceanaGold Group Manager, Resource Development), is the QP responsible for the open pit and Horseshoe underground Mineral Resources, Sections 4 through 12, the open pit and Horseshoe underground portions of section 14, 23, and portions of Sections 1, 25, and 26 summarized therefrom, of this Technical Report.
•Douglas Corley, BSc Geology (Hons), MAIG (RPGeo), (OceanaGold Principal Geologist, Resource Development), is the QP responsible for the Ledbetter and Palomino underground Mineral Resources, the Palomino and Ledbetter underground portions of Section 14 and portions of Sections 1, 25, and 26 summarized therefrom, of this Technical Report.
•Larry Standridge, PE, MSE Geotechnical, (Call & Nicholas Principal II Geotechnical Engineer) is the QP responsible for open pit geotechnical work, Section 16.1.2 and portions of Sections 1, 25, and 26 summarized therefrom, of this Technical Report.
•Robert Cook, PE, RM-SME, (Call & Nicholas Principal II Geological Engineer), is the QP responsible for underground geotechnical information, Section 16.2.2 and portions of Sections 1, 25, and 26 summarized therefrom, of this Technical Report.
•Jay Newton Janney-Moore, PE, RM-SME, (NewFields Senior Project Manager I), is the QP responsible for tailing and overburden storage, Sections 18.1, 18.2, 18.3, 18.4, 18.5, and portions of Sections 1, 25, and 26 summarized therefrom, of this Technical Report.
•William Lucas Kingston, MSc, P.G., RM-SME, Hydrogeology and Groundwater Management, (NewFields Senior Hydrogeologist) is the QP responsible for hydrogeology, Sections 16.1.9, 16.2.8, 18.6, and portions of Sections 1, 25, and 26 summarized therefrom, of this Technical Report.
•Brooke J. Miller, MSc, C.P.G. (SRK Principal Consultant, Geology), is the QP responsible for geochemistry, Section 16.1.6 and 16.2.4 and portions of Sections 1, 25, and 26 summarized therefrom, of this Technical Report.
2.3Site Visits and Scope of Personal Inspection
Site visits conducted by QPs are summarized in Table 2-1.
| | | | | | | | |
Released: March 27, 2026 | | Page 44 of 275 |
| | | | | | | | |
NI 43-101 Technical Report – Haile Gold Mine, South Carolina, United States |
| |
| |
Table 2-1: Site Visit Participants
| | | | | | | | | | | | | | |
Personnel | Company | Expertise | Date(s) of Visit | Details of Inspection |
Robert Cook | Call & Nicholas | Geotechnical | November 29-30, 2017 July 27-28, 2021 January 16-19, 2023 January 22- 24, 2024 July 15-16, 2025 January 13-15, 2026 | Inspect open pit and underground mining conditions. |
Larry Standridge | Call & Nicholas | Geotechnical | November 29-30, 2017 October 10-11, 2018 January 14-16, 2020 May 18-20, 2021 January 24, 2024 January 20-21, 2026 | General site inspection with a focus on pit slope conditions. |
David Carr | OceanaGold | Metallurgy | Various visits in 2017, 2018, 2019, 2020, 2022, February 17-March 22, 2025, June 16-August 8, 2025 | Plant Commissioning support and plant investigations. Plant Commissioning and ramp-up of operations, investigations, benchmarking and study support. |
Gregory Hollett | OceanaGold | Open pit mining and Mineral Reserves | Various visits in 2018-2023. July 8-19, 2024 November 11-14, 2024 November 10-14, 2025 | General site inspection, open pit inspection, mine planning and reporting reviews. |
Jay Newton Janney-Moore | NewFields | Geotechnical/ Infrastructure | Sept. 24-26, 2019 Aug 31-Sept 2, 2021 Oct 18, 2022 Sept. 26-27, 2023 Oct. 21-31, 2024 Oct 29-30, 2025 | Inspection of the Duckwood TSF, PAG OSA, and geomembrane lined ponds. ITRB meeting |
Brooke J. Miller | SRK | Geochemistry | November 2023 | Visited Overburden Storage Areas and open pit mine, tour of surface facilities on site. |
William Lucas Kingston | NewFields | Hydrogeology and Groundwater Management | December 4-5, 2019 August 31 - September 2, 2021 | General site inspection, including dewatering system. |
Douglas Corley | OceanaGold | Geology/Resources | 10 June to 3 July 2024 | Resources. Drill core, open pit and underground visits. |
Jonathan Moore | OceanaGold | Geology/Resources | Annually since 2015. Most recently, November 20 to December 8, 2025 | Review of Resource and Reconciliation. Drill core, open pit and underground visits. |
•Brianna Drury is based in South Carolina and is on-site regularly.
2.4Units of Measure
The Metric System for weights and units has been used throughout this report unless otherwise noted. Tonnes are reported in metric tonnes of 1,000 kilogram (kg). Gold is reported in grams (G) and troy ounces (Koz), where applicable (1 Troy ounce = 31.1035 grams). All currency is in U.S. dollars (US$) unless otherwise stated.
2.5Effective Date
The effective date of this report is December 31, 2025.
| | | | | | | | |
Released: March 27, 2026 | | Page 45 of 275 |
| | | | | | | | |
NI 43-101 Technical Report – Haile Gold Mine, South Carolina, United States |
| |
| |
3Reliance on Other Experts
The QPs opinions contained herein are based on information provided by OceanaGold throughout the course of the investigations. The QPs have relied upon OceanaGold and the work of other consultants in various project areas in support of this Technical Report.
The QPs have used their experience to determine if the information from previous reports was suitable for inclusion in this Technical Report and adjusted information that required amending. This report includes scientific and technical information, which required subsequent calculations to derive subtotals, totals, and weighted averages. Such calculations inherently involve a degree of rounding and consequently introduce a margin of error. Where these occur, the Consultants do not consider them to be material.
For reporting of environmental and other matters in Section 20, the QP has relied upon the internal memo:
“Taxation and Related Assumptions”, dated March 23, 2026, by OceanaGold’s Environmental EA&SP Manager (Haile)
For reporting of tax calculations and related matters in Section 22, the QP has relied upon the internal memo:
“Haile tax, depreciation, royalty, and related matters”, dated December 31, 2025, by OceanaGold’s Commercial Manager (Haile)
The QPs have relied upon OceanaGold for information regarding the surface land ownership / agreements as well as the mineral titles and their validity. Land titles and mineral rights for the Project have not been independently reviewed by the QP, who has have relied on OceanaGold legal counsel and a titles and mineral rights due diligence report from the time of OceanaGold’s acquisition of HGM by Womble Carlyle Sandridge & Rice dated July 24, 2015.
| | | | | | | | |
Released: March 27, 2026 | | Page 46 of 275 |
| | | | | | | | |
NI 43-101 Technical Report – Haile Gold Mine, South Carolina, United States |
| |
| |
4Property Description and Location
4.1Property Location
The Haile gold mine is located 5 km northeast of Kershaw in southern Lancaster County, South Carolina, United States of America (USA), in the north-central part of the state, as shown in
Figure 4-1. Haile is 27 km southeast of Lancaster, the county seat, and is 80 km northeast of Columbia, the state capital. The geographic centre of the mine is at 34° 34’ 46” N latitude and 80° 32’ 37” W longitude. Mineralized zones at Haile lie within an area extending from UTM NAD83 zone 17N coordinates 540000E to 544000E and 3825500N to 3827500N. Figure 4-2 shows a site map of the Haile Gold Mine.
Source: State-Maps.org and Google Maps, 2014
Figure 4-1: General Location Map of the Haile Gold Mine
| | | | | | | | |
Released: March 27, 2026 | | Page 47 of 275 |
| | | | | | | | |
NI 43-101 Technical Report – Haile Gold Mine, South Carolina, United States |
| |
| |
Source: OceanaGold, 2023
Figure 4-2: Site Map of the Haile Gold Mine
| | | | | | | | |
Released: March 27, 2026 | | Page 48 of 275 |
| | | | | | | | |
NI 43-101 Technical Report – Haile Gold Mine, South Carolina, United States |
| |
| |
4.2Ownership
HGM is a wholly owned subsidiary of OceanaGold. References in this document to OceanaGold refer to the parent company together with its subsidiaries, including HGM. As of December 31, 2025, HGM owns a total of 10,978 acres in South Carolina. Of this total, 5,469 acres are within the mine permit boundary. Figure 4-3 shows the Land Tenure map as of December 31, 2025, with Fee Simple (OceanaGold owned) and leased properties, almost entirely in Lancaster County.
Source: OceanaGold, 2025
Figure 4-3: Land Tenure Map
| | | | | | | | |
Released: March 27, 2026 | | Page 49 of 275 |
| | | | | | | | |
NI 43-101 Technical Report – Haile Gold Mine, South Carolina, United States |
| |
| |
5Accessibility, Climate, Local Resources, Infrastructure and Physiography
5.1Accessibility
The Haile property is easily accessible on paved roads and highways from U.S. Highway 601 to the mine entrance on Snowy Owl Road, located 5 km northeast of Kershaw, South Carolina. The major international airport at Charlotte, North Carolina, is an 80-minute (min) drive from the mine property.
5.2Climate
The Haile area of South Carolina has a subtropical climate. Summers are hot and humid with maximum daytime temperatures averaging 31°C to 33°C (degrees Celsius). Winters are mild and temperatures range from -1°C to 14°C. Average annual precipitation is 1,220 millimetres (mm) while annual evaporation is estimated at 760 mm (US Climate Data). Rain is abundant throughout the year with January, March, and July being the wettest months. Snowfall is insignificant and averages less than 80 mm per year. South Carolina averages 50 days of thunderstorm activity and 14 tornadoes per year. The mine operating season is year-round.
5.3Local Resources and Infrastructure
Local resources (labor force, manufacturing, supplies, housing, utilities, emergency services, etc.) and infrastructure are in place and are widely utilized at Haile. Numerous small communities exist around the Haile mine with populations ranging from 700 to 10,000 people. Power is available in the area via an existing 44 kV transmission grid with Duke Energy and a 69 kV transmission grid with Lynches River. The Haile Gold Mine utilizes both grids. Surrounding nearby land use is dominantly for agriculture and timber.
5.4Physiography
The Haile Gold Mine and its surroundings occur within the Sand Hills sub-province of the Piedmont physiographic province of the Southeastern United States. This province trends from southwest to northeast and is bound by the Coastal Plain to the southeast and the southern Appalachian Mountains to the northwest. Gentle topography and rolling hills, dense networks of stream drainages, and white sand to red brown saprolitic soils characterize the province. The mine elevation ranges from 120 to 170 m above mean sea level (amsl). Topography is dissected by the perennial, southwest-flowing Haile Gold Mine Creek and by its intermittent tributaries. HGMC enters the southeast-flowing Little Lynches River 1.6 km southwest of the mine site. Gradients within the drainages are gentle to moderate (9% to 13%) and slopes above the drainages are gentle to nearly flat (less than 1%). The property is heavily wooded by pine and hardwood forests.
| | | | | | | | |
Released: March 27, 2026 | | Page 50 of 275 |
| | | | | | | | |
NI 43-101 Technical Report – Haile Gold Mine, South Carolina, United States |
| |
| |
5.5Infrastructure Availability and Sources
There are large industrial centres near the mine property. Equipment and sources of logistical and professional expertise can be obtained from the major cities of Charlotte, N.C., and Columbia, S.C., which are both within one hour travel of the mine. Multiple contractors provide skilled workers for the Project and there is adequate labor available for operation of the mine.
| | | | | | | | |
Released: March 27, 2026 | | Page 51 of 275 |
| | | | | | | | |
NI 43-101 Technical Report – Haile Gold Mine, South Carolina, United States |
| |
| |
6History
Gold was discovered in 1827 by Colonel Benjamin Haile, Jr. in gravels of Ledbetter Creek (now HGMC). This led to placer mining and prospecting until 1829, when lode deposits at the Haile-Bumalo pit site were found. Surface pit and underground work continued at the Haile-Bumalo site for many years. In 1837, a five-stamp mill was built (Newton et al., 1940). Gold production and pyrite-sulfur mining for gunpowder continued through the Civil War from 1861 to 1865. General Sherman’s Union troops invaded the area and burned down the operations near the war’s end.
In 1882 a sixty-five-stamp mill was constructed by E.G. Spilsbury and operated continuously until a fatal boiler explosion killed the mine manager in 1908. During that time, Adolph Thies developed the Thies barrel chlorination extraction process and improved gold recovery from Haile sulfide ores (Pardee and Park, 1948). During the 26-year operation period, mining grew to include the Blauvelt, Bequelin, New Bequelin, and Chase Hill areas. From 1907 to 1913, an attempt to operate a cyanide plant to extract gold from mine tailings was unsuccessful. Pyrite used to produce sulfuric acid was mined at Haile from 1914 to 1918 (Newton et al., 1940).
From mid-1937 to 1942, larger scale mining was undertaken by the Haile Gold Mine Company. The property then consisted of owned or leased ground totaling about 1,335 hectares (Ha) (Newton et al., 1940). Most of the main pits were mined to the 46 m level with some underground operations at Haile-Bumalo reaching the 106 m level (Pardee and Park, 1948). The Red Hill Deposit was discovered by crude induced polarization techniques next to the Friday pyrite diggings (Newton et al., 1940). This fairly large operation was shut down by presidential decree in 1942 because of World War II. By this time, Haile had produced over US$6.4 million worth of gold (in 1940 US$) (Newton et al., 1940).
Starting in 1951, the Mineral Mining Company (Kershaw, South Carolina) mined mineralite from sericite-rich pits around Haile. This industrial product is a mixture of sericite, kaolinite, quartz, and feldspar and is used in manufacturing insulators and as a paint base. Mineralite mining ended
in 1991.
In 1966, Earl Jones conducted exploration work in the area and eventually interested Cyprus Exploration Company (Cyprus) in the Project. Cyprus worked Haile from 1973 to 1977. Numerous companies explored the Haile regional area in the 1970’s and 1980’s, including Amselco, Amax, Nicor, Callaghan Mining, Westmont, Asarco, Newmont, Superior Oil, Corona, Cominco, American Copper and Nickel, Kennecott, and Hemlo.
The 1980’s heralded the first successful modern exploration and production at Haile. Piedmont Land and Exploration Company (later Piedmont Mining Company) explored Haile and surrounding properties from 1981 to 1985. Piedmont drilled 67 core holes and 1,215 RC holes on the property and greatly expanded the footprint of the Haile deposits. Piedmont mined the Haile deposits from 1985 to 1992 and produced 85,000 oz of gold from open pit heap leach operations in oxide and transitional ores. New areas mined by Piedmont included the Gault Pit (next to Blauvelt), the 601 pits (by the US 601 highway), and the Champion Pit. Piedmont expanded the Chase Hill and Red Hill pits and combined the Haile-Bumalo zone into one pit. Piedmont also discovered the large Snake sulfide gold resource and mined its small oxide cap. Piedmont extracted gold ores from a mineralized trend 1.6 km long, from east to west. Historical gold production at Haile is estimated at 360,000 Oz (Speer and Madry, 1993, Maddry and Kilbey, 1995).
| | | | | | | | |
Released: March 27, 2026 | | Page 52 of 275 |
| | | | | | | | |
NI 43-101 Technical Report – Haile Gold Mine, South Carolina, United States |
| |
| |
In June 1991, Amax signed an agreement to evaluate Haile to determine if it should enter a joint venture. During the evaluation period, core drilling stepped north of the Haile-Bumalo area and discovered the new sulfide resource of Mill Zone under the old 1940’s mill. Amax and Piedmont entered into a joint venture agreement and established the HMC in May 1992.
From 1992 to 1994, HMC completed a program of exploration and development drilling, property evaluation, Mineral Resource estimation, and technical report preparation. During this period, the large Ledbetter resource zone was discovered under a mine haul road. At the end of the HMC program in 1994, the gold reserve was stated as 780,000 oz of contained gold within 7.9 Mt at an average gold grade of 3.05 g/t. A QP has not done sufficient work to classify the historical estimate as Mineral Resources or Mineral Reserves. HGM is not treating the historical estimate as Mineral Reserves. Because of unfavorable economic conditions at the time, Amax did not proceed with mining and began a reclamation program to mitigate acid rock drainage (ARD) conditions at the site.
Kinross acquired Amax in 1998, assuming Amax’s portion of the Haile joint venture and later purchased Piedmont’s interest. Because Haile was a low priority compared to larger and more profitable projects, Kinross decided not to reopen the mine and continued the reclamation and closure program. Reclamation and closure proceeded through to 2007 when Haile operations commenced again under Romarco Minerals Inc.
Romarco acquired Haile from Kinross in October 2007 and began a confirmation drilling program in late 2007. Romarco completed the confirmation drill program in early 2008 and began infill and exploration drilling focused around the Ledbetter resource. Drilling accelerated in early 2009 with a major RC infill drilling program that continued through 2012. Condemnation drilling by Romarco for mine facilities commenced in September 2009. Drilling east of the Snake deposit discovered the high-grade Horseshoe deposit in 2010 and required the planned TSF to be relocated 3 to 4 km northwest of the mine. Geotechnical drilling was initiated in September 2009 for pit slope designs. The final hole at Ledbetter discovered a deeper northwest extension in 2010 that was named Mustang. Drilling between the Red Hill and Horseshoe areas had identified large zones of lower grade material that led to the late 2011 discovery of the deep Palomino prospect. Due to low gold prices and mine permitting, Haile exploration drilling was suspended during 2013 and 2014.
Romarco submitted a FS for Haile in February 2011. Drillhole data available as of November 17, 2011, were used in the March 2012 Mineral Resource estimate. Romarco completed a large portion of detailed engineering and permitting for the Project in 2011 and 2012. In November 2014, an updated FS was completed after receiving the necessary permits. In April 2015, construction of the Project began by Romarco and mining commenced in the Mill Zone pit.
OceanaGold acquired Romarco Minerals Inc. in October 2015 and became owner and operator of Haile. Project construction during 2015 and 2016 included a new CIL flotation process plant, power upgrades, a lined PAG overburden storage area (OSA), and a TSF. The first gold pour at the new process plant was in January 2017.
| | | | | | | | |
Released: March 27, 2026 | | Page 53 of 275 |
| | | | | | | | |
NI 43-101 Technical Report – Haile Gold Mine, South Carolina, United States |
| |
| |
7Geological Setting and Mineralization
7.1Regional Geology
Gold endowment in the southern Appalachian piedmont is predominantly from the Carolina Slate Belt (CSB), also known as the Carolina Terrane (Hibbard et al., 2010). The 700 km long belt is characterized by a strong northeast structural grain (stratigraphy, faults, foliation, and fold axes) extending from Alabama to Virginia that is up to 140 km wide in North Carolina. Volcanic arcs formed adjacent to the African continent and were accreted to the North American craton during the Late Proterozoic to Silurian (Hibbard et al., 2010).
The CSB is a northeast-trending, late Proterozoic to early Cambrian belt of intermediate to felsic volcanic flows and pyroclastic rocks mixed with fine-grained epiclastic and turbiditic sediments. At Haile, sedimentary rocks were deposited under calm, subaqueous anoxic slope conditions as evidenced by laminated, laterally extensive siltstones and subordinate turbidite flows. Volcanic and sedimentary facies are interfingered in the Haile region and are cut by post-metamorphic mafic dikes.
The CSB has a prominent flexure in central South Carolina near Haile. Structural trends southwest of this area are east–northeasterly, whereas trends northeast of the flexure are mostly northeasterly (Hibbard et al., 2002). The CSB was intruded by dominantly granite plutons approximately 595 to 520 Ma and by post-metamorphic Carboniferous granite plutons approximately 300 Ma (Fullagar and Butler, 1979). Hydrothermal activity prior to regional metamorphism is indicated by folded and recrystallized quartz veins and by pressure shadows with fringes of chlorite and quartz on pyrite. At least four tectono-thermal periods are recorded in the Carolina Terrane (Hibbard et al., 2002), including:
•Late Neoproterozoic to Early Cambrian Virgilina events (578 to 535 Ma): folding, foliation, and faulting with granite plutonism.
•Late Ordovician to Silurian Cherokee orogeny (457 to 425 Ma): greenschist facies metamorphism accompanied by a steep, generally northwest-dipping slaty cleavage that is axial planar to regional-scale folds that are commonly overturned to the southeast
•Devonian events of the Gold Hill-Silver Hill dextral shear zone (393 to 381 Ma) reactivation of Cherokee structures that juxtaposes the Carolina and Charlotte Terranes (west over east reverse motion).
•Late Paleozoic Alleghanian events (333 to 260 Ma): ductile, often mylonitic (e.g., Hyco and Modoc shears) (Hibbard et al., 1998) reactivation of older structures. Deformation is generally constrained to areas immediately proximal to such structures and focused along the southeast margin of the CSB.
See Figure 7-1 as a geologic timeline of major events shaping Haile’s geology.
| | | | | | | | |
Released: March 27, 2026 | | Page 54 of 275 |
| | | | | | | | |
NI 43-101 Technical Report – Haile Gold Mine, South Carolina, United States |
| |
| |
Source: OceanaGold, 2021
Figure 7-1: Time Distribution of Major Geological Events in the Carolinas
| | | | | | | | |
Released: March 27, 2026 | | Page 55 of 275 |
| | | | | | | | |
NI 43-101 Technical Report – Haile Gold Mine, South Carolina, United States |
| |
| |
The largest known gold deposits in the southeastern United States are in the north-central portion of South Carolina. They are oriented SW-NE and occur at or near the contact between metamorphosed volcanic and sedimentary rocks of Neoproterozoic to Early Cambrian age. In descending order, the largest deposits are Haile, Ridgeway, and Brewer (Foley and Ayuso, 2012) as shown in Table 7-1. Haile is classified as a structurally modified low sulfidation, sediment-hosted, disseminated, gold deposit with proximal quartz-sericite-pyrite alteration and distal carbonate-chlorite alteration. Ridgeway is geologically similar to Haile in that it is predominantly sediment-hosted and lies proximal to a major volcanic-sedimentary transition. East-west to ENE structural controls and local folding characterize the Haile and Ridgeway deposits. By contrast, Brewer is a high sulfidation, pyrite-enargite-chalcopyrite-topaz-rich, volcanic-hosted, breccia pipe characterized by advanced argillic alteration (pyrophyllite-andalusite).
Table 7-1: Geological Summary of Major Gold Deposits of SE USA
| | | | | | | | | | | | | | |
Deposit | Type | Host Rocks | Alteration | Au Age (Ma) |
Haile | Sediment / volcanic-hosted | Persimmon Fork | quartz-pyrite-sericite | 549 |
Low Sulfidation |
Ridgeway | Sediment / volcanic-hosted | Persimmon Fork | quartz-pyrite-sericite | 553 |
Low Sulfidation |
Brewer | Breccia Pipe | Persimmon Fork | pyrite-enargite-chalcopyrite | 550 |
High Sulfidation |
Source: OceanaGold and Foley and Ayuso, 2012
7.2Local Geology
Haile geological history includes several major events, as listed below from oldest to youngest. Regional and local geologic maps are presented in Figure 7-2 and Figure 7-3. A schematic stratigraphic column is presented in Figure 7-4.
7.2.1Lithology
The following rock units are described in chronostratigraphic order from oldest to youngest. Haile stratigraphy is described from mapping and core drilling over a thickness of about 1 km.
Neoproterozoic Rocks
About 555 to 551 Ma (Hibbard et al., 2002) igneous and interbedded epiclastic rocks were deposited that form the approximately 3 km thick Persimmon Fork Formation. This comprises laminated siltstone with minor sandstone and conglomerate overlain and interfingered with lapilli and ash flow tuffs. Tuffaceous rocks mostly occur in north-central areas of the Haile district at Ledbetter and Snake. They have irregular, hackly joints in contrast to the harder, well-jointed dacites. Grey laminated, pyritic siltstones are the dominant host rocks the middle and lower portions of the mine stratigraphy.
This is conformably overlain by the Richtex Formation siltstones along the southeast edge of Haile. The Richtex consists of ENE-striking, 40° to 60° SE-dipping, thin-bedded siltstone and mudstone with sandstone. The lower portion of the Richtex Formation contains mafic tuff and amygdaloidal
| | | | | | | | |
Released: March 27, 2026 | | Page 56 of 275 |
| | | | | | | | |
NI 43-101 Technical Report – Haile Gold Mine, South Carolina, United States |
| |
| |
basalt flows near Ridgeway (Secor and Wagener, 1968). Thickness near Haile is unknown but the Richtex is greater than 3 km thick near Ridgeway.
Paleozoic Rocks
Lamprophyre Dikes
Lamprophyre dikes intrude rocks of the Persimmon Fork and Richtex Formations. These dark green fine-grained dikes contain biotite, hornblende and plagioclase with chlorite and calcite and display spherulitic textures. The near-vertical to moderately dipping dikes commonly strike NE-SW or E-W and range in thickness from 1 cm to 2 m. Lamprophyre volume at Haile is estimated at about 1%. Lamprophyres are not foliated or pyritic and were likely emplaced during the waning stages of the Alleghanian Orogeny. Dates (40Ar/39Ar) in biotite yielded Pennsylvanian ages at approximately 311 Ma, coincident with the Dutchman Creek Gabbro (Fullagar and Butler, 1979).
Granites
The northeast-elongated Liberty Hill and Pageland plutons are exposed 8 km west and 5 km north respectively of the Haile mine. These fresh, medium-grained granites have less than 5% biotite and hornblende and are weakly foliated. The large (30 km x 20 km) Liberty Hill granite is dated at 293 ± 15 Ma. The Pageland granite (25 km x 10 km) is dated at 296 ± 5 Ma (Fullagar and Butler, 1979). Granite has not been observed in drillholes at Haile. Metamorphic aureoles around the plutons are less than 0.5 km wide and do not impact rocks at Haile.
Mesozoic Rocks
Diabase Dikes
Diabase dikes mapped at Haile are dark gray, dense, medium-grained, sub-ophitic and magnetic in character. These dikes cut all other units except the CPS. Dominant minerals are plagioclase and pyroxene with minor olivine. The diabase dikes margins are often chilled and / or spherulitic. The dikes strike NW with near-vertical dips and range in thickness from 1 to 30 m. Diabase dikes at Haile occur as both discrete dikes and as swarms (at Mill Zone and Horseshoe) tens of metres wide with a spacing of 300 to 400 m. Diabase dikes have horsetail, anastomosing, and sigmoidal geometries. The dikes weather to dark brown, earthy colors with chlorite and serpentine commonly observed along fractures. Dike emplacement post dates gold mineralization and occurred during the Late Triassic to Early Jurassic and accounts for about 5% by volume of rocks at Haile and often truncate ore zones.
Saprolite
Most of South Carolina is covered by Saprolite; a thick, structureless, unconsolidated, kaolin-rich, red orange to white residuum derived from intense acidic bedrock weathering in sub-tropical climates. Saprolite thickness ranges from 10 to 40 m at Haile and is thickest in metavolcanic rocks and along faults. Saprolite is rarely mineralized at Haile.
Coastal Plain Sand
The Cretaceous Middendorf Formation (Nystrom et al., 1991) is a south-eastward-thickening apron of unconsolidated sand. Its northwest limit conceals much of the Haile property and unconformably overlies the Richtex Formation in the southeast of Haile. The sands postdate gold mineralization and is the youngest unit in the region. The sands are up to 30 m thick at Haile and hundreds of metres thick south of Haile. The basal portion contains 10 to 60 cm thick layers of red
| | | | | | | | |
Released: March 27, 2026 | | Page 57 of 275 |
| | | | | | | | |
NI 43-101 Technical Report – Haile Gold Mine, South Carolina, United States |
| |
| |
brown ferricrete and quartz pebbles in a sandy matrix. The middle unit is white to red sand with a kaolinite matrix with frequent cross bedding. The upper unit is a clean tan to white quartz sand.
Source: OceanaGold, 2021
Figure 7-2: District Geology of North-Central South Carolina (UTM NAD83 Z17N)
| | | | | | | | |
Released: March 27, 2026 | | Page 58 of 275 |
| | | | | | | | |
NI 43-101 Technical Report – Haile Gold Mine, South Carolina, United States |
| |
| |
Source: OceanaGold, 2021
Figure 7-3: Geologic Map of the Haile Area with Gold Zones (UTM NAD83 Z17N)
| | | | | | | | |
Released: March 27, 2026 | | Page 59 of 275 |
| | | | | | | | |
NI 43-101 Technical Report – Haile Gold Mine, South Carolina, United States |
| |
| |
Source: OceanaGold, 2021
Figure 7-4: Haile Stratigraphic Column
| | | | | | | | |
Released: March 27, 2026 | | Page 60 of 275 |
| | | | | | | | |
NI 43-101 Technical Report – Haile Gold Mine, South Carolina, United States |
| |
| |
7.2.2Structure
The structural history of Haile is complex and is affected by four deformational / hydrothermal episodes, as summarized in Section 7.1 and depicted in Figure 7-1. The timing of mineralization in relation to major orogenic events is also unclear but has traditionally been interpreted as pre-deformation. Recent structural analysis incorporating pit mapping data and high resolution blasthole sampling suggests syn- or post-deformational mineralization and investigations are ongoing. Consequently, the relative timing of the D1 and D2 events listed below is currently unclear.
Four deformation events are observed at Haile; the D1 and D2 events provide the dominant geometric constraints on the Haile ore deposits.
•D1 is defined by syn-mineral hydrothermal flooding and replacement of sedimentary rocks by silica and pyrite with Au, Ag, As, and Mo precipitation. Mineralization was focused at the volcanic-sedimentary contact with the overlying volcanics acting as a cap and at the base of sedimentary rocks as veins, breccias, and wall rock flooding.
•D2 regional metamorphism and deformation is characterized by folding, shearing, pervasive foliation, quartz veins and greenschist facies mineral assemblage. This is the dominant event that overprints the Haile region. Pervasive foliation strikes east-northeast and dips 40 to 600 northwest and increases in intensity along the volcanic-sedimentary contact and weaker laminated siltstones. Rocks were folded into an asymmetric anticlinorium with a steep southeast limb and moderate northwest limb.
•D3 is manifest as minor brittle reactivation of foliation along NW-dipping normal faults and displaces some ore zones.
•D4 is defined by diabase dike intrusions and minor dextral faults that step down the district geology from west to east.
Figure 7-5 highlights the intense ductile and brittle strain fabrics that overprint and deform ore zones at Haile. The top photo shows a pressure solution cleavage (S1) imposed on folded bedding (S0) flanked by a shear zone of completely transposed bedding. The lower photo shows axial planar cleavage (S1) in folded and bedded (S0) siltstone with folded pyrite lenses. At the ore deposit scale, the pyrite lenses are similar to irregular ore zone shapes. Compositional layering subparallel to the foliation is generally transposed bedding and represents S1 and S2 fabrics (Hayward, 1992). The S1 foliation is formed by both pressure solution parallel to axial planes of folds and ductile shear strain (Tosdal, 2020).
| | | | | | | | |
Released: March 27, 2026 | | Page 61 of 275 |
| | | | | | | | |
NI 43-101 Technical Report – Haile Gold Mine, South Carolina, United States |
| |
| |
Source: OceanaGold, 2021
Figure 7-5: High Strain Fabrics in Core Samples
Many contacts between volcanic and sedimentary rocks have undergone grain size reduction and thus represent high strain zones recording ductile slip. Greenschist facies metamorphism produced significant volume loss due to dehydration reactions at temperatures of 250°C to 300°C and developed pressure solution cleavage. Primary feldspars and biotite have been converted to sericite and chlorite.
The Haile gold deposits are exposed within a metasediment (MS) window flanked and overlain by MV. The ENE-trending window is about 4 km long x 0.5 to 1 km wide (Figure 7-3). Sedimentary rocks are folded within an ENE-trending anticlinorium with a steep SE limb and a moderate NW limb. The MV / MS contact is conformable with bedding. High strain fabrics overprint all MV and MS units in the mine area. The ENE-striking MV / MS contact dips 60 to 80 SE along the southeast margin of the district and generally constrains gold mineralization at Red Hill East, Palomino, Deep Snake, and Horseshoe. The MV / MS contact dips 30 to 50 NW in north-central portions of district and caps gold mineralization at Ledbetter, Upper Snake, Mill Zone, and Red Hill West.
| | | | | | | | |
Released: March 27, 2026 | | Page 62 of 275 |
| | | | | | | | |
NI 43-101 Technical Report – Haile Gold Mine, South Carolina, United States |
| |
| |
The district is dissected by several ENE-striking, 30° to 60° NW-dipping dip- and oblique-slip shears that appear to both focus gold mineralization and displace mineralized zones. The Mill Zone orebody is faulted into two segments with about 100 m of normal displacement. Brittle deformation is characterized by anastomosing fault zones with discrete thin slip planes, commonly filled with ribbon quartz or gouge. Fold axes observed in drilling and mapping mostly occur in the southeast portion of the district in the Red Hill, Palomino, and Snake deposits. Portions of the Ledbetter deposit contain chaotic folds with variable orientations. Fold axes strike N40° E to N70° E and plunge gently east.
7.2.3Mineralization and Alteration
Gold mineralization at Haile is hosted by laminated siltstone and felsic volcanics in the Upper Persimmon Fork Formation. Within the laminated siltstone, gold is found at two primary horizons. The primary ore zone is located at upper siltstone / dacite contact where it is capped by less permeable coherent dacite flows. A secondary ore zone is found at the basal siltstone / felsic volcanics contact. The primary mineralization is typically within 100 m of the dacite-siltstone contacts.
The mineralization is disseminated in silicified, pyritic rocks with local K-feldspar and molybdenite and occurs as en echelon clusters of moderately to steeply dipping ore lenses within a 4 km x 1 km area. Eleven named gold deposits are recognized at Haile. From west to east, these deposits include Champion, Small, Mill Zone, Haile, Ledbetter, Red Hill, Palomino, Snake, Horseshoe, Pisces, and Clydesdale that often show ‘pearls on a string’ alignment. Ledbetter is by far the largest orebody (approximately 1 Moz) and includes the shallow Chase and Ledbetter UG deposits. Orebody geometry, depth, size, grade, mineralogy, and alteration are variable. The orientation of gold mineralization generally parallels the regional NW moderate dipping foliation but is primarily concentrated along the metavolcanic metasediment contact with local concentrations deeper in the stratigraphy at the base of metasediment. Orebody geometry is partly controlled by the variable orientation of volcanic sediment contacts and the location of barren dacite sills. Ore lenses are typically 50 to 300 m long, 20 to 100 m wide, and 5 to 30 m thick. Ore zones are separated by barren siltstone, dacite sills, and diabase dikes. The MV / MS contact and gold mineralization gradually deepen from west to east across the Haile district. The MV / MS contact at Champion has been partly removed by erosion in the west portion of the district while is over 500 m deep at the Horseshoe deposit, 4 km east of Champion. Depth and position of the contact are further complicated by faulting and folding. Drilling in southeast areas around Palomino has encountered gold mineralization up to 1 km deep.
Small, mineralized zones at Ledbetter, Red Hill, Mill Zone, and Snake are hosted in the overlying dacite along fault zones within 15 m of the MV / MS contact. Gold grades in mineralized dacite are typically lower than in the underlying rocks while sericite alteration is more intense in the dacite. Hydrothermal brecciation is common in portions of the Ledbetter, Horseshoe, Small, and Champion deposits where milled, silicified siltstone clasts occur in a fine-grained quartz-pyrite matrix intruded by fingers of quartz feldspar porphyry with quartz stockwork veinlets. The secondary mineralization zone shares many characteristics with the upper zone and includes some classic epithermal features such as banded veining, colloform / crustiform quartz adularia veins with local quartz after bladed calcite, indicative of boiling. Gold grades can be elevated (circa 18 g/t) within these veins but quickly drops off to more typical Haile grades in disseminated mineralization within the surrounding wall rock.
| | | | | | | | |
Released: March 27, 2026 | | Page 63 of 275 |
| | | | | | | | |
NI 43-101 Technical Report – Haile Gold Mine, South Carolina, United States |
| |
| |
Mineral zonation grades outward from quartz-pyrite ± K-feldspar + gold (QS) / QSP ± gold / sericite + pyrite ± pyrrhotite / chlorite-calcite ± epidote (propylitic). QS and QSP mineralized zones are tens of metres thick. Sericite envelopes range in thickness from tens to hundreds of metres and are controlled by protolith, permeability, and weathering. Within the mineralized zones, quartz is dominant (60% to 80%), pyrite is moderate (1% to 10%), and sericite is variable at 5% to 40%. Semi-massive pyrite zones are locally observed over thicknesses of 0.5 to 5 m, especially in the Mill Zone, Red Hill and Haile pits.
Early pervasive, replacement-style sulfidation and silicification is overprinted locally by hydrothermal brecciation, quartz stockwork veining, and cm-scale quartz-pyrite veining. These secondary features generally define the high-grade zones within an ore body. Pyritized and sericitized envelopes extend beyond the silicified ore zones, are elongated parallel to foliation, and broadly define the 0.1 g/t Au shell. Pyrite grain size is typically less than 20 microns (µm) in ore zones. A late phase of barren, coarse, cubic, undeformed pyrite that formed during regional greenschist metamorphism is present outside of mineralized zones. Pyrite cubes in chloritic metamorphosed rocks are 0.5 to 1 mm in size but can be as large as 1 to 2 cm. Pyrrhotite commonly occurs in 5 to 25 m thick halos around and on the edges of ore zones but is sometimes present within the deeper, underground deposits. Its ductile nature produces length; width ratios more than 5:1 in foliated rocks. Pyrrhotite formation is interpreted to be coeval with early, fine-grained pyrite precipitation.
Gold spatially correlates with silver, arsenic, molybdenum, and tellurium. Base metals are rare at Haile. Thin section petrography and scanning electron microscopy show that the gold occurs as native gold, gold-pyrite, gold-pyrite-pyrrhotite clusters in fine-grained silicified zones, and in Au tellurides. Gold tellurides are more common deeper in the system at the Clydesdale and Ledbetter Underground zones. Smeared molybdenite occurs primarily on foliation surfaces and as fine-grained aggregates in silicified zones. Molybdenite at Haile has been dated by Re-Os isotopes at 553.8 ± 9 Ma (Stein et al., 1997), which is coeval with the zircon crystallization age of 553 ± 2 Ma reported by Ayuso et al. (2005). This age correlation indicates that molybdenite mineralization was concurrent with Persimmon Fork volcanism. Seven Re-Os molybdenite ages from Haile (Mobley et al., 2014) yielded ages ranging from 529 to 564 Ma. Four of these samples produced an average age date of 548.7 ± 2 Ma (Mobley et al., 2014).
| | | | | | | | |
Released: March 27, 2026 | | Page 64 of 275 |
| | | | | | | | |
NI 43-101 Technical Report – Haile Gold Mine, South Carolina, United States |
| |
| |
8Deposit Types
Hundreds of gold occurrences in the southeast USA are located along a 700 km long SW-NE trend that extends from Alabama to Virginia (McCauley and Butler, 1966, Butler and Secor, 1991). Most of these deposits are small prospects worked and explored along narrow quartz veins. The larger gold deposits are located at or near the contact between volcanic and sedimentary rocks, including the Haile, Brewer, Barite Hill, and Ridgeway mines. Brewer is unique in the region and is classified as a high-sulfidation epithermal gold system with volcanic and breccia-hosted gold accompanied by quartz, pyrite, topaz, enargite, and chalcopyrite. Gold mineralization at Barite Hill contains the assemblage of pyrite-chalcopyrite-galena-sphalerite and is characteristic of a submarine, high-sulfidation volcanogenic massive sulfide deposit. Haile and Ridgeway are similar in that gold mineralization is hosted by silicified, sheared and foliated siltstone.
8.1Haile Genetic Model
The origin of the Carolina slate belt gold deposits is controversial. Contributing theories include:
•Worthington and Kiff (1970) concluded that a genetic link must exist between ore genesis and volcanism in the Carolina Terrane due to the intimate association with volcanic host rocks.
•Spence et al. (1980) found a genetic link between gold mineralization hosted within siliceous and pyritic zones and intense alumina alteration which produced kaolinite and sericite-rich zones stratigraphically above mineralized zones and interpreted these as analogous to features observed in modern hot springs based on geochemical signatures, stratiform nature, stratigraphic position, and geochronology.
•Feiss et al. (1993) built on the model of Spence et al. (1980) by proposing that hot spring type mineralization must have occurred under extension in a back-arc setting based on oxygen isotope data, which they interpreted to mark a shift from a subaerial to submarine environment. Feiss et al. classified Haile as a syngenetic hot spring system formed as the volcano-sedimentary pile accumulated with subsequent metamorphic overprints.
•Maddry and Speer (1993) proposed an exhalative model for mineralization at Haile whereby gold deposition resulted from hydrothermal fluids venting to the seafloor to produce stratabound ore bodies in marine volcaniclastic rocks. They interpreted intense alumina alteration noted by Spence et al. (1980) to be the effects of saprolitic weathering in warm, humid climates. Strong ductile deformation and structural dismemberment, mineral paragenesis, and mineral textures suggest ore deposition within shear zones or fold axes and that the fluid source was from metamorphic devolatilization reactions and pressure solutions related to Precambrian collisional events (e.g., Tomkinson, 1988; Hayward, 1992). Hayward (1992) emphasized the importance of folds in controlling the location of ore formation in anticlinal fold hinges. Hayward also noted that alteration zones at Haile are generally discordant to bedding and commonly display symmetrical patterns around ore bodies. Tomkinson (1988) proposed that Haile was an orogenic deposit based on textural and structural connections between gold mineralization and shear zones.
•Bierlein & Crowe (2000) discussed evidence for epigenetic (i.e., orogenic) vs. syngenetic gold mineralization for CSB gold deposits and concluded the evidence strongly favored syngenetic mineralization with local gold remobilization.
| | | | | | | | |
Released: March 27, 2026 | | Page 65 of 275 |
| | | | | | | | |
NI 43-101 Technical Report – Haile Gold Mine, South Carolina, United States |
| |
| |
•Hardy (1989) and Worthington (1993) interpreted the features observed by Hayward (1992) and Tomkinson (1988) as evidence for the remobilization of pre-existing mineralized horizons, causing gold enrichment along structurally controlled pathways during deformation which postdated the primary phase of mineralization at Haile. Hardy also concluded that fluids deposited silica, K-feldspar, pyrite, and gold in breccia zones. Gillon et al. (1995) proposed a model at Ridgeway that invoked early gold mineralization and remobilization during Neoproterozoic deformation.
•Foley et al. (2001) observed multiple generations of pyrite in Haile ores and concluded that disseminated pyrite and gold mineralization were contemporaneous with host volcanic rocks and volcaniclastic sediments.
Pressure shadows around pyrite grains, stretched pyrite and pyrrhotite grains, and flattened hydrothermal breccia clasts indicate that there has been deformation subsequent to sulfide mineralization. These observations are consistent with either pre- or syn-tectonic gold mineralization. Mineralized zones were subsequently foliated and sheared accompanied by regional greenschist facies metamorphism. Similar timing for gold mineralization and peak magmatism in the Haile and Ridgeway areas suggests that the hydrothermal systems that produced these deposits were related to magmatism. The geological understanding of the Haile deposit is increasing as exploration and mining continue. Haile is currently interpreted as a low sulfidation, disseminated, sediment-hosted, gold system with some local epithermal veining based on tectonic setting, low sulfide content, host rock lithology, and geochemistry.
8.2Haile Geological Model
The Haile geological model was constructed using Seequent’s Leapfrog Geo software (Leapfrog). The model box is approximately 4 km EW x 2 km NS x 800 m deep. The geological understanding of the Haile mineralization continues to evolve and is documented by mapping and drilling. Low grade mineralization is typically continuous, albeit exhibits local complexity, and concentration into economic mineralization pods. The 3D geological interpretations provide a good basis for 3D modeling and gold estimation. The Haile geological models are updated as needed with ongoing drilling.
The model consists of 3D solids for the following five geological units: dacitic metavolcanics, rhyodacitic metavolcanics, metasediments, basement undifferentiated rocks, and dikes. Surfaces that represent faults and shears, the base of CPS, base of surface clay alteration, base of saprolite, and the base of surface oxidation have also been modeled. Consistency of the geologic model has been improved by relogging of several hundred core holes and incorporation of Portable X-ray Fluorescence (pXRF) and other geochemical data.
| | | | | | | | |
Released: March 27, 2026 | | Page 66 of 275 |
| | | | | | | | |
NI 43-101 Technical Report – Haile Gold Mine, South Carolina, United States |
| |
| |
9Exploration
9.1Pre-Romarco
Modern exploration, development, and mining activity on the Haile property began with mapping in 1970 (Worthington and Kiff, 1970). Between 1973 and 1977, Cyprus conducted an extensive exploration program consisting of surface geophysical surveys, trenching, geologic mapping, auger drilling, core drilling, air-track drilling, and metallurgical testing. Cyprus calculated the Haile Mineral Resources at 186,000 oz (5,785 kg) of gold with an average grade of 2.13 g/t. Resources reported in this section do not conform to the standards of NI 43-101 and are included only as part of the historic record.
Between 1981 and 1985, Piedmont explored the historic Haile Mine and surrounding properties with core and RC drilling, surface geophysics, soil sampling, trenching, and rock-chip sampling. Piedmont’s total drilling was 69,647 m, much of which was for mine development. Piedmont mined several deposits on the Haile property from 1985 to 1992, producing about 86,000 oz (2,675 kg) of gold.
In 1991, Amax performed an extensive exploration program on the Haile property under an exploration option with Piedmont. In 1992, Amax and Piedmont formed Haile Mine Venture (HMV) as a joint venture, and from 1992 to 1994 HMC (the operating company) completed a program of exploration / development drilling using core and RC drilling, mineral resource estimation, and technical report preparation. The Ledbetter deposit was discovered, and the Mill and Snake areas were expanded.
Kinross acquired Amax in 1998, assumed Amax’s portion of the HMC joint venture, and later purchased Piedmont’s interest. Kinross performed no exploration activities on the property and limited their operations to a highly successful reclamation program from 1998 to 2007.
9.2Romarco
Romarco completed the Haile property acquisition in October 2007. By February 2008 Romarco had reviewed the quality of historical drilling and assay data and turned their effort to exploration and resource expansion drilling. During its ownership, Romarco significantly expanded the resource and reserve of the property. This report documents the results of the drill program achieved to date with Romarco assay data available through November 17, 2011 (i.e., data cut-off for previous Independent Mining Consultants, Inc (IMC) 15 Mineral Resource estimate), and subsequently by OceanaGold, as described below.
9.3OceanaGold
OceanaGold purchased Romarco in October 2015 and continued the drilling programs to expand and derisk resources and reserves at Haile. Both brownfields exploration and mine development drilling is ongoing, with particular focus on underground growth opportunities.
| | | | | | | | |
Released: March 27, 2026 | | Page 67 of 275 |
| | | | | | | | |
NI 43-101 Technical Report – Haile Gold Mine, South Carolina, United States |
| |
| |
9.3.1Geologic Mapping and Surface Sampling
Numerous workers have performed geologic mapping and surface sampling in and around the Haile Mine area. Mapping is challenged by poor bedrock exposure due to extensive saprolitic weathering, CPS cover, and dense vegetation. Outcrop is estimated at only 1% to 2% in the Haile area. Detailed mapping is generally restricted to mining excavations. The United States Geological Survey (USGS) published a geologic map for the Kershaw quadrangle in 1980 (Bell, 1980). More detailed mapping was conducted at Haile by Spence, Kiff, and Maye, who constructed a detailed geologic map for the mine site in 1975. Subsequent detailed geologic mapping was done by Taylor (1985) and Cochrane (1986). Ph. D. dissertations by Tomkinson (1985) and by Hayward (1991) included detailed geologic mapping in open pits. Geologic mapping by OceanaGold geologists at the Mill Zone pit resumed with mining in 2016.
Historical mapping has been scanned and loaded into the VulcanTM software for structural interpretation, exploration planning, and geologic modeling. The use of the structural dataset in conjunction with the drilling dataset has provided the foundation for a 3D digital geologic model. This model continues to be used successfully to expand the Mineral Resources and Mineral Reserves at the Haile property. Surface samples have been compiled into an Access database and evaluated by OceanaGold. Over 5,000 samples have been compiled based on location, sample type (rock chip, saprolite, soil, stream sediment), rock type, alteration and assay. QA/QC data are generally lacking for these surface samples, and most were assayed only for gold.
9.3.2Geophysics
Numerous geophysical surveys have been conducted at Haile since the 1970’s. The following geophysical methods have been applied at Haile:
•Gravity
•Airborne and Ground Magnetics
•Airborne Electromagnetics
•Ground-based Induced Polarization
•Ground-based Electrical Resistivity
•Self-Potential
•Down-hole Induced Polarization
Numerous IP / Resistivity surveys have been conducted at Haile, including surveys by Piedmont in 1975 and 1989, by Romarco in 2015 at Champion, Mill Zone, Ledbetter, and Horseshoe, and by OceanaGold in 2016 adjacent to Haile. Geophysical surveys conducted by Piedmont in the late 1980’s include ground magnetics and dipole-dipole IP / resistivity methods that led to discovery of the Snake deposit (Larson and Worthington, 1989). The ground magnetic data were acquired in a patchwork fashion and were not corrected for diurnal changes. The dipole-dipole IP / resistivity data were reprocessed by OceanaGold in 2016 (Weis, 2016).
In 2023, OceanaGold contracted Zonge International Geophysical Services and Equipment to reprocess previous surface IP / resistivity data and to perform additional downhole IP surveys. Downhole IP / resistivity was able to successfully identify known mineralization in a test hole, but five additional holes did not reveal any priority targets. Re-processed surface IP / resistivity data yielded new potential target areas.
| | | | | | | | |
Released: March 27, 2026 | | Page 68 of 275 |
| | | | | | | | |
NI 43-101 Technical Report – Haile Gold Mine, South Carolina, United States |
| |
| |
Regional gravity survey and aeromagnetic data have been downloaded from the South Carolina data repository (Daniels, 2005). These were supplemented by more detailed gravity stations in 2009 and 2010 by Romarco along roads in the Haile area and as transects over Haile deposits.
Airborne EM and magnetic surveys were flown by Aeroquest for Romarco in 2010 over the Haile-Brewer area on 50 m and 100 m spaced flight lines with a bearing of 150° to 330°. The magnetic data can map the diabase dikes and granite plutons but do not differentiate the older units. Proprietary 3D inversion modeling was conducted by OceanaGold in 2016 to depths of 1,500 m using airborne magnetic and EM data.
| | | | | | | | |
Released: March 27, 2026 | | Page 69 of 275 |
| | | | | | | | |
NI 43-101 Technical Report – Haile Gold Mine, South Carolina, United States |
| |
| |
10 Drilling
During 2016, the Romarco Minerals drilling database was translated to OceanaGold’s standard acQuire database platform. Where available, original source assay and survey data were used for the acQuire translation and database validation. There was a further internal database review in late 2018 / early 2019. No material errors were identified.
10.1Type and Extent
Drilling at the Haile property commenced in the 1970’s and has continued intermittently to the present by several companies. The database used for this latest Mineral Resource estimate was extracted from the acQuire database on October 29, 2025. It contains 4,057 drillholes including 1,614 core holes for 432,249 m (representing 50% of the metres drilled), 209 hybrid (RC with diamond tail) holes for 124,333 m (14%), and 2,184 RC holes for 311,031 m (36%). Some of the historical drilling (i.e., shallow exploration auger or air track drilling) was judged insufficiently reliable and was excluded from the Mineral Resource estimation database. RC and core drilling by Romarco continued from 2008 to 2012 and then resumed in 2015 after a two-year hiatus due to permitting and lower gold prices. Drilling at Haile since early 2015 has almost been entirely core drilling, besides targeted RC grade control campaigns. Drill campaigns by company and year are summarized in Table 10-1.
| | | | | | | | |
Released: March 27, 2026 | | Page 70 of 275 |
| | | | | | | | |
NI 43-101 Technical Report – Haile Gold Mine, South Carolina, United States |
| |
| |
Table 10-1: Haile Drilling Campaigns by Year, Owner and Lab
| | | | | | | | | | | | | | | | | | | | |
Start Hole ID | End Hole ID | Hole Type | Start Yr. | End Yr. | Owner | Lab |
DDH0001 | DDH0031 | core | 1975 | 1977 | Cyprus | CMS, Cyprus, Union |
WW0600 | WW0673 | RC | 1975 | 1990 | Piedmont | NE Geochemical |
DDH0032 | DDH0098 | core | 1985 | 1990 | Piedmont | Piedmont, NE Geochemical |
NDH0001 | NDH0037 | core | 1985 | 1988 | Nicor | Cone Geochemical |
RC0001 | RC0031 | RC | 1985 | 1986 | Piedmont | Union |
RC0032 | RC0183 | RC | 1986 | 1987 | Piedmont | NE Geochemical |
NRH0001 | NRH0054 | RC | 1987 | 1988 | Nicor | Cone Geochemical |
RC0184 | RC1230 | RC | 1987 | 1990 | Piedmont | Bondar Clegg, NE Geochemical |
RC1231 | RC1303 | RC | 1990 | 1992 | Piedmont | Bondar Clegg |
DDH0099 | DDH0288 | core | 1991 | | AMAX | Bondar Clegg |
RC1304 | RC1501 | RC | 1992 | 1994 | AMAX | Bondar Clegg |
DDH0289 | DDH0341 | core | 2008 | Aug-15 | Romarco | Inspectorate |
DDH0342 | DDH0431 | core | 2008 | 2009 | Romarco | Alaska |
RC1502 | RC1527 | RC | 2008 | 2009 | Romarco | Inspectorate |
DDH0432 | DDH511 | core | 2009 | Sep-11 | Romarco | KML |
RC1528 | RC2083 | RC | Jan-10 | Jan-11 | Romarco | Alaska |
RCT0001 | RCT0157 | RC/core | Apr-10 | Jan-11 | Romarco | Alaska |
RC2084 | RC2122 | RC | Jan-11 | Sep-11 | Romarco | Acme, Chemex, KML |
RCT0158 | RCT0178 | RC/core | Jan-11 | Sep-11 | Romarco | Acme |
DDH512 | DDH596 | core | Oct-11 | Jun-17 | OceanaGold | KML |
RC2123 | RC2205 | RC | Oct-11 | Jun-15 | Romarco | KML |
RCT0179 | RCT0211 | RC/core | Oct-11 | Dec-12 | Romarco | KML |
DDH0597 | DDH1305 | core | Jul-17 | ongoing | OceanaGold | ALS |
RC2219 | RC2396 | RC | Feb-20 | ongoing | OceanaGold | ALS, SGS |
UGD0001 | UGD0121 | core | 2023 | ongoing | OceanaGold | ALS, SGS |
UGC0004 | UGC0194 | core | 2023 | ongoing | OceanaGold | SGS |
Source: OceanaGold, 2025
10.2Sample Collection
Both RC and Diamond Drilling (DDH, UGD, UGC) have been used for the Resource estimates at Haile. This section describes the sampling procedures applied to both data collection techniques. Historical drilling prior to Romarco (pre-2007) accounts for approximately 16% of the data. The sample procedures applied to the historic drilling (i.e., drilling prior to Romarco) at Haile are not well documented. Having said this, approximately ten years of mining have tested the veracity of the Resource estimates, which are based on this data. No material flaws have been identified.
The techniques described in this section reflect the procedures applied by Romarco and OceanaGold during the period 2007 to October 29, 2025.
| | | | | | | | |
Released: March 27, 2026 | | Page 71 of 275 |
| | | | | | | | |
NI 43-101 Technical Report – Haile Gold Mine, South Carolina, United States |
| |
| |
Reverse Circulation Drilling
The RC drilling at Haile typically used 16 cm drill bits. RC drills are equipped with a cyclone and a rotary splitter. Most RC drilling at Haile was under wet conditions. Water injection was typically 15 to 19 litres per minute (L/min) above the water table and decreases to 4 L/min when groundwater is encountered. Sample sizes were between 3 to 7 kg (20 and 30 lbs) with a minimum requirement of 3 kg (15 lbs). The standard size reflected a 15% to 20% split of the total drilled volume. Drill intervals were generally 1.5 m (5 ft) intervals and were collected in bags, to which flocculant was added to settle fine particles. Sampling during advancement of each twenty-foot (6.1 m) rod was a continuous process. Chip samples were collected from the waste discharge and stored in plastic chip trays for geologic logging. The wet samples were bagged, drained, and allowed to settle (aided by flocculent). Sample bags were collected at the end of each shift and transferred to the Haile sample storage area for initial drying.
Diamond Drilling
Diamond core drilling is by wireline methods and generally utilizes HQ and NQ size core with
63.5 mm and 48.3 mm diameters, respectively. Drill rods are 10 ft (3.1 m) or 5 ft (1.5 m) long. Core is transferred from the core barrels into plastic core boxes at the drill rig by the driller.
Each core box can hold up to 10 ft (3.1 m) of core stored in five rows, each 2 ft (0.6 m) long. Core is gently broken by hammer as required to completely fill the boxes and marked on core as a mechanical break. Hole numbers and drill depths are marked on the outside of the core boxes and interval marker blocks are labeled and placed in the core box. Boxed whole core is covered with plastic lids and is transported to the core shed for logging and sampling by HGM staff or contractors.
Sample Recovery
Reverse Circulation: No primary RC sample weights were recorded for RC drilling, so RC recoveries cannot be directly calculated. However, 34,000 rotary split RC subsamples were weighed by Romarco. Splitter ratio settings ranged from 8% to 17%, based on back calculating the range of likely total sample weights. RC recoveries appear to have been largely acceptable.
Diamond Core: Core recoveries average 92% and are rarely less than 90%. There is no observed grade relationship between core recovery and grade. Core recovery in saprolite ranges from 10% to 50%. Minimal ore has been identified in saprolite.
10.3Collar Locations and Downhole Surveys
Drillhole numbers are assigned and maintained by company geologists via an Excel tracking spreadsheet that records location, depth, azimuth, dip, start, and end dates. Historical drillhole collar surveys by Piedmont and Cyprus were surveyed by theodolite and recorded on paper. Drill set ups in the field were by traditional Brunton compass methods to establish azimuths within 2° accuracy. Since February 2019, the Reflex Aziliner tool or Stockholm Precision Tools POLESTAR have been used for drillhole set ups within 0.3° accuracy.
Haile drillhole collars from 2007 to October 2017 were surveyed by Romarco and OceanaGold surveyors using digital GPS methods.
| | | | | | | | |
Released: March 27, 2026 | | Page 72 of 275 |
| | | | | | | | |
NI 43-101 Technical Report – Haile Gold Mine, South Carolina, United States |
| |
| |
Collar surveys are named by hole number, downloaded as .csv files, and saved on a network drive. Collar coordinates are verified against planned coordinates by the geologist overseeing the drilling and then imported into the acQuire database.
Historical drillholes prior to Romarco in 2007 were not surveyed for downhole deviation. The majority of these holes intersected mineralization less than 75 m down hole, so the locational uncertainty is unlikely to be large.
Since 2007, all surface angle holes have been surveyed using the Reflex Sprint-IQ and EZ-Gyro survey tools. Multishot surveys are recorded down hole for azimuth and dip every 6.1 m (20 ft). Upon verification, the data are saved to a local drive and imported into the acQuire database.
Survey data are also stored digitally in the acQuire database. As part of a company-wide metrification process, OceanaGold transformed all surface and drillhole data from the South Carolina NAD27 coordinate system to the UTM NAD83 zone 17N system in November 2016. Coordinate transfer was verified by both geologists and engineers; no issues were identified. Additionally, collar coordinate elevations have been adjusted by +1000 metres to avoid negative reduced level values.
All underground holes are surveyed using Stockholm Precision Tool’s GYROMASTER or Boart Longyear’s TRUCORE. Survey data is downloaded from the tool and verified by HGM staff, stored on a local network, and uploaded to the acQuire database.
| | | | | | | | |
Released: March 27, 2026 | | Page 73 of 275 |
| | | | | | | | |
NI 43-101 Technical Report – Haile Gold Mine, South Carolina, United States |
| |
| |
11Sample Preparation, Analyses and Security
11.1Sample Preparation for Analysis
Reverse Circulation Drilling
The RC sample bags were transferred by HGM staff to the sample handling facility where they are prepared for shipment to a lab. RC samples were prepared at either the KML in Kershaw, South Carolina, the AHK preparation facility in Spartanburg, South Carolina, or the ALS preparation facility in Tucson, Arizona.
Lithological chip samples are retained in chip trays, labeled with the drillhole number and depth intervals in permanent marker.
The RC sample bags from the truck were transferred to the Haile sample handling facility where they are prepared for shipment to a lab. RC samples were prepared at either the KML in Kershaw, South Carolina, the AHK preparation facility in Spartanburg, South Carolina, or the ALS preparation facility in Tucson, Arizona.
Samples follow one of two paths:
•Some samples are weighed, and sample number tags added to the bags. The samples are poured through a Jones splitter to reduce the size to roughly 2.7 kg (6 lbs) for shipment to the sample lab. Coarse rejects are kept in their original sample bags and stored on site on pallets.
•Alternatively, samples are staged at Haile and placed in containers for direct shipment to KML, AHK, or ALS.
Diamond Drilling
At the exploration office, the core is cleaned, measured, and photographed. Geotechnical and geologic logging are completed on the whole core. All logging and sampling handling are conducted by HGM staff. Data collecting during core logging include structure, rock type, alteration, mineralogy, RQD, core recovery, hardness and joint condition. Alteration is logged as relative intensity and includes weak, moderate and strong categories. Standardized templates are used for all logging with drop down menus. Geologists routinely review core together and compare notes to ensure accuracy and consistency. Density samples are collected every 12 m (40 ft) and use the water immersion method to measure specific gravity. Competent core at Haile does not require plastic or wax coatings for density measurements. Pre 2017, paper logs were entered into an Excel spreadsheet and then imported into the acQuire database by the admin assistant. Logs are periodically checked by geologists for accuracy and completeness. Tablet-based geology logging in Excel was initiated in 2017 and enables logs to be directly uploaded into acQuire. Logging is conducted in the Imperial system using feet due to the 10 foot drill rods. Data are converted to metric units as part of being imported into the acQuire database. The logging geologist assigns the sample intervals and sample numbers prior to core sawing. Sample ID tags are placed in the core boxes. Sample lengths are typically 5 ft (1.5 m) and can range in length from 1 ft (0.3 m) to 10 ft (3.1 m). Geologic sample breaks may be selected by the geologists based on contacts or structural boundaries. ‘No sample’ intervals are marked by orange flagging tape in surficial fill or rubble zones and in massive barren diabase dikes exceeding 50 ft (15 m) in thickness. Most core is sawed in half along the core axis using circular masonry blades and then placed into sample bags labelled with
| | | | | | | | |
Released: March 27, 2026 | | Page 74 of 275 |
| | | | | | | | |
NI 43-101 Technical Report – Haile Gold Mine, South Carolina, United States |
| |
| |
the sample ID. An exception is underground grade control core (UGC) holes which are sampled without splitting. Paper ID tags are also placed into the bags. Saprolite zones are manually cut with a putty knife. The saw or knife are cleaned between each sample. The cooling water for the saw is not recycled and is discharged into a permitted pond.
Core samples are delivered to the sample preparation facilities. Core is prepared primarily at the ALS facility in Tucson, Arizona but has also been prepared at the company-owned KML facility in Kershaw, South Carolina and the AHK preparation facility in Spartanburg, South Carolina. Since 2018, KML has been operated and managed by SGS Testing Laboratory Services (SGS).
11.1.1Off-Site Sample Preparation
AHK, Spartanburg, South Carolina (ISO/IEC 17025 accredited)
Once the samples arrive at AHK in Spartanburg, South Carolina the following procedures were applied:
•Dry samples at 65°C (150°F (degrees Fahrenheit))
•Jaw crush samples to 80% passing 2 mm
•Split sample with a riffle splitter to prepare the sample for pulverizing
•Pulverize a 250 g sample to 90% passing 150-mesh (0.106 mm)
•Ship about 125 g of sample pulp for assay
Sample pulps were shipped to the AHK Laboratory in Fairbanks, Alaska for analysis.
KML, Kershaw, South Carolina (ISO/IEC 17025 accredited)
•Dry samples at 93°C (200°F)
•Jaw crush samples to 70% passing 10-mesh (2 mm)
•Split sample with a riffle splitter to prepare the sample for pulverizing
•Pulverize a 450 g sample (± 50 g) to 85% passing 140-mesh (0.106 mm)
•Approximately 225 g of pulp sample is sent for fire assay (FA)
Sample pulps from KML were either analyzed at KML or shipped to the AHK Laboratory in Fairbanks, Alaska for analysis.
ALS, Tucson, Arizona (ISO/IEC 17025 accredited)
•Dry samples, if excessively wet, at up to 120°C (248°F)
•Jaw crush samples to 70% passing 10-mesh (2 mm)
•Split sample with a Boyd rotary splitter to prepare the sample for pulverizing
•Pulverize a 250 g sample to 85% passing 75 microns
•Approximately 225 g of pulp sample is sent for fire assay
•Fire assay performed on a 30 g sample with an Atomic Absorption Spectroscopy finish
•For samples over 10 g/t Au, fire assay is performed on an additional 30 g sample with a gravimetric finish
| | | | | | | | |
Released: March 27, 2026 | | Page 75 of 275 |
| | | | | | | | |
NI 43-101 Technical Report – Haile Gold Mine, South Carolina, United States |
| |
| |
11.2Sample Analysis
Generally, all Mineral Resource samples are processed at ALS and grade control samples are processed at KML. But in some instances, this may be switched due the Laboratory capacity or time constraints.
The procedures currently applied at ALS for assay are as follows:
•Fire assay 30 g of pulp sample for gold, with Atomic Absorption finish
•If the gold assay results greater than or equal to 3 g/t Au, an additional 30 g of pulp sample is cyanide leached for gold using Atomic Absorption finish. Where it equals or exceeds 10 g/t an additional 30 g of pulp sample is fire assayed for gold using gravimetric finish
•Multi-element ICP analysis is performed as requested, normally testing specific areas
•Carbon and sulfur determinations are performed as requested, normally testing areas
ALS is ISO 9001 certified and ISO/IEC 17025 accredited. Coarse rejects and returned samples are stored at Haile under the control of HGM staff.
The procedures currently applied at KML for assays are as follows:
•Inventory the samples and create worksheets
•Insert quality control samples at prescribed rates (see Section 11.4)
•Fire assay 30 g of pulp sample for gold, with Atomic Absorption finish
•If the gold assay result is greater than or equal to 3 g/t Au, an additional 30 g of pulp sample is fire assayed for gold using gravimetric finish, and 0.5 g of pulp sample is analyzed for silver using a four-acid digestion with Atomic Absorption finish
•Multi-element ICP analysis is performed as requested, such as testing specific areas
•Carbon and sulfur determinations are performed as requested, such as testing waste mining areas.
KML is ISO/IEC 17025:2005 accredited for gold and silver assays through the Standards Council of Canada.
11.3Check Assays
Early in the Romarco drill program, samples were sent to the Inspectorate Lab in Reno, Nevada for preparation and assay. Inspectorate is an ISO 9001 certified laboratory. Check assays were sent to ALS-Chemex in Reno, Nevada. Beginning in late 2024, crush duplicates have been assayed for UG Grade Control drilling at KML and to date there has been good correlation with the original assay.
11.4Quality Assurance / Quality Control Procedures
11.4.1Certified Reference Material
CRM is routinely inserted at a rate of one in twenty samples (5%) per industry guidelines. CRMs used by Romarco were purchased from and certified by Rocklabs. OceanaGold currently uses CRMs from Rocklabs and OREAS.
| | | | | | | | |
Released: March 27, 2026 | | Page 76 of 275 |
| | | | | | | | |
NI 43-101 Technical Report – Haile Gold Mine, South Carolina, United States |
| |
| |
11.4.2Blanks
Blanks are routinely inserted at a rate of one in twenty samples (5%). Blanks used by Romarco and OceanaGold include commercially available marble, sand, quartz pebble.
11.4.3Duplicates
Starting in late 2024, crush duplicates have been assayed for UG grade control samples. Good comparisons have been reported against the original samples (within 20% variance of original sample).
11.4.4Actions and Results
QA/QC data and graphs are generated from the acQuire database. CRMs returning values outside of 20% variance from the expected value are re-assayed for failed batches. Blanks returning values greater than 0.05 parts per million (ppm) are also re-assayed. Reruns have been acceptable, and those values were imported into and accepted in the acQuire database.
Security Measures
RC coarse rejects and returned samples are stored and secured at Haile where they are under the control of HGM staff. Pulps, RC chips, and coarse rejects are stored at the exploration office. Boxed core is palletized and stored in a grass lot on the east side of the mine property. Pallets are covered by tarps and aluminum tags with hole IDs attached to each pallet.
11.5Opinion on Adequacy (Security, Sample Preparation, Analysis)
Historical holes drilled before 2007 comprise 15% of total drill metres and were not documented to the same standard as current OceanaGold practices. However, there is no evidence of material problems with the pre-2007 drilling, sampling and analyses. Furthermore, over ten years of mining has tested the veracity of the Mineral Resource estimates which are based on this data. No material flaws have been identified.
Sample collection, preparation, and analysis are according to industry standards. All labs used by Romarco and OceanaGold are certified to ISO-9001 standard or 17025 accredited for gold and silver through the Standards Council of Canada. The primary external lab used for check assays at ALS Reno is both ISO-9001 certified and 17025 accredited.
Core, pulp, and RC sample storage are considered secure. Sample transport is by HGM staff between secure facilities and by approved couriers to external labs. No significant risks have been identified for sample contamination or sample exchange. No samples have been reported as missing or tampered during transportation upon receipt at the lab.
All Haile drillhole data (assays, logs, surveys) are stored in the secure acQuire database, which is managed by the Principal Database Geologist in New Zealand. The database geologist has no direct reporting relationships to the Haile geologists or to the Director of Exploration. The acQuire database is an industry certified database. Database changes are tracked and verified. Strict data importing and verification protocols must be followed to avoid, for example, overlapping or missing intervals, mismatched hole depths in different fields, duplicate hole IDs or sample numbers, and invalid logging codes.
| | | | | | | | |
Released: March 27, 2026 | | Page 77 of 275 |
| | | | | | | | |
NI 43-101 Technical Report – Haile Gold Mine, South Carolina, United States |
| |
| |
In the opinion of the QP, the sample security, preparation and analyses are adequate for the purposes of Mineral Resource estimation.
| | | | | | | | |
Released: March 27, 2026 | | Page 78 of 275 |
| | | | | | | | |
NI 43-101 Technical Report – Haile Gold Mine, South Carolina, United States |
| |
| |
12 Data Verification
Verification of drilling, sampling and analyses is discussed as Pre-Romarco, Romarco and OceanaGold data groups in the sections below.
12.1Data Validation of Pre-Romarco Holes
Data validation was conducted by OceanaGold geologists in 2019 for pre-Romarco (pre-2008) RC and core holes. A total of 1,775 holes representing 54% of the resource database were validated using Au best values stored in the acQuire database. This includes drillholes RC0001-1501 (n=1403), DDH0001-0288 (n=288), NDH0001-0037 and NRH0001-0054 (n=84) drilled between 1975 and 1994. The data were compiled, sorted, filed from source data using original logs and assay certificates from dozens of binders and hard copy files for each drillhole. Differences between assays, depths, dips, azimuths, downhole surveys and collar coordinates were recorded and evaluated in spreadsheets. All paper files and logs are securely stored in exploration office at Haile.
No major or systematic errors were identified and there is no material impact to Reserves or Resources based on validation of pre-2008 drillhole data (Jory, 2019). Legacy drillhole data from 1975 to 1994 stored in acQuire are regarded as reliable and accurate. Romarco and OceanaGold data are also reliable and accurate. Minor data corrections were made for some legacy gold assays, collar coordinates, hole depths, and interval depths. Data validation showed that 0.77% of DDH holes and 5.4% of RC holes required corrections based on differences >0.007 ppm Au between acQuire Au best values and assay certificates or assay sheets. Many of the RC holes had negligible errors <1% of the acQuire assay vs. original assay. Most of the suspect holes are from the early Cyprus and Piedmont drill campaigns. Amax holes are of high confidence and include certified assays by Bondar Clegg with fire and gravimetric assays.
As a precautionary measure, extra diamond core drilling targeted within open pit designs has been completed in areas with large numbers of legacy (pre-Romarco) RC holes, including Snake, Red Hill and Haile. The Mill Zone, Ledbetter, Horseshoe and Small pits are largely drilled with core holes and have no RC grade bias risk. Extra diamond core drilling at Ledbetter UG resulted in the removal of legacy (pre-Romarco) RC holes for the Mineral Resource estimate.
12.2Verification of Romarco and OceanaGold Data
There are 24,794 CRM samples recorded in the OceanaGold acQuire database. There are an additional 20,148 blank samples. The number of CRM samples submitted by year varies and largely reflects the drilling activity in that year. The performance of these CRMs revealed no material problems with laboratory performance. Blanks and CRMs are inserted at industry normal frequencies of 1 in 20 samples.
| | | | | | | | |
Released: March 27, 2026 | | Page 79 of 275 |
| | | | | | | | |
NI 43-101 Technical Report – Haile Gold Mine, South Carolina, United States |
| |
| |
12.2.1Romarco Data Verification
In addition to the checks done by OceanaGold during database translation and the 2018 / 2019 review, the following checks have been made by IMC for drilling completed by Romarco (2008 to 2014).
•A comparison of certificates of assay from the laboratory vs. the Romarco computerized data base to check the reliability of data entry
•Statistical analysis of the CRMs that were inserted by Romarco for analysis by the assay lab
•Statistical analysis of the blank samples that were inserted by Romarco for analysis by the assay lab
•Statistical analysis of the check samples that were submitted by Romarco to a third-party laboratory
The QP has reviewed the checks and believes that the data are of acceptable quality for the purposes of Mineral Resource estimation.
12.2.2Horseshoe Data Verification 2016
In 2016, OceanaGold undertook a program of database verification for drilling at the Horseshoe Underground deposit:
•Assay Verification – 5% check of assay values
•Collar Verification – 100% check of collar locations
•Downhole Survey Verification – 100% check on downhole surveys
•CRM and Blank QA/QC
•KML vs. ALS Horseshoe assay comparison
The review identified no material flaws. The Horseshoe data is considered of acceptable quality for the purposes of Mineral Resource estimation. The KML vs. ALS check assay comparison study for Horseshoe concluded that “statistical variance from these studies for AuAA vs. AuFA comparisons (n=512) between KML and ALS Tucson indicate that the KML lab is 5% to 10% low, or conversely that the ALS lab is 5% to 10% high. KML adjusted their AA dilution process in late October 2016 to achieve better fit with expected values”. The KML assay data were validated and used in the Mineral Resource model.
All Horseshoe drilling was core using OceanaGold LF90 drills and company drillers. Sample preparation and assays were conducted by OceanaGold’s KML at Haile. Check assays on sample pulps were performed by ALS in Tucson, AZ. No significant errors were identified by the study as seen in Figure 12-1.
| | | | | | | | |
Released: March 27, 2026 | | Page 80 of 275 |
| | | | | | | | |
NI 43-101 Technical Report – Haile Gold Mine, South Carolina, United States |
| |
| |
Source: OceanaGold, 2021
Figure 12-1: Horseshoe AuFA_grav KML vs. ALS 0-53 g/t (n=253)
12.3Haile QA / QC ALS July 2017- December 2025
During the period July 2017 to December 2025, nearly all exploration and Resource definition samples were submitted to ALS laboratories. Samples were prepared at the Tucson, Arizona lab and certified assays were done in Reno, Nevada or Vancouver, British Columbia.
12.3.1July 2017 to December 2025 CRM Performance
ALS Reno laboratory accuracy was monitored by insertion of commercially CRMs into the sample stream. A total of 32 different CRMs sourced from Rocklabs and OREAS were submitted in sample batches for a total of 3,722 CRM analyses during the eight and a half-year period. Twenty nine of the 32 CRMs had more than 30 insertions into the sample stream. CRMs include oxide, sulfide, and high silica standards. Figure 12-2 shows CRM values plotted against the expected values. Figure 12-3 shows a zoomed in view of the most commonly inserted CRMs. No obvious bias was observed within the CRM expected vs. actual data. Relative standard deviation of all CRMs was good, averaging 4.3% of expected values over the period. Results confirm excellent precision and accuracy of assays provided by ALS Reno for Haile Mineral Resource calculations that are within industry guidelines. Results from blanks showed no contamination of samples used for Mineral Resource calculations.
| | | | | | | | |
Released: March 27, 2026 | | Page 81 of 275 |
| | | | | | | | |
NI 43-101 Technical Report – Haile Gold Mine, South Carolina, United States |
| |
| |
Source: OceanaGold, 2025
Figure 12-2: July 2017- December 2025 CRM Analyses vs. Expected Value
Source: OceanaGold, 2025
Figure 12-3: July 2017 to December 2025 CRM Analyses vs. Expected Value <4 g/t
| | | | | | | | |
Released: March 27, 2026 | | Page 82 of 275 |
| | | | | | | | |
NI 43-101 Technical Report – Haile Gold Mine, South Carolina, United States |
| |
| |
Standard control charts were plotted for commonly used CRMs. Examples of oxide (OxF125, OxG124, OxH122, OxE150, OxI177, OxI121, and OxI176), sulfide (SF85 and SC127), and high silica (HiSilK2 and HiSilP3) CRMs are shown in Figure 12-4 through Figure 12-7. No obvious trends in the process mean are apparent in the longer run CRM results. CRM OxF125 and OxG124 showed a consistent slight under call, compared to the CRM reported mean, but within two standard deviations (SD) of the reported CRM mean (see Figure 12-4). CRM SF85 showed a slight under call, compared to the CRM reported mean from Feb 2020 to Oct 2020, and preformed better after October 2020 (see Figure 12-6)
If a CRM returned a value greater than 20% above or below the expected value, and no sample swap was evident, all intervals within the failed batch and the nearest passing CRM or Blank were rerun.
Source: OceanaGold, 2025
Figure 12-4: July 2017- December 2022 CRMs: OxF125 (Au=0.806), OxG124 (Au=0.918), and OxH122 (Au=1.247)
| | | | | | | | |
Released: March 27, 2026 | | Page 83 of 275 |
| | | | | | | | |
NI 43-101 Technical Report – Haile Gold Mine, South Carolina, United States |
| |
| |
Source: OceanaGold, 2025
Figure 12-5: January 2024 - December 2025 CRMs: OXE150 (Au=0.658), OXI177 (Au=1.811), OXI121 (Au=1.834), and OXJ176 (Au=2.385)
Source: OceanaGold, 2025
Figure 12-6: October 2019 to December 2025 CRMs: SC127 (Au=0.225) and SF85 (Au=0.848)
| | | | | | | | |
Released: March 27, 2026 | | Page 84 of 275 |
| | | | | | | | |
NI 43-101 Technical Report – Haile Gold Mine, South Carolina, United States |
| |
| |
Source: OceanaGold, 2025
Figure 12-7: October 2017 to December 2025 CRMs: HiSilK2 (Au=3.474) and HiSilP3 (Au=12.240)
12.3.2Contamination Monitoring
Contamination is monitored by insertion of blank materials. From July 2017 to December 2025, a total of 3,526 blank samples of four different materials were inserted: Marble, Sand, Gravel, and Quartz Pebble. Lab detection limit (LDL) is 0.005 ppm Au and control limit used is 10 times the LDL (i.e., 0.050 ppm Au). Haile’s trigger threshold for a blank is 0.05ppm, only 11 out of the 3,526 were significantly above this threshold and were not proceeded by high grade samples. No action was taken. Overall, there is no indication of significant contamination during sample preparation.
The QP has reviewed the July 2017 to current data and believes it to be of acceptable quality for the purposes of Mineral Resource estimation.
12.3.3Statement of Data Adequacy
The QP believes that the data reviewed above, including drilling prior to 2007 and subsequent drilling by Romarco and OceanaGold, is adequate for the purposes of Resource estimation.
| | | | | | | | |
Released: March 27, 2026 | | Page 85 of 275 |
| | | | | | | | |
NI 43-101 Technical Report – Haile Gold Mine, South Carolina, United States |
| |
| |
13 Mineral Processing and Metallurgical Testing
Sample preparation and characterization, grinding studies, gravity concentration tests, whole ore leach tests, flotation tests and leaching of flotation tailings, and flotation concentrate tests were completed to determine the metallurgical response of the ore.
Samples of ore were collected by HGM for metallurgical testing. A series of metallurgical testing programs have been completed by independent commercial metallurgical laboratories. The test work indicated that the ore responds well to flotation and direct agitated cyanide leaching technology to extract gold. The results of the test programs are available in the following reports:
•Phillips Enterprises, LLC (Phillips) 17 September 2008, Progress Report #2 Process and Metallurgical Testing on Haile Gold Mine Ore Project No. 082003i
•Pocock Industrial Inc. (Pocock) Salt Lake City, Utah, May 2009, Flocculant Screening, Gravity Sedimentation, Pulp Rheology, Vacuum Filtration and Pressure Filtration Studies Conducted for Romarco Minerals Haile Gold Project
•Resource Development Inc. (RDi), Wheat Ridge, Colorado, September 16, 2009, Romarco Minerals, Inc. Haile Gold Project, Metallurgical Report
•Metso Minerals Industries Inc. (Metso), York, Pennsylvania, December 7, 2009, Test Plant Report No. 20000134-135
•Resource Development Inc. (RDi), Wheat Ridge, Colorado, March 31, 2010, Romarco Minerals, Inc. Work Index Data for Haile Composite Sample
•Resource Development Inc. (RDi), Wheat Ridge, Colorado, March 31, 2010, Romarco Minerals, Inc. Metallurgical Testing of Ledbetter Extension Samples
•Resource Development Inc. (RDi), Wheat Ridge, Colorado, May 27, 2010, Romarco Minerals, Inc. Flash Flotation, Cyanide Destruction & Leaching of Concentrate and Tailing for Haile Composites
•Resource Development Inc. (RDi), Wheat Ridge, Colorado, September 27, 2010, Romarco Minerals, Inc. Optimization of Leaching of Flotation Concentrate
•Resource Development Inc. (RDi), Wheat Ridge, Colorado, August 2010, Metallurgical Testing of Horseshoe Zone Samples
•Metso Minerals Industries, Inc. (Metso), York, Pennsylvania, February 2011, Stirred Media Detritor and Jar Mill Grindability Test on Bulk Flotation Concentrate T11-04
•KML Metallurgical Services, (KML), Kershaw, South Carolina, December 27, 2012, HGM Years 1 – 3 Silver Characterization Project Test Report
•Resource Development Inc. (RDi), Wheat Ridge, Colorado, June 6, 2011, Production of Flotation Concentrate and Confirmation Testing of Flowsheet
•G&T Metallurgical Services Ltd (G&T), Kamloops, Canada November 24, 2011, Flotation & Cyanidation Testing on Samples from the Horseshoe Deposit, Haile Gold Mine KM3076;
•Gekko Global Cyanide Detox Group (Gekko), Ballarat, Australia, July 18, 2016, OceanaGold Haile Gold Mine Cyanide Detox Test Work DTXSC021
•ALS Metallurgy Kamloops, BC, Canada, December 2016, Comminution Testing on Samples from the Haile Gold Mine KM 5180
•ALS Metallurgy Kamloops, BC, Canada, Comminution and Thickening Testing for Haile Gold Mine KM 5293
| | | | | | | | |
Released: March 27, 2026 | | Page 86 of 275 |
| | | | | | | | |
NI 43-101 Technical Report – Haile Gold Mine, South Carolina, United States |
| |
| |
The metallurgical test results were used to develop process design criteria and the flow sheet for processing the ore in the existing plant and the basis for progressive upgrades since commissioning.
In addition to the testwork undertaken in developing the plant flowsheet and design-criteria, ongoing future ores testwork has been undertaken to support additional Reserves utilizing the same laboratory flowsheet to allow direct comparison with historical testwork.
The following sections contain some information in short tons (st) and others in metric tonnes (t).
13.1Testing and Procedures
13.1.1Comminution
Comminution test work on mineralized samples was performed by RDi (using Phillips Enterprises, LLC) and by ALS Kamloops.
Bond ball mill work index (BMWi) values were determined by RDi for various Haile samples. Bond impact and abrasion tests were also completed. The BMWi results for selected composites from this work are presented in Table 13-1.
Table 13-1: Bond Ball Mill Work Indices for Haile Samples
| | | | | | | | | | | |
Composite Number | Area | BMWi at 100-mesh (kWh/st) | |
1 | Mill Zone | 8.42 | | |
2 | Mill Zone | 8.07 | | |
3 | Mill Zone | 7.95 | | |
4 | Mill Zone | 8.03 | | |
5 | Mill Zone | 7.88 | | |
6 | Haile | 8.55 | | |
7 | Haile | 9.78 | | |
8 | Ledbetter | 7.49 | | |
26 | Snake | 10.34 | | |
27 | Snake | 10.39 | | |
31 | Snake | 5.13 | | |
Source: OceanaGold, 2025
Further testing, including Bond rod mill index testing as completed on Mill Zone, Haile, Ledbetter, and Red Hill ore zone samples. The Bond ball mill work index for each composite was also determined at both 100- and 200-mesh for these samples.
The results for selected composites from this work are presented in Table 13-2.
| | | | | | | | |
Released: March 27, 2026 | | Page 87 of 275 |
| | | | | | | | |
NI 43-101 Technical Report – Haile Gold Mine, South Carolina, United States |
| |
| |
Table 13-2: Bond Rod and Ball Mill Work Indices for Haile Composite
| | | | | | | | | | | | | | |
Composite Number | Sample Description | Rod Mill Wi (kWh/st) | Ball Mill Wi at 100-mesh (kWh/st) | Ball Mill Wi at 200-mesh (kWh/st) |
2 | Mill Zone-Average Grade | 11.08 | | 8.21 | | 7.78 | |
6 | Mill Zone-High Grade | 11.30 | | 8.21 | | 8.17 | |
8 | Haile-Average Grade | 12.49 | | 9.47 | | 8.92 | |
20 | Ledbetter-Average Grade | 12.18 | | 8.95 | | 8.42 | |
24 | Ledbetter-High Grade | 12.56 | | 9.47 | | 9.03 | |
34 | Red Hill-Average Grade | - | | 8.73 | | 9.47 | |
54 | Red Hill-Low Grade | - | | 8.83 | | 9.50 | |
Source: OceanaGold, 2025
RDi also performed comminution tests on samples from the Ledbetter Extension zone. The Bond rod and ball mill indices and an abrasion index for an ore composite (83) was determined. The results of this work are presented in Table 13-3.
Table 13-3: Rod and Ball Mill Work Indices for Ledbetter Extension Samples
| | | | | | | | |
Abrasion Index | Value (kWh/st) | |
Rod Mill Work Index | 12.71 | | |
Ball Mill Work Index at 100-mesh | 10.21 | | |
Ball Mill Work Index at 200-mesh | 9.81 | | |
Source: OceanaGold, 2025
RDi also performed comminution studies on samples from Horseshoe. The Bond rod, ball mill, and abrasion indices for four different composites were determined. The samples were relatively abrasive and moderately hard. The results are presented in Table 13-4.
Table 13-4: Rod and Ball Mill Work and Abrasion Indices for Horseshoe Samples
| | | | | | | | | | | | | | |
Composite
Number | Sample Description (Hole ID / intercepts / lithology) | RM Wi (kWh/st) | BMWi at 200-mesh (kWh/st) | Abrasion Index |
83 | RCT-03 / 1412 to 1460 ft / Silicified Metasediment (Ms) | - | 12.29 | 0.2167 |
84 | RCT-04 / 1460 to 1510 ft / Silicified Metasediment | - | 11.29 | 0.2691 |
85 | RCT-04 / 1510 to 1585 ft / Silicified Breccia | 14.93 | 12.95 | 0.3786 |
86 | RCT-04 / 1585 to 1655 ft / Silicified Breccia | 13.56 | 13.77 | 0.8330 |
Source: OceanaGold, 2025
| | | | | | | | |
Released: March 27, 2026 | | Page 88 of 275 |
| | | | | | | | |
NI 43-101 Technical Report – Haile Gold Mine, South Carolina, United States |
| |
| |
ALS performed comminution tests on samples from Horseshoe and Ledbetter. The A x b parameter from the SMC test, SAG Circuit Specific Energy (SCSE) and Bond ball mill indices for composites were determined. The results of this work are presented in Table 13-5.
Table 13-5: ALS Comminution Tests on Horseshoe Samples
| | | | | | | | | | | | | | |
Composite Number | A x b | SCSE (kWh/st) | BMWi at 200-mesh (kWh/st) | |
Horseshoe 1 | 28.9 | | 11.4 | | 13.5 | | |
Horseshoe 2 | 29.9 | | 11.3 | | 13.6 | | |
Horseshoe 3 | 30.7 | | 11.2 | | 9.3 | | |
Horseshoe 4 | 29.4 | | 11.6 | | 10.9 | | |
Horseshoe 5 | 28.0 | | 11.6 | | 14.4 | | |
Horseshoe 6 | 27.1 | | 12.4 | | 10.6 | | |
Ledbetter 1 | 27.3 | | 12.0 | | 11.6 | | |
Ledbetter 2 | 25.6 | | 12.2 | | 13.5 | | |
Ledbetter 3 | 27.8 | | 11.9 | | 11.8 | | |
Ledbetter 4 | 30.8 | | 11.3 | | 8.9 | | |
Source: OceanaGold, 2025
ALS performed JK Drop Weight and Bond ball mill index tests on samples from mineralized material exposed in Mill Zone Pit. The results of this work are presented in Table 13-6.
Table 13-6: ALS Comminution Tests on Mill Zone Pit Samples
| | | | | | | | | | | | | | |
Composite Number | A x b | SCSE (kWh/st) | BMWi at 200-mesh (kWh/st) | |
1a | 93.6 | | 7.15 | | 9.4 | | |
1b | 9.1 | | |
2a | 52.8 | | 8.85 | | 6.8 | | |
2b | 6.6 | | |
Source: OceanaGold, 2025
The comminution circuit design developed for the expansion project incorporated the additional competency test work and power modeling for the overall circuit was developed with the assistance of external consultants. A series of plant grinding circuit surveys were completed in 2017 and 2018 to validate the predictions of the modeling work. The survey data indicated the Haile Semi-Autogenous Grinding (SAG) specific energy requirement was significantly lower than that predicted from the SMC test results on all surveys. Additional modeling work developed a Haile site specific model for SAG specific energy as a function of the drop weight index (DWI) from the SMC test and Bond ball mill work index.
Updated throughput modeling, using the site-specific model, indicated an increase in throughput averaging 70 tonnes per hour (t/h) higher than the original work. Based on the outcome of the power
| | | | | | | | |
Released: March 27, 2026 | | Page 89 of 275 |
| | | | | | | | |
NI 43-101 Technical Report – Haile Gold Mine, South Carolina, United States |
| |
| |
modeling work, the confidence of achieving 3.5 to 4.0 Mt/yr throughput rates for the majority of the ore sources was sufficient to proceed with the installation of the pebble crushing circuit but not to proceed with the detailed design of the secondary crushing circuit.
ALS performed SMC, Bond rod mill and Bond ball mill index tests on a further 17 composite samples taken from the Ledbettter, Snake, Haile, and Red Hill pits from infill drilling in 2018. These allowed additional variability analysis on expected ore competency across these pits based on the power modeling work that represented mill feed from 2019 to 2024. The results of the program are summarized in Table 13-7 and indicate similar values to the previous programs.
Table 13-7: ALS Comminution Test Results for 2018 Infill Sample Program
| | | | | | | | | | | | | | |
Sample ID (DDH/Deposit) | A x b | SCSE (kWh/tonne) | BMWi at 200-Mesh (kWh/tonne) | |
672A Ledbetter | 25.4 | 12.6 | 11.0 | |
693A Snake | 39.8 | 10.1 | 8.6 | |
698A Snake West | 27.9 | 11.8 | 11.3 | |
726A Snake West | 24.8 | 10.6 | 10.9 | |
726B Snake West | 28.9 | 11.7 | 8.9 | |
746A Snake | 40.5 | 10.0 | 9.8 | |
746B Snake | 31.0 | 11.3 | 11.6 | |
746C Snake | 36.2 | 10.5 | 10.0 | |
752A Ledbetter | 28.3 | 11.9 | 9.9 | |
752B Ledbetter | 33.0 | 10.9 | 10.2 | |
773A Ledbetter | 28.9 | 11.8 | 10.1 | |
802A Haile | 31.7 | 11.2 | 8.8 | |
802C Haile | 35.7 | 10.5 | 10.1 | |
802C Haile | 31.1 | 11.2 | 9.4 | |
802D Haile | 38.4 | 10.1 | 9.1 | |
803A Red Hill | 31.8 | 11.2 | 10.5 | |
806A Red Hill | 46.6 | 9.4 | 7.5 | |
Source: OceanaGold, 2025
In 2022 SGS Burnaby was sent 30 core composite samples from ore zones from the Haile, Ledbetter, and Mill Zone pits as part of a competency variability program to quantify variability expectations in the LoM plan from these pit stages. SMC, Bond rod mill, and Bond ball mill index tests were conducted on these samples providing a larger data set confirming the increased hardness expected in the Ledbetter pit compared to the upper areas of the Haile pit and Mill Zone pits. The results of the program are summarized in Table 13-8 and has increased the data set of competency data to allow development of hardness proxy measurements for the block model.
| | | | | | | | |
Released: March 27, 2026 | | Page 90 of 275 |
| | | | | | | | |
NI 43-101 Technical Report – Haile Gold Mine, South Carolina, United States |
| |
| |
Table 13-8: SGS Comminution Test Results for 2022 Variability Program
| | | | | | | | | | | | | | |
Sample ID (DDH/Deposit) | A x b | SCSE (kWh/tonne) | BMWi at 200-Mesh (kWh/tonne) | |
MET-MZ-88 | 128.5 | 6.31 | 4.7 | |
MET-MZ-89 | 37.1 | 10.47 | 8.9 | |
MET-MZ-90 | 59.0 | 8.34 | 4.9 | |
MET-MZ-91 | 94.8 | 6.97 | 5.3 | |
MET-HL-92 | 49.8 | 8.99 | 9.1 | |
MET-HL-93 | 39.7 | 9.92 | 9.7 | |
MET-HL-94 | 58.5 | 8.34 | 7.5 | |
MET-HL-95 | 45.1 | 9.33 | 8.3 | |
MET-HL-96 | 37.0 | 10.23 | 8.7 | |
MET-HL-97 | 40.0 | 9.91 | 8.6 | |
MET-HL-98 | 39.2 | 10.20 | 8.7 | |
MET-HL-99 | 44.8 | 9.45 | 9.2 | |
MET-HL-100 | 40.8 | 9.92 | 9.4 | |
MET-LB-101 | 30.3 | 11.28 | 11.9 | |
MET-LB-102 | 44.3 | 9.45 | 9.7 | |
MET-LB-103 | 30.0 | 11.49 | 11.1 | |
MET-LB-104 | 39.9 | 9.96 | 10.0 | |
MET-LB-105 | 34.6 | 10.61 | 11.4 | |
MET-LB-106 | 38.0 | 10.33 | 9.3 | |
MET-LB-107 | 31.8 | 10.98 | 10.2 | |
MET-MZ-108 | 32.9 | 10.98 | 11.5 | |
MET-LB-109 | 41.8 | 9.79 | 10.8 | |
MET-LB-110 | 37.8 | 10.26 | 9.4 | |
MET-LB-111 | 30.8 | 11.77 | 9.6 | |
MET-LB-112 | 47.9 | 9.22 | 10.3 | |
MET-LB-113 | 37.0 | 10.26 | 8.9 | |
MET-MZ-114 | 46.8 | 9.40 | 6.9 | |
MET-MZ-115 | 48.4 | 9.37 | 9.0 | |
MET-MZ-116 | 38.3 | 10.17 | 7.9 | |
MET-MZ-117 | 53.7 | 8.80 | 8.7 | |
Source: OceanaGold, 2025
In 2022 as part of a program of blast optimization trials to evaluate the impact on mill throughput a series of full grinding surveys were undertaken to validate the previously developed site-specific comminution model to allow conversion of competency parameters into throughput rates for the current circuit. Four additional surveys were completed and provided to Ausenco to balance and model fit with the additional points displayed below in Figure 13-1 with a good correlation between the measured and predicted SAG specific energy.
| | | | | | | | |
Released: March 27, 2026 | | Page 91 of 275 |
| | | | | | | | |
NI 43-101 Technical Report – Haile Gold Mine, South Carolina, United States |
| |
| |
Source: OceanaGold, 2025
Figure 13-1: Updated Modeled vs. Measured SAG Specific Energy Values
In May 2024 ore from the Ledbetter Phase 2A pit became the predominate feed source for the mill, with Horseshoe underground joining the blend later in the year. Increases in drill bit wear and a drop in penetration rates indicated an increase in ore competency along with poorer blast fragmentation. Milling rates were impacted in the mill with throughput rates dropping to 360 to 420 t/h on a 100% basis leading to investigating alternative blasting patterns and use of a mobile jaw crusher to test partial secondary crushing a portion of the mill feed to -75 mm to determine the impact on throughput.
As a result of the noticeable impact on mill throughput and to address ongoing throughput planning a Geomet program was undertaken submitting a series of 5 m core samples from the remaining three deeper sourced open pits for competency testing. These samples were submitted to SGS Lakefield using the Geopyora method to determine the DWi and Bond ball mill work index to increase the number of data points in the future pit phases for modeling. A summary of the results is presented below in Table 13-9 with the Bond BWi noticeably higher than results of larger composites from higher up in the pit phase previously tested.
| | | | | | | | |
Released: March 27, 2026 | | Page 92 of 275 |
| | | | | | | | |
NI 43-101 Technical Report – Haile Gold Mine, South Carolina, United States |
| |
| |
Table 13-9: Geopyora Competency Test Results
| | | | | | | | | | | | | | | | | | | | |
Pit Phase | Sample Count | DWi | BMWi at 150 micron (kWh/tonne) | |
Range | Mean | Range | Mean | |
Ledbetter Phase 3 | 51 | 6.7 - 13.2 | 9.9 | 13.9 - 22.4 | 16.7 | |
Snake Phase 3 | 12 | 8.1 - 11.0 | 9.8 | 14.9 - 17.8 | 16.4 | |
Haile Phase 2 | 9 | 6.7 - 10.9 | 9.6 | 15.3 - 17.9 | 16.5 | |
Source: OceanaGold, 2025
13.1.2Throughput Estimate Assumptions
The following approach was used to generate a throughput estimate for the block model to allow mine schedules to incorporate mill throughput estimation during the planning process. The existing DWi and BBWi data was supplemented with recent Geopyora DWi and BBWi core measurements for the three main remaining open pit ore sources. This data was used to calculate SAG circuit specific energy for each data point using the previously derived regression and mill throughput estimates assuming a 3100 kW available mill power draw. The throughput estimates were then assigned to the block model. With this information added to the block model, open pit schedules were then used to predict mill throughput for each period from the mine schedule.
For underground ore sources from Horseshoe and Palomino, deposits based on a similar approach from core testing results the 85th percentile of the hardest ore was used to determine a throughput rate equivalent to 3.2 Mt/yr on a 100% mill feed basis. Applying this approach to the Ledbetter Underground deposit a throughput rate equivalent to 2.8 Mt/yr was calculated.
For the current LoM plan this approach to modeling throughput was used rather than the previously used rates for open pit and underground and has led to a planned throughput rate in the range of 2.7 to 3.0 Mt/yr over the remaining project life. Whilst lower than previous methods used it reflects actual plant achieved rates and more up to date information on the remaining open pit Reserves, along with a change in mill feed blend from deeper competent underground sources from 25% of mill feed to over 50% from 2030 to 2034 with three deposits contributing over the LoM to open pit sourced ore.
It should be noted that the mill survey data used to generate the site-specific comminution model was based on ore source from the Snake Phase 2 and Ledbetter Phase 1 open pits with coarse fragmentation than that experienced with the underground produced ore and may tend to under estimate throughput expected in the long term. Secondary crushing trials in late 2024 with 20% of mill feed pre-crushed to -75 mm indicated a modest throughput increase of 15 to 20 tph on Ledbetter Phase 2A feed, and short trials with -50 mm material was more beneficial.
There is scope to conduct further work on partial secondary crushing trials to evaluate the
cost / benefit of increasing mill throughput above the current LoM with mobile crushing equipment on site and the current forecast is now considered a conservative estimate compared to that used in scheduling in previous years.
Additional short interval core samples are being sought from both open pit and underground sources to increase the data set available to improve the confidence in the block model prediction.
| | | | | | | | |
Released: March 27, 2026 | | Page 93 of 275 |
| | | | | | | | |
NI 43-101 Technical Report – Haile Gold Mine, South Carolina, United States |
| |
| |
13.1.3Flotation and Cyanidation
The Philips test work described in the September 2008 report was performed on composite ore samples of average grade material from the Haile and Mill Zone pit areas.
The testing was conducted to substantiate metal recoveries from sulfide flotation and cyanide leaching of flotation tailings and investigate oxidation methods for enhancing gold extraction from sulfide concentrate. Additional work was executed on tailings samples to assess thickening and filtration response, neutralization requirements, and provide material for environmental and tailing disposal engineering studies by others.
The work confirmed the sulfides carry the majority of the metal values in Haile deposits and this allows their concentration into a smaller fraction for processing. Previous operations at the site recognized this and sulfide concentration was practiced. However, the sulfides do not easily release the metal values and limited extraction was experienced by simple cyanidation. The sulfides contained in the ore composites tested by Phillips showed the same characteristics.
Flotation tests on the Haile composite indicated 66% of the gold was separated into a concentrate that represented 6.7% of the flotation feed mass. Tests on the Mill Zone composite indicated 89% of the gold was separated into a flotation concentrate that represented 13.6% of the feed. The Mill Zone composite test had a finer flotation feed particle size distribution and extended residence time which may explain the difference in recovery.
Leach tests on flotation tail indicated 82% (leach stage) extraction for gold for both composites. Leach tests on a blend of Haile and Mill Zone flotation concentrate revealed gold extraction of only 67% of the gold with the as-floated particle size. Applying a test procedure entailing a regrind in cyanide solution to 80% passing 15 µm, followed by an agitated cyanidation step, raised extraction to 80%.
The subsequent phase of work from 2009 was carried out by RDi on samples from the five areas within the Haile mineralized zone; Mill Zone, Haile, Red Hill, Ledbetter, and Snake. These discrete areas were provisionally derived from initial distinct open pits, but later design work and optimization may make the designation merely a legacy naming convention.
The methodology of compositing samples was to prepare composites from each hole’s intervals based on their assays as follows:
•Less than 0.5 g/t Au was considered waste
•Less than 1 g/t but greater than 0.5 g/t Au were combined as low-grade composites
•Between 1 g/t Au and 4 g/t Au were combined as average grade
•Over 4 g/t Au were combined as high-grade
Almost all the samples assayed over 0.3% sulfur and sulfide sulfur accounted for over 95% of the total sulfur (ST).
RDi performed gravity concentration testing using a laboratory centrifugal concentrator with cleaner gravity concentration using a shaking Gemini table. The results indicate that the cleaner stage recovered about 20% of the feed gold but into a concentrate with a mass pull of 1% to 2% of the feed, assaying 11 to 75 g/t Au. The concentrate grade was too low-grade to treat separately and there appears to be no coarse gold in the deposit, thus a gravity circuit was not considered to be applicable.
| | | | | | | | |
Released: March 27, 2026 | | Page 94 of 275 |
| | | | | | | | |
NI 43-101 Technical Report – Haile Gold Mine, South Carolina, United States |
| |
| |
RDi performed whole-ore cyanide leach tests to examine the effect of ore grind size and leach time on gold recovery. The test work indicated that direct leaching gold extraction from the samples was generally poor and variable, ranging from 40% to 79%.
Most of the gold that leached was in the initial six hours of leach time and extraction generally increased with increasing fineness of grind. The refractoriness of the gold is partially due to size dependence but predominantly due to gold association with sulfides. A summary of the test work is presented in Table 13-10.
Table 13-10: RDi Whole-Ore Leach Test Results
| | | | | | | | | | | | | | | | | | | | |
Composite Number | Grind Size (P80, mesh) | % Gold Extraction, Leach Time | NaCN Consumption at 48 hr. (lbs/st) | |
6 hr. | 24 hr. | 48 hr. | |
Mill Zone Average | 100 | 57.0 | 65.0 | 64.7 | 0.50 | |
Mill Zone Average | 200 | 64.7 | 65.7 | 65.9 | 0.42 | |
Mill Zone Average | 325 | 68.0 | 69.2 | 68.4 | 0.84 | |
Haile Average | 200 | 67.5 | 71.3 | 71.5 | 0.52 | |
Haile Average | 325 | 69.0 | 73.7 | 75.3 | 0.96 | |
Ledbetter Average | 200 | 72.2 | 75.60 | 75.8 | 0.24 | |
Ledbetter Average | 325 | 70.4 | 80.3 | 79.1 | 1.40 | |
Source: OceanaGold, 2022
RDi performed flotation test work to investigate the recovery of gold and silver to a sulfide mineral concentrate. The tests indicated that a reagent suite of potassium amyl xanthate (PAX), AERO 404 (or equivalent), and methyl isobutyl carbinol (MIBC) frother, along with a laboratory flotation time of six minutes and a grind size of 200-mesh or finer will result in the highest gold recovery values.
A summary of the RDi flotation test work is presented in Table 13-11 and Table 13-12.
Table 13-11: Flotation Test Results – Averages by Grind
| | | | | | | | | | | | | | | | | | | | |
Sample Description | Primary Grind (P80, mesh) | Flotation Concentrate 6-minute Flotation Time Recovery % | Concentrate Grade
(oz/st) |
% wt | Au | Ag | Au | Ag |
Mill Zone Average | 100 | 18.2 | 92.7 | 50.9 | 0.516 | 0.341 |
Mill Zone Average | 200 | 14.2 | 91.7 | 58.7 | 0.630 | 0.679 |
Mill Zone Average | 325 | 12.6 | 90.8 | 61.6 | 0.779 | 0.846 |
Red Hill Average | 200 | 16.8 | 82.6 | 75.2 | 0.493 | 1.420 |
Red Hill Average | 325 | 15.6 | 82.3 | 73.1 | 0.557 | 1.053 |
Ledbetter Average | 200 | 10.3 | 91.8 | 57.7 | 1.234 | 0.749 |
Ledbetter Average | 325 | 10.5 | 88.6 | 42.8 | 1.301 | 0.674 |
Haile Average | 200 | 12.8 | 86.7 | 59.9 | 0.519 | 0.752 |
Haile Average | 325 | 11.3 | 86.4 | 65.6 | 0.618 | 0.834 |
Snake Average | 200 | 15.4 | 90.2 | 50.4 | 0.665 | 0.475 |
Snake Average | 325 | 15.0 | 91.6 | 49.0 | 0.636 | 0.446 |
Source: OceanaGold, 2022
| | | | | | | | |
Released: March 27, 2026 | | Page 95 of 275 |
| | | | | | | | |
NI 43-101 Technical Report – Haile Gold Mine, South Carolina, United States |
| |
| |
Table 13-12: Flotation Test Results Average by Grade and Grind
| | | | | | | | | | | | | | | | | | | | |
Sample Description | Primary Grind (P80, mesh) | Flotation Concentrate 6-minute Flotation Time Recovery % | Concentrate Grade (oz/st) |
% wt | Au | Ag | Au | Ag |
Mill Zone Average-Grade | 200 | 13.5 | 93.4 | 77.1 | 0.674 | 1.012 |
Mill Zone Average-Grade | 325 | 12.9 | 90.7 | 70.8 | 0.697 | 0.992 |
Mill Zone High-Grade | 200 | 13.3 | 92.1 | 83.5 | 1.374 | 1.274 |
Mill Zone High-Grade | 325 | 12.7 | 94.8 | 60.4 | 1.461 | 1.015 |
Red Hill Average-Grade | 200 | 16.6 | 76.6 | 83.1 | 0.338 | 1.409 |
Red Hill Average-Grade | 325 | 15.2 | 82.1 | 77.8 | 0.347 | 0.662 |
Red Hill High-Grade | 200 | 20.0 | 93.9 | 94.3 | 1.569 | 3.228 |
Red Hill High-Grade | 325 | 18.2 | 93.2 | 80.5 | 1.496 | 2.633 |
Ledbetter Average-Grade | 200 | 12.2 | 90.7 | 68.9 | 0.703 | 0.624 |
Ledbetter Average-Grade | 325 | 14.1 | 89.5 | 44.2 | 0.563 | 0.271 |
Ledbetter High-Grade | 200 | 8.0 | 95.7 | 57.5 | 3.071 | 1.534 |
Ledbetter High-Grade | 325 | 7.9 | 87.5 | 53.3 | 2.033 | 1.175 |
Haile Average-Grade | 200 | 12.2 | 84.9 | 65.1 | 0.365 | 0.726 |
Haile Average-Grade | 325 | 11.2 | 86.5 | 64.0 | 0.402 | 0.682 |
Haile High-Grade | 200 | 14.8 | 91.8 | 86.0 | 1.595 | 1.858 |
Haile High-Grade | 325 | 12.5 | 87.6 | 67.3 | 1.423 | 1.371 |
Snake Average-Grade | 200 | 16.4 | 96.1 | 53.5 | 0.472 | 0.432 |
Snake Average-Grade | 325 | 17.1 | 89.1 | 38.4 | 0.382 | 0.350 |
Snake High-Grade | 200 | 19.0 | 96.2 | 69.9 | 1.575 | 0.962 |
Snake High-Grade | 325 | 17.1 | 95.3 | 65.6 | 1.560 | 0.688 |
Source: OceanaGold, 2022
RDi performed flotation tailing cyanide leach tests to investigate the extraction of gold from the flotation tailing. The test results indicate that gold can be extracted from the flotation tails. A summary of the test work is presented in Table 13-13.
| | | | | | | | |
Released: March 27, 2026 | | Page 96 of 275 |
| | | | | | | | |
NI 43-101 Technical Report – Haile Gold Mine, South Carolina, United States |
| |
| |
Table 13-13: Flotation Tailing Leach Test Results Average by Grade and Grind
| | | | | | | | | | | | | | |
Sample Description | Primary Grind (P80, mesh) | Gold Extraction Leach Time – 24 hr. (%) | NaCN Consumption (lbs/st) | Lime Addition Ca(OH)2 (lbs/st) |
Mill Zone Average-Grade | 200 | 52.9 | 0.14 | 3.08 |
Mill Zone Average-Grade | 325 | 63.0 | 0.50 | 3.08 |
Mill Zone High-Grade | 200 | 71.7 | 0.16 | 3.08 |
Mill Zone High-Grade | 325 | 71.9 | 0.44 | 3.08 |
Red Hill Average-Grade | 200 | 68.5 | 0.74 | 13.19 |
Red Hill Average-Grade | 325 | 67.5 | 1.22 | 12.83 |
Red Hill High-Grade | 200 | 74.1 | 2.56 | 15.76 |
Red Hill High-Grade | 325 | 81.1 | 1.40 | 15.30 |
Ledbetter Average-Grade | 200 | 68.6 | 0.44 | 6.35 |
Ledbetter Average-Grade | 325 | 70.7 | 0.24 | 5.65 |
Ledbetter High-Grade | 200 | 72.0 | 0.20 | n.r. |
Ledbetter High-Grade | 325 | 76.5 | 0.16 | n.r. |
Haile Average-Grade | 200 | 62.7 | 0.16 | 13.68 |
Haile Average-Grade | 325 | 62.2 | 0.26 | 13.70 |
Haile High-Grade | 200 | 75.6 | 0.22 | 6.71 |
Haile High-Grade | 325 | 77.1 | 0.18 | 6.31 |
Snake Average-Grade | 200 | 62.38 | 0.02 | 8.53 |
Snake Average-Grade | 325 | 66.34 | 0.16 | 8.45 |
Snake High-Grade | 200 | 70.00 | 0.20 | 6.39 |
Snake High-Grade | 325 | 70.90 | 0.24 | 6.29 |
Source: OceanaGold, 2022
Larger scale flotation test results achieved 91% gold recovery into a concentrate representing 8.8% weight of the flotation feed in 13.5 minutes of flotation time. Subsequent leach tests of flotation tail gave results that indicated 50% gold extraction in 16 hours of leaching.
Regrind test work on concentrate samples generated was performed by Metso Minerals Industries, Inc. (Metso 2009) to predict specific energy requirements for concentrate regrind.
RDi performed flotation test work on 23 drill core composite samples from the Ledbetter Extension zone. The methodology for compositing samples by grade was the same as used earlier.
Gold recovery by flotation averaged 86% for the 100-mesh grind samples, averaged 87% for the 150- mesh grind samples, and ranged from 81% to 95% but averaged 89% for the 200-mesh grind samples.
The flotation tailing samples were leached for 24 hours at 40% solids and gold extractions averaged 66% for 100-mesh grind samples, from 52% to 85% and averaged 68% for 150-mesh grind samples, and from 44% to 87% and averaged 69% for 200-mesh grind samples.
In 2010, RDi performed additional metallurgical testing on duplicate ore samples from the earlier testing. Additional composite samples were made to evaluate carbon loading, cyanide destruction, flash flotation, conventional flotation time, and leaching of concentrate and tailing samples.
| | | | | | | | |
Released: March 27, 2026 | | Page 97 of 275 |
| | | | | | | | |
NI 43-101 Technical Report – Haile Gold Mine, South Carolina, United States |
| |
| |
A procedure was developed and used to evaluate “flash flotation”. Flash flotation was shown to recover 62% to 66% of the gold in two minutes of flotation time. Conventional flotation improves the total flotation gold recovery to about 80% and leaching of flotation tailing extracts 76% to 80% of the gold from the flotation tailing sample.
Fifteen samples were selected for the generation of flotation concentrate in one cubic foot flotation cell tests. The fifteen samples were low, average and high grade from different ore zones (Red Hill, Snake, Ledbetter, and Mill Zone).
Five samples were selected for the generation of flotation concentrate in small-scale laboratory flotation cell tests. The five samples were identified as average grade material from the different ore zones.
The flotation tests were followed by leaching tests conducted on the flotation concentrates and flotation tailings. The results of these tests are presented in Table 13-14.
| | | | | | | | |
Released: March 27, 2026 | | Page 98 of 275 |
| | | | | | | | |
NI 43-101 Technical Report – Haile Gold Mine, South Carolina, United States |
| |
| |
Table 13-14: Leaching Tests Conducted on the Flotation Concentrates and Flotation Tailings
| | | | | | | | | | | | | | | | | | | | | | | | | | | | | | | | | | | | | | | | | |
Test No. | Zone | Grade | Comp. No. | Flotation | Conc. Leaching | Tails Leaching | Total Recovery Au (%) |
Head Grade Au (oz/st) | Au Recovery (%) | Head Grade Au (oz/st) | Au Extraction (%) | Head Grade Au (oz/st) | Au Extraction (%) |
Assay | Calc | Assay | Calc | Assay | Calc |
1/2 | RH | L | 49 | 0.027 | 0.033 | 91.5 | 0.172 | 0.140 | 62.7 | 0.003 | 0.005 | 83.8 | 64.5 |
7/8 | H | L | 47 | 0.010 | 0.011 | 64.7 | 0.093 | 0.190 | 82.6 | 0.004 | 0.006 | 85.9 | 83.8 |
17/18 | S | L | 51 | 0.015 | 0.015 | 84.0 | 0.230 | 0.245 | 79.8 | 0.003 | 0.003 | 66.0 | 77.6 |
19/20 | L | L | 43 | 0.021 | 0.020 | 86.7 | 0.248 | 0.207 | 71.9 | 0.003 | 0.005 | 61.3 | 70.5 |
25/26 | MZ | L | H290 | 0.024 | 0.035 | 95.4 | 0.152 | 0.190 | 77.4 | 0.002 | 0.004 | 72.5 | 77.2 |
15/16 | RH | A | 34 | 0.080 | 0.095 | 92.0 | 0.589 | 0.513 | 83.3 | 0.009 | 0.010 | 67.2 | 82.0 |
11/12 | H | A | 8 | 0.085 | 0.064 | 85.5 | 0.455 | 0.467 | 74.8 | 0.010 | 0.012 | 60.3 | 72.7 |
9/10 | S | A | 39 | 0.056 | 0.052 | 89.6 | 0.735 | 0.583 | 64.2 | 0.006 | 0.006 | 77.7 | 65.8 |
3/4 | L | A | 23 | 0.059 | 0.073 | 89.6 | 1.009 | 0.752 | 80.4 | 0.008 | 0.013 | 71.8 | 79.5 |
13/14 | MZ | A | 2 | 0.057 | 0.059 | 92.6 | 0.423 | 0.382 | 69.3 | 0.005 | 0.006 | 69.2 | 69.3 |
C34 | RH | A | - | 0.073 | 0.072 | 86.0 | - | 0.370 | 80.0 | 0.012 | 0.012 | 80.2 | 80.0 |
C28 | H | A | - | 0.086 | 0.085 | 68.1 | - | 0.580 | 59.7 | 0.030 | 0.029 | 79.6 | 66.0 |
C31 | S | A | - | 0.051 | 0.056 | 93.7 | - | 0.166 | 58.5 | 0.005 | 0.005 | 45.1 | 57.7 |
C61 | L | A | - | 0.048 | 0.047 | 86.1 | - | 0.341 | 80.7 | 0.007 | 0.008 | 81.4 | 80.4 |
C5 | MZ | A | - | 0.073 | 0.078 | 92.2 | - | 0.292 | 69.5 | 0.008 | 0.008 | 67.0 | 69.3 |
27 | RH | H | 35 | - | 0.429 | 94.1 | 2.601 | 2.094 | 73.6 | 0.030 | 0.038 | 77.5 | 73.8 |
28 | H | H | 9 | 0.180 | 0.194 | 90.5 | 1.394 | 1.321 | 88.5 | 0.021 | 0.024 | 64.5 | 86.2 |
5/6 | S | H | 53 | 0.304 | 0.312 | 95.2 | 2.365 | 1.875 | 75.2 | 0.017 | 0.020 | 68.3 | 74.9 |
23/24 | L | H | 71 | 0.240 | 0.274 | 94.7 | 2.622 | 2.222 | 74.0 | 0.015 | 0.034 | 81.5 | 74.4 |
21/22 | MZ | H | 12/3 | 0.168 | 0.199 | 96.0 | 1.563 | 1.155 | 79.7 | 0.009 | 0.020 | 73.3 | 79.4 |
Source: OceanaGold, 2025
| | | | | | | | |
Released: March 27, 2026 | | Page 99 of 275 |
| | | | | | | | |
NI 43-101 Technical Report – Haile Gold Mine, South Carolina, United States |
| |
| |
The overall extraction, sorted by sampled zones, is presented in Table 13-15.
Table 13-15: Gold Recovery by Ore Zone and Ore Grade
| | | | | | | | | | | | | | | | | | | | |
Ore Zone | Au Extraction – Combined % | Average Au Extraction (%) | |
Low Grade | Average Grade | High Grade | |
Red Hill | 64.5 | 82.0 | 80.0 | 73.8 | 75.1 | |
Haile | 83.8 | 72.7 | 66.0 | 86.2 | 77.2 | |
Snake | 77.6 | 65.6 | 57.5 | 74.9 | 68.9 | |
Ledbetter | 70.5 | 79.5 | 80.8 | 74.4 | 76.3 | |
Mill Zone | 77.2 | 69.3 | 69.3 | 79.4 | 73.0 | |
Average | 74.7 | 72.3 | 77.8 | 74.3 | |
Source: OceanaGold, 2022
RDi performed additional leach tests on flotation concentrates to ascertain if better results could be obtained. The results of performing leach tests on larger concentrate samples (i.e., twice the size used in previous tests) demonstrated a significant improvement in gold and silver extraction. Concentrate samples were ground to a size distribution of 80% passing 15 to 18 µm. The slurry was then pre-aerated for four hours and lead nitrate was added for the final three hours of pre-aeration and then leached for 48 hours with carbon present. A summary of the larger scale leach test results is presented in Table 13-16.
| | | | | | | | |
Released: March 27, 2026 | | Page 100 of 275 |
| | | | | | | | |
NI 43-101 Technical Report – Haile Gold Mine, South Carolina, United States |
| |
| |
Table 13-16: CIL Test Results for Fine Ground Flotation Concentrate
| | | | | | | | | | | | | | | | | | | | | | | |
Test No. | Pit | Grade | Composite Number | Grind Size (P80, μm) | 48 hr. Leach Time % Extraction | NaCN Consumption (lbs/st) |
Au | Ag |
37 | Red Hill | L | 49 | 17 | 80.9 | 71.1 | 2.00 |
36 | Haile | L | 47 | 14 | 77.2 | 49.5 | 4.99 |
38 | Snake | L | 51 | 16 | 81.0 | 94.4 | 10.83 |
35 | Ledbetter | L | 43 | 16 | 88.3 | 91.9 | 5.09 |
21 | Mill Zone | L | Hole 290 | - | 79.8 | 91.0 | 5.59 |
26 | Mill Zone | L | Hole 290 | - | 85.0 | 82.3 | 4.75 |
33 | Red Hill | A | 34 | 16 | 85.8 | 77.2 | 4.60 |
31 | Haile | A | 28 | 18 | 95.6 | 97.4 | 4.36 |
22 | Haile | A | 8 | - | 81.6 | 93.2 | 3.62 |
32 | Snake | A | 31 | 18 | 58.8 | 18.2 | 4.26 |
24 | Snake | A | 39 | - | 84.7 | 96.4 | 5.25 |
40 | Ledbetter Ext | A | 61 | 14 | 89.8 | 98.3 | 1.96 |
27 | Mill Zone | A | 2 | 16 | 81.5 | 96.2 | 4.77 |
28 | Mill Zone | A | 5 | 17 | 79.2 | 50.0 | 4.72 |
41 | Ledbetter Ext | A | 73 | 16 | 83.7 | 93.4 | 3.30 |
23 | Ledbetter | A | 23 | - | 88.3 | 79.9 | 4.72 |
34 | Red Hill | H | 35 | 16 | 92.6 | 95.9 | 3.66 |
29 | Haile | H | 9 | 20 | 93.7 | 97.7 | 3.46 |
39 | Snake | H | 53 | 16 | 83.4 | 97.4 | 5.03 |
30 | Mill Zone | H | 12/3 | 19 | 88.7 | 95.9 | 4.00 |
25 | Ledbetter Ext | H | 71 | - | 94.9 | 95.6 | 12.3 |
Source: OceanaGold, 2025
KML was commissioned in 2012 to perform additional flotation and leach tests on 29 composites from Mill Zone and Snake areas. The samples selected were chosen to represent the initial three years of the operation’s mine schedule anticipated at the time.
Each composite was subjected to bulk flotation. The flotation concentrate was reground to a P80 of approximately 13 µm and leached for 48 hours. The flotation tailing was also leached for 48 hours. The overall gold recoveries ranged from 71.6% to 91% and overall silver recoveries ranged from 32.9% to 81.9%. A summary of the results is presented in Table 13-17.
| | | | | | | | |
Released: March 27, 2026 | | Page 101 of 275 |
| | | | | | | | |
NI 43-101 Technical Report – Haile Gold Mine, South Carolina, United States |
| |
| |
Table 13-17: Tests Results for Composites from Mill Zone and Snake Areas
| | | | | | | | | | | | | | | | | |
Composite | Au Head Grade
(oz/st) | Au Recovery
(%) | Ag Head Grade
(oz/st) | Ag Recovery
(%) | |
1 | 0.224 | 90.6 | 0.07 | 75.8 | |
2 | 0.028 | 74.7 | 0.05 | 74.2 | |
3 | 0.127 | 89.8 | 0.06 | 73.1 | |
4 | 0.101 | 82.6 | 0.05 | 73.8 | |
5 | 0.128 | 88.6 | 0.06 | 81.4 | |
6 | 0.037 | 71.6 | 0.04 | 68.4 | |
7 | 0.320 | 90.7 | 0.08 | 77.7 | |
8 | 0.071 | 83.7 | 0.06 | 77.5 | |
9 | 0.077 | 87.9 | 0.13 | 81.1 | |
10 | 0.142 | 88.7 | 0.17 | 81.9 | |
12 | 0.038 | 77.5 | 0.05 | 64.5 | |
13 | 0.064 | 81.3 | 0.06 | 78.5 | |
14 | 0.047 | 84.0 | 0.11 | 80.6 | |
15 | 0.079 | 85.1 | 0.11 | 75.0 | |
16 | 0.114 | 82.6 | 0.15 | 75.3 | |
17 | 0.056 | 82.9 | 0.06 | 78.7 | |
18 | 0.054 | 76.0 | 0.09 | 75.5 | |
19 | 0.061 | 77.7 | 0.03 | 70.7 | |
20 | 0.036 | 75.8 | 0.04 | 76.7 | |
21 | 0.065 | 76.6 | 0.08 | 71.8 | |
22 | 0.148 | 87.5 | 0.12 | 71.6 | |
23 | 0.245 | 91.0 | 0.10 | 74.4 | |
24 | 0.055 | 86.5 | 0.03 | 52.8 | |
25 | 0.029 | 87.6 | 0.02 | 43.6 | |
26 | 0.013 | 76.3 | 0.02 | 62.3 | |
27 | 0.010 | 80.8 | 0.01 | 58.0 | |
28 | 0.016 | 76.8 | 0.02 | 35.5 | |
29 | 0.027 | 80.9 | 0.01 | 32.9 | |
30 | 0.107 | 88.8 | 0.04 | 46.0 | |
Source: OceanaGold, 2022
RDi undertook additional test work on the composite samples from the Horseshoe Zone to determine the response to the process flowsheet selected. Visible gold was reported in some core intercepts used for Horseshoe test work. Test work included comminution (described above) and flotation and leaching of concentrate and flotation tailing.
The flotation process utilizing a simple reagent suite (PAX, AP404 and MIBC) developed for the deposit in earlier studies recovered 85% to 90% of the gold into the concentrate for most of the composites. Cyanide leaching consistently extracted about 70% of the gold in the flotation tailings. The composite concentrate samples were reground and subjected to a preparation step and a CIL
| | | | | | | | |
Released: March 27, 2026 | | Page 102 of 275 |
| | | | | | | | |
NI 43-101 Technical Report – Haile Gold Mine, South Carolina, United States |
| |
| |
test, which showed gold and silver extractions of over 90% for most composites. Lower recoveries were achieved for the low-grade composite 83. A summary of the test results is presented in Table 13-18.
Table 13-18: Test Results for Horseshoe Samples
| | | | | | | | | | | | | | | | | | | | | | | | | | | | | | | | |
Composite Number | Assay Head Au (g/t) | Primary Grind Size (P80, mesh) | Flotation Recovery (%) | Tailing Leach (%) Extraction | Concentrate Leach Extraction (%) | Overall Extraction (%) |
Au | Ag | Au | Ag | Au | Ag | Au | Ag |
83 | 1.8 | 100 | 86.5 | 63.0 | 70.2 | 3.7 | 69.3 | 64.9 | 69.4 | 42.3 |
83 | 150 | 89.0 | 57.1 | 70.4 | 9.6 | 69.4 | 41.2 |
83 | 200 | 87.6 | 54.1 | 73.9 | 5.5 | 69.9 | 37.6 |
84 | 9.1 | 100 | 88.4 | 74.4 | 69.4 | 5.3 | 96.2 | 94.6 | 93.1 | 71.7 |
84 | 150 | 90.2 | 77.3 | 71.3 | 22.0 | 93.8 | 78.1 |
84 | 200 | 90.1 | 77.7 | 71.0 | 7.1 | 93.7 | 75.1 |
85 | 10.4 | 100 | 83.3 | 70.7 | 66.5 | 39.4 | 96.0 | 91.9 | 91.1 | 76.5 |
85 | 150 | 89.2 | 81.4 | 71.7 | 19.1 | 93.4 | 78.4 |
85 | 200 | 87.4 | 80.7 | 76.3 | 37.5 | 93.5 | 81.4 |
86 | 12.1 | 100 | 86.4 | 74.5 | 67.2 | 8.9 | 94.9 | 92.1 | 91.1 | 70.9 |
86 | 150 | 85.8 | 73.8 | 72.5 | 45.8 | 91.7 | 80.0 |
86 | 200 | 90.4 | 75.2 | 76.6 | 40.7 | 93.1 | 79.4 |
87 | 10.6 | 100 | 69.7 | 57.7 | 59.5 | 53.4 | 95.2 | 95.0 | 84.4 | 77.4 |
87 | 150 | 77.8 | 64.8 | 66.1 | 54.1 | 88.7 | 80.6 |
87 | 200 | 75.9 | 69.0 | 70.8 | 54.1 | 89.3 | 82.3 |
Source: OceanaGold, 2022
In late 2011, G&T Metallurgical Services was selected to perform the metallurgical test program on additional Horseshoe samples. The metallurgical test program involved testing of twelve variability samples to evaluate recoveries by flotation and cyanidation of concentrate and flotation tails.
The Horseshoe samples responded very well to the Haile flowsheet. A summary of the test results compiled by HGM staff is provided in Table 13-19.
| | | | | | | | |
Released: March 27, 2026 | | Page 103 of 275 |
| | | | | | | | |
NI 43-101 Technical Report – Haile Gold Mine, South Carolina, United States |
| |
| |
Table 13-19 Test Results for Horseshoe Samples
| | | | | | | | | | | | | | | | | | | | | | | | | | |
Composite Number | Gold Head Grade (oz/st) | Flotation P80 (μm) | Kinetic Flotation Recovery (%) | Bulk Flotation Recovery (%) | Regrind P80 (μm) | Concentrate Leach Extraction (%) | Tailings Leach Extraction (%) | Overall Gold Recovery (%) |
1 | 0.199 | 81 | 93.9 | 86.5 | 15 | 90.4 | 81.1 | 89.2 |
2 | 0.339 | 70 | 92.5 | 90.7 | 13 | 99.5 | 67.3 | 96.6 |
3 | 0.043 | 78 | 96.5 | 94.0 | 14 | 86.1 | 87.6 | 89.8 |
4 | 0.060 | 73 | 93.3 | 97.0 | 16 | 98.5 | 74.1 | 86.1 |
5 | 0.076 | 81 | 90.2 | 83.4 | 10 | 94.9 | 85.5 | 94.4 |
6 | 0.168 | 84 | 88.4 | 86.0 | 11 | 93.0 | 90.2 | 94.9 |
7 | 0.082 | 82 | 85.2 | 88.0 | 15 | 94.9 | 75.6 | 93.8 |
8 | 0.094 | 66 | 89.0 | 84.4 | 12 | 98.6 | 83.3 | 92.6 |
9 | 0.057 | 69 | 86.2 | 89.2 | 11 | 97.1 | 81.7 | 96.0 |
10 | 0.121 | 75 | 75.1 | 77.6 | 15 | 90.3 | 82.1 | 90.6 |
11 | 0.349 | 88 | 86.2 | 87.5 | 14 | 97.4 | 88.4 | 95.8 |
12 | 0.129 | 77 | 85.3 | 83.6 | 10 | 97.4 | 84.2 | 96.1 |
Source: OceanaGold, 2022
Laboratory testing on ore composite samples demonstrated that the mineralization was readily amenable to flotation and cyanide leaching process treatment. A conventional flotation and cyanide leaching flow sheet can be used as the basis of process design. The relative low variability of flotation test work indicates that the mineralized zones are relatively similar in terms of mineral composition, and flotation and cyanide leaching response.
The samples tested responded favorably at a moderately-fine feed size range of 80% passing 200-mesh (74 µm). Therefore, a primary grind size of 80% passing 200-mesh was recommended for process circuit design development. Operational experience and minerology may allow this criterion to be relaxed, reducing comminution requirements and increasing plant capacity.
The flotation testing indicated that gold can be recovered in a flotation concentrate that will also contain the majority of the silver in the ore. The tailing from the flotation circuit can then be processed by cyanide leaching to recover gold onto activated carbon.
The test work indicated that the circuit should include regrinding of the flotation concentrate before slurry pre-aeration, and a leach time of 24 hours. A regrind circuit product size of 80% passing 15 µm is an appropriate target for regrind circuit design
Leaching of the flotation concentrate can extract 82% to 91% of the gold and 80% to 96% of the silver. Leaching of the flotation tailing can extract 45% to 86% of the gold in the flotation tailings. It appears that overall gold recovery will be in the range of 65% to 92% dependent primarily on head grade to the mill and less dependent on from which zone the ore is mined.
The unit operations that determine the amount of gold extraction are flotation, flotation concentrate regrind and leaching, and flotation tailing leaching.
| | | | | | | | |
Released: March 27, 2026 | | Page 104 of 275 |
| | | | | | | | |
NI 43-101 Technical Report – Haile Gold Mine, South Carolina, United States |
| |
| |
The data developed in the test programs has been used to establish a relationship between overall gold recovery and head grade as shown in the graph in Figure 13-2. The algorithm for the “best-fit” line that describes the head grade to recovery relationship is used to estimate gold recovery from a predicted mill head grade for example, at a mill head grade of 2.3 g/t, the recovery equation graph predicts a gold recovery of 84.2%. The results of grade and recovery data analysis are shown in Figure 13-2.
Source: OceanaGold, 2022
Figure 13-2: Overall Percent Recovery vs. Head Grade
Overall, the results from Horseshoe tests were in line with or exceeded the recovery model. The cyanide destruction test results indicated that the sulfur dioxide (SO2)/air cyanide destruction process destroys weak acid dissociable (WAD) cyanide very effectively, as well as free cyanide. Operations to date have achieved target levels of cyanide removal from the TSF and reagent usage is being optimized to further reduce costs.
13.1.4Sample Representativeness
Samples were collected from a range of locations across the main area of the Resources that is planned to be fed to the processing plant over the LoM. The minimal variability of test work indicates that the different mineralized zones are relatively similar in terms of chemical and mineral compositions, and flotation and cyanide leaching response. Given the uniform geological setting and mineralization, this is not surprising.
| | | | | | | | |
Released: March 27, 2026 | | Page 105 of 275 |
| | | | | | | | |
NI 43-101 Technical Report – Haile Gold Mine, South Carolina, United States |
| |
| |
It is evident from the comminution testing that ore competency is increased in the deeper resources (e.g., Horseshoe underground). This is confirmed by the trend of increased Bond Ball Milling Work indices for samples sourced from lower levels.
13.2Palomino Deposit
The Palomino deposit is currently under development at Haile. It is expected to be similar in nature to the other deposits at Haile that have been encountered to date. Gold is present both in silicates and as fine inclusions within pyrite requiring a fine grind to achieve economic liberation. Within the Palomino deposit two key lithologies have been identified as carrying the majority of the gold values, classified as Rhyodacite and Siltstone, the latter the equivalent of the metasediment domain previously used to describe the highly-silicified mineralization hosting much of the gold mineralization. Metavolcanics occur but are lesser in abundance.
Based on the geological and lithological model, a bingo chart was constructed for the deposit based on the total Measured, Indicated and Inferred Resource (MI&I) available at the conclusion of the scoping study encompassing the largest expected mineral inventory and allowing for any further conversion drilling success to be accommodated as part of the Prefeasibility Study program. The bingo chart considered nine bins based on the three core lithologies and the following three grade bins:
•1.4 to 1.7 g/t Au to cover development ore below CoG
•1.7 to 3 g/t Au for medium-grade ore
•>3 g/t Au for high-grade ore
From the bingo chart the distribution of composite samples targeted for testing was reviewed and discussed with the exploration team to locate mineralized intercepts targeting a single lithology and grade bin. The distribution of composites required is shown below in Table 13-20 with a total of 22 composites required. Intercepts of individual drillholes were then identified from the infill drilling program to match the lithology and target grade bin across the deposit.
Table 13-20: Palomino Metallurgical Composite Plan
| | | | | | | | | | | | | | | | | | | | | | | | | | |
Ore Class | Tonnes (kt) for each Lithology and Domain | Representative Samples (no.) for each Lithology and Domain |
LG Au
(1.3-1.7) | MG Au
(1.7-3) | HG Au
(>3) | Total | LG Au (1.3-1.7) | MG Au (1.7-3) | HG Au (>3) | Total |
Rhyodacite | 245,145 | 1,617,891 | 1,126,338 | 2,99,374 | 1 | 5 | 4 | 10 |
Siltstone | 715,763 | 2,031,615 | 877,742 | 3,625,120 | 2 | 6 | 3 | 11 |
Metavolcanics | 6,792 | 201,108 | 88,763 | 296,663 | 0 | 1 | 0 | 1 |
Total | 971,700 | 3,850,614 | 2,092,843 | 6,915,157 | 3 | 12 | 7 | 22 |
Source: OceanaGold, 2025
From the 22 composites, six were selected from quarter core to allow for competency and ore hardness characterization with the remaining composites sourced from coarse crushed rejects from the initial exploration core submitted for assay to preserve core for future testing. The samples were shipped to SGS Burnaby to conduct the test program designed to characterize the hardness of future Palomino ores and to estimate overall gold and silver recoveries by replicating the existing process flowsheet in the laboratory.
| | | | | | | | |
Released: March 27, 2026 | | Page 106 of 275 |
| | | | | | | | |
NI 43-101 Technical Report – Haile Gold Mine, South Carolina, United States |
| |
| |
The program consisted of two phases. Ore competency testing was carried out on six composites (three Rhyodacite and three Siltstone) sourced from intact quarter core incorporating SMC Testing for competency and Bond ball mill work index and Abrasion index for a measure of hardness.
The second phase on all 21 composites involved:
•Stage crushing and homogenization to -10 mesh followed by head assay analysis
•Batch flotation testing to produce a bulk concentrate on standard flotation conditions provided by OceanaGold based on prior programs to assess flotation response for sulfur and gold recovery
•Fine grinding of the flotation concentrates to a P80 of 13 µm
•Cyanide leach tests on both flotation tailings and reground flotation concentrate streams to assess gold recovery in the leach circuit
•Mass balance of results to estimate overall gold and silver recovery for each composite
Subsequent to the Prefeasibility study, a program was developed to support the internal Feasibility Study with an updated bingo chart from the updated Resource model focusing on the Measured and Indicated Resources. An additional 13 samples were identified for testing based on the targeted conditions to support the Feasibility Study criteria along with three additional samples to bracket around two samples in the original program that showed lower recovery than expected to quantify potential affected volumes.
The comminution testing results from both programs are summarized in Table 13-21 and are comparable to that observed in the Haile and Mill zone pits rather than the harder deep deposits in Horseshoe and Ledbetter Phase 3 and 4 open pit designs that are representative of the current grinding circuit performance.
Table 13-21: Palomino Competency Testing Results
| | | | | | | | | | | | | | | | | | | | |
Sample ID (DDH/Deposit) | Domain | A x b | ta | RM Wi at 14-Mesh (kWh/tonne) | BMWi at 200-Mesh (kWh/tonne) | |
MET_PAL_119 | Rhyodacite | 51.9 | 0.49 | 12.3 | 9.3 | |
MET_PAL_124 | Rhyodacite | 42.6 | 0.38 | 12.0 | 11.2 | |
MET_PAL_127 | Rhyodacite | 42.7 | 0.39 | 12.0 | 10.1 | |
MET_PAL_137 | Siltstone | 46.4 | 0.43 | 13.1 | 10.1 | |
MET_PAL_138 | Siltstone | 47.2 | 0.44 | 12.4 | 9.7 | |
MET_PAL_139 | Siltstone | 40.6 | 0.39 | 13.7 | 11.3 | |
MET_PAL_158 | Rhyodacite | 48.1 | 0.45 | 10.8 | 9.4 | |
MET_PAL_160 | Rhyodacite | 36.8 | 0.35 | 13.0 | 11.3 | |
MET_PAL_161 | Rhyodacite | 49.7 | 0.46 | 12.0 | 10.0 | |
MET_PAL_163 | Rhyodacite | 41.9 | 0.39 | 11.3 | 11.7 | |
MET_PAL_165 | Rhyodacite | 42.6 | 0.38 | 11.5 | 11.7 | |
MET_PAL_167 | Rhyodacite | 47.4 | 0.44 | 12.1 | 11.2 | |
MET_PAL_169 | Rhyodacite | 41.5 | 0.37 | 11.1 | 10.9 | |
MET_PAL_171 | Siltstone | 33.5 | 0.31 | 13.7 | 9.1 | |
MET_PAL_172 | Siltstone | 44.8 | 0.41 | 12.8 | 9.6 | |
MET_PAL_173 | Siltstone | 32.8 | 0.30 | 12.2 | 9.1 | |
Source: OceanaGold, 2025
| | | | | | | | |
Released: March 27, 2026 | | Page 107 of 275 |
| | | | | | | | |
NI 43-101 Technical Report – Haile Gold Mine, South Carolina, United States |
| |
| |
All samples were subjected to a suite of chemical analysis as per Table 13-22. The gold grades of the composites ranged from 1.39 to 11.1 g/t, with an average gold grade of 4.1 g/t. Silver grades varied from 0.7 to 14.0 g/t, with an average of 4.3 g/t with gold to silver ratios similar to other areas of the Haile deposit.
The total sulfur grade ranged from 0.3% to 13.1%, with an average of 4.1%; sulfur was present mainly as sulfide (S2-) with a low sulfate (SO4) content. This indicates low sample oxidation which gives confidence that laboratory test results will mirror plant performance.
All other analytes were at low levels and not considered to be a risk for processing. Tellurium was included in the 2024 program due to its addition to the standard geochemical suite from the presence of visible tellurides in the Ledbetter Underground drilling program. Mineralogical analysis of these samples by Tescan Automated Mineral Analysis (TIMA) indicated the tellurium present in the form of Hessite.
| | | | | | | | |
Released: March 27, 2026 | | Page 108 of 275 |
| | | | | | | | |
NI 43-101 Technical Report – Haile Gold Mine, South Carolina, United States |
| |
| |
Table 13-22: Geochemical Analysis of Palomino Composites
| | | | | | | | | | | | | | | | | | | | | | | | | | | | | | | | | | | | | | |
Composite | Au
(g/t) | Ag
(g/t) | Cu
(%) | Fe
(%) | As
(%) | Hg
(g/t) | S
(%) | S2
(%) | TIC
(%) | TOC
(%) | Te
(g/t) | |
MET_PAL_119 | 5.90 | 1.0 | < 0.01 | 1.8 | 0.0 | < 0.3 | 1.2 | 1.1 | < 0.05 | 0.2 |
| |
MET_PAL_120 | 1.83 | 4.0 | < 0.01 | 11.3 | 0.0 | < 0.3 | 11.4 | 11.3 | 0.1 | < 0.05 |
| |
MET_PAL_121 | 2.66 | 5.0 | < 0.01 | 3.7 | 0.0 | < 0.3 | 3.3 | 3.2 | 0.0 | < 0.05 |
| |
MET_PAL_122 | 5.36 | 11.0 | 0.0 | 11.7 | 0.0 | < 0.3 | 10.7 | 10.4 | 0.1 | < 0.05 |
| |
MET_PAL_123 | 11.11 | 13.5 | < 0.01 | 5.2 | 0.0 | < 0.3 | 3.2 | 3.1 | 0.1 | < 0.05 |
| |
MET_PAL_124 | 2.16 | 3.2 | < 0.01 | 6.5 | 0.0 | < 0.3 | 6.2 | 5.8 | < 0.05 | 0.1 |
| |
MET_PAL_125 | 2.21 | 3.5 | < 0.01 | 3.8 | 0.0 | < 0.3 | 3.5 | 3.3 | 0.1 | < 0.05 |
| |
MET_PAL_126 | 3.00 | 6.0 | < 0.01 | 12.3 | 0.0 | < 0.3 | 13.1 | 12.9 | 0.0 | < 0.05 |
| |
MET_PAL_127 | 2.86 | 3.0 | < 0.01 | 5.8 | 0.0 | < 0.3 | 4.9 | 4.4 | < 0.05 | 0.4 |
| |
MET_PAL_128 | 4.71 | 3.0 | < 0.01 | 7.4 | 0.0 | < 0.3 | 6.1 | 5.9 | 0.1 | < 0.05 |
| |
MET_PAL_129 | 5.27 | 3.0 | < 0.01 | 7.2 | 0.0 | < 0.3 | 6.2 | 5.9 | 0.1 | < 0.05 |
| |
MET_PAL_130 | 1.39 | 4.5 | < 0.01 | 2.6 | 0.0 | < 0.3 | 1.6 | 1.5 | 0.1 | < 0.05 |
| |
MET_PAL_131 | 2.06 | 4.0 | < 0.01 | 4.4 | 0.0 | < 0.3 | 3.9 | 3.9 | 0.2 | < 0.05 |
| |
MET_PAL_132 | 2.31 | 5.0 | < 0.01 | 9.1 | 0.0 | < 0.3 | 10.0 | 9.8 | 0.1 | < 0.05 |
| |
MET_PAL_133 | 1.65 | 3.0 | < 0.01 | 6.7 | 0.0 | < 0.3 | 5.5 | 5.3 | 0.2 | < 0.05 |
| |
MET_PAL_134 | 2.68 | <2 | < 0.01 | 1.8 | 0.0 | < 0.3 | 0.3 | 0.3 | 0.1 | < 0.05 |
| |
MET_PAL_135 | 2.88 | 12.5 | < 0.01 | 4.3 | 0.0 | < 0.3 | 3.7 | 3.5 | 0.1 | < 0.05 |
| |
MET_PAL_136 | 1.65 | 4.0 | < 0.01 | 3.4 | 0.0 | < 0.3 | 3.2 | 3.1 | 0.2 | < 0.05 |
| |
MET_PAL_137 | 2.22 | 1.5 | < 0.01 | 3.1 | 0.0 | < 0.3 | 1.2 | 1.1 | < 0.05 | 0.5 |
| |
MET_PAL_138 | 6.80 | 4.3 | < 0.01 | 3.2 | 0.0 | < 0.3 | 2.4 | 2.1 | < 0.05 | 0.2 |
| |
MET_PAL_139 | 3.63 | 3.7 | < 0.01 | 2.2 | 0.0 | < 0.3 | 1.1 | 1.2 | < 0.05 | 0.2 |
| |
MET_PAL_158 | 1.65 | < 0.5 | < 0.01 | 3.3 | 0.0 | < 0.3 | 1.5 | 1.5 | < 0.05 | 0.2 | 1.0 | |
MET_PAL_159 | 2.39 | 0.8 | < 0.01 | 1.5 | 0.0 | < 0.3 | 0.7 | 0.6 | < 0.05 | 0.3 | 0.7 | |
MET_PAL_160 | 2.47 | 4.7 | < 0.01 | 3.6 | 0.0 | < 0.3 | 1.5 | 1.4 | < 0.05 | 0.5 | 4.2 | |
MET_PAL_161 | 2.00 | 0.8 | < 0.01 | 4.1 | 0.0 | < 0.3 | 3.3 | 3.2 | < 0.05 | 0.4 | 0.9 | |
MET_PAL_162 | 5.02 | 1.5 | < 0.01 | 2.3 | 0.0 | < 0.3 | 1.2 | 1.1 | < 0.05 | 0.4 | 1.1 | |
MET_PAL_163 | 4.28 | 3.2 | < 0.01 | 4.2 | 0.0 | < 0.3 | 3.7 | 3.7 | < 0.05 | 0.4 | 2.8 | |
MET_PAL_164 | 8.66 | 4.2 | < 0.01 | 4.2 | 0.0 | < 0.3 | 3.7 | 3.2 | < 0.05 | 0.3 | 3.5 | |
MET_PAL_165 | 7.64 | 9.5 | 0.0 | 8.3 | 0.0 | < 0.3 | 6.8 | 6.6 | < 0.05 | 0.2 | 8.2 | |
MET_PAL_166 | 7.76 | 8.7 | < 0.01 | 6.1 | 0.0 | < 0.3 | 5.7 | 5.0 | < 0.05 | 0.1 | 6.8 | |
MET_PAL_167 | 2.58 | 0.7 | < 0.01 | 2.5 | 0.0 | < 0.3 | 1.5 | 1.4 | < 0.05 | 0.1 | 0.7 | |
MET_PAL_168 | 3.87 | 1.7 | < 0.01 | 3.9 | 0.0 | < 0.3 | 1.9 | 1.7 | < 0.05 | 0.4 | 1.2 | |
MET_PAL_169 | 4.69 | 3.2 | 0.0 | 7.5 | 0.0 | < 0.3 | 6.2 | 5.9 | < 0.05 | 0.1 | 2.7 | |
MET_PAL_170 | 5.66 | 1.3 | < 0.01 | 1.3 | 0.0 | < 0.3 | 0.6 | 0.5 | < 0.05 | 0.3 | 0.9 | |
MET_PAL_171 | 5.21 | 3.3 | < 0.01 | 4.0 | 0.0 | < 0.3 | 2.7 | 2.6 | < 0.05 | 0.2 | 4.5 | |
MET_PAL_172 | 2.43 | 2.8 | < 0.01 | 3.6 | 0.0 | < 0.3 | 3.2 | 3.2 | < 0.05 | 0.2 | 4.5 | |
MET_PAL_173 | 10.8 | 4.2 | < 0.01 | 4.9 | 0.0 | < 0.3 | 4.2 | 4.1 | < 0.05 | 0.1 | 4.7 | |
Source: OceanaGold, 2025
| | | | | | | | |
Released: March 27, 2026 | | Page 109 of 275 |
| | | | | | | | |
NI 43-101 Technical Report – Haile Gold Mine, South Carolina, United States |
| |
| |
All of the composites responded well to flotation under the standard conditions for the bulk rougher test with 82.8% to 98.4% of the gold present reporting to the flotation concentrate across the two test programs. Mass pull was in line with the expectations from the given sulfur grade. With the expected strategy of Palomino representing 20% of mill feed, it is not expected to be an issue for the regrind circuit capacity.
The overall gold extractions from the flotation products (concentrates and tailings) corresponding to gold extractions by cyanidation from the head samples varied from 69.9% to 94.7%, with an average value of 84.5%. Full results are summarized in Table 13-23.
| | | | | | | | |
Released: March 27, 2026 | | Page 110 of 275 |
| | | | | | | | |
NI 43-101 Technical Report – Haile Gold Mine, South Carolina, United States |
| |
| |
Table 13-23: Palomino Leach Test Results
| | | | | | | | | | | | | | | | | |
Composite | Au Recovery | Float Con % | Float Tail % | Overall % | |
MET_PAL_120 | 96 | 82.3 | 51 | 81.0 | |
MET_PAL_121 | 93.7 | 82.5 | 55.4 | 80.8 | |
MET_PAL_122 | 93 | 80.5 | 65.8 | 79.5 | |
MET_PAL_123 | 89 | 90.6 | 71.1 | 88.4 | |
MET_PAL_125 | 93.8 | 83.8 | 55.3 | 82.0 | |
MET_PAL_126 | 96.7 | 87.5 | 71.3 | 86.9 | |
MET_PAL_128 | 82.7 | 90.8 | 70 | 89.3 | |
MET_PAL_129 | 98.4 | 70.1 | 58.1 | 69.9 | |
MET_PAL_130 | 91.1 | 88 | 69.4 | 86.4 | |
MET_PAL_131 | 96.9 | 82.8 | 68.8 | 82.3 | |
MET_PAL_132 | 95.6 | 76.6 | 471 | 75.3 | |
MET_PAL_133 | 94.3 | 82.5 | 54.9 | 80.9 | |
MET_PAL_134 | 93.2 | 97.6 | 64.7 | 92.1 | |
MET_PAL_135 | 91.7 | 86.3 | 74.7 | 85.3 | |
MET_PAL_136 | 94.9 | 80.5 | 62.3 | 79.6 | |
MET_PAL_119 | 82.8 | 92.4 | 68.2 | 88.3 | |
MET_PAL_124 | 95.8 | 87.3 | 69 | 86.5 | |
MET_PAL_127 | 93.2 | 93.3 | 68.7 | 91.7 | |
MET_PAL_137 | 92.2 | 97 | 68.2 | 94.7 | |
MET_PAL_138 | 89.3 | 89.7 | 66.9 | 87.3 | |
MET_PAL_139 | 87.8 | 92.6 | 69.3 | 89.8 | |
MET_PAL_158 | 90.9 | 90.5 | 76.1 | 89.2 | |
MET_PAL_159 | 89.5 | 35.6 | 70.4 | 39.3 | |
MET_PAL_160 | 90.5 | 84.5 | 71.8 | 83.3 | |
MET_PAL_161 | 93.1 | 92.3 | 69.3 | 90.7 | |
MET_PAL_162 | 89.5 | 94.9 | 75.7 | 92.9 | |
MET_PAL_163 | 92.9 | 92.1 | 66.7 | 90.3 | |
MET_PAL_164 | 91.0 | 95.9 | 76.6 | 94.1 | |
MET_PAL_165 | 95.9 | 61.9 | 63.6 | 62.0 | |
MET_PAL_166 | 93.7 | 94.5 | 73.1 | 93.1 | |
MET_PAL_167 | 93.7 | 87.9 | 50.3 | 85.5 | |
MET_PAL_168 | 91.2 | 92.3 | 69.9 | 90.4 | |
MET_PAL_169 | 94.8 | 87.4 | 64.8 | 86.2 | |
MET_PAL_170 | 86.6 | 98.1 | 74.0 | 94.9 | |
MET_PAL_171 | 94.7 | 93.0 | 66.1 | 91.6 | |
MET_PAL_172 | 94.8 | 75.2 | 45.0 | 73.7 | |
MET_PAL_173 | 95.9 | 92.1 | 66.9 | 91.1 | |
Source: OceanaGold, 2025
| | | | | | | | |
Released: March 27, 2026 | | Page 111 of 275 |
| | | | | | | | |
NI 43-101 Technical Report – Haile Gold Mine, South Carolina, United States |
| |
| |
Three samples demonstrated low recoveries in comparison with the Haile recovery database as can be seen graphically in Figure 13-3 with the points identified by ore source. Two of these low recovery samples were from the siltstone geomet domain (MET_PAL_129 (RF8), MET_PAL_132 (RF11) and one was from the rhyodacite geomet domain (MET_PAL_122 (RF3)). The low recoveries are primarily due to poor leach performance of the flotation concentrate, and tails residues from each of these bottle roll tests were submitted for diagnostic leach test work. This test work indicated up to 60% of losses were accounted for through sulfide locked in pyrite suggesting a finer inclusion size of some of the gold in these samples.
Further review of MET_PAL_129 to identify the nearest composites and their performance was undertaken with this sample taken on the edge of the mineralized contact of the orebody. The three NN composites with a 25 to 30 m lateral distance tested in the Prefeasibility or Feasibility phase returned recoveries in the expected 80% to 86% range suggesting the effect observed to be quite localized.
Source: OceanaGold, 2025
Figure 13-3: Haile Global Recovery Database Results by Source
13.3Ledbetter Underground Deposit
In 2024, a Prefeasibility Study evaluated changing the mining method for the proposed fourth phase of the Ledbetter open pit to an underground mining method targeting the higher-grade mineralization and extending below the designed pit shell. As part of this study the resource model was used to generate sample number requirements and distribution allow testing of this deeper
| | | | | | | | |
Released: March 27, 2026 | | Page 112 of 275 |
| | | | | | | | |
NI 43-101 Technical Report – Haile Gold Mine, South Carolina, United States |
| |
| |
material. As with the open pit Resources the Siltstone / Metasediment domain was the prevalent domain and in addition a new gold-bearing domain was identified labelled Intrusive Breccia.
The same parameters were used for sample selection as with the Palomino deposit given the similar mining method with three grade bins and for the Feasibility program the Measured, Indicated and Inferred material was used. A total of 18 composite samples were selected with 16 located in the primary Lobe 1 structure and two in the smaller Lobe 3 structure. The distribution of samples in Lobe 1 is shown in Table 13-24.
Table 13-24: Ledbetter Underground Lobe 1 Sample Distribution
| | | | | | | | | | | | | | | | | | | | | | | | | | |
Ore Class | Tonnes (kt) for each Lithology and Domain | Representative Samples (no.) for each Lithology and Domain |
LG Au (1.3-1.7) | MG Au (1.7-3) | HG Au (>3) | Total | LG Au (1.3-1.7) | MG Au (1.7-3) | HG Au (>3) | Total |
Metasediment | 366,203 | | 850,866 | | 517,860 | | 1,734,929 | | 1 | | 3 | | 2 | | 6 | |
Basalt | 3,349 | | 9,914 | | 441 | | 13,704 | | 0 | | 0 | | 0 | | 0 | |
Intrusive Breccia | 669,833 | | 1,488,656 | | 977,069 | | 3,135,558 | | 2 | | 5 | | 3 | | 10 | |
Basement | 43,112 | | 103,093 | | 20,079 | | 166,284 | | 0 | | 0 | | 0 | | 0 | |
Total (Panels 1 and 2) | 1,082,497 | | 2,452,529 | | 1,515,449 | | 5,050,475 | | 3 | | 8 | | 5 | | 16 | |
Source: OceanaGold, 2025
A competency test program was conducted on 10 of the Ledbetter Underground samples as outlined for Palomino with SMC competency testing and Bond ball mill work index testing for these samples. It was expected that the material being the bottom of the previously proposed open pit would be competent based on previous open pit competency testing with the results summarized in Table 13-25 below.
The second phase on all 18 composites involved:
•Stage crushing and homogenization to -10 mesh followed by head assay analysis
•Batch flotation testing to produce a bulk concentrate on standard flotation conditions provided by OceanaGold based on prior programs to assess flotation response for sulfur and gold recovery
•Fine grinding of the flotation concentrates to a P80 of 13 µm
•Cyanide leach tests on both flotation tailings and reground flotation concentrate streams to assess gold recovery in the leach circuit
•Mass balance of results to estimate overall gold and silver recovery for each composite
| | | | | | | | |
Released: March 27, 2026 | | Page 113 of 275 |
| | | | | | | | |
NI 43-101 Technical Report – Haile Gold Mine, South Carolina, United States |
| |
| |
Table 13-25: Ledbetter Underground Prefeasibility Program Sample Source Summary
| | | | | | | | | | | | | | | | | | | | | | | | | | |
Sample ID | Program | SMC Parameters | Milling Parameters | |
A x b | ta | DWi | SCSE | BRWi | BBWi | |
MET_LUG_140 | Breccia | 30.5 | 0.29 | 9.01 | 11.39 | 13.7 | 12.5 | |
MET_LUG_143 | Breccia | 29.0 | 0.28 | 9.13 | 11.47 | 13.7 | 11.2 | |
MET_LUG_145 | Breccia | 33.1 | 0.32 | 8.23 | 10.82 | 13.3 | 11.4 | |
MET_LUG_147 | Breccia | 34.0 | 0.33 | 7.95 | 10.66 | 14.5 | 13.5 | |
MET_LUG_149 | Breccia | 37.0 | 0.35 | 7.35 | 10.25 | 13.7 | 13.3 | |
MET_LUG_150 | Siltstone | 29.8 | 0.27 | 9.39 | 11.72 | 13.8 | 11.2 | |
MET_LUG_152 | Siltstone | 44.2 | 0.40 | 6.49 | 9.8 | 12.8 | 10.2 | |
MET_LUG_154 | Siltstone | 34.3 | 0.32 | 7.92 | 10.71 | 16.5 | 14.5 | |
MET_LUG_156 | Breccia | 42.4 | 0.40 | 6.42 | 9.67 | 11.5 | 9.3 | |
MET_LUG_157 | Lobe 3 | 48.9 | 0.45 | 5.73 | 9.17 | 11.3 | 8.7 | |
Source: OceanaGold, 2025
All samples were subjected to a suite of chemical analysis as shown in Table 13-26. Tellurium assays were obtained toward the end of the first phase of the metallurgical program and are reported below.
The gold grades of the composites ranged from 1.45 to 7.44 g/t, with an average gold grade of
3.18 g/t. Silver grades varied from 2.65 to 74.0 g/t, with an average of 14 g/t with gold to silver ratios significantly lower in the siltstone domain compared to other areas of the Haile deposit.
The total sulfur grade ranged from 0.9% to 4.4%, with an average of 2.2%; sulfur was present mainly as sulfide (S2-) with a low sulfate (SO4) content. This indicates low sample oxidation which gives confidence that laboratory test results will mirror plant performance.
All other analytes were at low levels and not considered to be a risk for processing. During the infill drilling program in 2024 for the Ledbetter Underground deposit visible tellurides were observed in fresh drill core that had not been logged in the historical records. Tellurium assays were obtained towards the end of the first phase of the metallurgical program and are reported below.
| | | | | | | | |
Released: March 27, 2026 | | Page 114 of 275 |
| | | | | | | | |
NI 43-101 Technical Report – Haile Gold Mine, South Carolina, United States |
| |
| |
Table 13-26: Geochemical Analysis of Ledbetter Underground Composites
| | | | | | | | | | | | | | | | | | | | | | | | | | | | | | | | | | | | | | |
Composite | Au
(g/t) | Ag
(g/t) | Cu
(%) | Fe
(%) | As
(%) | Hg
(g/t) | S
(%) | S2
(%) | TIC
(%) | TOC
(%) | Te
(g/t) | |
MET_LUG_140 | 1.56 | 4.1 | < 0.01 | 2.4 | 0.0 | < 0.3 | 2.6 | 2.3 | 0.1 | < 0.05 | 17.8 | |
MET_LUG_141 | 1.69 | 5.0 | 0.0 | 1.8 | 0.0 | < 0.3 | 1.9 | 1.6 | 0.4 | < 0.05 | 18.1 | |
MET_LUG_142 | 2.25 | 9.0 | < 0.01 | 1.2 | 0.0 | < 0.3 | 1.3 | 1.1 | 0.1 | < 0.05 | 21.2 | |
MET_LUG_143 | 5.90 | 8.6 | < 0.01 | 1.5 | 0.0 | < 0.3 | 1.4 | 1.4 | 0.2 | < 0.05 | 24.3 | |
MET_LUG_144 | 1.96 | 6.6 | 0.0 | 1.4 | 0.0 | < 0.3 | 1.4 | 1.2 | 0.1 | < 0.05 | 15.6 | |
MET_LUG_145 | 1.97 | 2.7 | < 0.01 | 1.4 | 0.0 | < 0.3 | 1.4 | 1.4 | 0.2 | < 0.05 | 20.3 | |
MET_LUG_146 | 2.30 | 3.8 | < 0.01 | 1.9 | 0.0 | < 0.3 | 2.0 | 1.6 | 0.2 | < 0.05 | 24.5 | |
MET_LUG_147 | 2.75 | 3.5 | < 0.01 | 2.2 | 0.0 | < 0.3 | 2.4 | 1.7 | 0.1 | < 0.05 | 21.9 | |
MET_LUG_148 | 3.59 | 4.3 | 0.0 | 1.0 | 0.0 | < 0.3 | 1.0 | 0.9 | 0.1 | < 0.05 | 21.2 | |
MET_LUG_149 | 6.32 | 15.3 | < 0.01 | 2.1 | 0.0 | 0.4 | 2.2 | 2.0 | 0.1 | < 0.05 | 29.3 | |
MET_LUG_150 | 1.45 | 7.0 | < 0.01 | 4.0 | 0.0 | < 0.3 | 4.4 | 3.5 | 0.3 | < 0.05 | 18.6 | |
MET_LUG_151 | 2.15 | 11.3 | < 0.01 | 2.2 | 0.0 | < 0.3 | 2.9 | 2.7 | 0.2 | < 0.05 | 16.8 | |
MET_LUG_152 | 2.12 | 8.3 | < 0.01 | 4.0 | 0.0 | < 0.3 | 4.2 | 3.2 | 0.2 | < 0.05 | 23.0 | |
MET_LUG_153 | 1.75 | 10.9 | < 0.01 | 2.1 | 0.0 | < 0.3 | 2.2 | 2.0 | 0.3 | < 0.05 | 12.2 | |
MET_LUG_154 | 6.79 | 64.0 | < 0.01 | 2.0 | 0.0 | 0.5 | 1.7 | 1.4 | 0.3 | < 0.05 | 84.7 | |
MET_LUG_155 | 7.44 | 74.0 | < 0.01 | 2.2 | 0.0 | 0.3 | 2.3 | 1.8 | 0.6 | < 0.05 | 58.5 | |
MET_LUG_156 | 2.80 | 6.2 | < 0.01 | 1.4 | 0.0 | < 0.3 | 1.5 | 1.4 | 0.2 | < 0.05 | 19.6 | |
MET_LUG_157 | 2.57 | 8.2 | < 0.01 | 3.0 | 0.0 | < 0.3 | 3.0 | 2.5 | 0.1 | < 0.05 | 21.3 | |
Source: OceanaGold, 2025
All the composites responded well to flotation under the standard conditions for the bulk rougher test with 74% to 88% of the gold present and 91% to 97% of the sulfur present reporting to the flotation concentrate. Mass pull was in line with the expectations from the given sulfur grade, and with the expected strategy of Ledbetter Underground representing 25% of mill feed it is not expected to be an issue for the regrind circuit capacity.
The overall gold extractions from the flotation products (concentrates and tailings) corresponding to gold extractions by cyanidation from the head samples varied from 39.3% to 94.9%, with an average value of 84.9% in the Siltstone samples but a significantly lower 61.4% in the Intrusive Breccia samples. It was observed that the 24-hour kinetic leach curves were significantly retarded with significant amount of leachable gold extracted from 8 to 24 hours whereas in other areas of the Haile deposit the majority of leachable gold is extracted in the first 8 hours. The summary of the overall recovery results is shown below in Table 13-27 below.
| | | | | | | | |
Released: March 27, 2026 | | Page 115 of 275 |
| | | | | | | | |
NI 43-101 Technical Report – Haile Gold Mine, South Carolina, United States |
| |
| |
Table 13-27: Ledbetter Underground First Round Recovery Results
| | | | | | | | | | | | | | | | | |
Sample ID | Domain | Flotation Recovery Au % | Leach Recovery | Overall Recovery Au % |
Concentrate Au % | Flotation Tailings Au % |
MET_LUG_140 | Intrusive Breccia | 88.0 | 85.0 | 43.0 | 80.0 |
MET_LUG_141 | Intrusive Breccia | 81.6 | 91.4 | 79.2 | 89.2 |
MET_LUG_142 | Intrusive Breccia | 78.6 | 76.5 | 69.5 | 75.0 |
MET_LUG_143 | Intrusive Breccia | 87.1 | 48.8 | 48.9 | 48.8 |
MET_LUG_144 | Intrusive Breccia | 73.7 | 70.5 | 55.3 | 66.5 |
MET_LUG_145 | Intrusive Breccia | 80.6 | 45.0 | 33.2 | 42.7 |
MET_LUG_146 | Intrusive Breccia | 75.5 | 55.5 | 48.2 | 53.7 |
MET_LUG_147 | Intrusive Breccia | 80.7 | 39.6 | 38.3 | 39.3 |
MET_LUG_148 | Intrusive Breccia | 80.9 | 53.7 | 46.8 | 52.3 |
MET_LUG_149 | Intrusive Breccia | 84.7 | 61.1 | 48.7 | 59.2 |
MET_LUG_150 | Siltstone | 81.5 | 76.7 | 66.1 | 74.8 |
MET_LUG_151 | Siltstone | 85.8 | 84.6 | 82.9 | 84.4 |
MET_LUG_152 | Siltstone | 85.1 | 79.5 | 61.3 | 76.8 |
MET_LUG_153 | Siltstone | 82.6 | 89.9 | 81.2 | 88.4 |
MET_LUG_154 | Siltstone | 86.6 | 92.4 | 75.8 | 90.2 |
MET_LUG_155 | Siltstone | 87.8 | 95.8 | 88.7 | 94.9 |
MET_LUG_156 | Pipe Breccia Lobe 3 | 78.1 | 68.0 | 53.1 | 64.7 |
MET_LUG_157 | Pipe Breccia Lobe 3 | 80.1 | 68.4 | 51.5 | 65.0 |
Source: OceanaGold, 2025
From the remaining sample material of the Intrusive Breccia samples repeated flotation tests were used to produce additional concentrate to conduct extended kinetic leaches to 72 hours at both the standard 13 micron and a finer 8 micron grind size to investigate if inclusion size of gold had reduced or slower leaching phases were present. The results of these tests indicated minimal improvement from finer grinding with slow leaching of gold continuing to occur out to 72 hours with the rate fairly constant from 24 to 72 hours.
A second round of samples was collected from the 2024 infill program focussing on the lower area of the Intrusive Breccia domain where recovery was noticeably affected by lower concentrate leach recovery in the first round of testing. Smaller composites were targeted with material of a singular lithology (several sub-variants identified within the Intrusive Breccia domain) and geological structure to look to see if either of these models would correlate to the difference in recovery compared to the first three composites that demonstrated “normal” kinetic recovery response.
A total of 19 additional samples were submitted to SGS Burnaby in this program from crushed reject samples with head grades ranging from 1.88 to 88 g/t Au and 0.4% to 3.4% S. With the second round program the concentrate kinetic leach time was extended out to 96 hours, and the summary of the overall recovery results is shown below in Table 13-28. Overall recovery with concentrate leach time extended to 96 hours showed a significant improvement relative to 24 hours with overall recovery varying from 36.4% to 92.8% averaging 65.3% a significant improvement from an average of 46% at 24 hours.
| | | | | | | | |
Released: March 27, 2026 | | Page 116 of 275 |
| | | | | | | | |
NI 43-101 Technical Report – Haile Gold Mine, South Carolina, United States |
| |
| |
Whilst no correlation was noted between the recovery and either the structural or lithological models volumetrically it allowed better definition of where the poorer performing material was located.
Table 13-28: Ledbetter Underground Second Round Recovery Results
| | | | | | | | | | | | | | | | | | | | | | | | | | |
Sample ID | Flotation Recovery Au % | Leach Recovery Tailings Au % | 24 Hrs | 72 Hrs | 96 Hrs |
Leach Recovery Con Au % | Overall Recovery Au % | Leach Recovery Con Au % | Overall Recovery Au % | Leach Recovery Con Au % | Overall Recovery Au % |
MET_LUG_231 | 85.2 | 46.4 | 30.2 | 32.6 | 48.4 | 48.1 | 55.6 | 54.3 |
MET_LUG_232 | 78.0 | 46.2 | 31.0 | 34.4 | 60.7 | 57.5 | 65.2 | 61.0 |
MET_LUG_233 | 76.2 | 31.7 | 42.1 | 39.6 | 66.4 | 58.2 | 72.6 | 62.9 |
MET_LUG_234 | 82.7 | 23.8 | 28.8 | 27.9 | 33.6 | 31.9 | 39.0 | 36.4 |
MET_LUG_235 | 82.4 | 33.5 | 39.5 | 38.5 | 63.7 | 58.4 | 69.7 | 63.3 |
MET_LUG_236 | 78.5 | 34.3 | 37.1 | 36.5 | 66.0 | 59.2 | 75.4 | 66.5 |
MET_LUG_237 | 69.6 | 55.7 | 48.9 | 51.0 | 72.0 | 67.1 | 79.9 | 72.5 |
MET_LUG_238 | 88.0 | 53.7 | 43.5 | 44.7 | 66.3 | 64.8 | 70.6 | 68.5 |
MET_LUG_239 | 90.5 | 48.8 | 46.6 | 46.8 | 60.6 | 59.5 | 65.2 | 63.6 |
MET_LUG_240 | 90.7 | 32.1 | 31.1 | 31.1 | 55.2 | 53.0 | 64.6 | 61.5 |
MET_LUG_241 | 87.6 | 70.2 | 65.4 | 66.0 | 80.0 | 78.8 | 83.5 | 81.9 |
MET_LUG_242 | 82.7 | 54.2 | 64.3 | 62.6 | 76.1 | 72.4 | 81.4 | 76.7 |
MET_LUG_243 | 76.8 | 50.6 | 64.3 | 61.1 | 76.1 | 70.2 | 81.4 | 74.2 |
MET_LUG_244 | 82.0 | 81.0 | 85.4 | 84.6 | 94.3 | 91.9 | 95.4 | 92.8 |
MET_LUG_245 | 83.8 | 77.3 | 92.7 | 90.2 | 95.5 | 92.5 | 95.4 | 92.4 |
MET_LUG_246 | 82.2 | 33.8 | 42.6 | 41.0 | 58.8 | 54.3 | 67.0 | 61.1 |
MET_LUG_247 | 73.9 | 34.2 | 35.4 | 35.1 | 57.6 | 51.5 | 65.8 | 57.6 |
MET_LUG_248 | 66.6 | 24.1 | 19.7 | 21.1 | 39.3 | 34.2 | 48.8 | 40.5 |
MET_LUG_249 | 74.2 | 30.5 | 29.6 | 29.8 | 54.9 | 48.6 | 61.7 | 53.6 |
Source: OceanaGold, 2025
A follow up third round of testing was undertaken in 2025 focusing on the upper half of the moderate-recovery material looking to better understand where the boundaries were and to better tie this with gold deportment. A total of 10 composites sourced from coarse crushed rejects were submitted to SGS Burnaby to repeat the extended concentrate kinetic leach test to 96 hours with head grades ranging from 1.67 to 16.7 g/t Au and 0.76% to 2.22% S. Recovery at 96 hours ranged from 62.3% to 96.44% and averaging 85.1% compared to an average of 72% at 24 hours with details provided in Table 13-29 below.
| | | | | | | | |
Released: March 27, 2026 | | Page 117 of 275 |
| | | | | | | | |
NI 43-101 Technical Report – Haile Gold Mine, South Carolina, United States |
| |
| |
Table 13-29: Ledbetter Underground Third Round Recovery Results
| | | | | | | | | | | | | | | | | | | | | | | | | | |
Sample ID | Flotation Recovery Au % | Leach Recovery Tailings Au % | 24 Hrs | 72 Hrs | 96 Hrs |
Leach Recovery Con Au % | Overall Recovery Au % | Leach Recovery Con Au % | Overall Recovery Au % | Leach Recovery Con Au % | Overall Recovery Au % |
MET_LUG_250 | 74.2 | 63.7 | 71.5 | 69.5 | 89.0 | 82.4 | 86.8 | 80.8 |
MET_LUG_251 | 91.2 | 71.8 | 90.1 | 88.5 | 92.6 | 90.8 | 92.9 | 91.0 |
MET_LUG_252 | 75.3 | 57.2 | 77.3 | 72.3 | 90.0 | 81.9 | 88.9 | 81.1 |
MET_LUG_253 | 80.6 | 52.5 | 62.3 | 60.4 | 87.2 | 80.5 | 82.8 | 76.9 |
MET_LUG_254 | 80.0 | 40.5 | 61.5 | 57.3 | 86.6 | 77.3 | 84.0 | 75.3 |
MET_LUG_255 | 83.8 | 34.4 | 45.2 | 43.5 | 78.2 | 71.1 | 67.7 | 62.3 |
MET_LUG_256 | 94.5 | 86.0 | 97.8 | 97.1 | 97.7 | 97.1 | 97.7 | 97.1 |
MET_LUG_257 | 88.4 | 45.5 | 51.1 | 50.5 | 82.1 | 77.9 | 76.0 | 72.4 |
MET_LUG_258 | 84.2 | 85.5 | 92.5 | 91.4 | 95.5 | 93.9 | 93.8 | 92.5 |
MET_LUG_259 | 84.5 | 89.6 | 98.5 | 97.1 | 98.5 | 97.1 | 97.6 | 96.4 |
Source: OceanaGold, 2025
As part of the second and third phase test programs, samples of flotation concentrate were submitted for gold deportment analysis by Tescan Automated Mineral Analysis (TIMA) to check for the inclusion size of gold inclusions within pyrite. The results of this work indicated in the Intrusive Breccia domain the deportment of gold was significantly different to the Metasediment domain and samples from the Palomino deposit. Typically, at Haile in the Metasediment zones, gold in the concentrate is present as native gold inclusions within pyrite accounting for 80% to 95% of the total content. In the Intrusive Breccia domain less than 15% of the gold was present as native gold with the remainder present in a variety of telluride minerals dominated by muthmannite, calaverite, and petzite. Analysis of the data showed a strong positive correlation between the percentage of gold present as petzite at 6, 24 and 96 hours and a strong negative relationship with the percentage of gold present as muthmannite and calaverite. This is graphically presented below in Figure 13-4 and has provided an understanding of the key driver in variable gold recovery within this domain.
| | | | | | | | |
Released: March 27, 2026 | | Page 118 of 275 |
| | | | | | | | |
NI 43-101 Technical Report – Haile Gold Mine, South Carolina, United States |
| |
| |
Source: OceanaGold, 2025
Figure 13-4: Relationship Between Gold Deportment and Concentrate Leach Recovery at 24 Hours
Further regression analysis of the second and third round results allowed recovery estimation to be made both for concentrate leach recovery and overall recovery when knowing the deportment of gold in the key telluride minerals and leach rate at 24 and 48 hours. This is graphically presented below in Figure 13-5 showing what gold recovery is expected to be with a 24 hour or 96 hour concentrate leach residence time.
| | | | | | | | |
Released: March 27, 2026 | | Page 119 of 275 |
| | | | | | | | |
NI 43-101 Technical Report – Haile Gold Mine, South Carolina, United States |
| |
| |
Source: OceanaGold, 2025
Figure 13-5: Overall Gold Recovery Estimation from Gold Telluride Deportment at Varying Concentrate Leach Residence Times
From the testwork programs recovery estimates were used to develop a Leapfrog recovery model using a NN method for the Intrusive Breccia domain and this was then added to the Resource block model. This allows for the Deswik mine schedule to estimate mill recovery and expected gold produced for each stope to be used in the overall production schedule. For the Metasediment domain the current gold recovery model for the site is used.
As part of the Ledbetter Underground Study the testwork results were used to develop a design criteria to modify the current plant flowsheet to keep concentrate leaching separate from the flotation tails stream and to extend it to 96 hours to maximize gold recovery opportunity for the Intrusive Breccia domain hosted ore. An Engineering Feasibility study was conducted by Ausenco to divert the concentrate leach stream after the current pre-aeration and CIL #1 leach tank to a new train of four agitated leach tanks providing 96 hours of total leach residence time followed by a Kemix Carousel modular adsorption circuit running in parallel to the flotation tails stream utilizing the remaining seven CIL tanks. The capital cost estimate for the modification was used to compare to mine schedules assuming 24 hours and 96 hours to evaluate the improved economics that led to the decision of proceeding with the modification to the plant.
13.4Recovery Estimate Assumptions
The recovery estimate model developed in the Romarco Feasibility study based on the interpretation of test work results from a range of samples and test work campaigns and shown in Figure 13-2 as a function of gold grade. This was based on the original flowsheet incorporating sulfide flotation and open circuit regrind of concentrate in the SMD circuit to a target P80 of 13 µm.
The completion of the replacement of the regrind circuit in 2019 with a two stage Towermill / Isamill circuit operating in closed circuit has achieved the targeted regrinding product size. In addition, a
| | | | | | | | |
Released: March 27, 2026 | | Page 120 of 275 |
| | | | | | | | |
NI 43-101 Technical Report – Haile Gold Mine, South Carolina, United States |
| |
| |
number of plant modifications have been implemented to address mechanical issues in the CIL circuit and to convert the pre-aeration tank to a leach tank duty. The overall effect has been to achieve gold recoveries in excess of that predicted by the original Feasibility study model when feeding the plant predominantly fresh sulfide ore. The performance of the plant from 2020 to 2022 resulted in a 2.5% increase on the Feasibility model used during LoM planning process.
The operating strategy for ROM management is based on segregating significant quantities of oxidized ore and campaign milling when possible to minimize the impact on the flotation circuit performance on fresh ore. This is used to create maintenance windows for the regrind circuit without mill downtime.
Given the mill feed schedule over the LoM tracks the major sources the following criteria have been applied to estimate overall gold recovery for production forecasting:
•Fresh sulfide ore delivered to the ROM above 1.7 g/t Au from open pit, Horseshoe, Palomino, and Ledbetter Metasediment domain UG utilize the feasibility recovery plus 2.5%
•Fresh sulfide ore delivered to the ROM below 1.7 g/t Au from open pit, Horseshoe, Palomino, and Ledbetter Metasediment domain UG utilize the feasibility recovery
•Oxide ore assumes a flatline 68% gold recovery based on direct leach flowsheet
•Sulfide ore that is stockpiled and then rehandled to the ROM will attract a 5% recovery penalty compared to the freshly mined recovery assumption
•Fresh sulfide ore from the Ledbetter UG Intrusive Breccia domain utilizes the Leapfrog model developed from metallurgical testing based on a 96 hour concentrate leach residence time
A flatline assumption of 70% silver recovery continues to be used in metal production forecasting. Silver revenue accounts for less than 1.5% of overall total sales and as such the impact of changes to the silver recovery have a marginal impact on overall economic outcomes. The doré product from Haile is gold containing moderate amounts of silver. The doré bars are 95% pure with minimal or no deleterious elements.
| | | | | | | | |
Released: March 27, 2026 | | Page 121 of 275 |
| | | | | | | | |
NI 43-101 Technical Report – Haile Gold Mine, South Carolina, United States |
| |
| |
14 Mineral Resource Estimates
This section describes the Mineral Resource estimation methodology and summarizes the key assumptions adopted by OceanaGold. In the opinion of OceanaGold, the Mineral Resource estimates reported herein are a reasonable representation of the Mineral Resources at Haile. The Mineral Resources and their classification have been prepared in accordance with the CIM Standards on Mineral Resources and Reserves: Definitions and Guidelines, May 10, 2014 (CIM, 2014). Mineral Resources, which are inclusive of Mineral Reserves, are reported in accordance with NI 43-101. There is no certainty that Mineral Resources that are not Mineral Reserves will be converted into Mineral Reserves.
The Haile open pit and Horseshoe underground Mineral Resource estimates were prepared under the supervision of Mr. Jonathan Moore, BSc (Hons) Geology, GradDip Physics, member and Chartered Professional of the Australasian Institute of Mining and Metallurgy. Mr. Moore is OceanaGold’s Head of Resource Development, a QP as this term is defined pursuant to NI 43-101 for Mineral Resources. The effective date of the Mineral Resource statement is December 31, 2025.
The Palomino and Ledbetter underground Mineral Resource estimates were prepared under the supervision of Mr. Douglas Corley, BSc (Hons) Geology, Registered Professional Geoscientist with the Australian Institute of Geoscientists. Mr. Corley is OceanaGold’s Principal Geologist, a QP as this term is defined pursuant to NI 43-101 for Mineral Resources. The effective date of the resource statement is December 31, 2025.
Due to different mining selectivity and CoG assumptions, separate block models were generated for the open pit and underground areas. The open pit Resource model is “HA0725OLM_v6”. The lithological model for all deposits was provided by the OceanaGold Haile Exploration department. Implicit gold grade shell generation, grade estimation and block model construction were completed within VulcanTM software. Resource reporting pit shells were generated using VulcanTM software.
The Horseshoe, Palomino and Ledbetter underground models are “HA0925ULM_v2”, “PA_1023_URR” and “LB1125URR” respectively. The implicit gold grade shells were generated in Leapfrog software whilst grade estimation and block model construction were completed in VulcanTM software (except “LB1125URR”, which was completed in Leapfrog Edge).
The following sections are grouped:
•Sections 14.1 to 14.7 (drillhole database, geological model, lithology, domaining, compositing, top capping and bulk density) apply for all open pit and underground estimates.
•Sections 14.8 to 14.11 (estimation methodology and parameters) are specific to each individual estimate.
•Sections 14.12 to 14.14 (resource classification, validation, reconciliation and resource reporting) apply for all open pit and underground estimates.
14.1Drillhole Database
During 2016, the Romarco Minerals drilling database was migrated to OceanaGold’s standard acQuire database platform. Where available, original source assay and survey data were used for
| | | | | | | | |
Released: March 27, 2026 | | Page 122 of 275 |
| | | | | | | | |
NI 43-101 Technical Report – Haile Gold Mine, South Carolina, United States |
| |
| |
the acQuire translation and database validation. There was an additional internal database review in late 2018 / early 2019. No material errors were identified.
The assay coverage for gold includes all core and RC drilling. However, the collection of carbon (Open Pit Mineral Resource Model), sulfur and silver assay data has largely been retrospective and is significantly sparser than gold. Sulfur and carbon data are primarily used for the prediction of overburden classification types. Sulfur grades are also used for mill feed sulfur estimates. Silver grades are provided for metallurgical considerations (carbon stripping and electro-winning) as well as revenue estimation, albeit silver being a minor contribution relative to total revenue.
Historical drilling (i.e., prior to 2007) accounts for approximately 16% of the data, although much of the Resource associated with this data has been mined. The sample procedures applied to the historical drilling (i.e., drilling prior to Romarco) at Haile were not well documented. Pre-Romarco RC holes drilled by Piedmont were downgraded by 5%. (RC0039 – RC1303).
An analysis of rotary split sub-sample mass for Romarco RC holes (RC1502 to RC2216) was undertaken. Rotary splitter ratio settings ranged from 8% to 17%. Based on back calculating the range of likely total sample weights, RC recoveries appear to have been largely acceptable. As a precautionary measure, sample intervals with low estimated sample recoveries and >200 m sample depths, have had the gold grades factored in relation to sample recovery. The global impact on the Resource estimate is less than 1%. These factors will remain until verified and/or replaced by new drilling. Sensitivity analysis shows. Given this mitigation, the residual risk is low.
14.1.1Data Cut-Off Date – Mineral Resource Models
The data cut-off dates used Mineral Resource Models at Haile are listed in Table 14-1.
Table 14-1: Data Cut-Off Dates for Resource Models
| | | | | | | | | | | |
Area | Model Name | Data Cut-Off Dates | |
Haile Open Pit | “HA0725OLM_v6” | July 21, 2025 | |
Horseshoe Underground | “HA0925ULM_v2” | September 29, 2025 | |
Palomino Underground | “PA_1023_URR” | October 11, 2023 | |
Ledbetter Underground | “LB1125URR” | October 29, 2025 | |
Source: OceanaGold, 2025
For Palomino, no drilling has occurred since October 2023
14.2Geologic Model Concepts
A detailed 3D geological model, including weathering, has been constructed. This model, which has evolved over time, has been used to assign variable bulk densities to the various block models. Faults have also been modeled. However, other than post-mineralization dikes and post mineralization erosion / deposition interfaces, there are few geological features that represent hard mineralization boundaries.
Gold mineralization at the Haile Gold Mine is hosted within deformed greenschist facies MS and MV which define a large scale antiform that plunges at a low angle to the northeast. Mineralization occurs as discrete bodies, variously located on the limbs and hinge zone of this antiform. Diabase
| | | | | | | | |
Released: March 27, 2026 | | Page 123 of 275 |
| | | | | | | | |
NI 43-101 Technical Report – Haile Gold Mine, South Carolina, United States |
| |
| |
and Lamprophyre dykes, which exploited pre-existing sub-vertical, NW-SE striking fractures, cut across mineralization. The structures that host the dikes are post-date folding, do not demonstrate fault offset, yet seem in some cases to influence gold grade distribution.
The interplay between the contacts, bedding (S0), regional foliation (S2), and the fractures is important to understanding the current distribution of gold mineralization at Haile. The overarching relationship between these elements changes across the antiform; bedding and the MS-MV contact dip steeply to the SE on the southern limb (Horseshoe and Palomino) whereas dip moderately to the NW on the northern limb (Mill Zone, Haile, Red Hill, Ledbetter and Snake). Red Hill SE and Snake are located in hinge zones. Importantly, the S2 foliation dips consistently to the NW, intersecting bedding and contacts at a high angle on the southern limb. By contrast, the S2 foliation is typically sub-parallel to bedding and contacts on the northern limb (Figure 14-1).
Source: OceanaGold, 2025
Figure 14-1: Schematic Cross-Section Looking NE – Showing Relationship of UG Deposits to MS / MV Contact (Blue line) and Regional Foliation (Orange Line)
14.3Lithology
Lithologic codes used at Haile capture many geologic attributes including the primary rock type, presence of brecciation, silicification, lamination, and numerous variations on the general rock unit.
Most of the mineralization is hosted within the Metasediments and the lithological units are as follows:
•S - sand
•Sap - saprolite
•MV - metavolcanics
•DB - intrusive dikes
•Fill - back-fill from historical mining
| | | | | | | | |
Released: March 27, 2026 | | Page 124 of 275 |
| | | | | | | | |
NI 43-101 Technical Report – Haile Gold Mine, South Carolina, United States |
| |
| |
•Ml - laminated metasediments (MS)
•Ms - silicified metasediments (MS)
•Basalt
•Intrusive Breccia
•Undifferentiated Basement Material
14.3.1Silicification
The intensity of “silicification” increases from 0 (absent) to 3 (pervasive) and is logged visually by site geologists. The minor silicification (1) population has an average grade of about 0.5 g/t. The average grade of moderately silicified (2) rocks is 1.0 g/t and the very silicified (3) average grade increases to approximately 2.0 g/t. Whilst there is a broad gold to silicification relationship, it is not strong enough to guide gold estimation.
14.3.2Pyrite
Multiple morphologies of pyrite have been identified at Haile, ranging from fine to coarse cubic pyrite. Based on logging, it has been established that fine-grained pyrite is commonly associated with gold mineralization, however pyrite is not used to guide gold estimation.
14.4Domaining
Estimation domaining methodology used for the open pit and three underground Resource models, was similar. Grade-based implicit wireframes were generated using Leapfrog numerical modeling or Vulcan implicit grade function. The grade threshold used for each model depended on the deposit, element being estimated, nature of the grade boundaries, cut-off grade and geostatistics.
The implicit wireframes were implemented as hard boundaries for grade estimation.
14.4.1Gold
A summary of Au value used for the hard boundary gold domains is summarized in Table 14-2.
Table 14-2: Hard Boundaries Au Domain Thresholds
| | | | | | | | | | | | | | |
Area | Model Name | Au (g/t) Threshold | Probability above
Threshold (%) | |
Haile Open Pit | “HA0725OLM_v6” | 0.065 | 50 | |
Horseshoe Underground | “HA0925ULM_v2” | 1.0 | 25 | |
Palomino Underground | “PA_1023_URR” | 0.8 | 25 | |
Ledbetter Underground | “LB1125URR” | 0.7 | 25 | |
Source: OceanaGold, 2025
There was some sub-domaining used in the Au estimation for the Open Pit and Palomino Mineral Resource models.
•Open Pit: sub-divided into two domains based upon gold distribution and orientation, albeit the differences were not large between the two domains. The mineralized zones within
| | | | | | | | |
Released: March 27, 2026 | | Page 125 of 275 |
| | | | | | | | |
NI 43-101 Technical Report – Haile Gold Mine, South Carolina, United States |
| |
| |
domain 1 approximate a dip direction of 40 to 330. In domain 2, mineralized zones approximate a dip direction of 30 to 335.
•Palomino: low grade (=<0.25 g/t Au) and high grade (>0.25 g/t Au) sub domains were identified within the 0.8 g/t Au domain and estimated using Indicator Kriging.
14.4.2Silver
Silver grade estimates are provided for metallurgical considerations (carbon stripping and electro-winning) as well as for revenue estimation; despite contributing only ~1.5% of total revenue. Silver content is not used as a gold-equivalent input for cut-off calculation nor to guide mine design decisions.
The selection of samples for silver assaying was undertaken retrospectively, based upon previously assayed gold grades, resulting in less than 10% coverage of that for gold. Sample selection for silver assaying tended to favor more strongly gold-mineralized intervals, leaving less intensely mineralized intervals, on the flanks of the mineralization under represented. To mitigate the impacts of the selection bias, bivariate simulation was implemented (“simulate missing data” program in GS3 proprietary software). This non-spatial stepwise simulation assigned silver grades to locations with gold assays, but no silver assays, based upon relationships between silver and gold in the assay database.
An example of the comparison of actual Ag data compared to the simulated Ag is shown at the Ledbetter UG deposit in Figure 14-2. It presents a log scale scatter plot of Ag vs. Au grades, both the original dataset and with the simulated data added. The two population distributions (actual Ag assays vs Ag values simulated from established Ag / Au relationship) compare well.
| | | | | | | | |
Released: March 27, 2026 | | Page 126 of 275 |
| | | | | | | | |
NI 43-101 Technical Report – Haile Gold Mine, South Carolina, United States |
| |
| |
Source: OceanaGold, 2025
Note: left: Original Ag Data / right: Simulated and Original Ag Data
Figure 14-2: Ledbetter UG deposit log-scale scatter plot of Ag (Original / Simulated) vs Au
The same domaining and search orientations used for gold were used for silver, in all models except for Ledbetter UG (“LB1125URR”).
The tenor of Ag mineralization is much higher in the Ledbetter UG area than elsewhere at Haile. An additional Ag domain was required to better estimate the Ag distribution. Nested within the lower grade domain, a higher-grade domain was generated from the intersection of the Intrusive Breccia and the low-grade domain.
There is a strong correlation between tellurium (Te) and Ag, so the Ag domain was used for the Te estimate also.
14.5Compositing
The Haile Open Cut Mineral Resource DH database was composited to 2.5 m downhole lengths with breaks at domain contacts. The merge function was used, where intervals are less than or equal to 1.25 m minimal and coverage 50% of residual are merged with the adjacent sample, resulting in lengths ranging from 1.25 to 3.75 m with a mean of 2.5 m. No compositing was used for total carbon and total sulfur due to discontinuous sampling.
For all UG Mineral Resources, the DH databases were composited to 3 m downhole lengths with breaks at domain contacts. The 3 m length was chosen to reflect mining selectivity and the parent block dimensions used. The merge function was used, where intervals less than or equal to 1.5 m minimal and coverage 50% of residual are merged with the adjacent sample, resulting in lengths ranging from 1.5 to 4.5 m with a mean of 3 m.
| | | | | | | | |
Released: March 27, 2026 | | Page 127 of 275 |
| | | | | | | | |
NI 43-101 Technical Report – Haile Gold Mine, South Carolina, United States |
| |
| |
14.6Top-Capping
Top-capping is reviewed on a deposit-by-deposit basis, with the purpose of managing the influence of outliers in highly skewed grade distributions. Actual top cap values are discussed in the respective sections.
14.7Bulk Density
Mineral Resource block model in situ dry bulk densities (BD) are based on lithology averages, as shown in Table 14-3. The BD was assigned for each lithology type (and oxidation state used for Open Pit Mineral Resource Model, all UG lithologies are fresh).
In situ density determinations have been carried out at regular intervals on drill core samples (approx. 10 to 20 cm billets), and over 46,000 measurements have been collected to date. The “Archimedes method” involved weighing the sample both in air and in water. The measurements were then averaged for each lithology. The BD is reported as tonnes per cubic metre (t/m3).
Table 14-3: Assigned Lithological Bulk Density Values
| | | | | | | | | | | | | | | | | | | | | | | | | | | | | | | | | | | | | | |
BD Assignment Criteria (tonnes/m3) |
Sand | Saprolite | PAG Fill | Tails | Heap | Dike | Meta Volcanics | Meta Sediments | Basalt | Intrusive Breccia | Basement |
2.06 | | 2.18 | | 1.89 | | 2.14 | | 1.7 | | 2.88 | | Oxidized | Fresh | Oxidized | Fresh | 2.81 | | 2.68 | | 2.74 | |
2.52 | | 2.7 | | 2.57 | | 2.78 | |
Source: OceanaGold, 2025
•That Sand, Saprolite, PAG fill, Tails, Heap and oxidized Meta-Volcanics / Meta-Sediments are only used in Haile Open Pit Mineral Resource models. UG Resource Models contain fresh material only.
14.8Mineral Resource – Open Pit
The Haile open pit Resource comprises Champion, Small, Haile, Red Hill, Ledbetter, and Snake deposits through various stages of mining. The location of the various deposits is shown in Figure 14-3 (red shapes are Open Pit deposits, blue shapes are UG deposits). These deposits are on the shallow-dipping limb to the northwest and extend from the surface to a depth of approximately 275 m.
| | | | | | | | |
Released: March 27, 2026 | | Page 128 of 275 |
| | | | | | | | |
NI 43-101 Technical Report – Haile Gold Mine, South Carolina, United States |
| |
| |
Source: OceanaGold, 2025
•Haile Open Pit deposits are shown in Red (UG deposits colored blue). Approximate Axial fold hinge trace of the Metasediment / Metavolcanic contact is shown in pink; deposits to the NW of the fold hinge are at shallow angle to the Mineralization Foliation and deposits to the SE of the fold hinge are at a steep angle to the Mineralization Foliation.
Figure 14-3: Haile Open Pit
For the Open Pit Mineral Resource model, the 2.5 m composited gold grades were top capped to
50 g/t Au to temper mean grades above the top-class indicator threshold. Only nine and 15 composites required capping from domain 1 and 2 respectively.
Gold grade indicator thresholds were determined for each domain based on their histograms and cumulative distribution functions (CDF). Thresholds were set at 10th, 20th, 30th, 40th, 50th, 60th, 70th, 75th, 80th, 85th, 90th, 95th, 97.5th and 99th percentiles. Statistics for capped Au indicator class thresholds are summarized in Table 14-4.
Total sulfur was top capped to 33% for extreme values (one composite only). No top-cap was applied for total carbon.
| | | | | | | | |
Released: March 27, 2026 | | Page 129 of 275 |
| | | | | | | | |
NI 43-101 Technical Report – Haile Gold Mine, South Carolina, United States |
| |
| |
Table 14-4: Haile Open Pit Indicator Gold Class Thresholds and Means
| | | | | | | | | | | | | | | | | | | | | | | | | | | | | | | | |
Summary of Grade Thresholds and Mean Values for MIK | |
Statistics Length Weighted Domain 1 | Statistics Length Weighted Domain 2 | |
Bin # | Class | Mean | Median | Count | Bin # | Class | Mean | Median | Count | |
1 | | >=0.00, <0.05 | 0.03 | | 0.03 | | 2,830 | | 1 | | >=0.00, <0.03 | 0.01 | | 0.01 | | 2,444 | | |
2 | | >=0.05, <0.07 | 0.06 | | 0.06 | | 2,275 | | 2 | | >=0.03, <0.06 | 0.04 | | 0.04 | | 2,422 | | |
3 | | >=0.07, <0.10 | 0.09 | | 0.09 | | 3,400 | | 3 | | >=0.06, <0.09 | 0.07 | | 0.07 | | 2,646 | | |
4 | | >=0.10, <0.13 | 0.12 | | 0.12 | | 3,384 | | 4 | | >=0.09, <0.13 | 0.11 | | 0.11 | | 3,115 | | |
5 | | >=0.13, <0.18 | 0.15 | | 0.15 | | 3,927 | | 5 | | >=0.13, <0.19 | 0.16 | | 0.16 | | 3,317 | | |
6 | | >=0.18, <0.25 | 0.21 | | 0.21 | | 3,853 | | 6 | | >=0.19, <0.28 | 0.23 | | 0.23 | | 3,479 | | |
7 | | >=0.25, <0.37 | 0.30 | | 0.30 | | 4,186 | | 7 | | >=0.28, <0.43 | 0.35 | | 0.34 | | 3,693 | | |
8 | | >=0.37, <0.46 | 0.41 | | 0.41 | | 1,933 | | 8 | | >=0.43, <0.55 | 0.49 | | 0.48 | | 1,968 | | |
9 | | >=0.46, <0.59 | 0.52 | | 0.52 | | 1,994 | | 9 | | >=0.55, <0.71 | 0.62 | | 0.62 | | 1,774 | | |
10 | | >=0.59, <0.79 | 0.68 | | 0.68 | | 1,945 | | 10 | | >=0.71, <0.97 | 0.83 | | 0.82 | | 1,925 | | |
11 | | >=0.79, <1.17 | 0.96 | | 0.96 | | 1,943 | | 11 | | >=0.97, <1.48 | 1.19 | | 1.18 | | 2,049 | | |
12 | | >=1.17, <2.07 | 1.55 | | 1.51 | | 2,006 | | 12 | | >=1.48, <2.71 | 1.99 | | 1.95 | | 2,125 | | |
13 | | >=2.07, <3.05 | 2.49 | | 2.46 | | 781 | | 13 | | >=2.71, <4.16 | 3.33 | | 3.27 | | 929 | | |
14 | | >=3.05, <6.00 | 4.13 | | 3.98 | | 759 | | 14 | | >=4.16, <9.20 | 5.92 | | 5.62 | | 1,034 | | |
15 | | >=6.00, <50 | 11.34 | | 8.85 | | 403 | | 15 | | >=9.20, <50 | 16.60 | | 13.71 | | 534 | | |
Source: OceanaGold, 2025
Gold estimation was completed using MIK, while carbon and sulfur were estimated using OK. Carbon and sulfur values are used for classification of overburden material.
For gold estimation, two domains were used:
•Domain 1 (Mill Zone, Haile/Red Hill, Champion)
•Domain 2 (Snake, Ledbetter)
Indicator variograms were produced for all grade thresholds in both domains. Variograms were generated in GS3 software and exported in VulcanTM format.
Each domain area was estimated in three passes, with a larger subsequent search ellipse than the previous domain. Each of the main two open pit domain areas has unique search parameters based upon indicator variogram models for 14 different gold indicator thresholds.
Grade estimation was completed with VulcanTM software, using MIK based on 2.5 m composites to produce grade estimates into a 10 m E x 10 m N x 5 m RL model blocks. Model block grade estimates for post-mineralization dikes were reset to zero gold grades after estimation.
14.8.1Block Model
The HA0725OLM_V6 Mineral Resource block model was constructed in VulcanTM and the parameters are listed below in Table 14-5. The block model is based on a parent block size of 10 m x 10 m x 5 m in x, y, z respectively, without sub-blocking or rotation.
| | | | | | | | |
Released: March 27, 2026 | | Page 130 of 275 |
| | | | | | | | |
NI 43-101 Technical Report – Haile Gold Mine, South Carolina, United States |
| |
| |
Table 14-5: HA0725OLM_V6 Block Model Dimensions
| | | | | | | | | | | | | | |
Variable | X | Y | Z | |
Minimum | 539,810 | 3,825,575 | 200 | |
Maximum | 544,510 | 3,827,725 | 1,200 | |
Block Size (Parent) | 10 | 10 | 5 | |
No. of Blocks (Parent) | 470 | 215 | 200 | |
Source: OceanaGold, 2025
14.8.2Estimation Methodology
Top caps of 50 g/t Au were applied to temper mean grades above the top class indicator threshold. Acceptable long term model to mill-adjusted mine reconciliation suggests this as a reasonable approach.
OK was used for silver, sulfur and carbon estimates.
The general workflow for model generation was as follows:
•Drillhole data extraction from acQuire database
•Data validation
•Exclusion of drillholes from early drilling campaigns with poor documentation
•Drillhole composite to 2.5 m for Au
•No composite (straight) for total carbon and total sulfur due discontinuous sampling
•Duplicates removal
•Grade shell generation in VulcanTM using Implicit modeling tool using 0.065 g/t Au threshold
•Composite flagging including domain area and Au grade shell
•Block model creation in VulcanTM including lithology, domain area and grade shell
•Run multi-pass MIK estimation for Au
•Set block grades to zero for blocks coded as post-mineralization dike
•Run OK estimation for Ag (using stepwise simulated Ag values for intervals with gold assays but no silver assay), total carbon and total sulfur
•Deplete resource with historical open pit and underground workings
•Assign model bulk densities based on lithology
•Model classification
For Mineral Resource classification, see section 14.12.
14.8.3Open Pit Geometallurgical Model
An open pit geo-metallurgical model was first developed in 2023 based on historic rock hardness data (see Section 13.1). Model dimensions were the same as the open pit Mineral Resource model. BBWi and DWi were assigned to resource model blocks.
Between 2024 and 2025, additional samples were collected and analyzed for BBWi and DWi (See section 13.1.1), primarily from future Ledbetter pit phases. The Geometallurgical model was updated in 2025 with revised estimation parameters and provided the basis for the current mill throughput schedules. The model will continue to be developed as new input data is evaluated
| | | | | | | | |
Released: March 27, 2026 | | Page 131 of 275 |
| | | | | | | | |
NI 43-101 Technical Report – Haile Gold Mine, South Carolina, United States |
| |
| |
(such as Equotip1 drill core readings and production drilling penetration rates) and the impacts of blast fragmentation and plant utilization on reconciliation / calibration are accommodated.
14.9Mineral Resource - Horseshoe Underground
The Horseshoe deposit is the highest grade and eastern-most known gold deposit in the Haile district (Figure 14-4). Mineralization extends over a vertical distance of 350 m, length of 200 m and width of 120 m, albeit with a complex geometry. The top of the deposit is about 120 m below.
Source: OceanaGold, 2025
Figure 14-4: Plan View showing Horseshoe (Red) Relative to Open Pit Areas
The composite statistics for Au g/t and Ag g/t are shown in Table 14-6. A 90g/t Au top cap and 12.5g/t Ag top cap were applied. Sixteen gold and thirty silver composites are affected by top capping. Furthermore, domain 3 (dilution domain) composites for Au and Ag were severely capped to account the high-grade outliers.
1 Equotip enables portable hardness testing. The hardness measurements are made by using the dynamic rebound testing method according to Leeb, the static Portable Rockwell hardness test and the Ultrasonic Contact Impedance (UCI) method
| | | | | | | | |
Released: March 27, 2026 | | Page 132 of 275 |
| | | | | | | | |
NI 43-101 Technical Report – Haile Gold Mine, South Carolina, United States |
| |
| |
Table 14-6: Horseshoe UG 3 m Composite Statistics Comparison by Domain
| | | | | | | | | | | | | | | | | | | | | | | | | | |
DOMAIN | FUNCTIONS | Raw | 3 m Composite | Top Capping | |
Au | Ag | Au | Ag | Au | Ag | |
1 | No. of Samples | 12,328 | 603 | 4,817 | 2,607 | 4,817 | 2,607 | |
Minimum | 0.003 | 0.005 | 0.003 | 0 | 0.003 | 0 | |
Maximum | 1,080 | 83.0 | 275 | 71.0 | 90 | 12.5 | |
Range | 1,079 | 83.0 | 275 | 71 | 89.997 | 12.5 | |
Mean | 5.47 | 2.26 | 4.69 | 1.97 | 4.54 | 1.82 | |
Standard Deviation | 17.4 | 3.69 | 11.1 | 3.34 | 9.24 | 2.19 | |
Variance | 596 | 13.6 | 124 | 11.1 | 85.3 | 4.79 | |
Coef. of Variance | 4.46 | 1.63 | 2.38 | 1.70 | 2.03 | 1.07 | |
Skewness | 23.5 | 7.89 | 9.32 | 8.13 | 5.51 | 2.35 | |
Median | 1.42 | 1.50 | 1.67 | 1.11 | 1.67 | 1.11 | |
3 | No. of Samples | 10,496 | 192 | 4,911 | 1,837 | 4,911 | 1,837 | |
Minimum | 0.003 | 0.005 | 0.002 | 0 | 0.002 | 0 | |
Maximum | 66.4 | 4.1 | 34.0 | 31.3 | 0.6 | 1.5 | |
Range | 66.3 | 4.11 | 33.7 | 31.3 | 0.598 | 1.5 | |
Mean | 0.20 | 0.43 | 0.19 | 0.40 | 0.13 | 0.31 | |
Standard Deviation | 0.897 | 0.48 | 0.64 | 1.48 | 0.19 | 0.33 | |
Variance | 0.80 | 0.23 | 0.414 | 2.18 | 0.04 | 0.11 | |
Coef. of Variance | 4.39 | 1.12 | 3.44 | 3.73 | 1.44 | 1.07 | |
Skewness | 42.4 | 3.27 | 32.3 | 18.6 | 1.59 | 2.35 | |
Median | 0.03 | 0.25 | 0.04 | 0.15 | 0.13 | 0.15 | |
Source: OceanaGold, 2025
14.9.1Block Model
The block model is rotated in VulcanTM with a 60° bearing with 0° plunge and dip. The dimension, origin, and cell size are provided in Table 14-7.
Table 14-7: Block Model Dimensions and Origin
| | | | | | | | | | | | | | |
Variable | X | Y | Z | |
Origin | 542,900 | 3,826,100 | 600 | |
Minimum | 0 | 0 | 0 | |
Maximum | 1,250 | 700 | 580 | |
Block Size (Parent) | 10 | 10 | 10 | |
Sub-block size | 2.5 | 2.5 | 2.5 | |
Source: OceanaGold, 2025
| | | | | | | | |
Released: March 27, 2026 | | Page 133 of 275 |
| | | | | | | | |
NI 43-101 Technical Report – Haile Gold Mine, South Carolina, United States |
| |
| |
14.9.2Estimation Methodology
The general workflow for model generation was as follows:
•Drillhole data extraction from acQuire database
•Data validation
•Construct 1 g/t gold grade shell and 15 m offset dilution shell
•Export updated grade shell and database from Leapfrog
•Drillholes flagged using Au and S grade shell
•Composite drillholes to 3 m within the grade shell for Au, Ag, and S
•Top capping analysis for Au, Ag, and S
•Generate Vulcan block model within lithological wireframes, topography, and grade shells
•Run estimation for Au g/t, Ag g/t, and S % using OK
•Estimation validations
•Assign model densities
•Use interpretated dike solids to zero Au and Ag values
•Classification and reporting.
For Resource classification, see section 14.12.
14.10Mineral Resource - Palomino Underground
The Palomino deposit is located approximately 650 m southwest of Horseshoe, and 300 m below surface (Figure 14-5). The Palomino Resource estimate is based on the current drillhole database, interpreted lithologies, geologic controls, and current topographic data.
Source: OceanaGold, 2025
Figure 14-5: Long-Section Looking NNW, showing Palomino Mineralization, Horseshoe, HEX and, Entire Haile Drilling Intercept Dataset Shown (colored by Au g/t)
| | | | | | | | |
Released: March 27, 2026 | | Page 134 of 275 |
| | | | | | | | |
NI 43-101 Technical Report – Haile Gold Mine, South Carolina, United States |
| |
| |
Statistical analysis of the composite data for Au and Ag resulted in a capping value of 28 g/t Au and 15 g/t Ag for the 0.8 g/t Au threshold shell. Capping analysis for the dilution domain resulted in values of 4.5 g/t and 2.5 g/t for Au and Ag respectively. Table 14-8 summarizes the length-weighted statistics of 3 m composites within the 0.8 g/t Au threshold shell (pug 0p8=1) and dilution domain (expanded 10m around the mineralized domain).
Table 14-8: Palomino UG Basic Statistics for 3 m Composites by Domain
| | | | | | | | | | | | | | | | | | | | | | | | | | |
Variable | Domain | Count | Minimum | Maximum | Mean | Variance | CV | |
AU_PPM | pug_0p8=1 | 2,475 | | 0.003 | | 39.8 | | 2.5 | | 12.4 | | 1.4 | | |
dilution | 1,943 | | 0.003 | | 37.2 | | 0.2 | | 1 | | 4.2 | | |
AU_CAP | pug_0p8=1 | 2,475 | | 0.003 | | 28 | | 2.5 | | 11.7 | | 1.4 | | |
dilution | 1,943 | | 0.003 | | 4.5 | | 0.2 | | 0.2 | | 1.9 | | |
AG_PPM | pug_0p8=1 | 599 | | 0.029 | | 22.2 | | 2.5 | | 8.8 | | 1.2 | | |
dilution | 174 | | 0.007 | | 10.7 | | 0.6 | | 1.3 | | 2 | | |
AG_CAP | pug_0p8=1 | 599 | | 0.029 | | 15 | | 2.4 | | 7.7 | | 1.1 | | |
dilution | 174 | | 0.007 | | 2.5 | | 0.5 | | 0.3 | | 1.2 | | |
Source: OceanaGold, 2023
A probability kriging methodology was used to separate the higher grade (HG) and lower grade (LG) portions (grade and probability) for estimation into the parent block. The two estimates were then weight-averaged for whole block grade estimates. This was based on the probability (proportion) of the high- and low-grade domains within the block, where:
Block grade = ((Proportion HG x Grade HG) + (Proportion LG x Grade LG))
Statistics of the data within the sub-set HG and LG domains, are based on the 0.25 g/t Au indicator.
14.10.1Block Model
The block model is rotated to align with the primary 060° mineralization direction with the long axis. The block model parameters are listed in Table 14-9.
Table 14-9: Palomino Block Model Dimensions and Origin
| | | | | | | | | | | | | | |
Variable | X | Y | Z | |
Rotation | 060o | |
Origin | 542,500 | 3,825,800 | 250 | |
Length | 920 | 520 | 750 | |
Block Size (Parent) | 10 | 10 | 10 | |
Sub-block size | 2.5 | 2.5 | 2.5 | |
No. of Blocks (Parent) | 92 | 52 | 75 | |
Source: OceanaGold, 2023
| | | | | | | | |
Released: March 27, 2026 | | Page 135 of 275 |
| | | | | | | | |
NI 43-101 Technical Report – Haile Gold Mine, South Carolina, United States |
| |
| |
14.10.2Estimation Methodology
Gold
Post-mineralization dikes were assigned a zero grade.
The following methodology was used:
•Build a variogram for the 0.25 g/t Au indicator for data within the 0.8 g/t Au threshold shell
•Search orientation essentially parallel to the plane of gold continuity
•Estimate LG indicator probability (LG ind prob)
•Calculate HG indicator probability (HG ind prob) where:
•HG ind prob = 1 – LG ind prob
•Build a variogram for the Au grade in the LG and HG domains
•Estimate Au grade for HG and LG Domain
•Limit data to four samples per DH
•No octant restriction applied
•Post estimation – calculate final block grade where:
Block grade = ((Proportion HG x Grade HG) + (Proportion LG x Grade LG))
Silver
Silver (Ag) grades for the 0.8 g/t Au threshold shell (Domain 1) were estimated into parent blocks built within Isatis-Neo modeling software using Ordinary Co-Kriging (COK) on 3 m composites to address the paucity of silver analyses. Only 773 silver composites were available compared to 4,418 composites for gold. The COK estimates leverage the spatial correlation between Au vs. Ag using a cross-variogram to estimate at locations where gold assays were present, but no Ag assays were available.
| | | | | | | | |
Released: March 27, 2026 | | Page 136 of 275 |
| | | | | | | | |
NI 43-101 Technical Report – Haile Gold Mine, South Carolina, United States |
| |
| |
14.11Mineral Resource – Ledbetter Underground
In contrast to elsewhere at Haile, Ledbetter is underlain by a series of diabase dikes and a basaltic unit (Figure 14-6). The highest-grade gold-silver-telluride mineralization is located predominantly within a unit mapped as the Intrusive Breccia, which hosts the majority of Lobe 1.
Source: OceanaGold, 2025
•Key Lithologies (labelled), Mineralization Foliation Trends (blue) and Mineralized Lobes (red) are shown
Figure 14-6: Ledbetter UG Lithology Slice View, Along Strike of Mineralization (striking NW), Looking NE
| | | | | | | | |
Released: March 27, 2026 | | Page 137 of 275 |
| | | | | | | | |
NI 43-101 Technical Report – Haile Gold Mine, South Carolina, United States |
| |
| |
The Ledbetter underground deposit dimensions are approximately 450 m long x 200 m thick x 250 m wide, sitting below the Ledbetter Phase 3 open pit (see Figure 14-7), comprising three separate mineralized lobes, dipping approximately 40° to the northwest.
Source: OceanaGold, 2025
Figure 14-7: Looking South – Ledbetter UG Deposit, Relative to the Final Ledbetter Open Pit
Statistical analysis of the drillhole sample data has resulted in a capping value of 60 g/t Au, 8 g/t Au,10 g/t Au, and 1.5 g/t Au for the composites used in Lobe 1 to 3 and the dilution domain (expanded 10 m around lobes 1 to 3) respectively.
Table 14-10 summarizes the length weighted statistics of 3 m composites within the 0.7 g/t Au indicator shell (Lobe=1 to 3) and dilution domain.
Table 14-11 and Table 14-12 summarize the statistics of 3 m composites (of the two datasets, actual Ag data and the combined simulated Ag data) within the 1 g/t Ag indicator shell (agdom=1) and higher-grade domain (agdom=2). Statistical analysis of the combined sample data has resulted in a capping value of 55 g/t Ag and 115 g/t Ag for the composites used in agdom 1 and 2 respectively.
| | | | | | | | |
Released: March 27, 2026 | | Page 138 of 275 |
| | | | | | | | |
NI 43-101 Technical Report – Haile Gold Mine, South Carolina, United States |
| |
| |
Table 14-10: Ledbetter UG Basic Statistics for 3 m Au Composites by Domain
| | | | | | | | | | | | | | | | | | | | | | | | | | | | | |
Variable | Domain | Count | Mean | Std Dev | CV | Variance | Minimum | Maximum | |
Au g/t | Lobe 1 | 1,798 | | 4.15 | | 21.5 | | 5.19 | | 463 | | 0.01 | | 547 | | |
Lobe 2 | 66 | | 3.63 | | 15.8 | | 4.34 | | 249 | | 0.09 | | 127 | | |
Lobe 3 | 211 | | 3.63 | | 13.3 | | 3.66 | | 176 | | 0.01 | | 173 | | |
dilution | 2,865 | | 0.20 | | 0.40 | | 2.05 | | 0.16 | | 0.003 | | 12.1 | | |
Au CAP | Lobe 1 | 1,798 | | 3.11 | | 7.19 | | 2.31 | | 51.6 | | 0.01 | | 60 | | |
Lobe 2 | 66 | | 1.76 | | 1.50 | | 0.85 | | 2.25 | | 0.09 | | 8 | | |
Lobe 3 | 211 | | 2.09 | | 2.36 | | 1.13 | | 5.59 | | 0.01 | | 10 | | |
dilution | 2,865 | | 0.17 | | 0.18 | | 1.06 | | 0.03 | | 0.003 | | 0.70 | | |
Source: OceanaGold, 2025
Table 14-11: Ledbetter UG Basic Statistics for 3 m Ag Composites (Based Only on Actual Ag Data) by Ag Domains
| | | | | | | | | | | | | | | | | | | | | | | | | | | | | |
Variable | Domain | Count | Mean | Std Dev | CV | Variance | Minimum | Maximum | |
Ag g/t | agdom 1 | 312 | | 5.90 | | 10.4 | | 1.76 | | 108 | | 0.182 | | 102 | | |
agdom 2 | 393 | | 20.1 | | 98.6 | | 4.90 | | 9,727 | | 0.250 | | 1,386 | | |
Ag CAP | agdom 1 | 312 | | 5.59 | | 8.15 | | 1.46 | | 66.5 | | 0.18 | | 55 | | |
agdom 2 | 393 | | 10.5 | | 22.4 | | 2.15 | | 502 | | 0.25 | | 115 | | |
Source: OceanaGold, 2025
Table 14-12: Ledbetter UG Basic Statistics for 3 m Ag Composites (Based on Actual and Simulated Ag Data) by Ag Domains.
| | | | | | | | | | | | | | | | | | | | | | | | | | | | | |
Variable | Domain | Count | Mean | Std Dev | CV | Variance | Minimum | Maximum | |
Ag g/t | agdom 1 | 3,654 | | 4.2 | | 9.2 | | 2.19 | | 84.6 | | 0.02 | | 102 | | |
agdom 2 | 2,120 | | 16.3 | | 80.2 | | 4.91 | | 6,432 | | 0.07 | | 1386 | | |
Ag CAP | agdom 1 | 3,654 | | 3.96 | | 7.3 | | 1.84 | | 53.3 | | 0.02 | | 55 | | |
agdom 2 | 2,120 | | 9.79 | | 20.6 | | 2.1 | | 424 | | 0.07 | | 115 | | |
Source: OceanaGold, 2025
14.11.1Block Model
The Mineral Resource block model was constructed in Leapfrog EDGE® software. Parent blocks dimensions are 10 m E x 10 m N x 10 m RL; the model was sub-blocked to 2.5 m E x 2.5 m N x 2.5 m RL for better volumetric determination. No rotation was applied to the Mineral Resource model. The block model parameters are summarized in Table 14-13.
| | | | | | | | |
Released: March 27, 2026 | | Page 139 of 275 |
| | | | | | | | |
NI 43-101 Technical Report – Haile Gold Mine, South Carolina, United States |
| |
| |
Table 14-13: Block Model Dimensions and Origin Setup
| | | | | | | | | | | | | | |
Variable | X | Y | Z | |
Rotation | 0o | |
Origin | 541,700 | 3,826,500 | 1,100 | |
Length | 1100 | 800 | 500 | |
Block Size (Parent) | 10 | 10 | 10 | |
Sub-block size | 2.5 | 2.5 | 2.5 | |
No. of Blocks (Parent) | 110 | 80 | 50 | |
Source: OceanaGold, 2025
14.11.2Estimation Methodology
Gold, silver, sulfur, and tellurium grades were estimated using OK on top capped 3 m composites.
The summary of methodology was used for the mineralized domains for Au, Ag, Te, and S as follows:
For Au
•Build a variogram for the top capped Au grade in the mineralized and dilution shell
•Variable orientation (VO) function used, based on mineralized foliation surfaces, for lobe=1 to 3. Search orientation matches variogram orientation for audom=3 (15 m dilution)
•Estimate Au grade within mineralized / dilution shell (hard boundary) via OK
•Limit data to three samples per DH
•Quadrant restriction applied
For Ag, S and Te
•Build a variogram for the top capped grade in the mineralized shells
•Search orientation matches variogram orientation, no VO
•Estimate top-capped grade within mineralized shells (hard boundary) via OK
•Limit data to three samples per DH
•Quadrant restriction applied
For resource classification, see section 14.12.
14.11.3Ledbetter Underground Geometallurgical Model
The Ledbetter underground deposit has both high telluride and high silver content, distinguishing it from the other deposits (Horseshoe Underground, Palomino Underground, and Haile open pit). During 2024 and 2025, 47 samples were collected for metallurgical testing and revealed some locally depressed gold recoveries, which although not directly correlated with tellurium content, appear correlated specifically with muthmannite and calaverite telluride mineral species (see Section 13.3).
The test work looked at gold recoveries for 24 hour, 72 hour, and 96 hour leach residence times. Each incremental increase in leach residence time saw significant improvements in gold recovery. Using these test results, gold recoveries have been estimated using NN attribution into the
| | | | | | | | |
Released: March 27, 2026 | | Page 140 of 275 |
| | | | | | | | |
NI 43-101 Technical Report – Haile Gold Mine, South Carolina, United States |
| |
| |
Ledbetter Underground block model. Three recovery estimates have been included for each model block; gold recovery at 24 hour, 72 hour, and 96 hour leach residence times allowing cost benefit analysis for each leach residence scenario.
14.12Open Pit and Underground Resource Classification
Mineral Resources are classified as Indicated and Inferred in accordance with CIM guidelines. Classification of the Mineral Resources reflects the relative confidence of the grade estimates and the mineralization continuity. This classification is based primarily on the drillhole spacing, geological complexity, and in some cases, Kriging Neighborhood Analysis (KNA). No single factor controls the Mineral Resource classification. Rather, each factor influences the result. Summary of classification criteria used is shown in Table 14-14.
Table 14-14: Haile Open Pit and Underground Resource Classification Criteria
| | | | | | | | |
Type | Classification | Criteria |
OP | Measured | Blocks estimated within first pass. |
A minimum of 4 drillholes. |
Typically, 18 m x 18 m drill spacing but variable. |
Indicated | Blocks estimated within first pass and second pass. |
A minimum of 2 drillholes. |
Typically, 40 m x 40 m drill spacing but variable. |
Inferred | Blocks estimated within second and third pass. |
A minimum of 2 drillholes. |
Typically, 60 m x 60 m drill spacing but variable. |
UG | Measured | The area is defined within 15 m x 15 m drill spacing. |
Indicated | The area is guided by approx. 35 m x 35 m drill spacing, tested by kriging properties such as kriging variance, slope of regression, etc. |
Measured blocks within Metavolcanics demoted to Indicated. |
Inferred | Indicated blocks within Metavolcanics demoted to Inferred. |
Estimated blocks inside the implicit wireframes not meeting the Measured or Indicated criteria. Estimated blocks within the dilution wireframes were treated as unclassified (used to represent mining dilution). |
Source: OceanaGold, 2025
14.13Open Pit and Underground Model Validation
All open pit and underground models have undergone comprehensive validation including:
•Sample data validation
•Cross-sectional checks on composite file and block model coding from lithological wireframes, domain area, and grade shell
•Visual checks of estimated block grades (gold, sulphur, carbon and silver) on sections, plan and in 3D to ensure good correlation with underlying composite data
•Visual validation of resource classification
| | | | | | | | |
Released: March 27, 2026 | | Page 141 of 275 |
| | | | | | | | |
NI 43-101 Technical Report – Haile Gold Mine, South Carolina, United States |
| |
| |
•Swath plots X, Y, and Z comparing gold, sulphur, carbon and silver estimates with underlying composite grades
•Detailed comparisons to previous model at global and local scales (i.e., grade tonnage and curve, contained gold by benches)
•Review methodology and validation of the scripts used
Examples of gold swath comparison plots for the Open Pit, Horseshoe Underground, Ledbetter Underground and Palomino Underground Resource estimates are shown in Figure 14-8 to Figure 14-11 respectively.
Source: OceanaGold, 2025
•Green line – Block model / Red line – DH Composite
Figure 14-8 Swath Plot Open Pit (Domain 1) Block Model Grade (vol weighted) vs. 2.5 m Top Capped Composite (Declustered Weighting)
| | | | | | | | |
Released: March 27, 2026 | | Page 142 of 275 |
| | | | | | | | |
NI 43-101 Technical Report – Haile Gold Mine, South Carolina, United States |
| |
| |
Source: OceanaGold, 2025
•Dark Blue line – Block model / Light Blue line – DH Composites
Figure 14-9 Swath Plot Horseshoe UG (Domain 1) Block Model Grade (vol weighted) vs. 3 m Top Capped Composite (length Weighted)
| | | | | | | | |
Released: March 27, 2026 | | Page 143 of 275 |
| | | | | | | | |
NI 43-101 Technical Report – Haile Gold Mine, South Carolina, United States |
| |
| |
Source: OceanaGold, 2025
•Red line – Block model / Green line – DH Composites
Figure 14-10 Swath Plot Ledbetter UG (Lobe 1) Block Model Grade (vol weighted) vs. 3 m Top Capped Composite
| | | | | | | | |
Released: March 27, 2026 | | Page 144 of 275 |
| | | | | | | | |
NI 43-101 Technical Report – Haile Gold Mine, South Carolina, United States |
| |
| |
Source: OceanaGold, 2023
•Green line – OK Check Estimate Block Model / Black line – OK Final Indicator Kriged Block Model
Figure 14-11 Swath Plots Palomino UG (Easting only) Domain 1 Block Model Grade (vol. weighted) vs. 3 m Top Capped Composite (Length and Declustered Weighting)
No material flaws were identified. All Resource estimates completed after the reviews capture key recommendations where practical.
14.13.1Open Pit and Underground Model Reconciliation
Table 14-15 summarizes the Haile open pit Resource model reconciliations from 2018 to 2025.
OceanaGold’s corporate Resource model to mill reconciliation metrics are based upon Model-to-Mine Factors established by the late Harry Parker of AMEC. The associated “90/15” performance guidance for Indicated Resources was developed by Harry Parker and Christina Dohm in the 1990s. On this basis, annually, Indicated Resources are expected to be +/- 15% accuracy at a 90% confidence, that is, nine years out of ten the annual production profile must be within 15% variance of that predicted by the model.
A summary of the Haile combined open pit Resource models performance for Measured and Indicated Resources versus mill-reconciled production from 2018 to 2025 is presented in Table 14-15. Annual performance is variable but typically positive, averaging +11% tonnes, -3% grade for +8% contained gold. Although Inferred Resources are considered too low confidence to have performance metrics applied to them, their exclusion from reconciliation does introduce a positive reconciliation bias.
| | | | | | | | |
Released: March 27, 2026 | | Page 145 of 275 |
| | | | | | | | |
NI 43-101 Technical Report – Haile Gold Mine, South Carolina, United States |
| |
| |
Table 14-15: Open Pit Resource Model Reconciliation
| | | | | | | | | | | | | | | | | | | | | | | | | | | | | | | | |
Year | Open Pit Resource Model | Mine (Mill-Reconciled) | Mine / Model Factor (%) | |
Mt | Au g/t | Moz | Mt | Au g/t | Moz | Mt | Au g/t | Moz | |
2025 | 1.43 | | 2.02 | | 0.09 | | 1.63 | | 1.92 | | 0.10 | | 114 | | 95 | | 108 | | |
2024 | 2.31 | | 2.23 | | 0.17 | | 2.48 | | 2.27 | | 0.18 | | 107 | | 102 | | 109 | | |
2023 | 2.73 | | 1.91 | | 0.17 | | 2.96 | | 1.64 | | 0.16 | | 109 | | 86 | | 94 | | |
2022 | 3.39 | | 1.59 | | 0.17 | | 4.13 | | 1.75 | | 0.23 | | 122 | | 110 | | 134 | | |
2021 | 3.11 | | 2.19 | | 0.22 | | 3.29 | | 2.32 | | 0.25 | | 106 | | 106 | | 112 | | |
2020 | 2.57 | | 2.08 | | 0.17 | | 3.33 | | 1.59 | | 0.17 | | 130 | | 76 | | 99 | | |
2019 | 2.87 | | 1.96 | | 0.18 | | 3.18 | | 1.78 | | 0.18 | | 111 | | 91 | | 101 | | |
2018 | 2.85 | | 1.67 | | 0.15 | | 2.57 | | 1.93 | | 0.16 | | 90 | | 116 | | 104 | | |
Total | 21.3 | | 1.94 | | 1.32 | | 23.6 | | 1.88 | | 1.43 | | 111 | | 97 | | 108 | | |
Source: OceanaGold, 2025
•Reduced mining selectivity during 2020 led to increased mining dilution.
•3D void model built using historical cross sections, led to under-estimating gold in 2022, adjacent to historical workings.
The project to-date cumulative milled tonnage from Horseshoe is 0.98 Mt with the model to mine reconciliation at approximately -5%, +8% and +3% for tonnes, grade and ounces respectively
(see Table 14-16).
Table 14-16: Underground Resource Model Reconciliation
| | | | | | | | | | | | | | | | | | | | | | | | | | | | | | | | |
Year | Underground Resource Model | Mine (Mill-Reconciled) | Mine / Model Factor (%) | |
Mt | Au g/t | Moz | Mt | Au g/t | Moz | Mt | Au g/t | Moz | |
2025 | 0.63 | | 3.50 | | 0.07 | | 0.62 | | 3.55 | | 0.07 | | 98 | | 101 | | 99 | | |
2024 | 0.41 | | 5.05 | | 0.07 | | 0.36 | | 5.97 | | 0.07 | | 90 | | 118 | | 106 | | |
Total | 1.04 | | 4.11 | | 0.14 | | 0.98 | | 4.45 | | 0.14 | | 95 | | 108 | | 103 | | |
Source: OceanaGold, 2025
Whilst annual reconciliation fluctuations are expected to continue, both the open pit and underground Resource estimates are believed to provide an acceptable basis for medium- to long-term mine planning purposes.
14.13.2Open Pit and Underground Model Reviews
All open pit and underground Resource models are independently reviewed by OceanaGold’s Resource Development Group, based in Brisbane.
OceanaGold ensure that in addition, independent external reviews are completed for milestone Resource model updates. The most recent independent external reviews were:
•Haile Open Pit Resource Model; July 2021 by Ginto Consulting Inc.
•Horseshoe Underground Resource Model; November 2021 by SD2 Pty Ltd.
•Palomino Underground Resource Model; November 2023 by ERM International Group Ltd.
| | | | | | | | |
Released: March 27, 2026 | | Page 146 of 275 |
| | | | | | | | |
NI 43-101 Technical Report – Haile Gold Mine, South Carolina, United States |
| |
| |
•Ledbetter Underground Resource Model; September 2024 by ERM International Group Ltd.
•Ledbetter Underground Geometallurgical Model; September 2025 by ERM International Group Ltd.
| | | | | | | | |
Released: March 27, 2026 | | Page 147 of 275 |
| | | | | | | | |
NI 43-101 Technical Report – Haile Gold Mine, South Carolina, United States |
| |
| |
14.13.3Open Pit and Underground Combined Mineral Resource Statement
Table 14-17 presents the combined open pit, stockpiles, and underground Resource statement for the Haile Property.
Table 14-17: Haile Open Pit and Underground Resource Statement as of December 31, 2025
| | | | | | | | | | | | | | | | | | | | | | | | | | | | | | | | | | | | | | |
Gold | Measured | Indicated | Measured & Indicated | Inferred |
Tonnes
(Mt) | Au (g/t) | Contained Ozs (Moz) | Tonnes
(Mt) | Au (g/t) | Contained Oz (Moz) | Tonnes (Mt) | Au (g/t) | Contained Oz (Moz) | Tonnes
(Mt) | Au (g/t) | Contained Ozs (Moz) |
Haile |
Horseshoe Underground | 1.98 | | 5.11 | | 0.33 | | 2.76 | | 5.11 | | 0.45 | | 4.74 | | 5.11 | | 0.78 | | 0.5 | | 2.7 | | 0.0 | |
Palomino Underground | . | . | . | 4.19 | | 3.38 | | 0.45 | | 4.19 | | 3.38 | | 0.45 | | 0.8 | | 2.5 | | 0.1 | |
Ledbetter Underground | . | . | . | 4.07 | | 4.12 | | 0.54 | | 4.07 | | 4.12 | | 0.54 | | 1.2 | | 2.9 | | 0.1 | |
Open Pits | 2.58 | | 1.21 | | 0.10 | | 16.1 | | 1.64 | | 0.85 | | 18.7 | | 1.58 | | 0.95 | | 0.6 | | 0.9 | | 0.0 | |
Haile Total | 4.56 | | 2.91 | | 0.43 | | 27.1 | | 2.63 | | 2.30 | | 31.7 | | 2.67 | | 2.72 | | 3.1 | | 2.4 | | 0.2 | |
Silver | Measured | Indicated | Measured & Indicated | Inferred |
Tonnes (Mt) | Ag (g/t) | Contained Ozs (Moz) | Tonnes (Mt) | Ag (g/t) | Contained Ozs (Moz) | Tonnes (Mt) | Ag (g/t) | Contained Ozs (Moz) | Tonnes (Mt) | Ag (g/t) | Contained Ozs (Moz) |
Haile |
Horseshoe Underground | 1.98 | | 1.9 | | 0.1 | | 2.8 | | 2.1 | | 0.2 | | 4.7 | | 2.0 | | 0.3 | | 0.5 | | 1.0 | | 0.0 | |
Palomino Underground | . | . | . | 4.2 | | 2.8 | | 0.4 | | 4.2 | | 2.8 | | 0.4 | | 0.8 | | 2.1 | | 0.1 | |
Ledbetter Underground | . | . | . | 4.1 | | 12 | | 1.6 | | 4.1 | | 12 | | 1.6 | | 1.2 | | 7.5 | | 0.3 | |
Open Pits | 2.58 | | 2.2 | | 0.2 | | 16 .1 | 2.5 | | 1.3 | | 18.7 | | 2.5 | | 1.5 | | 0.6 | | 2.4 | | 0.0 | |
Haile Total | 4.56 | | 2.0 | | 0.3 | | 27.1 | | 4.0 | | 3.5 | | 31.7 | | 3.7 | | 3.8 | | 3.1 | | 4.0 | | 0.4 | |
Source: OceanaGold, 2025
•Mineral Resources are reported inclusive of Mineral Reserves and are reported on an in situ basis. Mineral Resources that are not Mineral Reserves do not have demonstrated economic viability.
•All Mineral Resources are based on metal prices of US$ (United States Dollar) 2,450/oz gold, US$4.50/lb copper and US$28.50/oz silver.
•It is reasonably expected that most of the Inferred Mineral Resources could be upgraded to Indicated Mineral Resources with continued exploration.
•Open Pit Mineral Resources reported within the Mineral Reserve design pit.
•Open Pit primary cut-off grade (CoG) is 0.50 g/t Au, while oxide CoG is 0.60 g/t Au.
•Underground Mineral Resources are reported within volumes guided by conceptual stope designs which are based upon economic assumptions above and exclude dilution.
•Horseshoe, Ledbetter, and Palomino Underground Mineral Resources at 1.70 g/t Au cut-off.
•All figures are rounded to reflect the relative accuracy and confidence of the estimates and totals may not add correctly.
•The Mineral Resources for the open pits and Horseshoe Underground were estimated under the supervision of Jonathan Moore, MAusIMM CP(Geo) of OceanaGold, a Qualified Person. The Mineral Resources for Palomino Underground and Ledbetter Underground were estimated under the supervision of Douglas Corley, MAIG RPGeo, a QP.
| | | | | | | | |
Released: March 27, 2026 | | Page 148 of 275 |
| | | | | | | | |
NI 43-101 Technical Report – Haile Gold Mine, South Carolina, United States |
| |
| |
14.14Relevant Factors
OceanaGold knows of no existing environmental, permitting, legal, socio-economic, marketing, political, or other factors that might materially affect the Mineral Resource estimate.
| | | | | | | | |
Released: March 27, 2026 | | Page 149 of 275 |
| | | | | | | | |
NI 43-101 Technical Report – Haile Gold Mine, South Carolina, United States |
| |
| |
15 Mineral Reserve Estimates
Separate Mineral Reserve estimates were generated for the open pit and underground mines. A combined Mineral Reserve statement is provided in Section 15.3. The open pit and underground mining areas are located entirely on land owned by HGM. There are no royalties.
The open pit and underground work were completed using the site coordinate system. This is based on UTM NAD83 zone 17N with a plus 1,000 m adjustment to elevation.
15.1Open Pit Mineral Reserve Estimate
15.1.1Introduction
Open pit LoM plans and resulting open pit Mineral Reserves are determined based on a gold price of US$2,200/oz Au and silver price of US$25/Oz Ag. Reserves stated in this report are dated effective as of December 31, 2025.
The ore material is converted from Mineral Resource to Mineral Reserve based primarily on positive cash flow, pit optimization results, pit design, and geological classification of Measured and Indicated resources. The in situ value is derived from the estimated grade and certain modifying factors.
The open pit reserve consists of several pit areas. Mineralized material is hauled from the pits to an existing crusher / processing facility or stockpiles for later rehandling. Overburden is categorized, and truck hauled to the appropriate OSA
15.1.2Conversion Assumptions, Parameters and Methods
Dilution and ore recovery have been applied to the Resource block model to account for a portion of mineralized material that is expected to be mined by face shovel excavators. The Resource block model was then used for open pit optimization without further modification, as the block size in the model matched the SMU size of 10 m x 10 m x 5 m. This block size is currently considered appropriate for the backhoe excavator loading units operating at Haile, and the impact of applying further dilution due to the use of the shovel for the upper benches has limited further impact, with an effective global adjustment of less than 2% to dilution and mining recovery. The main impact of the dilution and mining recovery is in scheduling and is discussed further in Section 16.1.6.
The open pit Mineral Reserves are reported within a pit design based on open pit optimization results (Lerchs-Grossmann algorithm). The optimization included Measured, Indicated and Inferred Mineral Resource categories with a gold price of US$2,200/oz Au and silver price of US$25/oz Ag. Subsequent to pit optimization, inferred material (approximately 10% by volume) within the reserve pit was treated as waste and given a zero-gold grade. WhittleTM optimization parameters were derived by OceanaGold and are shown in Table 15-1. The overall pit slopes (inter-ramp angle slopes) used for the design are based on operational level geotechnical studies and range from 30° to 45°. This includes a 5° allowance for ramps and geotechnical catch benches.
| | | | | | | | |
Released: March 27, 2026 | | Page 150 of 275 |
| | | | | | | | |
NI 43-101 Technical Report – Haile Gold Mine, South Carolina, United States |
| |
| |
Table 15-1: Pit Optimization Parameters
| | | | | | | | | | | |
Parameter | Unit | Value | |
Mining | |
Base Mining Cost | US$/t mined | 3.83 | |
Drill and Blast(1) | US$/t mined | 1.16 | |
Sustaining CapEx | US$/t mined | 0.32 | |
Incremental Mining Cost | US$/t mined / 5 m bench | 0.02 | |
Pit Exit | m RL | 1140 | |
PAG Rehabilitation Cost | US$/t mined PAG waste | 0.65 | |
Processing/Ore Costs | |
Ore Mining Premium | US$/t ore | 0.37 | |
Processing Cost | US$/t ore | 21.41 | |
G&A Cost | US$/t ore | 10.73 | |
Ore Rehandle Cost | US$/t ore | 2.50 | |
TSF Expansion | US$/t ore | 1.84 | |
Gold Recovery - Primary (2) | % | (1-(0.2152*Au grade^-0.3696)) | |
Gold Recovery – Oxide | % | 67% | |
Silver Recovery | % | 70% | |
Economic Inputs | |
Gold Price | US$/oz Au | 2,200 | |
Silver Price | US$/oz Ag | 25 | |
Gold Refining & Selling Cost | US$/oz Au | 3 | |
Calculated Au Cut-off Grade | US$/t | 0.6 | |
Royalties | % | 0 | |
Source: OceanaGold, 2025
(1) Drill and Blast costs applied by rock-type as required
(2) Recovery equation has further 2.5% uplift added to recovery of material > 1.7 g/t Au
A 3D mine design, based on the selected WhittleTM pit, was completed using VulcanTM software and is the basis for the open pit Reserves. Some material that was identified in the open pit optimization as potentially economically viable by open pit mining (Ledbetter Phase 4) has been redesignated as Underground Mineral Reserve (Ledbetter Underground) resulting from an economic trade off study.
Details for the trade-off study, mine design, and subsequent scheduling are detailed in Section 16.
15.1.3Reserve Estimate
Mineral Reserves were classified using the 2014 CIM Definition standards. Measured Mineral Resources were converted to Proven Mineral Reserves, and Indicated Mineral Resources were converted to Probable Mineral Reserves by applying the appropriate modifying factors, as described herein, to mining pit shapes created during the mine design process.
The open pit mine design process results in open pit mining reserves of 18.6 Mt with an average gold grade of 1.57 g/t and silver grade of 2.2 g/t. The Mineral Reserve statement, as of December 31, 2025, for the Haile Open Pit is presented in Table 15-2.
| | | | | | | | |
Released: March 27, 2026 | | Page 151 of 275 |
| | | | | | | | |
NI 43-101 Technical Report – Haile Gold Mine, South Carolina, United States |
| |
| |
Table 15-2: Haile Open Pit Mineral Reserves Estimate as of December 31, 2025
| | | | | | | | | | | | | | | | | | | | | | | | | | | | | |
Gold | Proven (1) | Probable | Proven & Probable |
Tonnes (Mt) | Au
(g/t) | Contained Ozs (Moz) | Tonnes (Mt) | Au
(g/t) | Contained Ozs (Moz) | Tonnes (Mt) | Au
(g/t) | Contained Ozs (Moz) |
Haile |
Open Pits | 2.47 | | 1.23 | | 0.10 | | 16.1 | | 1.62 | | 0.84 | | 18.6 | | 1.57 | | 0.94 | |
Haile OP Total | 2.47 | | 1.23 | | 0.10 | | 16.1 | | 1.62 | | 0.84 | | 18.6 | | 1.57 | | 0.94 | |
Silver | Proven (1) | Probable | Proven & Probable |
Tonnes (Mt) | Ag
(g/t) | Contained Oz (Moz) | Tonnes (Mt) | Ag
(g/t) | Contained Oz (Moz) | Tonnes (Mt) | Ag
(g/t) | Contained Oz (Moz) |
Haile |
Open Pits | 2.47 | | 2.1 | | 0.2 | | 16.1 | | 2.3 | | 1.2 | | 18.6 | | 2.2 | | 1.3 | |
Haile OP Total | 2.47 | | 2.1 | | 0.2 | | 16.1 | | 2.3 | | 1.2 | | 18.6 | | 2.2 | | 1.3 | |
Source: OceanaGold, 2025
(1) Includes 0.8 Mt of stockpile material grading 1.0 g/t Au and 1.0 g/t Ag
•Reserves are based on a US$2,200/oz Au gold price and US$25/oz Ag silver price.
•Open pit reserves are stated using a 0.5 g/t Au cut-off for primary and 0.6 g/t Au cut-off for oxide material.
•Open pit reserves include variable dilution and mining recovery that has been applied in the mine schedule to the upper benches of each pit stage to account for assumed mining by face shovel excavator in these areas.
•Metallurgical recoveries for gold are based on a recovery curve for primary material of (1-(0.2152*Au grade^-0.3696)). with +2.5% uplift applied to material > 1.7 g/t Au. Recovery for oxide material is applied at 67%.
•Metallurgical recovery for silver is applied at 70%.
•Reserves are converted from resources through the process of pit optimization, pit design, production schedule and supported by a positive cash flow model.
•All figures are rounded to reflect the relative accuracy of the estimates. Totals may not sum due to rounding.
•The open pit Mineral Reserves were estimated under the supervision of Gregory Hollett of OceanaGold, a Qualified Person.
Relevant Factors
Technical risks to the Mineral Reserve have been reviewed and there are two relevant risk areas that have been identified.
A geotechnical risk associated with the south wall of Ledbetter Phase 3 is currently under evaluation and management due to a localized area of instability. Management plans are in the process of being developed for remediation of this area, which will potentially impact the short-term mine schedule and costs. However, this will have relatively minor impact on the long-term mine plan. Therefore, this is not considered to be a material risk to the Mineral Reserve.
The depleted Mill Zone open pit is currently being used for excess water storage. This has the potential to limit access to the Haile Phase 2 open pit, due to the planned mining of the saddle between Haile Phase 1 and Mill Zone. Management plans are in place to remove the water in Mill Zone prior to the planned schedule for mining Haile Phase 2 and is therefore not considered to be a material risk to the Mineral Reserve.
OceanaGold knows of no existing environmental, permitting, legal, socio-economic, marketing, political, or other factors that might materially affect the open pit Mineral Reserve estimate.
| | | | | | | | |
Released: March 27, 2026 | | Page 152 of 275 |
| | | | | | | | |
NI 43-101 Technical Report – Haile Gold Mine, South Carolina, United States |
| |
| |
15.2Underground Mineral Reserve Estimate
15.2.1Introduction
Underground LoM plans and resulting underground Mineral Reserves are determined based on a gold price of US$2,200/oz Au and silver price of US$25/oz Ag. Reserves stated in this report are dated effective as of December 31, 2025.
The ore material is converted from Mineral Resource to Mineral Reserve based primarily on positive cash flow, stope shape optimization results, and geological classification of Measured and Indicated resources. The in situ value is derived from the estimated grade and certain modifying factors.
Mineral Resources extend below and outside of the existing open pit mine. A portion of these Mineral Resources will not be mined by the ultimate pit shell that is described in this report and therefore have been evaluated for potential underground mining. The Mineral Resource areas evaluated for underground mining are referred to as “Horseshoe”, “Ledbetter”, and “Palomino”. Horseshoe is located to the northeast of the Snake Pit, Ledbetter is to the northwest of Ledbetter Pit and Palomino is to the southwest of Snake Pit, as shown in Figure 15-1.
Source: OceanaGold, 2025
Figure 15-1: General Site Layout and Location of the UG Reserve Area (in blue)
| | | | | | | | |
Released: March 27, 2026 | | Page 153 of 275 |
| | | | | | | | |
NI 43-101 Technical Report – Haile Gold Mine, South Carolina, United States |
| |
| |
15.2.2Conversion Assumptions, Parameters and Methods
Measured and Indicated Mineral Resources were converted to Proven and Probable Mineral Reserves by applying the appropriate modifying factors, as described herein, to potential mining block shapes created during the mine design process.
Based on the orientation, depth, and geotechnical characteristics of mineralization, a transverse sublevel open stoping method (long hole) with ramp access is used. The stopes will be 15 m and 20 m wide at HUG, 10 m and 15 m wide at LUG and 15 m wide at PUG. The stope strike length will vary based on mineralization grade and geotechnical considerations. A spacing of 25 m between levels is used. CRF and URF will be used to backfill the stopes. The CRF will have sufficient strength to allow for mining adjacent to backfilled stopes.
A detailed design was completed including re-mucks, passing bays, etc. All Mineral Reserve tonnages are expressed as "dry” tonnes (i.e., no moisture) and are based on the density values stored in the block model. Inferred Mineral Resources are not included in the mine plan. Any inferred material in mining shapes has been assigned zero grade for both Au and Ag and is treated as dilution. Mining dilution and recovery have been applied to the reserves using the methodologies described in the following sections.
Dilution
The mining dilution estimate is based on the equivalent linear overbreak / slough) (ELOS) methodology (Clark and Pakalnis, 1997). ELOS is an empirical design method that is used to estimate the amount of overbreak / slough that will occur in an underground opening based on rock quality and the hydraulic radius of the opening.
Dilution estimates were applied differently for primary and secondary stopes as follows.
For a typical primary stope, the sources of dilution are in the floor (CRF backfill) and in the front endwall of the stope (CRF backfill). Dilution from the sidewalls and the back endwall is not included, as this material is typically ore and is already accounted for within the volumes of adjacent secondary stopes. For a typical secondary stope, the sources of dilution are in the floor (CRF backfill), in the front endwall of the stope (CRF backfill), and in the sidewalls of the stope (CRF backfill). ELOS assumptions are shown in Table 15-3.
Table 15-3: Dilution ELOS Assumptions
| | | | | | | | |
Type | ELOS Value
(m) | |
Sidewalls (rock) | 0.50 | |
Sidewalls (backfill) | 0.25 | |
Endwalls (rock and backfill) | 0.15 | |
Bottom (backfill) | 0.05 | |
Source: OceanaGold, 2025
The rock sidewall / endwall dilution material will contain low grade mineralization. However, a conservative approach was adopted by applying zero grade to all rock dilution. Zero grade for both Au and Ag was applied to CRF backfill dilution. The ELOS and additional dilution factor for the sill
| | | | | | | | |
Released: March 27, 2026 | | Page 154 of 275 |
| | | | | | | | |
NI 43-101 Technical Report – Haile Gold Mine, South Carolina, United States |
| |
| |
stopes results in the dilution factors shown in Table 15-4. These factors were conservatively applied uniformly across each stope type.
Table 15-4: Mine Design Dilution Factors
| | | | | | | | |
Stope Type | Dilution Applied (at Zero Grade) (%) | |
Primary Stopes | 10 | |
Secondary Stopes | 10 | |
Source: OceanaGold, 2025
For all horizontal development, dilution of 15% was applied at zero grade both Au and Ag.
Recovery
A stope recovery factor of 94% was used. The following items were used to calculate this factor:
•Material loss into backfill (floor) of 0.25 m
•Material loss to side and endwalls (under blast) of 0.15 m
•Material loss from leaving wing-shaped pillars in stope crowns (for stope stability and to enable tight-filling of stopes)
•Material loss to mucking along the sides and in blind corners of the stopes
•Additional loss factor due to rockfalls, misdirected loads, and other geotechnical reasons
A development recovery factor of 100% was used for all horizontal development. Recoveries of the temporary sill levels have been reduced by 25%, to reflect room and pillar mining of the sill pillars.
15.2.3Reserve Estimate
Mineral Reserves were classified using the 2014 CIM Definition standards. Measured Mineral Resources were converted to Proven Mineral Reserves, and Indicated Mineral Resources were converted to Probable Mineral Reserves by applying the appropriate modifying factors, as described herein, to potential mining shapes created during the mine design process.
The overall underground mining reserves of 11.8 Mt (diluted) with an average grade of 3.57 g/t Au are presented in the Table 15-5.
| | | | | | | | |
Released: March 27, 2026 | | Page 155 of 275 |
| | | | | | | | |
NI 43-101 Technical Report – Haile Gold Mine, South Carolina, United States |
| |
| |
Table 15-5: Haile Underground Reserves Estimate as of December 31, 2025
| | | | | | | | | | | | | | | | | | | | | | | | | | | | | | | | |
Gold | Proven | Probable | Proven & Probable | |
Tonnes (Mt) | Au
(g/t) | Contained Ozs (Moz) | Tonnes (Mt) | Au
(g/t) | Contained Ozs (Moz) | Tonnes (Mt) | Au
(g/t) | Contained Ozs (Moz) | |
Haile | |
Horseshoe Underground | 1.52 | | 4.39 | | 0.21 | | 2.63 | | 4.24 | | 0.36 | | 4.14 | | 4.29 | | 0.57 | | |
Palomino Underground | - | | - | | - | | 3.62 | | 2.96 | | 0.34 | | 3.62 | | 2.96 | | 0.34 | | |
Ledbetter Underground | - | | - | | - | | 4.00 | | 3.39 | | 0.44 | | 4.00 | | 3.39 | | 0.44 | | |
Haile UG Total | 1.52 | | 4.39 | | 0.21 | | 10.2 | | 3.45 | | 1.14 | | 11.8 | | 3.57 | | 1.35 | | |
Silver | Proven | Probable | Proven & Probable | |
Tonnes (Mt) | Ag
(g/t) | Contained Ozs (Moz) | Tonnes (Mt) | Ag
(g/t) | Contained Ozs (Moz) | Tonnes (Mt) | Ag
(g/t) | Contained Ozs (Moz) | |
Haile | |
Horseshoe Underground | 1.52 | | 1.5 | | 0.1 | | 2.6 | | 1.8 | | 0.2 | | 4.1 | | 1.7 | | 0.2 | | |
Palomino Underground | - | | - | | - | | 3.6 | | 2.7 | | 0.3 | | 3.6 | | 2.7 | | 0.3 | | |
Ledbetter Underground | - | | - | | - | | 4.0 | | 11 | | 1.3 | | 4.0 | | 11 | | 1.3 | | |
Haile UG Total | 1.52 | | 1.5 | | 0.1 | | 10.2 | | 5.5 | | 1.8 | | 11.8 | | 5.0 | | 1.9 | | |
Source: OceanaGold, 2025
•Reserves are based on a gold price of US$2,200/oz.
•Metallurgical recoveries for gold for Horseshoe and Palomino are based on a recovery curve for primary material of (1-(0.2152*Au grade^-0.3696)). with +2.5% uplift applied to material > 1.7 g/t Au. Metallurgical recoveries for Ledbetter Underground are based on a geometallurgical model that correlates recovery with gold mineralogical association.
•The reserve estimate is based on a mine design using an elevated cut-off grade of 1.86 Au g/t, with adjacent lower grade stopes included in the design. Incremental material is included in the reserves based on an incremental stope cut-off grade of 1.74 g/t Au and an incremental development cut-off grade of 0.59 g/t Au.
•Mining recovery ranges from 94% to 100% depending on activity type. Sill levels use a 75% recovery. Mining dilution is applied using zero grade. The dilution ranges from 2% to 10% depending on activity type.
•All figures are rounded to reflect the relative accuracy of the estimates. Totals may not sum due to rounding.
•Mineral Reserves have been stated on the basis of a mine design, mine plan, and cash-flow model.
•The Mineral Reserves were estimated by Brianna Drury of OceanaGold, a Qualified Person.
Relevant Factors
OceanaGold knows of no existing environmental, permitting, legal, socio-economic, marketing, political, or other factors that might materially affect the open pit Mineral Reserve estimate.
15.3Open Pit and Underground Combined Reserves Statement
Table 15-6 presents the combined open pit and underground Mineral Reserves statement for Haile.
| | | | | | | | |
Released: March 27, 2026 | | Page 156 of 275 |
| | | | | | | | |
NI 43-101 Technical Report – Haile Gold Mine, South Carolina, United States |
| |
| |
Table 15-6: Combined Reserve Statement for OceanaGold’s Haile Gold Mine as of December 31, 2025
| | | | | | | | | | | | | | | | | | | | | | | | | | | | | |
Gold | Proven (1) | Probable | Proven & Probable |
Tonnes
(Mt) | Au
(g/t) | Contained Ozs (Moz) | Tonnes (Mt) | Au
(g/t) | Contained Ozs (Moz) | Tonnes (Mt) | Au
(g/t) | Contained Ozs (Moz) |
Haile |
Underground | 1.52 | | 4.39 | | 0.21 | | 10.2 | | 3.45 | | 1.14 | | 11.8 | | 3.57 | | 1.35 | |
Open Pits | 2.47 | | 1.23 | | 0.1 | | 16.1 | | 1.62 | | 0.84 | | 18.6 | | 1.57 | | 0.94 | |
Haile Total | 3.99 | | 2.43 | | 0.31 | | 26.3 | | 2.33 | | 1.98 | | 30.3 | | 2.35 | | 2.29 | |
Silver | Proven (1) | Probable | Proven & Probable |
Tonnes
(Mt) | Ag
(g/t) | Contained Ozs (Moz) | Tonnes (Mt) | Ag
(g/t) | Contained Ozs (Moz) | Tonnes (Mt) | Ag
(g/t) | Contained Ozs (Moz) |
Haile |
Underground | 1.52 | | 1.5 | | 0.1 | | 10.2 | | 5.5 | | 1.8 | | 11.8 | | 5.0 | | 1.9 | |
Open Pits | 2.47 | | 2.1 | | 0.2 | | 16.1 | | 2.3 | | 1.2 | | 18.6 | | 2.2 | | 1.3 | |
Haile Total | 3.99 | | 1.9 | | 0.2 | | 26.3 | | 3.5 | | 3.0 | | 30.3 | | 3.3 | | 3.2 | |
Source: OceanaGold
(1) Includes 0.8 Mt of stockpile material grading 1.0 g/t Au and 1.0 g/t Ag
•Mineral Reserves are based on a gold price of US$ 2,200/oz Au and silver price of US$25/oz Ag.
•Metallurgical recoveries are based on a recovery curve for primary material of (1-(0.2152*Au grade^-0.3696)) with +0.025 uplift applied to material > 1.7 g/t Au. Recovery for oxide material is applied at 67%.
•Metallurgical recoveries for Ledbetter Underground are based on a geometallurgical model that correlates recovery with gold mineralogical association.
•Overall metallurgical recovery for gold equates to 82.7%
•Metallurgical recovery for silver is applied at 70%.
•Open pit reserves are stated using a 0.5 g/t Au cut-off for primary and 0.6 g/t Au cut-off for oxide material. Open pit reserves include variable dilution and mining recovery that has been applied in the mine schedule to the upper benches of each pit stage to account for assumed mining by face shovel excavator in these areas.
•Underground reserves are based on a mine design using an elevated cut-off grade of 1.86 Au g/t, with adjacent lower grade stopes included in the design. Incremental material is included in the reserves based on an incremental stope cut-off grade of 1.74 g/t Au and an incremental development cut-off grade of 0.59 g/t Au. Mining recovery ranges from 94% to 100% depending on activity type. Sill levels use a 75% recovery. Mining dilution is applied using zero grade. The dilution ranges from 2% to 10% depending on activity type.
•All figures are rounded to reflect the relative accuracy of the estimates. Totals may not sum due to rounding.
•Mineral Reserves have been stated on the basis of a mine design, mine plan, and supported by a positive cash-flow model.
•The open pit Mineral Reserves were estimated under the supervision of Gregory Hollett of OceanaGold, a Qualified Person. The underground Mineral Reserves were estimated by Brianna Drury of OceanaGold, a Qualified Person.
| | | | | | | | |
Released: March 27, 2026 | | Page 157 of 275 |
| | | | | | | | |
NI 43-101 Technical Report – Haile Gold Mine, South Carolina, United States |
| |
| |
16 Mining Methods
Both open pit and underground mining methods will be used at Haile. As such, the following sections describe the open-pit and underground mining methods separately. A combined open pit and underground production schedule is provided in Section 16.3.
16.1Open Pit Mining Methods
HGM staff completed the mine planning for the Haile open pit operations. The mine plans are valid from December 31, 2025, and are based on a projected end of year 2025 topographical surface dated December 5, 2025. The mine plan is intended to provide a practical approach to extracting the potential reserves from open pit operations and integrating both the Horseshoe, Palomino, and Ledbetter underground mines into the Haile life-of-mine plan.
The primary pit names referenced in the sections to follow are based on historical naming conventions when many of the smaller gold pits did not merge into the large Haile open pit described in this report. As such, phases have been named to replicate the historical pit areas. Figure 16-1 illustrates the pit area names of the remaining pit phases.
Source: OceanaGold, 2025
Figure 16-1: Haile Open Pit Naming Convention
16.1.1Current or Proposed Mining Methods
Haile is currently being mined using conventional truck-and-shovel open pit methods, which is planned to continue until the end of the open pit mine life.
| | | | | | | | |
Released: March 27, 2026 | | Page 158 of 275 |
| | | | | | | | |
NI 43-101 Technical Report – Haile Gold Mine, South Carolina, United States |
| |
| |
The material encountered at Haile is a combination of soft (CPS and Sap) and hard (MV and MS) rock units. CPS is loosely consolidated sand which can be mined without the need for drilling and blasting. CPS is unmineralized and classified as non-acid generation and does not require drilling for the purposes of ore control and overburden classification. Sap is drilled and sampled for overburden classification to meet the requirements in Haile’s Overburden Management Plan (OMP) and only blasted when necessary.
Drilling and blasting are required in all hard rock. Drilling and blasting are performed on 10 m benches using multiple bit sizes (127 mm and 171 mm) depending on material type, hardness, and application. Blasthole depth is 10 m plus subdrill ranging from 0.8 m to 1.2 m.
The number of samples taken per blasthole is material-type dependent. Blastholes in waste are typically sampled once on a 10 m interval for Non-PAG / PAG definition. Blastholes in ore are typically sampled three times at 3.3 m sample intervals.
Flitch height is variable. Waste is typically mined on a 10 m flitch and ore is typically mined on a
3.3 m flitch. Ore is usually mined with hydraulic excavators, while the majority of waste is mined with hydraulic face shovels. Front-end loaders may be used in either application in back-up capacity. The haul truck fleet is primarily 175 tonne payload units with smaller 140 tonne payload units used for ancillary duties, rehandle, and backup production.
16.1.2Geotechnical
The Interramp Slope Angle (ISA) recommendations presented in Table 16-1 through Table 16-5 are based on a slope stability study performed by Call & Nicholas, Inc. (2022) for Haile Gold Mine. The design acceptance criteria (DAC) for the ISA recommendations are a minimum Factor of Safety (FoS) of 1.20 for overall slopes, an 80% catch bench width reliability for 10 m high single benches, or a 90% catch bench width reliability for 20 m high double benches. Catch bench scale structural evaluations were performed using CNI’s probabilistic bench-scale analytical method (Backbreak), while the FoS for overall slopes were based on two-dimensional (2D) limit equilibrium analyses. The ISA recommendations are the highest achievable angles that meet all DAC’s.
Data used for the 2022 study included the following:
•2021 LoM Pit design (LTP21A_13_CP_01_V03_TOPO.00t)
•3D geology block model based on drilling and pit mapping (developed by HGM)
•3D geotechnical rock type (GTRCK) block model developed by CNI
•RQD Data from 967 drillholes (330,000 m)
•3D RQD block model developed by CNI
•Structure data from 52 cells mapped within the Mill Zone pit between the 1070 and 1125 mine levels
•Structure data from 11 televiewer drillholes
•Structure data from eight oriented core holes
•A total of 20 small scale direct shear test performed on four different rock types
•91 disc tension test performed on three different rock types
•20 uniaxial compression tests performed on three different rock types
•44 triaxial compression tests performed on three different rock types
•Slope Angle Evaluation for the Haile Gold Mine (CNI 2018)
•2021 Mill Zone Design Review
•2017 pit slope study performed by BGC Engineering Inc. (BGC)
| | | | | | | | |
Released: March 27, 2026 | | Page 159 of 275 |
| | | | | | | | |
NI 43-101 Technical Report – Haile Gold Mine, South Carolina, United States |
| |
| |
•An interpreted 3D phreatic surface for the project area (weathered Water Levels_EOM_Feb2018_linear.dxf)
The GTRCK block model consists of twelve geomechanical groups, based on geology, RQD, and material properties:
•Coastal Plain Sands
•Sericite
•Saprolite
•Metasediments:
oRQD ≤ 30%
o30% < RQD ≤ 60%
o60% < RQD
•Metavolcanics:
oRQD ≤ 30%
o30% < RQD ≤ 60%
o60% < RQD
•Diabase dikes:
oRQD ≤ 30%
o30% < RQD ≤ 60%
o60% < RQD
Material properties used in this analysis were derived from a combination of laboratory testing, statistical regression, and RQD data, or were previously reported during earlier studies. Without additional laboratory testing available for the CPS and saprolite units, CNI used strength properties reported in the Haile Gold Mine Optimization Study – Open Pit Slope Designs report by BGC Engineering Inc. from July 2017. The material properties for the sericite unit (actually, a low plasticity silt), were derived from small scale direct shear test.
Linear rock mass (RM) properties were calculated for the metasediment, metavolcanic, and diabase rock types based on three RQD ranges: RQD ≤ 30%, 30% < RQD ≤ 60%, and 60% < RQD. The RQD ≤30% unit roughly correlates to the “Weathered” category from earlier studies, while the 30% <RQD ≤60% unit represents a transition zone between the “Weathered” and the higher RQD (60%<) “Fresh” materiel from the previous studies.
The shear strength of a rock mass is weakest along discontinuities. The orientation of discontinuities therefore defines the critical direction of any shear strength anisotropy. At Haile, this direction is parallel to foliation within the MS and MV and to a lesser extent, parallel to cross joint orientations. Anisotropic rock mass strengths were used for both the MS and MV rock types in the slope stability analysis. The rock mass properties are presented in Table 16-6.
The main geologic structures identified in the Project area are:
•Regional northwest-dipping foliation, best developed in the metasedimentary rocks
•Southeast (cross joints) and southwest-dipping joints
•Sub-vertical or steeply dipping joints parallel to the north-northwest-striking diabase dikes
•Regional faults dipping northwest
| | | | | | | | |
Released: March 27, 2026 | | Page 160 of 275 |
| | | | | | | | |
NI 43-101 Technical Report – Haile Gold Mine, South Carolina, United States |
| |
| |
For the probabilistic backbreak analysis, the property was separated into four geologic domains based on rock strength and structural orientation data. Due to spatial variations in the structure data, the Mill Zone Pit was separated from the other pits. These two spatial domains were each divided into two additional domains based on rock type. Within each of the four geologic domains, twelve design sectors were defined based on wall orientations and locations of ramps. All design sectors in each domain were evaluated for both single and double catch bench performance to identify the optimal bench design parameters that meet the reliability criteria. The backbreak analysis is based on the use of controlled blasting. If controlled blasting is not possible, the ISA design parameters will need to be adjusted.
Two-dimensional limit-equilibrium analyses were performed on 11 critical sections by CNI, three in the Mill Zone pit, five in the Ledbetter pit, two in the Snake pit, and one in the Haile pit. Rocscience’s Slide© limit equilibrium software (LEQ) was utilized to calculate the lowest overall slip surface FoS for each analysis section.
FEFLOW (v. 7.4) was used to simulate pore pressure distributions for input into the eight limit-equilibrium cross sections analyzed in the Haile, Snake, and Ledbetter pits. To constrain the pore pressure distributions, the 2018 phreatic surface provided by Haile was used to establish boundary conditions for the FEFLOW analyses. For the Mill Zone pit, depressurization of the pit slopes was conservatively estimated by constructing a phreatic surface 10 m horizontally behind the pit slope face from the pit bottom up to the elevation of the regional phreatic surface. In some areas where the regional water level is high and significant slope heights of saprolite and CPS exist, additional depressurization is needed. The ISA recommendations require depressurizing the Sap and CPS portions of the pits to 25 m horizontally behind the pit slope for all areas where the Sap slope height is 50 m or less. Depressurization requirements increase to 40 m behind the pit slopes for Sap slope heights greater than 50 m and less than 110 m. If any future design options expose saprolite slope heights in excess of 110 m, additional depressurization will be required. Assuming all depressurization is achieved, all sections analyzed meet or exceed the minimum design criteria of FoS ≥1.2.
CNI recommends the following future work as HGM continues to optimize their mine plans:
•Update overall stability analysis if future mine plans are significantly modified to verify changes in slope geometry, geology, and wall orientations still meet design criteria
•Additional cell mapping to expand the rock fabric database – this data is required to optimize the bench designs and determine if areas that do not achieve the design reliabilities are caused by structural conditions or by non-optimal blasting and excavation practices
•Continued geologic mapping is required to identify major fault structures that could impact the Haile Gold Mine design. A geologic model of the major fault structures should be continually updated for the Project area. Modifications to the design may be required if adverse fault structures are identified. Continue auditing constructed benches to determine if the design is being achieved satisfactorily – Lidar scans or aerial drone surveys of the excavated benches can be used to provide the data needed to perform the audit.
Slope parameter recommendations for the open pits are shown in Table 16-1 through Table 16-5.
| | | | | | | | |
Released: March 27, 2026 | | Page 161 of 275 |
| | | | | | | | |
NI 43-101 Technical Report – Haile Gold Mine, South Carolina, United States |
| |
| |
Table 16-1: ISA Recommendations for Near Surface Materials
| | | | | | | | | | | | | | | | | | | | |
Material Type | ISA (°) | Height (m) | BFA (°) | CBW (m) | Maximum Slope Height (m) | Comment |
CPS and “Sericite” | 30 | | 5 | | 50 | | 4.5 | | 15 | | |
Saprolite - 1 | 35 | | 5 | | 63 | | 4.6 | | 50 | | Requires depressurization a minimum of 25 m behind face |
Saprolite - 2 | 32 | | 5 | | 63 | | 5.5 | | 110 | | Requires depressurization a minimum of 40 m behind face |
Source: Call & Nicholas Inc., 2022
Table 16-2: Mill Zone ISA Recommendations for Metasediments and Diabase Dikes
| | | | | | | | | | | | | | | | | | | | | | | | | | | | | |
Range of Wall DDR (°) | Metasediments / Diabase Dikes - Bench Design | |
ISA (°) | Height (m) | BFA (°) | CBW (m) | ISA (°) | Height (m) | BFA (°) | CBW (m) | |
355 - 025 | 42 | 10 | 78 | 9 | 20 m Bench Heights not Recommended | |
025 - 055 | 48 | 10 | 78 | 6.9 | 50 | 20 | 78 | 12.5 | |
055 - 085 | 48 | 10 | 78 | 6.9 | 50 | 20 | 78 | 12.5 | |
085 - 115 | 48 | 10 | 78 | 6.9 | 50 | 20 | 78 | 12.5 | |
115 - 145 | 46 | 10 | 78 | 7.5 | 48 | 20 | 78 | 13.8 | |
145 - 175 | 45 | 10 | 78 | 7.9 | 48 | 20 | 78 | 13.8 | |
175 - 205 | 46 | 10 | 78 | 7.5 | 50 | 20 | 78 | 12.5 | |
205 - 235 | 48 | 10 | 78 | 6.9 | 50 | 20 | 78 | 12.5 | |
235 - 265 | 47 | 10 | 78 | 7.2 | 50 | 20 | 78 | 12.5 | |
265 - 295 | 48 | 10 | 78 | 6.9 | 50 | 20 | 78 | 12.5 | |
295 - 325 | 40 | 10 | 78 | 9.8 | 20 m Bench Heights not Recommended | |
325 - 355 | 37 | 10 | 78 | 11.1 | 20 m Bench Heights not Recommended | |
Source: Call & Nicholas Inc., 2021
| | | | | | | | |
Released: March 27, 2026 | | Page 162 of 275 |
| | | | | | | | |
NI 43-101 Technical Report – Haile Gold Mine, South Carolina, United States |
| |
| |
Table 16-3: Mill Zone ISA Recommendations for Metavolcanics
| | | | | | | | | | | | | | | | | | | | | | | | | | | | | |
Range of Wall DDR (°) | Metavolcanics - Bench Design | |
ISA (°) | Height (m) | BFA (°) | CBW (m) | ISA (°) | Height (m) | BFA (°) | CBW (m) | |
355 - 025 | 43 | 10 | 78 | 8.6 | 20 m Bench Heights not Recommended | |
025 - 055 | 48 | 10 | 78 | 6.9 | 50 | 20 | 78 | 12.5 | |
055 - 085 | 48 | 10 | 78 | 6.9 | 50 | 20 | 78 | 12.5 | |
085 - 115 | 48 | 10 | 78 | 6.9 | 50 | 20 | 78 | 12.5 | |
115 - 145 | 47 | 10 | 78 | 7.2 | 48 | 20 | 78 | 13.8 | |
145 - 175 | 46 | 10 | 78 | 7.5 | 48 | 20 | 78 | 13.8 | |
175 - 205 | 46 | 10 | 78 | 7.5 | 50 | 20 | 78 | 12.5 | |
205 - 235 | 48 | 10 | 78 | 6.9 | 50 | 20 | 78 | 12.5 | |
235 - 265 | 47 | 10 | 78 | 7.2 | 50 | 20 | 78 | 12.5 | |
265 - 295 | 48 | 10 | 78 | 6.9 | 50 | 20 | 78 | 12.5 | |
295 - 325 | 40 | 10 | 78 | 9.8 | 20 m Bench Heights not Recommended | |
325 - 355 | 38 | 10 | 78 | 10.7 | 20 m Bench Heights not Recommended | |
Source: Call & Nicholas Inc., 2021
Table 16-4: ISA Recommendations for Metasediments and Diabase Dikes – Snake, Haile, and Ledbetter Pits
| | | | | | | | | | | | | | | | | | | | | | | | | | | | | |
Range of Wall DDR (°) | Metasediments / Diabase Dikes - Bench Design | |
ISA (°) | Height (m) | BFA (°) | CBW (m) | ISA (°) | Height (m) | BFA (°) | CBW (m) | |
345 - 015 | 42 | 10 | 78 | 9.0 | 20 m Bench Heights not Recommended | |
015 - 045 | 48 | 10 | 78 | 6.9 | 50 | 20 | 78 | 12.5 | |
045 - 075 | 48 | 10 | 78 | 6.9 | 50 | 20 | 78 | 12.5 | |
075 - 105 | 47 | 10 | 78 | 7.2 | 50 | 20 | 78 | 12.5 | |
105 - 135 | 47 | 10 | 78 | 7.2 | 50 | 20 | 78 | 12.5 | |
135 - 165 | 47 | 10 | 78 | 7.2 | 50 | 20 | 78 | 12.5 | |
165 - 195 | 47 | 10 | 78 | 7.2 | 50 | 20 | 78 | 12.5 | |
195 - 225 | 48 | 10 | 78 | 6.9 | 50 | 20 | 78 | 12.5 | |
225 - 255 | 47 | 10 | 78 | 7.2 | 50 | 20 | 78 | 12.5 | |
255 - 285 | 44 | 10 | 78 | 8.2 | 50 | 20 | 78 | 12.5 | |
285 - 315 | 43 | 10 | 78 | 8.6 | 20 m Bench Heights not Recommended | |
315 - 345 | 37 | 10 | 78 | 11.1 | 20 m Bench Heights not Recommended | |
Source: Call & Nicholas Inc., 2022
| | | | | | | | |
Released: March 27, 2026 | | Page 163 of 275 |
| | | | | | | | |
NI 43-101 Technical Report – Haile Gold Mine, South Carolina, United States |
| |
| |
Table 16-5: ISA Recommendations for Metavolcanics – Snake, Haile, and Ledbetter Pits
| | | | | | | | | | | | | | | | | | | | | | | | | | | | | |
Range of Wall DDR (°) | Metavolcanics - Bench Design | |
ISA (°) | Height (m) | BFA (°) | CBW (m) | ISA (°) | Height (m) | BFA (°) | CBW (m) | |
345 - 015 | 42 | 10 | 78 | 9.0 | 20 m Bench Heights not Recommended | |
015 - 045 | 48 | 10 | 78 | 6.9 | 50 | 20 | 78 | 12.5 | |
045 - 075 | 49 | 10 | 78 | 6.6 | 50 | 20 | 78 | 12.5 | |
075 - 105 | 47 | 10 | 78 | 7.2 | 50 | 20 | 78 | 12.5 | |
105 - 135 | 47 | 10 | 78 | 7.2 | 50 | 20 | 78 | 12.5 | |
135 - 165 | 47 | 10 | 78 | 7.2 | 50 | 20 | 78 | 12.5 | |
165 - 195 | 47 | 10 | 78 | 7.2 | 50 | 20 | 78 | 12.5 | |
195 - 225 | 48 | 10 | 78 | 6.9 | 50 | 20 | 78 | 12.5 | |
225 - 255 | 47 | 10 | 78 | 7.2 | 50 | 20 | 78 | 12.5 | |
255 - 285 | 45 | 10 | 78 | 7.9 | 50 | 20 | 78 | 12.5 | |
285 - 315 | 44 | 10 | 78 | 8.2 | 20 m Bench Heights not Recommended | |
315 - 345 | 37 | 10 | 78 | 11.1 | 20 m Bench Heights not Recommended | |
Source: Call & Nicholas Inc., 2022
Table 16-6: Summary of Rock Mass Properties
| | | | | | | | | | | | | | | | | |
Rock Type | Strength Type | Density (kN/m3) | Cohesion (kPa) | Phi (°) | |
Meta Sediments | 10% RQD | 28.0 | 397.6 | 25.2 | |
40% RQD | 859.7 | 27.5 | |
70% RQD | 1,867.9 | 30.9 | |
Foliation Anisotropy | 251.2 | 21.5 | |
Cross Joint Anisotropy | 489.5 | 22.0 | |
Meta Volcanics | 10% RQD | 25.8 | 465.4 | 28.6 | |
40% RQD | 1,008.3 | 30.7 | |
70% RQD | 2,192.7 | 33.7 | |
Foliation Anisotropy | 291.7 | 25.4 | |
Cross Joint Anisotropy | 571.6 | 25.8 | |
Diabase Dike | 10% RQD | 25.9 | 424.7 | 28.3 | |
40% RQD | 913.6 | 31.3 | |
70% RQD | 1,980.9 | 35.8 | |
CPS | Rock-mass | 19.0 | 2.0 | 30 | |
Saprolite | Rock-mass | 22.0 | 20.0 | 32 | |
Source: Call & Nicholas Inc., 2022
| | | | | | | | |
Released: March 27, 2026 | | Page 164 of 275 |
| | | | | | | | |
NI 43-101 Technical Report – Haile Gold Mine, South Carolina, United States |
| |
| |
16.1.3Optimization
The geological model has a block size of 10 m x 10 m x 5 m. This block size is considered an appropriate selective mining unit for the backhoe excavator loading units and mining practices currently used for the majority of open pit ore mining at Haile. As part of the mining sequence, some ore is expected to be mined using face shovel loading units near the top of the orebody, during the transition from bulk waste mining to selective mining. Dilution and recovery factors have been applied to the upper zones of mineralization in the resource model prior to optimization in recognition of the different mining method applied. The factors and application method for dilution and recovery are detailed in Section 16.1.7.
The optimization used Measured, Indicated, and Inferred Mineral Resource categories with a gold price of US$2,200/oz Au and silver price of US$25/oz Ag. The optimization results using Inferred material are very similar (within 4%) and therefore considered immaterial. Starting topography for optimization work was a forecast end of period surface for December 31, 2025, produced in December 2025. There are no material differences between the forecast and actual December 31, 2025, surfaces.
Optimization work was completed in GEOVIA WhittleTM software, with input parameters summarized in Table 16-7.
| | | | | | | | |
Released: March 27, 2026 | | Page 165 of 275 |
| | | | | | | | |
NI 43-101 Technical Report – Haile Gold Mine, South Carolina, United States |
| |
| |
Table 16-7: Pit Optimization Parameters
| | | | | | | | | | | |
Parameter | Unit | Value | |
Mining | |
Base Mining Cost | US$/t mined | 3.83 | |
Drill and Blast(1) | US$/t mined | 1.16 | |
Sustaining CapEx | US$/t mined | 0.32 | |
Incremental Mining Cost | US$/t mined / 5 m bench | 0.02 | |
Pit Exit | m RL | 1140 | |
PAG Rehabilitation Cost | US$/t mined PAG waste | 0.65 | |
Processing/Ore Costs | |
Ore Mining Premium | US$/t ore | 0.37 | |
Processing Cost | US$/t ore | 21.41 | |
G&A Cost | US$/t ore | 10.73 | |
Ore Rehandle Cost | US$/t ore | 2.5 | |
TSF Expansion | US$/t ore | 1.88 | |
Gold Recovery - Primary (2) | % | (1-(0.2152*Au grade^-0.3696)) | |
Gold Recovery – Oxide | % | 67% | |
Silver Recovery | % | 70% | |
Economic Inputs | |
Gold Price | US$/oz Au | 2200 | |
Silver Price | US$/oz Ag | 25 | |
Gold Refining & Selling Cost | US$/oz Au | 3 | |
Calculated Au Cut-off Grade | US$/t | 0.6 | |
Royalties | % | 0 | |
Source: OceanaGold, 2025
(1) Drill and Blast costs applied by rock-type as required
(2) Recovery equation has further 2.5% uplift added to recovery of material > 1.7 g/t Au
The base mining cost was applied to all blocks and an incremental cost was added to blocks below the elevation where the haulage ramp exits the pit. The incremental cost was not added to blocks above the pit exit. Drill and blast costs were then added based on material type.
Rehabilitation costs have been added to PAG blocks that will not be processed as this material will require permanent storage within the lined PAG facilities. The cost associated with permanent storage of processed blocks within the TSF is included in the processing cost. The determination of whether a block is processed and, by extension rehabilitation cost is paid, is made by WhittleTM during optimization.
| | | | | | | | |
Released: March 27, 2026 | | Page 166 of 275 |
| | | | | | | | |
NI 43-101 Technical Report – Haile Gold Mine, South Carolina, United States |
| |
| |
The open pit Mineral Reserves are reported within a pit design guided by open pit optimization results as shown in Figure 16-2 and Table 16-8.
Source: OceanaGold, 2025
Figure 16-2: Pit Optimization Results by Gold Price
Ultimate pit shell selection is discussed in 16.1.4, summarising the results of the Ledbetter Phase 4 open pit vs underground trade-off study.
| | | | | | | | |
Released: March 27, 2026 | | Page 167 of 275 |
| | | | | | | | |
NI 43-101 Technical Report – Haile Gold Mine, South Carolina, United States | | |
| |
Table 16-8: Optimization Results for Selected Shell on US$44 Gold Price Increments
| | | | | | | | | | | | | | | | | | | | | | | | | | | | | | | | | | | | | | | | | | | | | | | | | | | | | | | | |
Gold Price US$/oz Au | Rev Factor # | Total Mt | Waste Mt | Strip Ratio Wt:Ot | Ore | Contained Metal | Recovered Metal | Recovery | UCF US$ million | Avg Cash Cost US$/oz Au(1) | Mining Cost US$/t | Process Cost US$/t | Selling Cost US$/oz Au |
Mt | Au (g/t) | Ag (g/t) | Au Moz | Ag Moz | Au Moz | Ag Moz | Au % | Ag % |
1,540 | | 0.7 | | 27.9 | | 20.1 | | 2.6 | | 7.7 | | 2.39 | | 2.4 | | 596 | | 601 | | 514 | | 421 | | 86.3 | | 70.0 | | 700 | | 858 | | 5.34 | | 36.85 | | 3.00 | |
1,584 | | 0.72 | | 28.4 | | 20.6 | | 2.6 | | 7.8 | | 2.39 | | 2.4 | | 600 | | 605 | | 517 | | 424 | | 86.3 | | 70.0 | | 702 | | 863 | | 5.34 | | 36.85 | | 3.00 | |
1,628 | | 0.74 | | 29.8 | | 21.7 | | 2.7 | | 8.1 | | 2.36 | | 2.4 | | 613 | | 631 | | 528 | | 441 | | 86.2 | | 70.0 | | 709 | | 878 | | 5.32 | | 36.85 | | 3.00 | |
1,672 | | 0.76 | | 31.0 | | 22.7 | | 2.7 | | 8.4 | | 2.32 | | 2.4 | | 625 | | 652 | | 537 | | 456 | | 86.1 | | 70.0 | | 714 | | 893 | | 5.30 | | 36.85 | | 3.00 | |
1,716 | | 0.78 | | 31.9 | | 23.4 | | 2.8 | | 8.5 | | 2.31 | | 2.4 | | 631 | | 665 | | 543 | | 466 | | 86.0 | | 70.0 | | 717 | | 902 | | 5.30 | | 36.85 | | 3.00 | |
1,760 | | 0.8 | | 35.4 | | 26.3 | | 2.9 | | 9.1 | | 2.25 | | 2.4 | | 659 | | 709 | | 565 | | 496 | | 85.8 | | 70.0 | | 727 | | 936 | | 5.22 | | 36.85 | | 3.00 | |
1,804 | | 0.82 | | 36.6 | | 27.2 | | 2.9 | | 9.3 | | 2.23 | | 2.4 | | 669 | | 727 | | 574 | | 509 | | 85.7 | | 70.0 | | 730 | | 949 | | 5.21 | | 36.85 | | 3.00 | |
1,848 | | 0.84 | | 37.0 | | 27.5 | | 2.9 | | 9.5 | | 2.21 | | 2.4 | | 674 | | 736 | | 578 | | 516 | | 85.7 | | 70.0 | | 732 | | 955 | | 5.21 | | 36.85 | | 3.00 | |
1,892 | | 0.86 | | 38.5 | | 28.8 | | 3.0 | | 9.7 | | 2.20 | | 2.4 | | 683 | | 750 | | 585 | | 525 | | 85.6 | | 70.0 | | 734 | | 967 | | 5.18 | | 36.85 | | 3.00 | |
1,936 | | 0.88 | | 39.5 | | 29.7 | | 3.0 | | 9.9 | | 2.18 | | 2.4 | | 692 | | 766 | | 592 | | 536 | | 85.6 | | 70.0 | | 736 | | 979 | | 5.17 | | 36.85 | | 3.00 | |
1,980 | | 0.9 | | 41.1 | | 30.9 | | 3.0 | | 10.2 | | 2.15 | | 2.4 | | 704 | | 789 | | 602 | | 552 | | 85.5 | | 70.0 | | 738 | | 996 | | 5.17 | | 36.85 | | 3.00 | |
2,024 | | 0.92 | | 42.3 | | 31.8 | | 3.0 | | 10.5 | | 2.12 | | 2.4 | | 714 | | 820 | | 609 | | 574 | | 85.4 | | 70.0 | | 740 | | 1,009 | | 5.16 | | 36.85 | | 3.00 | |
2,068 | | 0.94 | | 43.6 | | 32.9 | | 3.1 | | 10.7 | | 2.10 | | 2.4 | | 724 | | 838 | | 617 | | 587 | | 85.3 | | 70.0 | | 741 | | 1,023 | | 5.15 | | 36.85 | | 3.00 | |
2,112 | | 0.96 | | 45.7 | | 34.5 | | 3.1 | | 11.2 | | 2.06 | | 2.4 | | 741 | | 873 | | 631 | | 611 | | 85.1 | | 70.0 | | 743 | | 1,047 | | 5.14 | | 36.85 | | 3.00 | |
2,156 | | 0.98 | | 167.1 | | 146.0 | | 6.9 | | 21.2 | | 1.93 | | 2.4 | | 1,311 | | 1,657 | | 1,113 | | 1,160 | | 84.9 | | 70.0 | | 774 | | 1,531 | | 5.16 | | 36.85 | | 3.00 | |
2,200 | | 1 | | 170.2 | | 148.7 | | 6.9 | | 21.5 | | 1.92 | | 2.4 | | 1,326 | | 1,681 | | 1,126 | | 1,177 | | 84.9 | | 70.0 | | 774 | | 1,539 | | 5.16 | | 36.85 | | 3.00 | |
2,244 | | 1.02 | | 185.5 | | 162.2 | | 7.0 | | 23.3 | | 1.88 | | 2.4 | | 1,406 | | 1,764 | | 1,192 | | 1,235 | | 84.8 | | 70.0 | | 772 | | 1,578 | | 5.14 | | 36.85 | | 3.00 | |
2,288 | | 1.04 | | 188.6 | | 164.8 | | 7.0 | | 23.7 | | 1.87 | | 2.4 | | 1,424 | | 1,793 | | 1,206 | | 1,255 | | 84.7 | | 70.0 | | 771 | | 1,587 | | 5.14 | | 36.85 | | 3.00 | |
2,332 | | 1.06 | | 192.1 | | 168.0 | | 7.0 | | 24.2 | | 1.86 | | 2.4 | | 1,442 | | 1,830 | | 1,222 | | 1,281 | | 84.7 | | 70.0 | | 769 | | 1,597 | | 5.14 | | 36.85 | | 3.00 | |
2,376 | | 1.08 | | 192.7 | | 168.4 | | 6.9 | | 24.3 | | 1.85 | | 2.4 | | 1,446 | | 1,837 | | 1,225 | | 1,286 | | 84.7 | | 70.0 | | 769 | | 1,599 | | 5.14 | | 36.85 | | 3.00 | |
2,420 | | 1.1 | | 193.1 | | 168.7 | | 6.9 | | 24.3 | | 1.85 | | 2.4 | | 1,449 | | 1,842 | | 1,226 | | 1,289 | | 84.7 | | 70.0 | | 768 | | 1,600 | | 5.14 | | 36.85 | | 3.00 | |
2,464 | | 1.12 | | 196.1 | | 171.3 | | 6.9 | | 24.8 | | 1.84 | | 2.3 | | 1,465 | | 1,864 | | 1,239 | | 1,305 | | 84.6 | | 70.0 | | 765 | | 1,609 | | 5.14 | | 36.85 | | 3.00 | |
2,508 | | 1.14 | | 196.7 | | 171.8 | | 6.9 | | 24.9 | | 1.84 | | 2.3 | | 1,468 | | 1,873 | | 1,242 | | 1,311 | | 84.6 | | 70.0 | | 764 | | 1,611 | | 5.14 | | 36.85 | | 3.00 | |
2,552 | | 1.16 | | 198.0 | | 172.9 | | 6.9 | | 25.1 | | 1.83 | | 2.3 | | 1,476 | | 1,890 | | 1,248 | | 1,323 | | 84.6 | | 70.0 | | 762 | | 1,616 | | 5.14 | | 36.85 | | 3.00 | |
2,596 | | 1.18 | | 198.7 | | 173.5 | | 6.9 | | 25.2 | | 1.82 | | 2.3 | | 1,480 | | 1,899 | | 1,251 | | 1,329 | | 84.6 | | 70.0 | | 761 | | 1,619 | | 5.14 | | 36.85 | | 3.00 | |
Source: OceanaGold, 2025
(1) Silver as by-product credit
•Blue – Revenue Factor 1
| | | | | | | | |
Released: March 27, 2026 | | Page 168 of 275 |
| | | | | | | | |
NI 43-101 Technical Report – Haile Gold Mine, South Carolina, United States |
| |
| |
16.1.4Ledbetter Open pit vs Underground Study
The Ledbetter Phase 4 open pit was the largest planned pit phase for the Haile open pit operations with the highest strip ratio (~150 Mt at 9.4 Strip Ratio) (SRK, 2024). Much of the mineralization in Ledbetter Phase 4 presents at depth, resulting in a significant pre-strip prior to accessing sustainable ore production. This geometry also resulted in the optimization showing that Ledbetter Phase 4 is “all or nothing”, with the optimization shells expanding to the entire Ledbetter Phase 4 limits within a single revenue factor step, as shown in Figure 16-3.
Source: OceanaGold, 2025
•Peach = Projected end of period surface (December 31, 2025)
•Red = US$2,112/oz optimization shell
•Green = US$2,156/oz optimization shell
Figure 16-3: Cross-Section, Ledbetter Optimization Shell Showing Revenue Factor Step Change and Resource Model Block >0.5 g/t Au
Another result of the geometry of the mineralization in the vicinity of Ledbetter Phase 4 is that it is amenable to underground mining, as is “Lobe Three” outside of Ledbetter Phase 4, as shown in
Figure 16-4. Given that most of the mineralization that makes up a potential underground operation is also within the designed pit phase, this makes the open pit vs. underground decision binary, one or the other, rather than a “when” to changeover as for orebodies that are more vertically continuous.
| | | | | | | | |
Released: March 27, 2026 | | Page 169 of 275 |
| | | | | | | | |
NI 43-101 Technical Report – Haile Gold Mine, South Carolina, United States |
| |
| |
Source: OceanaGold, 2025
Figure 16-4: Cross-Section, Footprint of Ledbetter Phase 4 Open Pit vs Ledbetter Underground
The evaluation of the trade-off study took the approach of evaluating the life-of-mine value of the Haile operation without Ledbetter Phase 4, with Ledbetter Phase 4 as an open pit, and with Ledbetter Phase 4 converted to an underground operation. The difference between the no-Ledbetter scenario and the two Ledbetter options represented the value of Ledbetter by open pit or underground mining.
The incremental values of the open pit and underground were compared over a range of gold prices. At the OGC Mineral Reserve gold price of US$2,200, the underground option is superior in terms of both undiscounted cashflow (UCF) and NPV. The open pit, having a larger metal inventory, is more sensitive to gold price. The crossover price where the open pit has a higher value than the underground was investigated, with the result that the underground returns superior value up to a gold price of approximately US$5,800/oz, as shown with underground value relative to open pit value in Figure 16-5. Note that although the open pit value exceeds the underground at gold prices greater than US$5,800, the relative difference remains small and other factors would also play into decisions making as discussed below.
| | | | | | | | |
Released: March 27, 2026 | | Page 170 of 275 |
| | | | | | | | |
NI 43-101 Technical Report – Haile Gold Mine, South Carolina, United States |
| |
| |
Source: OceanaGold, 2025
Figure 16-5: Incremental Value – Relative Valuation of Ledbetter Phase 4 OP vs UG
As well as superior value, the underground option for Ledbetter Phase 4, now referred to as LUG, also has several other tangible benefits, including:
•Earlier access to sustainable ore production, allowing for a smoother life-of-mine production profile.
•Lower capital expenditure, mainly in removing the open pit pre-stripping.
•Smaller OSA footprints. Since completion of the trade-off, changes in LoM scheduling means that another PAG storage cell will be required if Ledbetter Phase 4 were to revert to open pit mining. This cost has not been factored into the trade-off calculations, and would likely push the crossover price higher than US$5,800/oz.
•Smaller overall water catchment area, reducing contact water generation and subsequent water treatment requirements.
•Smaller tailings storage facility requirement.
•Lower average carbon emissions, both in terms of absolute emissions and unit rate emissions per ounce of gold produced.
16.1.5Mine Design
Reserve Block Model
To derive the reserve block model, the resource block model is modified to include:
•Geotechnical variables for berm width, batter angle and bench height
•Ore and waste classifications based on calculated cut-off grades and Measured, Indicated, and Inferred material
•Non-PAG / PAG determination (see Section 16.1.6)
•Mining dilution and recovery
The Non-PAG / PAG determinations govern the routing of waste material to either lined PAG OSAs, in-pit backfill (yellow only) or unlined Non-PAG OSAs.
| | | | | | | | |
Released: March 27, 2026 | | Page 171 of 275 |
| | | | | | | | |
NI 43-101 Technical Report – Haile Gold Mine, South Carolina, United States |
| |
| |
Pit Design
OceanaGold used the optimization shells as a guide for practical phase and ultimate pit design, using the US$2,200/oz shell for most areas of the pit, and US$2,112/oz shell for the Ledbetter
Phase 3 (LUG/Phase 04 interface) pit wall as shown in Figure 16-3. The major design parameters used are as follows:
•Ramp grade = 10%
•Full ramp width = 32 m (3 times operating width for 730E)
•Single ramp width = 20 m for up to 60 m vertical or six benches
•Minimum mining width = 40 m but targets between 150 m to 300 m
•Flat switchbacks
•Bench heights, berm widths and bench face angles in accordance with current site-specific design criteria
Figure 16-6 illustrates the final open pit design and associated ramp system. This design is functionally similar to the 2024 ultimate pit design, with Ledbetter Phase 4 removed. Ramp locations targeted saddle points between the various pit bottoms with ramps also acting as catch benches for geotechnical purposes. Each pit phase has at least one ramp for scheduling purposes.
Source: OceanaGold, 2025
Figure 16-6: LoM Ultimate Pit Design
16.1.6Overburden/Geochemical
Overburden mined at Haile consists of cover soil, CPS, and bedrock with variable degrees of weathering and oxidation. Mined materials are grouped as soft (i.e., cover soil, CPS, and saprolite)
| | | | | | | | |
Released: March 27, 2026 | | Page 172 of 275 |
| | | | | | | | |
NI 43-101 Technical Report – Haile Gold Mine, South Carolina, United States |
| |
| |
and hard (i.e., bedrock comprised of metavolcanics and metasediments with variable oxidation) rock units. Cover soil is salvaged from the disturbance footprints prior to open pit mining or placement of mine waste, either as overburden or tailings, and stockpiled to be used to facilitate reclamation of the mine waste storage facilities. CPS is mined without drilling and blasting and classified as Green (Non-PAG) material without additional testing. Saprolite is mined without blasting where possible and is sampled and tested for overburden classification and management. Bedrock is drilled and blasted, and the cuttings from each blast hole in waste zones are sampled and tested for overburden classification. The current open pit mine plan is summarized in Table 16-12 and includes 91 Mt of overburden.
Oxidation in bedrock generally extends 20 to 60 m deep with no sulfide minerals. Unweathered rock below the base of oxidation contains sulfides with potential to generate sulfuric acid when exposed to air and water. The most common sulfide mineral at Haile is pyrite, FeS2, comprising 0.1% to 10% by volume. Minor pyrrhotite and molybdenite are also observed in drillholes and pit exposures. Schafer (2015) performed an extensive geochemical characterization program of existing and future mine development rock (i.e., overburden) to identify, manage and mitigate geochemical risks at Haile as part of the open pit plan (Schafer, 2019). The characterization program continued during operations and results are detailed in an updated document (Oceana Gold, 2024a). Characterization included static testing of 610 samples prior to 2014 and 46 more samples in 2020, and kinetic testing of nine samples of overburden and one tailings sample prior to 2014, and six additional samples of overburden in the 2016 to 2020 program.
The current OMP issued by Oceana Gold (2024b) supersedes the previous document (Schafer, 2015). The 2024 OMP has three geochemical categories of overburden based on total sulfur abundance (ST) and Net Neutralization Potential (NNP). The NNP is a measure of overall acid generation potential (AGP). calculated as the difference between the neutralization potential (NP) and AP. The geochemical categories of overburden are:
•Red PAG – Strongly acid generating:
oNNP < = -31.25 kg CaCO3/t, and any ST
•Yellow PAG – Moderately acid generating:
oST > 0.2 % and NNP between -31.25 and 0 kg CaCO3/t
oSubcategories Y3 and Y4 defined below
•Green Non-PAG – Non acid generating:
oST < = 0.2 % or NNP >= 0 kg CaCO3/t
The geochemical categories of overburden and their associated management approaches are summarized in Table 16-9. Overburden classification is based on the NNP and the sulfur abundance of the material. NNP is calculated from a suite of tests that comprise Acid Base Accounting (ABA), which is used to determine AGP and Acid Neutralization Potential (ANP). AGP depends on the abundance of pyrite and other acid-generating sulfur minerals, and ANP is controlled by minerals that neutralize acid, particularly calcite and other carbonates. Yellow overburden subcategories are defined as follows:
•Y4: NNP < -6.25 and any sulfur abundance, highest risk of acid generation and metal leaching of the Yellow Overburden
•Y3: -6.25 < NNP < 0 and ST > 0.2 wt%, may develop acid but would release less sulfate and metals than Y4
| | | | | | | | |
Released: March 27, 2026 | | Page 173 of 275 |
| | | | | | | | |
NI 43-101 Technical Report – Haile Gold Mine, South Carolina, United States |
| |
| |
Kinetic testing using the Humidity Cell Test (HCT) method confirmed the applicability of the overburden classification scheme based on results of static tests. Kinetic testing results included:
•Samples classified as RED or Y4 overburden generally had acidic HCT leachate pH values less than four standard units (s.u.) over the duration of the test, between 130 and 240 weeks, as pyritic sulfur oxidized.
•The Y3 HCT initially had weakly acidic pH that increased from 4 to 5 s.u. after 120 weeks of testing. Sulfate concentrations decreased as the test progressed due to the weathering of the relatively small amount of initial pyritic sulfur.
•Samples previously classified as Yellow 1 (Y1) and Yellow 2 (Y2) overburden had minimal reactivity in the HCT tests, with low sulfate concentrations and leachate pH values between about 4 and 6 s.u. These are classified as Green overburden in the current OMP (Oceana Gold 2024b).
•Samples classified as Green overburden were Non-PAG in static tests and most HCT leachate pH values were greater than 5 s.u., which is the approximate pH of the reagent. Leachates from these HCTs had low to non-detectable sulfate concentrations.
Supplemental testwork completed between 2020 and 2023 confirmed that Y1 and Y2 overburden materials are non-acid generating. This allowed Y1 and Y2 overburden to be reclassified to Green overburden and handled the same as Green overburden (Oceana Gold, 2024a).
Sulfur and carbon assays from blastholes are used to populate block models and assign overburden class for each blast pattern. The overburden materials are placed as follows:
•All Red PAG is sent to West PAG OSA. This is a geomembrane-lined facility and is currently in use. Material will be placed in lifts and compacted by haulage fleet traffic. For closure, the top of this facility will be covered with saprolite, followed by a height density polyethylene (HDPE) geomembrane liner and then a layer of growth media. The growth media will be seeded to establish vegetation.
•Yellow PAG can be stored in West PAG OSA, or below a prescribed water table elevation within pits. Yellow PAG material will be mixed with lime at a rate of 1.8 kg (4 lb.) lime per 0.9 t (2,000 lb.) before placement in the pit void. Material will be placed in lifts and compacted by haulage fleet traffic. For closure, the top surface of these facilities will be covered with green Non-PAG material. Yellow PAG can be utilized in-pit for road construction. Green Non-PAG material will be stored in unlined facilities or backfilled into the pits. Material placed on unlined facilities will be placed in lifts and compacted by haulage fleet traffic. The reclaimed slopes will be seeded to establish vegetation.
| | | | | | | | |
Released: March 27, 2026 | | Page 174 of 275 |
| | | | | | | | |
NI 43-101 Technical Report – Haile Gold Mine, South Carolina, United States |
| |
| |
Table 16-9: Overburden Classification at Haile
| | | | | | | | |
Operational Testing Criterion | Characteristics | Proposed Management |
Red PAG - Strongly Acid Generating Overburden |
Found in Metasediment Unit. NNP < = -31.25 kg/t as CaCO3 | When oxidized, contact water will have low pH (< 3.0) and very high acidity, metals, and sulfate (>5,000 mg/L) | Stored in geomembrane encapsulated PAG cell, placed in lifts, compacted, and Saprolite-lined outside perimeter to reduce oxygen ingress |
Yellow PAG - Moderately Acid Generating Overburden |
Found in Metasediment and Metavolcanic Bedrock Units and Saprolite. For bedrock, Total S > 0.2% and NNP between -31.25 and 0 kg/t as CaCO3. For Saprolite within 50 ft of bedrock contact, Total S > 0.2% | If allowed to oxidize, contact water will have low pH (3.0 to 4.0 s.u.) and low to moderate metals (mostly Fe and Al) | Managed as above, may also be placed in lifts as subaqueous pit backfill, with4 lbs/t lime added and 5-ft saprolite cover |
Green Non-PAG - Non Acid Generating Overburden |
Found in Metasediment and Metavolcanic Bedrock Units, Saprolite and Coastal Plain Sands. For Bedrock, Total S < = 0.2% or NNP > = 0 kg/t as CaCO3. For Saprolite within 50 ft of bedrock contact, Total S < = 0.2%. All Saprolite more than 50 ft above bedrock and all Coastal Plain Sands is Green Non-PAG. | Contact water may have moderately acidic to alkaline pH (4.0 to 8.0), low sulfate (<1,000 mg/L) and metals non-detectable. | Placed in unlined overburden piles. Runoff will not require treatment assuming it meets stormwater requirements as expected |
Source: Oceana Gold, 2024b, modified by SRK
The overburden storage is discussed in more detail in Section 18.2, with the final year site plan shown in Figure 16-7.
| | | | | | | | |
Released: March 27, 2026 | | Page 175 of 275 |
| | | | | | | | |
NI 43-101 Technical Report – Haile Gold Mine, South Carolina, United States |
| |
| |
Source: OceanaGold, 2025
•Blue = Planned pit phases, Yellow = Planned in-pit OSA, Green = Planned external OSA, Red = planned PAG OSA .
Figure 16-7: Final Pit Design and Ultimate Overburden Storage Site Plan
| | | | | | | | |
Released: March 27, 2026 | | Page 176 of 275 |
| | | | | | | | |
NI 43-101 Technical Report – Haile Gold Mine, South Carolina, United States |
| |
| |
16.1.7Mine Production Schedule
Cut-Off Grade
OceanaGold have used a stockpiling strategy with multiple CoGs to determine direct processing ore, stockpiled ore, and waste in the mine production schedule. The base assumptions for the calculation of break-even CoG during operations and at the end of mine life are detailed in Table 16-10. Primary and Oxide ores have different processing recovery responses, and separate CoG values have been applied. The breakeven CoG during normal operation is 0.7 g/t for Primary material and 0.8 g/t for Oxide material. However, a variable cut-over grade is used to delineate the best available ore for direct feed in a given period, while the end of mine life CoG is used for material sent to the stockpile, being 0.5 g/t Au for Primary and to 0.6 g/t Au for Oxide. The end of mine life marginal CoG has been used for reporting of Mineral Reserves.
Table 16-10: Cut-off Grade Calculation
| | | | | | | | | | | | | | | | | |
Description | Units | Operating BE CoG | Operating BE CoG | End of Mine Life CoG | End of Mine Life CoG |
Material Type | Type | Primary | Oxide | Primary | Oxide |
Gold Price | US$/oz | 2,200 | | 2,200 | | 2,200 | | 2,200 | |
Smelting & Refining | US$/oz | 3.00 | | 3.00 | | 3.00 | | 3.00 | |
Au Recovery (at CoG)(1) | % | 75.5 | % | 68.0 | % | 71.9 | % | 68.0 | % |
Operating Costs | Units | Values | Values | Values | Values |
Ore Premium (D&B) | US$/t ore | 0.37 | | 0.37 | | 0.37 | | 0.37 | |
G&A | US$/t ore | 11.81 | | 11.81 | | 2.50 | | 2.50 | |
Tailings | US$/t ore | 1.88 | | 1.88 | | 1.88 | | 1.88 | |
Processing | US$/t ore | 21.41 | | 21.41 | | 18.00 | | 18.00 | |
PAG rehab | US$/pag t mined | 0.65 | | 0.65 | | 0.65 | | 0.65 | |
Rehandle Cost | US$/t ore | 2.50 | | 2.50 | | 2.50 | | 2.50 | |
Total PCAF (WhittleTM) | US$/t ore | 37.97 | | 37.97 | | 25.25 | | 25.86 | |
Total Cost (with PAG) | US$/t ore | 37.32 | | 37.32 | | 24.60 | | 24.60 | |
Breakeven Cut-off Grade | g/t | 0.70 | | 0.78 | | 0.48 | | 0.51 | |
Applied Cut-off Grade | g/t | Var. | Var. | 0.5 | | 0.6 | |
Source: OceanaGold, 2025
(1) Recovery at Primary CoG based on recovery formula: (1-(0.2152*Au grade^-0.3696))
Dilution and Mining Recovery
Reserves are based on the Haile Resource block model that uses a 10 m x 10 m x 5 m block dimension.
Scheduling studies completed in 2021 highlighted that with the current equipment fleet at Haile, some mining of ore by face shovel excavators will be unavoidable. Subsequently, an SMU study
| | | | | | | | |
Released: March 27, 2026 | | Page 177 of 275 |
| | | | | | | | |
NI 43-101 Technical Report – Haile Gold Mine, South Carolina, United States |
| |
| |
was completed to estimate the impacts on mining dilution and ore recovery at bench heights suitable for mining by face shovel excavator.
The results of the SMU study indicated that different areas of the mineralized zone react with variable magnitude to different bench heights. These results are shown in Table 16-11. Note that the values in the table are multiplier adjustments to the 10 m x 10 m x 5 m block model tonnes and grade estimates that include diluting grades appropriate to 3.3 m benches.
Table 16-11: Tonnage and Grade Multipliers for Application of Mining Dilution and Ore Recovery
| | | | | | | | | | | | | | | | | | | | | | | | | | | | | | | | |
Multipliers | 3.3 m Flitch | 5 m Flitch | 10 m Bench | |
Phase | tonnes | g/t | oz | tonnes | g/t | oz | tonnes | g/t | oz | |
Snake: Phase 3 | 1.00 | | 1.00 | | 1.00 | | 1.10 | | 0.95 | | 1.05 | | 1.18 | | 0.87 | | 1.02 | | |
Ledbetter: Phase 3 | 1.00 | | 1.00 | | 1.00 | | 1.05 | | 0.92 | | 0.96 | | 1.17 | | 0.82 | | 0.95 | | |
Ledbetter: Phase 4 | 1.00 | | 1.00 | | 1.00 | | 1.05 | | 0.97 | | 1.02 | | 1.05 | | 0.94 | | 0.99 | | |
Small: Phase 1 | 1.00 | | 1.00 | | 1.00 | | 1.08 | | 0.96 | | 1.04 | | 1.15 | | 0.85 | | 0.98 | | |
Haile: Phase 2 | 1.00 | | 1.00 | | 1.00 | | 1.09 | | 0.88 | | 0.96 | | 1.17 | | 0.84 | | 0.98 | | |
Champion: Phase 1 | 1.00 | | 1.00 | | 1.00 | | 1.08 | | 0.96 | | 1.04 | | 1.15 | | 0.85 | | 0.98 | | |
Source: OceanaGold, 2022
•Values are multipliers applied directly to tonnes and grade, with impact shown to contained gold ounces.
Given the variability between pit phases, a single approach to applying mining dilution and ore recovery is considered unsuitable. To account for these differences, tonnes and grade multipliers identified in Table 16-11 have been applied directly to the Resource block model within each pit phase, to the first 30% of ore mined in each phase. The selection of the first 30% of ore is based on previous scheduling exercises that identified the general crossover point between bulk mining with Face Shovels and selective mining with Backhoe Excavators. The global impact of this is a mining dilution factor increase of approximately 1.6%, and ore recovery reduction of less than 1%. While the adjustments have limited impact on the overall mine plan, it accounts for some variability on a period-by-period basis.
Phase Design Inventory
The remaining inventory in the ultimate pit design is broken into five mine phases for sequenced extraction in the mine production schedule. The design parameters for each phase are the same as those used for the final pit design including assumed ramp widths. Phase designs were constructed by splitting up the final pit into smaller and more manageable pieces, while still ensuring each bench within each phase has ramp access. The phases have been developed by balancing mining constraints with the extraction sequence suggested by pit optimization results presented previously.
Phases designs are imported to RPM Global OPMS mine scheduling software and inventories reported using the Reserve block model. Scheduling is completed using 10 m bench heights until 30% of the contained ounces for all large phases have been mined, then 5 m bench heights used for mining the remainder of each phase to match the Reserve block model. Small pit Phase 1 and Champion pit Phase 1 are scheduled on 5 m bench heights for the entire phase.
| | | | | | | | |
Released: March 27, 2026 | | Page 178 of 275 |
| | | | | | | | |
NI 43-101 Technical Report – Haile Gold Mine, South Carolina, United States |
| |
| |
Table 16-12 details the phase inventory that forms the basis of the production schedule.
Table 16-12: Phase Inventory (1/1/2026 to End of Mine Life)
| | | | | | | | | | | | | | | | | | | | | | | | | | |
Phases | Ore (Proven+Probable) | Waste | Total |
Tonnes (Mt) | Au g/t | Ag g/t | Contained Au (koz) | Contained Ag (koz) | Tonnes (Mt) | SR | Tonnes (Mt) |
Snake: Phase 3 | 4.0 | | 1.42 | | 1.8 | | 183 | | 229 | | 39.9 | | 9.9 | | 43.9 | |
Ledbetter: Phase 3 | 8.1 | | 2.10 | | 2.4 | | 549 | | 622 | | 25.2 | | 3.1 | | 33.4 | |
Small: Phase 1 | 0.9 | | 0.82 | | 2.5 | | 24 | | 73 | | 2.8 | | 3.0 | | 3.7 | |
Haile: Phase 2 | 3.7 | | 1.03 | | 2.4 | | 122 | | 280 | | 18.4 | | 5.0 | | 22.1 | |
Champion: Phase 1 | 1.0 | | 0.99 | | 3.4 | | 31 | | 107 | | 4.7 | | 4.8 | | 5.7 | |
Total | 17.8 | | 1.59 | | 2.3 | | 910 | | 1,311 | | 91.0 | | 5.1 | | 108.8 | |
Source: OceanaGold, 2025
•Totals do not include opening stockpiles
Production Schedule Targets
The production schedule has a start date of January 1, 2026, and is based on a projected end of period surface for December 31, 2025, produced in December 2025. There are no material differences between the forecast and actual December 31, 2025, surfaces. Scheduling is completed using RPM Global’s OPMS scheduling software.
Production scheduling uses an activity-based approach using productivity rates for excavators and haulage cycle calculations for trucks, and targets maintaining a balance between ore supply to the processing plant, pre-stripping on subsequent phases, and stockpile size. Bench vertical advance rates are generally limited to two 5 m benches per month. However, mining is usually limited by total movement constraints rather than vertical advance.
Production Schedule Results
The results of the production schedule are detailed in Table 16-13. A more detailed breakdown of the production schedule is found in Table 16-30. Note that stockpile material is not included in this summary and therefore numbers here do not match the Reserve table and processing schedule (which do include stockpile material).
| | | | | | | | |
Released: March 27, 2026 | | Page 179 of 275 |
| | | | | | | | |
NI 43-101 Technical Report – Haile Gold Mine, South Carolina, United States |
| |
| |
Table 16-13: Open Pit Production Summary
| | | | | | | | | | | | | | | | | | | | |
Year | Ore (Mt) | Au Grade (g/t) | Ag Grade (g/t) | Waste (Mt) | Total Mined (kt) | |
2026 | 4.4 | | 2.01 | | 2.0 | | 25.1 | | 29.5 | | |
2027 | 4.8 | | 1.91 | | 2.7 | | 23.8 | | 28.6 | | |
2028 | 1.6 | | 1.06 | | 1.9 | | 19.2 | | 20.8 | | |
2029 | 1.0 | | 1.16 | | 2.3 | | 5.6 | | 6.6 | | |
2030 | 1.4 | | 1.16 | | 2.0 | | 3.9 | | 5.3 | | |
2031 | 2.3 | | 1.38 | | 2.1 | | 5.6 | | 7.9 | | |
2032 | 1.2 | | 1.30 | | 2.1 | | 5.3 | | 6.5 | | |
2033 | 1.1 | | 1.06 | | 3.4 | | 2.6 | | 3.7 | | |
Total | 17.8 | | 1.59 | | 2.4 | | 91.0 | | 108.8 | | |
Source: OceanaGold, 2025
Open pit production reduces from 2029 as underground ore sources make up a larger proportion of the processing plant feed stock. Excess low-grade open pit production is stockpiled for rehandling and processing at the end of mine life, once open pit mining is complete. The peak stockpile size is approximately 6 Mt. The stockpiling strategy allows for the stockpiling of low-grade material and selective processing of the highest available grade each period, contributing to a smoother gold production profile and improved project NPV.
Figure 16-8 illustrates the annual production schedule for ore and waste tonnes, including rehandle completed using the OP mining fleet. Open pit mining is complete in 2033, with a support fleet being maintained until 2036 for stockpile rehandle.
Source: OceanaGold, 2025
•Rehandle includes in-pit waste, open pit stockpile, underground ore from portal to ROM, and underground waste rehandle.
Figure 16-8: Open Pit Annual Production Schedule
| | | | | | | | |
Released: March 27, 2026 | | Page 180 of 275 |
| | | | | | | | |
NI 43-101 Technical Report – Haile Gold Mine, South Carolina, United States |
| |
| |
Figure 16-9 is broken down by material type; PAG (Red and Yellow) overburden, Non-PAG (Green) overburden, and ore tonnes. The proportion of Red/Yellow to Green overburden generally increases with depth, highlighted by the decreasing quantities of green overburden produced toward the end of the OP mine life. Total PAG waste mined has been significantly reduced by the removal of Ledbetter Phase 4.
Source: OceanaGold, 2025
Figure 16-9: OP Mined Material Type Annual Schedule
Bench Sinking Rate
Table 16-14 shows the benches mined from each pit/phase on an annual basis converted to 10 m equivalents. Sinking rates are considered reasonable in any given year.
Table 16-14: LoM Yearly Bench Sinking Rates (10 m bench equivalents)
| | | | | | | | | | | | | | | | | | | | | | | | | | | | | |
Pit Phase | 2026 | | 2027 | | 2028 | | 2029 | | 2030 | | 2031 | | 2032 | | 2033 | | |
Snake: Phase 3 | 3.6 | | 7.0 | | 4.8 | | 1.0 | | 1.3 | | 2.1 | | 3.2 | | 2.0 | | |
Ledbetter: Phase 3(1) | 10.8 | | 6.2 | | - | | - | | - | | - | | - | | - | | |
Small: Phase 1 | - | | 6.0 | | - | | - | | - | | - | | - | | - | | |
Haile: Phase 2 | - | | 2.5 | | 3.8 | | 1.3 | | 1.1 | | 2.7 | | 2.1 | | - | | |
Champion: Phase 1 | - | | - | | - | | - | | - | | - | | 2.6 | | 3.9 | | |
Source: OceanaGold, 2025
(1)Ledbetter Phase 3 sink rate in 2026 includes multiple partial benches leftover from December 2025
| | | | | | | | |
Released: March 27, 2026 | | Page 181 of 275 |
| | | | | | | | |
NI 43-101 Technical Report – Haile Gold Mine, South Carolina, United States |
| |
| |
16.1.8Mining Fleet and Requirements
The open pit loading and hauling equipment fleet consists of hydraulic excavators (Komatsu PC3000 and PC4000 models) and rigid frame haul trucks (Komatsu 730E). Blasthole drilling and wall control drilling is performed with a fleet of Sandvik DR410i and Sandvik Leopard DI650i drills. Typical ancillary equipment, including a backhoe (Cat 6020B), track dozers, wheel dozers, motor graders, water trucks, and rigid frame haul trucks for rehandle (Cat 785) support the mining operation.
The open-pit operates on a 24-hr, 365 days per year basis. Weather delays have been calculated and applied as a reduction in Utilization of Availability, which has a higher impact during summer months than winter. Table 16-15 shows the planned availabilities and use of availabilities for the loading and hauling equipment to estimate the potential operating hours per year. Note that actual hours per year are based on usage requirement and are typically lower than the planned maximum, particularly from 2028 when open pit total movement rates are reduced.
Table 16-15: Factors in Estimation of Potential Operating Hours for a Typical Year
| | | | | | | | | | | | | | |
Description | 175 t Truck | PC3000 Backhoe | PC4000 Shovel | |
Availability | 85.3% | 83.2% | 82.4% | |
Use of Availability | 82.8% | 81.9% | 81.1% | |
Operating Hours per Year | 6,190 | 5,970 | 5,850 | |
Source: OceanaGold, 2025
Overburden and ore are drilled with either 127 mm or 171 mm diameter holes. Productivity rates vary depending on drill type and rock type.
Five to seven passes of the primary digging units are typically required to load the matching trucks. Annual productivity rates have been estimated from equipment specifications, material characteristics, spot and loading times, truck presentation and primary digging unit propel factors, scheduled hours per year, mechanical availability and use of availability. For PC3000 excavators, the estimated productivity is 1,500 t/h. For PC4000 excavators, the estimated productivity is 2,400 t/h. A Cat 6020B backhoe excavator provides operational support and backup loading tool.
Truck number estimates are outputs from the mine schedule based on various source/destination combinations, which include:
•Green overburden (to Green OSA and TSF)
•Red PAG (to dedicated PAG cells)
•Yellow PAG (to dedicated PAG cells or in-pit dumps)
•Inferred (to relevant OSA or PAG cells)
•Ore (to ROM or to stockpile)
•Yellow PAG rehandle (from temporary in-pit dump to permanent in-pit dumps or PAG cells)
•OP ore rehandle (Stockpile to ROM)
•Rehandle underground ore (to ROM)
•Rehandle underground waste (to PAG cells)
Table 16-16 shows the major mining equipment fleet required to achieve the mining schedule. The load-and-haul fleet is expected to be adequate for the LoM with no fleet replacement planned. Rebuilds are scheduled at appropriate intervals over the LoM timeframe. Drills and some ancillary
| | | | | | | | |
Released: March 27, 2026 | | Page 182 of 275 |
| | | | | | | | |
NI 43-101 Technical Report – Haile Gold Mine, South Carolina, United States |
| |
| |
equipment will require replacement, and this has been included in the CapEx schedule in
Section 21, noting that the large DR410i platform drills are phased out in favor of the more flexible boom drill fleet from mid-2028. A down the hole service will continue to be provided by an explosive’s supplier.
Ancillary equipment to support the load and haul and drilling fleets includes small hydraulic excavators, tracked dozers, wheel dozers, motor graders, and water trucks. Front-end loaders (FELs) provide stockpile rehandle, extra loading capability, and project work. Other equipment includes lighting plants, sump pumps, fuel trucks, compactor and light vehicles.
Table 16-16: Major Equipment Required to Achieve the Mine Schedule
| | | | | | | | | | | | | | | | | | | | | | | | | | | | | |
Machine Type | 2026 | | 2027 | | 2028 | | 2029 | | 2030 | | 2031 | | 2032 | | 2033 | | |
PC4000 Excavator | 2 | | 2 | | 2 | | 1 | | 1 | | 1 | | 1 | | 1 | | |
PC3000 Excavator | 1 | | 1 | | 1 | | 1 | | 1 | | 1 | | 1 | | 1 | | |
Cat 6020B Excavator | 1 | | 1 | | 1 | | 1 | | 1 | | 1 | | 1 | | 1 | | |
Komatsu 730E Trucks | 19 | | 19 | | 17 | | 11 | | 8 | | 8 | | 7 | | 5 | | |
Sandvik DR410i Drill | 7 | | 7 | | 6 | | 6 | | 6 | | 6 | | 6 | | 2 | | |
Sandvik Leopard DI650i | 4 | | 3 | | 1 | | | | | | | |
Source: OceanaGold, 2025
16.1.9Open Pit Mine Dewatering
During mining, groundwater flow directions in the CPS and bedrock hydrostratigraphic units generally reflect topography, except in the immediate vicinity of the pits where depressurization pumping has influenced flow direction and increased hydraulic gradients. Hydraulic testing results and geotechnical assessments suggest declining hydraulic conductivity (K) with depth and the division of bedrock into higher K (weathered, fractured unit) and underlying lower K (unweathered, more competent unit). The tests completed at Snake Pit area suggest that metavolcanic rocks are slightly more permeable than metasediments. Higher yielding water strikes in metavolcanics in Snake Pit depressurization borings seem to support slightly higher K in metavolcanics, at least in that area.
Based on monitoring of open pit mining operations data around Mill Zone and Snake Pit, weathered and fractured bedrock transmits the majority of the bedrock groundwater flux across the site. Although the underlying, unweathered/competent bedrock is of relatively low K, the unit can be expected to produce water, particularly as more saturated thickness is intercepted as mine development advances in accordance with the mine plan.
A numerical groundwater flow model exists for the Project. The model represents the identified hydrostratigraphic units as 11 model layers:
•Layers 1 - 2: CPS
•Layers 3 - 4: Saprolite
•Layers 5 - 6: Weathered, fractured bedrock
•Layers 7 - 11: Unweathered / competent bedrock with a gradational decrease in K with depth
| | | | | | | | |
Released: March 27, 2026 | | Page 183 of 275 |
| | | | | | | | |
NI 43-101 Technical Report – Haile Gold Mine, South Carolina, United States |
| |
| |
Previously, site stratigraphic data, meteorological data and groundwater pressure/level data from numerous monitoring wells and vibrating wire piezometers installed in each of the hydrostratigraphic units, and groundwater production data, were used to develop the conceptual groundwater model and calibrate the numerical model under both steady-state and transient conditions.
The existing numerical groundwater flow model was updated with current mine plans and used to predict dewatering rates required to facilitate safe and efficient open pit and underground mining. The calibrated model predicts that total annual dewatering rates from the open pits will range from approximately 400 to 600 gpm (25 to 38 L/sec) and average around 500 gpm (32 L/sec). The timing and volume of extracted groundwater from the open pits is expected to be manageable.
16.2Underground Mining Methods
The Haile underground consists of three deposits that are extensions of the open pit and are named respectfully Horseshoe, Ledbetter, and Palomino Underground (Figure 15-1). Access to the three mines is via portals within the open pits with: Horseshoe via Snake Pit and Ledbetter via Ledbetter. Palomino is accessible via a twin decline from Horseshoe and a single decline from Ledbetter.
The primary means of extraction method is transverse sublevel open stoping (long hole). Stopes dimensions vary from 10 m, 15m, and 20m widths with variable strike lengths dependent upon mineralization grade along with geological and geotechnical conditions. All material haulage out of the mines will be performed with underground articulated haul trucks with material passes placed in key zones in Horseshoe and Palomino. Backfilling of the stopes will consist of Cemented Rock Fill, Unconsolidated Rock Fill, and a mixture of the two (70% Cemented Rock Fill and 30% Unconsolidated Rock Fill). Figure 15-1 shows the location of the underground deposits in relation to each other.
16.2.1Cut-off Grade Calculations
Current estimated operational unit costs per ore tonne and the calculated gold Cut-off Grade is shown in Table 16-17. The mines are designed using a gold cut-off grade of 1.86 g/t for all stopes. Reserves include incremental development ore at gold cut-off grade of 0.66 g/t.
Table 16-17: Underground Cut-off Grade Calculation
| | | | | | | | | | | | | | |
Parameter | Operating CoG | Marginal Development
CoG | Unit | |
Mining cost (1) | 76.95 | - | US$/t | |
Process cost | 21.41 | 21.41 | US$/t | |
Tailings | 1.88 | 1.88 |
| |
G&A | 11.81 | 11.81 | US$/t | |
Total Cost | $112.05 | $35.10 | US$/t | |
Gold price | 2,200.00 | 2,200.00 | US$/oz | |
Average Au mill Recovery (2) | 85% | 75% |
| |
Smelting & Refining | 3.00 | 3.00 | US$/oz | |
CoG | 1.86 | 0.66 | g/t | |
| | | | | | | | |
Released: March 27, 2026 | | Page 184 of 275 |
| | | | | | | | |
NI 43-101 Technical Report – Haile Gold Mine, South Carolina, United States |
| |
| |
Source: OceanaGold, 2025
(1) Includes backfill
(2) Average stated. Variable recovery is expected based on head grade based on the following equation: (1-(0.2152*Au grade^-0.3696)) + 0.025
16.2.2Underground Geotechnical
Rock Quality Data
While HGM regularly collects RQD on all drilled holes, detailed geotechnical data for rock-mass characterization and measurement of geologic fabric were collected in drilling campaigns in the following years:
•Golder, 2010
•SRK, 2016 and 2017 (2 campaigns)
•CNI, 2023
•CNI, 2024
•CNI, 2025
The purpose of the geotechnical drilling campaigns was to provide data to be used in feasibility studies. All data from these campaigns were combined into a single database from which a geotechnical block model was developed by CNI (most recently updated in 2025). The geotechnical block model extends across most of the HGM property and includes all underground mining targets. A total of 1,502 core holes were used in the model which had both geological and geotechnical information. All drillholes were logged for rock quality designation (RQD) data, while a smaller subset of the core holes was logged for detailed geotechnical data, including parameters for the calculation of the Modified Rock Tunneling Quality Index Q’ (Barton, Lien, and Lunde, 1974). Table 16-18 presents a summary of drillhole data within the targeted mining areas.
Table 16-18: Drillhole Data Used in Underground Geotechnical Block Models
| | | | | | | | | | | | | | | | | |
Location | RQD | Q' | |
DH # | Metres | DH # | Metres | |
Horseshoe | 422 | 116,348.6 | 13 | 3,920.4 | |
Ledbetter | 483 | 124,000.1 | 22 | 5,763.4 | |
Palomino | 248 | 88,670.6 | 15 | 6,347.0 | |
Mill Zone | 179 | 32,580.6 | 5 | 839.9 | |
Source: CNI, 2025
The geotechnical block model has been the basis for the review of the Horseshoe UG mine design and the geotechnical evaluation for the Palomino and Ledbetter UG mine feasibility studies. Distributions of the rock quality (Q) from the geotechnical block model are presented in Figure 16-10.
| | | | | | | | |
Released: March 27, 2026 | | Page 185 of 275 |
| | | | | | | | |
NI 43-101 Technical Report – Haile Gold Mine, South Carolina, United States |
| |
| |
Source: CNI, 2025
Figure 16-10: Rock Quality Distributions within the HUG, PUG, and LUG MSO Shapes
Oriented Core Data
Discontinuity orientation data from drillholes was collected using acoustic televiewer survey and the REFLEX ACT core orienting system. Drillholes logged for discontinuities include:
•Horseshoe: 67 drillholes
•Palomino: 76 drillholes
•Ledbetter: 120 drillholes
Lower hemisphere, equal areas Schmidt nets are presented for the underground mines in Figure 16-11. While the structural geology is similar at all deposits, Palomino is less intensely foliated and has a shallower orientation to the foliation compared to Horseshoe and Ledbetter. Furthermore, there is less steeply dipping structure at Palomino than at Horseshoe and Ledbetter.
| | | | | | | | |
Released: March 27, 2026 | | Page 186 of 275 |
| | | | | | | | |
NI 43-101 Technical Report – Haile Gold Mine, South Carolina, United States |
| |
| |
Source: CNI, 2025
Figure 16-11: Horseshoe, Palomino, and Ledbetter UG Stereonets
In Situ Stress Measurement
The 2017 field program led by SRK included in situ stress measurements which were conducted by Agapito Associates, Inc. (AAI) using a downhole overcoring technique developed by Sigra, Pty. (Sigra) of Brisbane, Australia. A summary of the in situ stress measurements is presented in Table 16-19. The major horizontal stress (Sigma 1) is more than twice the vertical stress (Sigma 3).
| | | | | | | | |
Released: March 27, 2026 | | Page 187 of 275 |
| | | | | | | | |
NI 43-101 Technical Report – Haile Gold Mine, South Carolina, United States |
| |
| |
Table 16-19: In Situ Stress Measurement Summary
| | | | | | | | | | | | | | |
Item | Sigma 1 | Sigma 2 | Sigma 3 | |
Bearing/Plunge (Deg.) | 088/00 | 178/00 | 178/90 | |
Stress Gradient (MPa/m) | 0.0561 | 0.0376 | 0.0259 | |
Source: OceanaGold, 2020
Rock Strength Laboratory Testing
A summary of rock strength laboratory testing is presented in Table 16-20.
Table 16-20: Summary of the Laboratory Testing
| | | | | | | | | | | | | | | | | | | | | | | | | | |
Year | Laboratory | Rock Type | Uniaxial Compression Strength (UCS) | UCS (with E&v) | Triaxial Compression Strength | Disk Tension | Small Scale Direct Shear | Total |
2009 | ATT | Metasediments | 1 | 1 | 4 | | 2 | 13 |
(Golder OP) | Dike | 1 | 1 | - | - |
Metavolcanics | 2 | 1 | - | - |
2011 | ATT | Metasediments | 12 | - | - | - | - | 12 |
(Golder UG) | Dike |
Metavolcanics |
2016 | Agapito | Metasediments | 7 | 8 | 5 | 1 | 3 | 37 |
(SRK UG) | Dike | 1 | 1 | - | - | 1 |
Metavolcanics | 2 | 2 | 3 | 1 | 2 |
*2017 | Agapito | Metasediments | 11 | 9 | 10 | 10 | 6 | 125 |
(SRK UG) | Dike | 3 | 4 | - | 2 | 1 |
Metavolcanics | 21 | 16 | 15 | 9 | 8 |
2017 | CNI | Metasediments | - | - | - | - | 7 | 18 |
(CNI) | Dike | - | - | - | - | 5 |
Metavolcanics | - | - | - | - | 6 |
2020 | CNI | Metasediments | - | - | 13 | 23 | - | 113 |
(CNI) | Dike | - | - | 15 | 30 | - |
Metavolcanics | - | - | 16 | 16 | - |
2023 | CNI | Metasediments | 3 | 2 | 5 | 6 | 5 | 59 |
(CNI) | Dike | - | - | - | - | - |
Metavolcanics | 6 | - | 12 | 17 | 3 |
2025 | CNI | Metasediments | - | 2 | 3 | 5 | 1 | 33 |
(CNI) | Dike | - | 2 | 3 | 5 | - |
Metavolcanics | - | 2 | 3 | 5 | 2 |
Total | 70 | 51 | 107 | 130 | 52 | 410 |
| | | | | | | | |
Released: March 27, 2026 | | Page 188 of 275 |
| | | | | | | | |
NI 43-101 Technical Report – Haile Gold Mine, South Carolina, United States |
| |
| |
Source: SRK, 2017 & CNI, 2025
Rock-Mass Characterization
The properties have similar geology consisting of metasediments and metavolcanics (dacite, rhyodacite, intrusive breccia, basement volcanics) overlain by some volcanic tuff, coastal sands, and saprolite. At Horseshoe, mineralization is predominantly hosted within the metasediments, whereas the ore at Palomino and Ledbetter is hosted within both the metasediments and metavolcanics (rhyodacite and dacite; intrusive breccia at Ledbetter). As presented in Figure 16-12 and Figure 16-10, most of the rock quality is of fair rock quality using Barton’s rock quality classification. In general, the metavolcanics are better rock quality compared to the metasediments, due to less intense foliation within the metavolcanics compared to the metasediments.
Source: CNI, 2025
Figure 16-12: HUG, PUG, and LUG Rock Qualities by Rock Type
Horseshoe Underground Geotechnical Domains
A northwest-southeast section view through the Horseshoe Mine is illustrated in Figure 16-13. The upper elevations contain thin layers of Coastal Sands and Saprolite underlain by the basement rocks of MS and MV where the metavolcanics consist of Dacite and Rhyodacite. The upper
| | | | | | | | |
Released: March 27, 2026 | | Page 189 of 275 |
| | | | | | | | |
NI 43-101 Technical Report – Haile Gold Mine, South Carolina, United States |
| |
| |
elevations (nominal 100 m thick) of the metavolcanics beneath the saprolite are more fractured and weathered than the deeper metavolcanics. The mineralized zone is mostly within the metasediments. Most of the capital infrastructure is within the metavolcanics.
Source: CNI, 2025
Figure 16-13: Generalized Geotechnical Cross Section – Horseshoe (Looking NE)
Palomino Underground Geotechnical Domains
A northwest-southeast section view through the Palomino Mine is illustrated in Figure 16-14. The upper elevations contain thin layers of Coastal Sands and Saprolite underlain by the basement rocks of MS and MV where the metavolcanics consist of Rhyodacite and Dacite. The upper elevations (nominal 100 m thick) of the metavolcanics beneath the saprolite are tuffaceous and more fractured and weathered than the deeper metavolcanics. The mineralized zone is predominantly in Rhyodacite. Most of the capital infrastructure is within the metavolcanics (Dacite).
| | | | | | | | |
Released: March 27, 2026 | | Page 190 of 275 |
| | | | | | | | |
NI 43-101 Technical Report – Haile Gold Mine, South Carolina, United States |
| |
| |
Source: CNI, 2025
Figure 16-14: Generalized Geotechnical Cross Section – Palomino (Looking NE)
Ledbetter Underground Geotechnical Domains
A northwest-southeast section view through the Ledbetter Mine is illustrated in Figure 16-15. The upper elevations contain thin layers of Coastal Sands and Saprolite underlain by the basement rocks of metasediments (MS) and metavolcanics (MV) where the metavolcanics consist of Intrusive Breccia and Dacite. The mineralized zone of Lobe 1 is predominantly in the Intrusive Breccia. Dikes trace throughout the area and bound the northern side of the Lobe 1 mineralization. Lobe 3 mineralization is within metasediments and divided between dikes. Most of the capital infrastructure is within the metasediments and basement volcanics.
| | | | | | | | |
Released: March 27, 2026 | | Page 191 of 275 |
| | | | | | | | |
NI 43-101 Technical Report – Haile Gold Mine, South Carolina, United States |
| |
| |
Source: CNI, 2025
Figure 16-15. Generalized Geotechnical Cross Section - Ledbetter (Looking NE)
Rock Strengths
Laboratory uniaxial compression strength test (UCS) results show that the strength of the metasediment rocks are medium-strong (UCS = 45 MPa), the metavolcanic rocks are very strong (UCS = 140 MPa), and the dike rocks are also very strong (UCS = 139 MPa). Intact strength properties are presented in Table 16-21.
Table 16-21: Summary of Strength Properties (mi and σci)
| | | | | | | | | | | | | | |
Geotechnical Unit | Density (kg/m3) | Intact Strength Properties |
σci (MPa) | σt (MPa) | mi |
Metasediments | 2791 | | 45.0 | | 6.7 | | 10.6 | |
Metavolcanics (Dacite + Rhyodacite + Intrusive Breccia) | 2737 | | 139.7 | | 8.4 | | 14.0 | |
Dike | 2786 | | 138.6 | | 11.7 | | 10.2 | |
Source: CNI, 2025
| | | | | | | | |
Released: March 27, 2026 | | Page 192 of 275 |
| | | | | | | | |
NI 43-101 Technical Report – Haile Gold Mine, South Carolina, United States |
| |
| |
Stope Design Parameters
Transverse longhole stope (LHS) mining has been selected as the mining method for all sites. The LHS method requires a top cut, which is used as a drilling platform, and a bottom cut, which is used as a mucking level. The pillar between the top cut and the bottom cut is excavated by initiating a small vertical opening (slot raise), and then by line blasts that progressively open a large excavation with four walls (two side walls and two end walls) and a back (roof). All ore is drawn from the bottom cut sublevel. Backfill is placed to fill the void space. Backfilled pillars can then be used as the sidewalls for subsequent secondary stopes. Stopes that have total strike lengths in excess of their stable length can be panelled such that consolidated backfill is placed once the stope is at its maximum stable length. Subsequent panels can be re-slotted against the poured backfill and stoping can re-commence until the entire strike length of the stope has been mined. Risks associated with subsidence are generally eliminated due to the placement of backfill in the completed stopes. The total open stope height is typically 25 metres, with the topcut drift above the open stope, resulting in a full exposure height of 30 metres (sill-to-back). Stope panel dimensions currently vary between the three projects:
•Horseshoe: 15 to 20 m wide x 18 to 25 m high (23 to 30 m high sill to back) x maximum 25 m long; stopes below the 925 level are reduced to 15 m wide.
•Palomino: 15 m wide x 25 m high (30 metres high sill to back).
oLengths vary by rock type and mining level
•Ledbetter
oLobe 1: 15 metres wide x 25 metres high (30 metres high sill to back)
oLobe 3: 10 metres wide x 25 metres high (30 metres high sill to back)
oLengths vary by mining level
Stability Graph Method for Stope Dimensions
The Mathews Stability Graph Method (1980) was used to evaluate stope dimensions at all sites. This method is an empirical design tool based on case histories from hard rock mines which typically have good to very good quality rock.
The Stability Graph method accounts for key factors influencing open stope design, including rock-mass strength and structure, stresses surrounding the opening, and the shape and orientation of the stope. The analysis assumes the following:
•Stress field orientations and magnitudes as summarized in Table 16-19
•Q’ based on the 75% reliability values from modelled blocks within each mining sublevel
•Stopes oriented at 330 degrees azimuth alignment for Horseshoe and Palomino, and 317 degrees azimuth alignment at Ledbetter
•Flat stope backs and vertical stope walls
•Stope walls oriented approximately parallel to the primary joint orientation
•Stopes of 15 to 20 m width at Horseshoe, 15 m width at Palomino, and 10 to 15 m width at Ledbetter.
Mathews Stability Graph Results
Each mining sublevel was analyzed to predict maximum stable stope configurations by rock type. The stability charts updated by Hutchinson and Diederichs (1996) were utilized for all stope dimension evaluations. For non-supported surfaces such as end walls and side walls, it is
| | | | | | | | |
Released: March 27, 2026 | | Page 193 of 275 |
| | | | | | | | |
NI 43-101 Technical Report – Haile Gold Mine, South Carolina, United States |
| |
| |
recommended that the upper boundary of the transition zone between stable and caving cases be used for design (Hutchinson & Diederichs, 1996). For stope backs, the stability number was plotted to the stable with support line and assumes effective cable bolt support across the stope spans. Stopes were optimized for length for each 30-metre stope sublevel while maintaining constant stope widths. With effective support installed within stope backs, stability is controlled by sidewall dimensions. Results of the Mathews stability graph analyses for side and end walls by mining site are presented in Figure 16-16 through Figure 16-18.
Source: CNI, 2025
Figure 16-16: Stability Graph Results – Horseshoe
| | | | | | | | |
Released: March 27, 2026 | | Page 194 of 275 |
| | | | | | | | |
NI 43-101 Technical Report – Haile Gold Mine, South Carolina, United States |
| |
| |
Source: CNI, 2025
Figure 16-17: Stability Graph Results – Palomino
Source: CNI, 2025
Figure 16-18: Stability Graph Results – Ledbetter
| | | | | | | | |
Released: March 27, 2026 | | Page 195 of 275 |
| | | | | | | | |
NI 43-101 Technical Report – Haile Gold Mine, South Carolina, United States |
| |
| |
Longhole Stope Mining Sequencing
A staggered 1-3-5 sequence will be used. The sequence offers the advantage of allowing several primary stopes to be mined simultaneously, which increases productivity. To maintain pillar stability, both sides of a pillar cannot be mined simultaneously. Stopes should be staggered such that panels are backfilled before opening the nearest stope in section. By utilizing this sequence with a staggered leading panel, a 3x pillar width (of rock or backfill) is maintained between concurrently open stope panels. Furthermore, one full stope sublevel must be mined above a secondary pillar before recovering it. Stope top cut and bottom cut development cannot commence until the adjacent stopes are filled to the entire vertical extent.
Access Pillars and Sill Pillars
To minimize mining-induced damage to long-term access drifts (footwall drives), the setback distances used in the design for all properties include:
•Haulage setback of 18 metres to 24 metres from stopes
•Main ramp setback of 64 metres to 70 metres from stopes
Sill pillars are planned at Horseshoe between the 825 and 850 Levels and between the 900 and 925 Levels to divide stoping blocks so that the uppermost stopes may be brought into production prior to completing development to the lower levels. Production development for Palomino and Ledbetter is currently sequenced so that sill pillars are not required.
Backfill
To achieve full recovery of the orebodies, all primary stopes must be backfilled with consolidated fill material. Stope panels will be backfilled with cemented rock backfill (CRF) which are trucked into nearby stockpiles and then moved via loader into open stopes to fill them to their original top cut sill elevation and then top cuts can be compact filled to achieve tight filling to the back.
The purpose of the CRF is to support and confine the sidewalls of primary stopes and allow subsequent stope panels to be re-slotted against CRF endwalls. Consequently, the CRF must remain stable at a full vertical stope height when adjacent secondary stopes are opened, or when re-slotting a stope panel. CRF strength estimates were calculated using the frictionless wedge model proposed by Mitchell et al. (1982). For a 30-metre total exposed wall height (from sill of bottom cut to back of top cut), 600 Kpa is required to achieve a 1.5 factor of safety.
Ground Support and Drift Stability
Ground support varies based on the permanence and exposure of each individual mine opening. In general, discrete support requirements have been established for permanent development and production mining headings.
Horseshoe Mine Permanent Support (Decline and Footwall Drives)
Permanent development at Horseshoe is mostly supported using galvanized Split Set (SS-46) friction stabilizers (1.8-metres in ribs; 2.4-metres in back) and #8 rebar (2.4-metres in back). Some areas of the mine do not currently have the rebar bolts installed to meet the standard and are more susceptible to corrosion. However, a plan is being developed to install the rebar bolts in all areas.
All bolting strategies achieve a safety factor exceeding 1.5 based on kinematic analyses. All advancing faces are supported with 1.8-metre friction bolts and mesh.
| | | | | | | | |
Released: March 27, 2026 | | Page 196 of 275 |
| | | | | | | | |
NI 43-101 Technical Report – Haile Gold Mine, South Carolina, United States |
| |
| |
A majority of all development has a rock quality, Q rating, greater than 2. Consequently, most development at Horseshoe will not require shotcrete with the exception of areas that have high exposure to equipment and personnel and warrants additional surface support.
Horseshoe Mine Temporary Support (Production Headings and Ore Drives)
The backs and sidewalls of ore drives and slot drives will be supported with SS-46 black friction bolts of 1.8-metre length in ribs and 2.4-metre length in backs, using a nominal 1.1-metre bolt spacing. These drives are not expected to have a service life greater than one year, and as a result do not require corrosion protection. Surface support includes shotcrete when poor rock quality is encountered and is prescribed by the geotechnical engineer.
Cable bolts are installed at all lateral development intersections, spans wider than 7.0 metres, and open stope backs (depending on the span and ground conditions). The ground support design includes single strand cables (7.3-metre length) installed in stope crowns at densities of 0.25 - 0.38 cables per metre squared. Plating is conducted as needed.
The 7.3-metre cable bolts are used for stope brows, or in lateral development with spans exceeding 7.0 metres (e.g., decline passing bays or 3-way intersections).
Palomino Mine Permanent Support (Decline and Footwall Drives)
The proposed ground support for Palomino and Ledbetter is presented in Table 16-22. Support requirements are based on both kinematic and empirical methods. All bolting layouts achieve a safety factor exceeding 2.0 based on kinematic analyses. All advancing faces are supported with
1.8 m friction bolts and mesh.
Nearly all development has a rock quality, Q rating, greater than 2. Consequently, most development at Palomino and Ledbetter will not require shotcrete.
| | | | | | | | |
Released: March 27, 2026 | | Page 197 of 275 |
| | | | | | | | |
NI 43-101 Technical Report – Haile Gold Mine, South Carolina, United States |
| |
| |
Table 16-22: Summary of Permanent Support Categories for Palomino and Ledbetter
| | | | | | | | | | | | | | | | | |
Support Category | Q value | Estimated Rock Mass Rating (RMR) 76\GSI | Estimated % of Development | Advance Length (m) | Support Type |
Category 1 | > 2.0 | > 50 | 91 | | 4.0 | | 2.4-metre #7 rebar on 1.2-metre x 1.2-metre spacing with welded mesh (10 cm / 6 Ga.) to within 1.5 metres of sill |
Category 2 | 0.7 - 2.0 | 41 - 50 | 3 | | 3.5 | | 2.4-metre #7 rebar on 1.2-metre x 1.2-metre spacing with welded mesh (10 cm / 6 Ga.) and 5 cm of shotcrete to within 1.5 metres of sill |
Category 3 | 0.07 - 0.7 | 20 - 40 | 3 | | 2.5 | | 10 cm of fiber reinforced shotcrete (FRS) and 2.4-metre #7 rebar on 1.2-metre x 1.2-metre spacing with welded mesh (10 cm / 6 Ga.) down to sill |
Category 4 | < 0.07 | < 20 | 3 | | 1.2 | | 15 cm of FRS and 2.4-metre #7 rebar on 1.2-metre x 1.2-metre spacing with welded mesh (10 cm / 6 Ga.) down to sill with 6 count #7 rebar arch spaced each 2.4 metres and fully encased in shotcrete; forepoling (spiling) |
Source: CNI, 2025
Palomino Mine Temporary Support (Production Headings and Ore Drives)
Temporary ground support for stope crowns and production ore drives at Palomino is summarized in Table 16-23. These drives are not expected to have a service life greater than one year, and as a result, do not require corrosion protection and friction bolts are an acceptable alternative to rebar bolts. Surface support includes shotcrete when rock quality with Q less than 1.0 is encountered (Category 2).
Cable bolts are installed at all lateral development intersections, spans wider than 7.0 metres, and open stope backs (depending on the span and ground conditions). The ground support design includes single strand cables installed in stope crowns at a minimum density of 0.25 cables per metre squared. Plating will be conducted as needed.
Minimum 6.3 m length cable bolts are used for stope brows, or in lateral development with spans exceeding 7.0 metres (e.g., decline passing bays or 3-way intersections).
| | | | | | | | |
Released: March 27, 2026 | | Page 198 of 275 |
| | | | | | | | |
NI 43-101 Technical Report – Haile Gold Mine, South Carolina, United States |
| |
| |
Table 16-23: Summary of Production Support Categories for Palomino and Ledbetter
| | | | | | | | | | | | | | | | | |
Primary / Secondary | Support Category | Q value | Estimated RMR76\GSI | Advance Length (m) | Support Type |
Primary Support | Category 1 | > 1.0 | > 44 | 4.0 | | 2.4-metre #7 rebar or 12-ton-capacity inflatable friction bolts(1) on 1.2-metre x 1.2-metre spacing with welded mesh (10 cm / 6 Ga.) to within 1.5 metres of sill |
Category 2 | 0.7 - 1.0 | < 44 | 2.5 | | 2.4-metre #7 rebar(1) on 1.2-metre x 1.2-metre spacing with welded mesh (10 cm / 6 Ga.) and 5 cm of shotcrete to within 1.5 metres of sill |
Secondary Support | 7.3- to 8.3-metre cable bolts (single strand) on 2.0-metre x 2.0-metre spacing in the backs (minimum 3 each per row); installed prior to stoping |
Source: CNI, 2025
(1) 12 Ton Capacity Friction Bolts are Acceptable Alternative to Rebar in Headings with less than 1 year service life
Intersection Support
Intersections will include cable bolt support (7.3-metre single strand cables) in addition to the primary support.
16.2.3Mine Design
Minable stope shapes are designed using Deswik Stope Optimizer in accordance with industry standards. Dimensions of the stopes for the mines are shown in Table 16-24.
Table 16-24: Underground Stope Design Dimensions
| | | | | | | | | | | | | | |
Deposit | Width
(m) | Height
(m) | Strike
(m) | |
Horseshoe 925 RL & Above | 20 | | 25 | | 20-35 | |
Horseshoe 900 RL & Below | 15 | | 25 | | 20-35 | |
Palomino | 15 | | 25 | | 20-35 | |
Ledbetter | 15 | | 25 | | 20-35 | |
Ledbetter Lobe Three | 10 | | 25 | | 10 | | |
Source: OceanaGold, 2025
The underground mine design is performed by HGM staff using planning software and internal guidance based upon industry standards. Various site-specific information such as mining equipment sizes, ground support standards, and site historic performance is taken into consideration when generating mine designs. Specific details on typical design parameters are described in section 16.2 Underground Mining Methods.
Horseshoe consists of three portals located on the northern side of the Snake Open Pit, one of which is used for primary access and material haulage. Palomino will consist of a twin decline
| | | | | | | | |
Released: March 27, 2026 | | Page 199 of 275 |
| | | | | | | | |
NI 43-101 Technical Report – Haile Gold Mine, South Carolina, United States |
| |
| |
system from the 925 level in Horseshoe and a single decline from the 925 level in Ledbetter. Ledbetter will consist of a portal from the western side of the Ledbetter Open Pit.
Extraction sequence is as follows: Primary stopes are mined first in the sequence which are backfilled with Cemented Rock Fill. Secondary stopes lie between the primaries and are backfilled with mixture fill or unconsolidated rock fill depending upon the stope’s location. Refer to Figure 16-19. Stope extraction is typically sequenced to be mined from bottom up as can be seen in Figure 16-20.
Source: OceanaGold, 2025
Figure 16-19: Long Hole Stoping Method Schematic
Source: OceanaGold, 2025
Figure 16-20: Typical Stoping Sequence
| | | | | | | | |
Released: March 27, 2026 | | Page 200 of 275 |
| | | | | | | | |
NI 43-101 Technical Report – Haile Gold Mine, South Carolina, United States |
| |
| |
Backfill consists of CRF, URF or a combination of the two. CRF is produced via a batch plant. The batch plant consists of an aggregate hopper, two cement silos, conveyor belt, and paddle mixer. Backfill is hauled from the surface batch plant to stockpile bays underground where it is then placed into the stopes via loading units. In late 2027 the Horseshoe backfill plant is planned to be upgraded, to increase capacity from 900 m³ to 1,400 m³ per day to accommodate backfilling at Horseshoe and Palomino. A second plant will be constructed for Ledbetter with a 1,400 m³ per day capacity.
Typical CRF mixture used underground is a low strength recipe that 5% cement binder. Sill level stopes are located only in the Horseshoe deposit on the 925 and 850 levels, which are levels that will have stopes directly below to be mined out later in the mine plan and will utilize a high strength CRF mix with 10% cement binder. Refer to Figure 16-29 for locations of the sill levels.
Unconsolidated Rock Fill is placed in the last stope of the secondary stope line. A combination of 70% Low Strength CRF by void volume containing 5% cement binder and 30% URF by void volume is used in all other secondary stope lines. Figure 16-21 is an illustration of a typical secondary stope line’s backfill.
Source: OceanaGold, 2025
Figure 16-21: Typical Secondary Stope Line Backfill
16.2.4Geochemical Classification
The current underground mine design includes 3.2 Mt of development rock and 11.7 Mt of ore. Development rock is approximately 21% of the total material to be mined in the underground mine plan. As underground development is advanced, metavolcanic material can be utilized as unconsolidated rock fill (URF). Metavolcanic material is a small proportion of URF and most URF material is sourced from Green Non-PAG material from the open pit. All development rock from underground mining that comes to surface is handled as Red PAG, due to the small quantity and the logistics of testing required to classify and route it according to the geochemical classification. During mining, the development rock from the underground mine is hauled to surface and stockpiled on a clay liner before open pit mining operations moves it to West PAG OSA.
Most of the development rock generated from underground mining will be for mine access and ventilation development. Access and ventilation workings in the current mine design will intersect the metavolcanics unit, which was extensively characterized by geochemical testing and is not believed to present a significantly greater risk for Acid Rock Drainage Metal Leaching than the same
| | | | | | | | |
Released: March 27, 2026 | | Page 201 of 275 |
| | | | | | | | |
NI 43-101 Technical Report – Haile Gold Mine, South Carolina, United States |
| |
| |
material in other areas of the Project. However, characterization is recommended to obtain confirmatory data on the geochemical properties of the new mining areas, to apply to geochemical modeling for water quality predictions.
CRF and URF are used as backfill material for the current underground mine design. CRF is produced at the batch plant on site with aggregate comprised of bedrock lithologies classified as Green (Non-PAG) overburden from open pit mining. The URF is also comprised of Green (Non-PAG) bedrock overburden. SRK completed geochemical characterization of CRF samples (SRK, 2017), but upon further review, found that the overburden materials collected for CRF testing were more representative of Red PAG rock than Green Non-PAG rock. Because the aggregate sourced for CRF is limited to Green Non-PAG rock, the characterization results are not representative of the CRF and are not presented in the geochemical characterization reports (Schafer, 2019 and Oceana Gold, 2024).
16.2.5Mining Operations
Both waste and ore are trucked out of the underground utilizing 50 tonne articulated trucks and to respective stockpiling areas. Before ore is trucked to the mill, first pass tramp metal removal is performed currently by an excavator picking through the ore material removing large metal such as ground support, drilling consumables and other items. A metal removal plant is planned to begin construction in 2026 for the Horseshoe Surface Infrastructure with a second facility to be constructed for Ledbetter Underground to be constructed in 2028 and will then be used for tramp metal removal. After removing the metal, the ore is then rehandled by open pit haul trucks to the ROM pad. Waste material is rehandled by the open pit haul trucks to waste dump facilities.
Palomino’s material during development will be hauled out of the twin decline and through Horseshoe’s main portal until the ramp connection to Ledbetter is established, estimated to be completed in 2029. Once completed, underground articulated trucks will move material out via the ramp to Ledbetter and out of the Ledbetter portal.
Material from Ledbetter will be trucked to the surface via the decline to Ledbetter.
Howden’s VentSim software is utilized to model ventilation scenarios and airflow requirements for all three underground deposits. Three portals are used for ventilation at Horseshoe, two as fresh air intakes and one for exhaust. Two primary fans on the exhaust side pull of air out of portal two. Fresh air is pulled down the main decline from portal one and fresh air drop raises (4 m x 6 m) via portal three to the 900 level. From there, air is drawn down the decline to the bottom of the mine. Delivery of air to the working headings is accomplished via auxiliary fans on the main decline that pickups up fresh air and routes it to the face via ventilation ducting. The air is then exhausted back along the footwall drives to the return air raises (4 m x 6 m) and out of Portal Two. Refer to Figure 16-22 for a typical overview of level ventilation and Figure 16-23 for the underground ventilation model.
| | | | | | | | |
Released: March 27, 2026 | | Page 202 of 275 |
| | | | | | | | |
NI 43-101 Technical Report – Haile Gold Mine, South Carolina, United States |
| |
| |
Source: OceanaGold, 2026
Figure 16-22: Typical Level Ventilation Overview
Ventilation for Palomino will have fresh air will be pulled from a fourth portal located near Horseshoe’s two ventilation portals and the decline that connects to Horseshoe on the 925 level down the twin decline where it will be pushed along the decline to the level accesses. Auxiliary fans will be used to deliver air to the headings in a similar method to the one described above for Horseshoe. Air is exhausted thru a series of return air raises up or down to the 800 level where two primary fans will pull air out the ventilation shaft located to the south of Snake Open Pit.
Ledbetter’s fresh air will be pulled from the Ledbetter Portal down the decline, and a vent raise to the surface with two primary fans). Delivery of air to the heading using auxiliary fans is accomplished via the method described for Horseshoe. Air is exhausted via a series of raises that connects to an exhaust raise to the surface.
| | | | | | | | |
Released: March 27, 2026 | | Page 203 of 275 |
| | | | | | | | |
NI 43-101 Technical Report – Haile Gold Mine, South Carolina, United States |
| |
| |
Source: Stantec, 2025
Figure 16-23: Underground Life of Mine Ventilation Model
16.2.6LOM Production Schedule
The underground LoM schedule was generated using Deswik’s scheduling software, as shown in Figure 16-24 and Table 16-25 is derived from OceanaGold’s onsite documentation for LoM Planning rates based on historical data and first principles. The underground mine is expected to produce 11.8 million ore tonnes and 3.2 million waste tonnes. The HUG production profile extends out to 2031 and can be seen in Table 16-26. PUG begins development in 2026 and reaches first ore in 2028, seen in Table 16-27. LUG portal construction commences in 2028, with first development ore expected in 2029 and steady-state production expected in 2030 as reflected in Table 16-28.
| | | | | | | | |
Released: March 27, 2026 | | Page 204 of 275 |
| | | | | | | | |
NI 43-101 Technical Report – Haile Gold Mine, South Carolina, United States |
| |
| |
Source: OceanaGold, 2025
Figure 16-24: Annual Underground Ore Production Schedule
Table 16-25: Underground Production Summary
| | | | | | | | | | | | | | | | | |
Year | Ore Tonnes
(Mt) | Au
(g/t) | Waste Tonnes
(Mt) | Total Tonnes
(Mt) | |
2026 | 0.73 | | 4.37 | | 0.47 | | 1.20 | | |
2027 | 0.71 | | 4.18 | | 0.46 | | 1.17 | | |
2028 | 1.05 | | 3.30 | | 0.55 | | 1.60 | | |
2029 | 1.16 | | 4.29 | | 0.45 | | 1.61 | | |
2030 | 1.44 | | 3.54 | | 0.52 | | 1.96 | | |
2031 | 1.58 | | 3.31 | | 0.38 | | 1.96 | | |
2032 | 1.48 | | 3.45 | | 0.07 | | 1.55 | | |
2033 | 1.50 | | 3.60 | | 0.13 | | 1.63 | | |
2034 | 1.40 | | 3.33 | | 0.13 | | 1.54 | | |
2035 | 0.70 | | 2.70 | | 0.01 | | 0.71 | | |
LOM Total | 11.75 | | 3.57 | | 3.17 | | 14.93 | | |
Source: OceanaGold, 2025
| | | | | | | | |
Released: March 27, 2026 | | Page 205 of 275 |
| | | | | | | | |
NI 43-101 Technical Report – Haile Gold Mine, South Carolina, United States |
| |
| |
Table 16-26: Horseshoe Underground Production Summary
| | | | | | | | | | | | | | | | | |
Year | Ore Tonnes
(Mt) | Au
(g/t) | Waste Tonnes
(Mt) | Total Tonnes
(Mt) | |
2026 | 0.73 | | 4.37 | | 0.24 | | 0.97 | | |
2027 | 0.71 | | 4.18 | | 0.19 | | 0.90 | | |
2028 | 0.75 | | 3.46 | | 0.18 | | 0.93 | | |
2029 | 0.75 | | 5.02 | | 0.02 | | 0.77 | | |
2030 | 0.75 | | 4.26 | | 0.03 | | 0.78 | | |
2031 | 0.45 | | 4.55 | | 0.00 | | 0.45 | | |
LOM Total | 4.14 | | 4.29 | | 0.66 | | 4.80 | | |
Source: OceanaGold, 2025
Table 16-27: Palomino Underground Production Summary
| | | | | | | | | | | | | | | | | |
Year | Ore Tonnes
(Mt) | Au
(g/t) | Waste Tonnes
(Mt) | Total Tonnes
(Mt) | |
2026 | 0.00 | | 0.00 | | 0.23 | | 0.23 | | |
2027 | 0.00 | | 0.00 | | 0.27 | | 0.27 | | |
2028 | 0.30 | | 2.92 | | 0.21 | | 0.51 | | |
2029 | 0.36 | | 3.01 | | 0.23 | | 0.59 | | |
2030 | 0.15 | | 2.22 | | 0.22 | | 0.37 | | |
2031 | 0.55 | | 2.77 | | 0.17 | | 0.72 | | |
2032 | 0.70 | | 3.10 | | 0.01 | | 0.71 | | |
2033 | 0.72 | | 2.99 | | 0.01 | | 0.73 | | |
2034 | 0.63 | | 3.07 | | 0.00 | | 0.63 | | |
2035 | 0.20 | | 3.02 | | 0.00 | | 0.20 | | |
LOM Total | 3.61 | | 2.96 | | 1.35 | | 4.96 | | |
Source: OceanaGold, 2025
Table 16-28: Ledbetter Underground Production Summary
| | | | | | | | | | | | | | | | | |
Year | Ore Tonnes
(Mt) | Au
(g/t) | Waste Tonnes
(Mt) | Total Tonnes
(Mt) | |
2028 | 0.00 | | 0.00 | | 0.16 | | 0.16 | | |
2029 | 0.05 | | 2.43 | | 0.20 | | 0.25 | | |
2030 | 0.54 | | 2.92 | | 0.27 | | 0.81 | | |
2031 | 0.58 | | 2.84 | | 0.21 | | 0.79 | | |
2032 | 0.78 | | 3.76 | | 0.06 | | 0.84 | | |
2033 | 0.78 | | 4.17 | | 0.12 | | 0.90 | | |
2034 | 0.77 | | 3.54 | | 0.13 | | 0.90 | | |
2035 | 0.50 | | 2.57 | | 0.01 | | 0.51 | | |
LOM Total | 4.00 | | 3.57 | | 1.16 | | 5.16 | | |
Source: OceanaGold, 2025
| | | | | | | | |
Released: March 27, 2026 | | Page 206 of 275 |
| | | | | | | | |
NI 43-101 Technical Report – Haile Gold Mine, South Carolina, United States |
| |
| |
16.2.7Mine Equipment
The mine mobile equipment requirements based on the underground production schedule are summarized in Table 16-29. Additional Ancillary equipment besides the listed production equipment will be required to achieve the production values specified above.
Table 16-29: Mobile Equipment Fleet
| | | | | | | | | | | | | | | | | | | | | | | | | | | | | | | | | | | |
Equipment | 2026 | | 2027 | | 2028 | | 2029 | | 2030 | | 2031 | | 2032 | | 2033 | | 2034 | | 2035 | | Max Units |
9 Yard Loader | 7 | | 8 | | 10 | | 10 | | 11 | | 11 | | 8 | | 8 | | 8 | | 5 | | 11 | |
50 tonne Truck | 8 | | 9 | | 14 | | 15 | | 15 | | 15 | | 11 | | 11 | | 9 | | 3 | | 15 | |
Development Drill | 4 | | 4 | | 6 | | 6 | | 6 | | 5 | | 2 | | 2 | | 1 | | 1 | | 6 | |
Production Drill | 2 | | 3 | | 3 | | 4 | | 4 | | 4 | | 3 | | 3 | | 3 | | 2 | | 4 | |
Cablebolter | 1 | | 2 | | 3 | | 3 | | 3 | | 3 | | 3 | | 2 | | 2 | | 2 | | 3 | |
Raisebore | 1 | | 1 | | 1 | | 2 | | 2 | | 2 | | 2 | | 2 | | 2 | | 2 | | 2 | |
Source: OceanaGold, 2025
16.2.8Hydrogeology and Mine Dewatering
The hydrogeology of the Site is summarized in Section 16.1.9 The Horseshoe underground mine workings will extend to a depth of approximately 1,560 ft (475 m) below ground surface and will be accessed by a decline from Snake Pit. The planned Ledbetter underground mine workings will extend to a depth of approximately 820 ft (250 m) below ground surface and will be accessed by drift development from the Ledbetter main decline. The planned Palomino underground mine workings will extend to a depth of approximately 1,390 ft (424 m) below ground surface and will be accessed via a twin decline from Horseshoe and a single decline from Ledbetter. The planned underground mine developments will intersect the weathered, fractured bedrock and the underlying unweathered/competent bedrock hydrostratigraphic units. As described in Section 16.1.9, weathered, fractured bedrock will likely be the predominant source of groundwater inflows to the underground workings. Annual dewatering of the underground workings will be accomplished by capturing water entering the tunnels and pumping the water to the surface.
Dewatering rates from the combined Horseshoe, Ledbetter, and Palomino underground workings have been estimated using the groundwater numerical model (Section 16.1.9) and range from approximately 370 to 650 gpm (23 to 41 L/sec), with an average rate of 530 gpm (33 L/sec). Estimated dewatering rates from the Horseshoe underground workings from 2026 through 2035 range from approximately 270 to 300 gpm (15 to 26 L/sec), with an average rate of 280 gpm (18 L/sec). Estimated dewatering rates from the Palomino underground workings from 2026 through 2035 range from approximately 90 to 290 gpm (6 to 18 L/sec), with an average rate of 200 gpm (13 L/sec). Estimated dewatering rates from the Ledbetter underground workings from 2028 through 2035, range from approximately 50 to 90 gpm (3 to 6 L/sec), with an average rate of 70 gpm (4 L/sec). The timing and volume of extracted groundwater from the underground workings is expected to be manageable.
| | | | | | | | |
Released: March 27, 2026 | | Page 207 of 275 |
| | | | | | | | |
NI 43-101 Technical Report – Haile Gold Mine, South Carolina, United States |
| |
| |
16.3Combined Production Schedule
Figure 16-25 and Table 16-30 show the combined open pit and underground production schedule annually.
Source: OceanaGold, 2025
Figure 16-25: Annual Open Pit and Underground Production
The schedule has been designed to balance open pit production rates, ore grade, and stockpile buildup against higher-grade underground production that is preferentially feed to the processing plant.
| | | | | | | | |
Released: March 27, 2026 | | Page 208 of 275 |
| | | | | | | | |
NI 43-101 Technical Report – Haile Gold Mine, South Carolina, United States | | |
| |
Table 16-30: Combined Open Pit and Underground Mining Schedule and Processing Schedule
| | | | | | | | | | | | | | | | | | | | | | | | | | | | | | | | | | | | | | | | | | | | |
Description | Description | Unit | 2026 | | 2027 | | 2028 | | 2029 | | 2030 | | 2031 | | 2032 | | 2033 | | 2034 | | 2035 | | 2036 | | LoM Total |
Underground Mining | Ore | Mt | 0.73 | | 0.71 | | 1.05 | | 1.16 | | 1.44 | | 1.58 | | 1.48 | | 1.50 | | 1.40 | | 0.70 | | - | | 11.8 | |
Au Grade | g/t | 4.37 | | 4.18 | | 3.30 | | 4.29 | | 3.54 | | 3.31 | | 3.45 | | 3.60 | | 3.33 | | 2.70 | | - | | 3.57 | |
Contained Au | Moz | 0.10 | | 0.10 | | 0.11 | | 0.16 | | 0.16 | | 0.17 | | 0.16 | | 0.17 | | 0.15 | | 0.06 | | - | | 1.35 | |
Ag Grade | g/t | 1.6 | | 1.4 | | 1.5 | | 1.9 | | 4.4 | | 4.9 | | 7.6 | | 8.3 | | 6.8 | | 7.6 | | - | | 5.0 | |
Contained Ag | Moz | 0.04 | | 0.03 | | 0.05 | | 0.07 | | 0.20 | | 0.25 | | 0.36 | | 0.40 | | 0.31 | | 0.17 | | - | | 1.9 | |
Open-pit Mining(1) | Ore | Mt | 4.38 | | 4.79 | | 1.59 | | 1.03 | | 1.37 | | 2.32 | | 1.18 | | 1.10 | | - | | - | | - | | 17.8 | |
Au Grade | g/t | 2.01 | | 1.91 | | 1.06 | | 1.16 | | 1.16 | | 1.38 | | 1.30 | | 1.06 | | - | | - | | - | | 1.59 | |
Contained Au | Moz | 0.28 | | 0.29 | | 0.05 | | 0.04 | | 0.05 | | 0.10 | | 0.05 | | 0.04 | | - | | - | | - | | 0.91 | |
Ag Grade | g/t | 2.0 | | 2.7 | | 1.9 | | 2.3 | | 2.0 | | 2.1 | | 2.1 | | 3.4 | | - | | - | | - | | 2.3 | |
Contained Ag | Moz | 0.28 | | 0.42 | | 0.10 | | 0.08 | | 0.09 | | 0.16 | | 0.08 | | 0.12 | | - | | - | | - | | 1.3 | |
Strip Ratio | w t:o t | 5.7 | | 5.0 | | 12.0 | | 5.4 | | 2.9 | | 2.4 | | 4.5 | | 2.3 | | - | | - | | - | | 5.1 | |
Waste | Mt | 25.1 | | 23.8 | | 19.2 | | 5.6 | | 3.9 | | 5.6 | | 5.3 | | 2.6 | | - | | - | | - | | 91.0 | |
Total Mining | Ore | Mt | 5.11 | | 5.50 | | 2.64 | | 2.19 | | 2.81 | | 3.90 | | 2.66 | | 2.60 | | 1.40 | | 0.70 | | - | | 29.5 | |
Au Grade | g/t | 2.35 | | 2.20 | | 1.95 | | 2.82 | | 2.38 | | 2.16 | | 2.50 | | 2.52 | | 3.33 | | 2.70 | | - | | 2.38 | |
Contained Au | Moz | 0.39 | | 0.39 | | 0.17 | | 0.20 | | 0.22 | | 0.27 | | 0.21 | | 0.21 | | 0.15 | | 0.06 | | - | | 2.26 | |
Ag Grade | g/t | 1.9 | | 2.5 | | 1.7 | | 2.1 | | 3.2 | | 3.2 | | 5.1 | | 6.2 | | 6.8 | | 7.6 | | - | | 3.4 | |
Contained Ag | Moz | 0.32 | | 0.45 | | 0.15 | | 0.15 | | 0.29 | | 0.41 | | 0.44 | | 0.52 | | 0.31 | | 0.17 | | - | | 3.2 | |
Mill Feed | Ore Feed (Mt) | Mt | 2.91 | | 2.90 | | 2.83 | | 2.86 | | 2.96 | | 2.95 | | 2.78 | | 2.72 | | 2.83 | | 2.70 | | 1.91 | | 30.3 | |
Ore Feed Au (g/t) | g/t | 3.04 | | 2.86 | | 2.67 | | 2.53 | | 2.45 | | 2.67 | | 2.52 | | 2.46 | | 2.11 | | 1.25 | | 0.61 | | 2.35 | |
Ore Feed Ag (g/t) | g/t | 2.1 | | 2.3 | | 2.0 | | 2.1 | | 3.2 | | 3.7 | | 5.1 | | 5.7 | | 4.4 | | 3.6 | | 2.0 | | 3.3 | |
Gold Recovery | % Au | 87.8 | | 86.7 | | 85.5 | | 86.4 | | 86.6 | | 83.8 | | 77.4 | | 77.3 | | 75.7 | | 74.6 | | 69.2 | | 82.7 | |
Silver Recovery | % Ag | 70 | | 70 | | 70 | | 70 | | 70 | | 70 | | 70 | | 70 | | 70 | | 70 | | 70 | | 70 | |
Gold (Au) Produced | Moz | 0.25 | | 0.23 | | 0.21 | | 0.20 | | 0.20 | | 0.21 | | 0.17 | | 0.17 | | 0.15 | | 0.08 | | 0.03 | | 1.90 | |
Silver (Ag) Produced | Moz | 0.14 | | 0.15 | | 0.13 | | 0.13 | | 0.21 | | 0.24 | | 0.32 | | 0.35 | | 0.28 | | 0.22 | | 0.09 | | 2.26 | |
Source: OceanaGold, 2025
(1) Does not include stockpile material
| | | | | | | | |
Released: March 27, 2026 | | Page 209 of 275 |
| | | | | | | | |
NI 43-101 Technical Report – Haile Gold Mine, South Carolina, United States |
| |
| |
17 Recovery Methods
A conventional flotation and cyanide leaching flow sheet is used at HGM. The process commenced commercial operation in 2017 with a nameplate capacity of 2,300,000 t/yr, with a progressive debottlenecking process undertaken to upgrade the plant to be able to treat up to 3,800,000 t/yr dependent on ore competency.
In general, the response of the ore treated to the plant flowsheet has been within expectations with gold deportment and leach extractions observed to be in accordance with that predicted through the original feasibility program.
Leach recovery has been observed to be affected primarily by the concentrate regrind size achieved. Flotation recovery has been impacted from blending oxidized rehandled ore with fresh sulfide ore reducing the effective recovery of sulfides in the flotation circuit. Improved blend control and segregation of feed has led to improved control of flotation and overall recovery.
17.1Processing Methods
The flowsheet and unit operations did not change as part of the upgrades with the LoM target of a nominal 3 Mt/yr expected to be achieved with the expected ore competency and hardness in the plan.
Benchmarking surveys of the grinding circuit were completed in 2017/18 along with power modeling of the circuit. Several external consultants identified the Haile ore requires approximately 30% less energy than that predicted from power modeling and SMC test results. A site-specific comminution model was developed with a strong correlation between SMC test parameters and Bond ball mill work index with SAG specific energy requirements. The work provided confidence to proceed with installation of the pebble crusher in 2018 to improve ability to handle more competent ore expected at depth. Additional surveys were conducted during 2021 on ores regarded from core testing as being amongst the most competent treated at the time to validate the site-specific model.
Operating experience in 2024 in the deeper Ledbetter Phase 2A open pit blended with Horseshoe Underground ore was amongst the most competent material encountered and lead to a noticeable decrease in mill throughput from 460tph to 380tph. A more extensive geometallurgical test program was undertaken with approximately 72 individual 5m core intercepts sent for testing with the Geopyora method to provide a higher density of results for the Ledbetter Phase 3, Snake Phase 3 and Haile Phase 2 pits to model throughput expectations. The effect of this more detailed information, and an increase of more competent underground-sourced ore to 50% of mill feed and further testing of Ledbetter Underground ore sources has led to a reduced throughput expectation in the mill. With use of demonstrated planned utilization factors, mill scheduled rates used are 3 Mta of combined ore over the coming Life of Mine plan with scheduled mill utilization.
The key additions to the process plant since original commissioning included:
•Upgrade to apron feeder motors for the crusher and emergency feeder
•Speed upgrade to the SAG feed conveyor to achieve 600 t/h rate
•Pebble crushing installation on existing SAG mill scats recycle and grate redesign
•Installation of a Nippon Eirich ETM-1500 tower mill (1.2 million watts (MW)) and 10-inch cyclone pack
| | | | | | | | |
Released: March 27, 2026 | | Page 210 of 275 |
| | | | | | | | |
NI 43-101 Technical Report – Haile Gold Mine, South Carolina, United States |
| |
| |
•Installation of an M10000 Isamill (3 MW) and six-inch cyclone pack
•Installation of a larger 14 m diameter high-rate pre-aeration thickener
•Replacement of the flotation tailings thickener feed well and rakes with an Outotec Vane Feedwell system
•Replacement of the cyanide recovery tailings thickener feed well and rakes with an Outotec Vane Feedwell system
•Installation of a second parallel interstage screen in each CIL tank and second carbon safety screen
•Installation of a third cyanide destruction tank and upgrades to the agitators of the existing two tanks
•Modifications to the strip circuit automation, barren tank management and cyanide strength to reduce cycle time to under 10 hours
•Motor upgrades to the flotation tailings and cyanide recovery thickener underflow pumps
•Upgrade to the final tailings pumps in the plant
•Installation of a tailings pump booster station at the tailings storage facility to accommodate the raising of the dam wall and discharge around the entire dam perimeter at higher tonnage
•Implementation of the Andritz expert system to cover SAG mill, ball mill, cyclone, thickening and cyanide destruction circuits to maximize throughput
The process plant consists of the following major components:
•Crushing and conveying
•Storage and stockpiling of ore and reclaim
•Grinding
•Flotation
•Fine grinding of concentrate
•Carbon in leach (CIL) recovery of precious metal values from reground flotation concentrate and flotation tailings
•Acid washing and elution of precious metal values from CIL loaded carbon
•Electrowinning and refining of precious metal value
•Thermal regeneration of eluted carbon and recycle to CIL
•CIL tailing thickening, cyanide recovery, detoxification and pumping of slurry to storage
The following section describes the plant operation currently in operation at Haile. A Run of Mine (ROM) area is provided for storage and re-handling of ore allowing blending to minimize variation of head grade (sulfur and gold) and rock type, into the crusher. Ore is rehandled into the crusher dump pocket by Front End Loader (FEL).
Ore is reclaimed by an apron feeder onto a vibrating grizzly that delivers scalped oversize to the primary jaw crusher to reduce the ore size from RoM to minus 100 mm. Crushed ore is conveyed for surge and storage of the recombined grizzly undersize fines and primary crushed ore in a coarse ore surge bin or diverted on to an open conical emergency stockpile for later reclaim by FEL into a reclaim bin.
Ore is reclaimed from either the surge or reclaim bins, separately or simultaneously, using apron feeders onto a SAG mill feed conveyor belt delivering into the SAG mill feed chute.
Ore is milled in the SAG–Ball Mill-Pebble Crusher (SABC) circuit. The SAG mill operates in closed circuit with a vibrating discharge screen and a pebble return circuit incorporating a surge bin and
| | | | | | | | |
Released: March 27, 2026 | | Page 211 of 275 |
| | | | | | | | |
NI 43-101 Technical Report – Haile Gold Mine, South Carolina, United States |
| |
| |
Sandvik CH-440 cone crusher. The ball mill operates in closed circuit with hydrocyclones to produce the desired grinding product size of 75 microns.
Selected flotation reagents are added in the grinding circuit. A portion of the ball mill circulating load is treated in a flash flotation cell with the concentrate going to the regrind circuit.
The grinding circuit product passes through a bank of bulk rougher flotation cells to recover the balance of the sulfide mineralization. Thereafter, the combined flash and rougher flotation concentrates are reground in a two-stage circuit utilizing an ETM-1500 tower mill in closed circuit with cyclones to a P80 under 40 microns and then followed by an M10000 Isamill in closed circuit with cyclones to a target P80 of 13 microns.
The reground concentrate slurry is dewatered in a high-rate thickener prior to transfer to a tank for the pre-aeration step followed by cyanide leaching in a CIL circuit to dissolve gold and silver and adsorb the precious metal values from the solution onto activated carbon.
The flotation tailings slurry is thickened to recycle process water to the grinding circuit. The thickened tails slurry is combined with the leached concentrate stream and processed in an extension of the carbon in leach circuit to recover any leachable gold and silver contained in the float tail.
The loaded carbon is removed via screens from the CIL circuit and after further treatment by acid washing to reduce calcium scaling, precious metals are stripped with hot caustic-cyanide solution. The gold and silver are recovered by electrowinning from this solution, and the stripped carbon is heated in a kiln under a reducing atmosphere for thermal reactivation of its adsorption capability before being returned to the CIL tanks for reuse. The precious metal sludge from the electrowinning cells is dried and blended with fluxes and smelted to produce gold-silver doré bars, which are the final product of the ore processing facility.
The tailing slurry exiting the CIL circuit is dewatered in a similar thickening stage to the flotation tailings for recovery of the cyanide solution and reduction of the volume of slurry needing to be treated by oxidation of the residual cyanide. The detoxified tailing slurry is pumped for long-term storage in a lined Tailings Storage Facility (TSF) and supernatant water in the pond is recycled for reuse back at the plant.
The plant has facilities for the storage, preparation, and distribution of reagents to be used in the process. Reagents include flotation reagents i.e., sodium isobutyl xanthate (SIBX) and frother, as well as sodium cyanide, caustic soda, flocculant, copper sulfate, ammonium bisulfite, hydrochloric acid, lime and anti-scalants. Small amounts of fresh and potable water make-up are required in the process, but the main water requirements are satisfied by internal recycle from the thickeners and tailings decant water returned from the TSF.
The contact water treatment plant (CWTP) treats contact water from the mine active pits, seepage from the PAG cells and surface water runoff from the active PAG cells. A two-stage process is utilized with pH raised to a target of 9.4 to precipitate out metals followed by clarification for solids removal, then the addition of a metals precipitant to precipitate out other heavy metals. This is followed by clarification, microfiltration, pH adjustment back to a 7 to 8 range and is then discharged to the environment. The WTP utilizes lime from the main plant ring main for pH control along with local mixing of flocculant, coagulants and metals precipitants as required.
| | | | | | | | |
Released: March 27, 2026 | | Page 212 of 275 |
| | | | | | | | |
NI 43-101 Technical Report – Haile Gold Mine, South Carolina, United States |
| |
| |
17.2Processing Flowsheet
The overall simplified process flow sheet for the plant is shown in Figure 17-1.
Source: OceanaGold, 2025
Figure 17-1: Haile Process Flow Sheet
17.3Operational Results
Mill throughput ramped up following plant commissioning with nameplate of 285 t/h achieved within approximately six months. Following identification of key bottlenecks and circuit modeling with external consultants, a pebble crusher was commissioned in July 2018 along with an upgrade to the flotation tailings thickener. Mill throughput was then progressively increased as downstream restrictions were addressed. Production history and annual throughput are shown below in Figure 17-2. Monthly milling rates achieved in the 2020-25 period have varied as a function of ore
| | | | | | | | |
Released: March 27, 2026 | | Page 213 of 275 |
| | | | | | | | |
NI 43-101 Technical Report – Haile Gold Mine, South Carolina, United States |
| |
| |
competency and oxidized clay content in feed between 400 t/h and 479 t/h, while total milled tonnes have been driven by the rate and overall utilization achieved.
Source: OceanaGold, 2025
Figure 17-2: Mill Throughput Performance Since Startup
Mill throughput restrictions are tracked by operations and are characterized by cause. The main drivers of reduced throughput are upstream constraints in the crushing circuit during high rainfall events increasing ore moisture, crushing circuit utilization affected by tramp steel from underground sources, oversized rock management from the open pit, ore competency affecting SAG mill feed rate, pumping capacity constraints in the thickening/final tailings systems or equipment failure.
SAG mill utilization progressively improved since startup from 2017-2021 with unplanned downtime reducing as rectification of circuit design took place to address high wear issues in the plant. Overall mill utilization has been tracking in the 84% to 89% range since startup with significant impact in 2023-2025 from unplanned outages related to the SAG mill drive train, crushing circuit utilization and impacts from tramp steel in the underground ore stream.
A number of changes have been progressively instituted in 2024-2025 aimed at driving mill utilization above 90%:
•Significant overhaul of the primary crusher apron feeder was completed in Q4 2025 to overcome effects of wear on the equipment
•Reduction in the aperture of the primary ROM bin grizzly down to 26” to reduce the effect of blockages downstream and damage to equipment form oversize material
•Modification of the primary crusher discharge conveyor head chute to incorporate a tramp steel magnet to remove rock bolts etc. present in the underground ore source
•Replacement of both the flocculant mixing and storage polyethylene tanks with new units due to developing cracks in the sidewalls necessitating plant outages to repair
| | | | | | | | |
Released: March 27, 2026 | | Page 214 of 275 |
| | | | | | | | |
NI 43-101 Technical Report – Haile Gold Mine, South Carolina, United States |
| |
| |
Engineering rectifications and condition monitoring programs are in place to better forecast failures to minimize future downtime. A 92% overall utilization is considered for the Life of Mine plan. Historical utilization data since start up is shown in Figure 17-3.
Source: OceanaGold, 2025
Figure 17-3: SAG Mill Utilization Since Startup
Flotation recovery of pyrite is largely affected by the proportion of oxide material in the plant feed or processing older stockpiled primary ore that has partially oxidized. Operating strategy is now aligned with planned campaigns of oxide material to allow maintenance windows for the regrind circuit whilst the plant is operating. In the mill feed schedule, the average sulfur feed grade is 0.4% with a maximum monthly grade of 2.1%. The average of the highest 12 periods in the mine plan is 1.7%. The design basis of the regrind circuit was based on a 5% sulfur feed grade at a 4 Mt/yr feed rate ensuring this circuit will not be a restriction in the future.
Flotation circuit performance is shown below in Figure 17-4 over the last 5 years with the feed grade tracking as expected within the plant design between 1.5% to 3.5% sulfide sulfur and recovery of sulfide sulfur to the flotation concentrate in the 70% to 90% range. Variations in recovery in 2024-25 period is driven primarily by periods of higher stockpile rehandle in the feed blend between pit cutbacks, Q1 2024 saw treatment of a large portion of stockpiled low-grade oxide/transitional ore that was at the time of being fed mis-classified as stockpiled fresh.
| | | | | | | | |
Released: March 27, 2026 | | Page 215 of 275 |
| | | | | | | | |
NI 43-101 Technical Report – Haile Gold Mine, South Carolina, United States |
| |
| |
Source: OceanaGold, 2025
Figure 17-4: Flotation Circuit Recovery
Overall gold recovery over the last 5 years has trended well with the site recovery model with the circuit largely unchanged following the conversion of the pre-aeration tank to a cyanide leach tank. For budgeting purposes, oxide/transitional material is assigned a gold recovery of 68% gold and for fresh ore the feasibility recovery model is used with an uplift of 2.5% above 1.7g/t gold feed grade. Fresh ore stockpiled is given a 5% recovery penalty from this basis. The leach recovery over the last 5 years is shown in Figure 17-5 along with the feasibility model recovery and plant head grade. Key factors affecting the leach recovery include:
•Issues impacting the operation and utilization of the regeneration kiln have had a significant impact on carbon activity leading to low levels of solution loss. Changes to equipment in the circuit has increased utilization of this circuit with noticeable improvement since mid-2024 (tube replacement, installation of standby heat exchangers etc.).
•January and February 2024 saw recovery loss following hydrocarbon contamination events in the CIL circuit causing significant degradation of activated carbon. With the total carbon inventory in excess of 200t turnover through stripping and regeneration took around 6 weeks with elevated solution loss reducing recovery by 10% to 15%, residue grades remained at normal levels.
| | | | | | | | |
Released: March 27, 2026 | | Page 216 of 275 |
| | | | | | | | |
NI 43-101 Technical Report – Haile Gold Mine, South Carolina, United States |
| |
| |
Source: OceanaGold, 2025
Figure 17-5: Gold Recovery Performance 2021 to 2025
17.4Processing Schedule and Unit Costs
The processing schedule is shown in Table 16-30 and Figure 17-6.
Source: OceanaGold, 2025
Figure 17-6: Process and Gold Production Schedule
Forward budgeting is based on a zero-order buildup based on drivers of feed tonnage or operating time. Operating experience over the recent years has allowed benchmarking of key consumable rates going forward. Key consumable consumption rates are shown in Table 17-1, the production
| | | | | | | | |
Released: March 27, 2026 | | Page 217 of 275 |
| | | | | | | | |
NI 43-101 Technical Report – Haile Gold Mine, South Carolina, United States |
| |
| |
driver metric being mill feed tonnage or concentrate tonnage depending on the area of the circuit. Power usage models for the process plant are established to calculate electrical power demand. Long-term maintenance schedules are used to identify reline activities, major overhauls and expected contractor cost
Table 17-1: Key Consumable Consumption Rates
| | | | | | | | |
Consumable | Unit | Consumption Rate |
2” Ball Mill Balls | kg/tonne ore | 0.512 |
5 SAG Balls | kg/tonne ore | 0.474 |
.75” Tower Mill Balls | kg/tonne ore | 0.150 |
2.5 mm ISA Mill Media | kg/tonne ore | 0.035 |
Carbon | kg/tonne ore | 0.048 |
Promoter | kg/tonne ore | 0.010 |
Frother | kg/tonne ore | 0.004 |
SIBX | kg/tonne ore | 0.030 |
CuSO4 | kg/tonne ore | 0.116 |
Flocculant | kg/tonne ore | 0.441 |
NaCN | kg/tonne ore | 0.664 |
Lime | kg/tonne ore | 1.45 |
Ammonium Bisulfate | kg/tonne ore | 1.55 |
HCI | kg/oz Au Produced | 1.367 |
Caustic | Kg/oz Au Produced | 1.704 |
Natural Gas | M3/oz Au Produced | 2.661 |
Water Treatment Plant |
Sulfuric Acid | Kg/m3 discharged | 0.019 |
Flocculant | Kg/m3 discharged | 0.005 |
Citric Acid | Kg/m3 discharged | 0.095 |
Caustic Soda Solution | Kg/m3 discharged | 0.051 |
Hypochlorite | Kg/m3 discharged | 0.09 |
Ferric Chloride | Kg/m3 discharged | 0.014 |
TMT-15 | Kg/m3 discharged | 0.006 |
AF304 | Kg/m3 discharged | 0.005 |
NaMnO4 | Kg/m3 discharged | 0.011 |
Sodium Bisulfate | Kg/m3 discharged | 0.010 |
Source: OceanaGold, 2025
At the current average forecast mill throughput rates of 2.8-3.0 Mt/yr, process costs are budgeted at an average of US$23.28/tonne of ore milled over the LoM, incorporating US$2.13/tonne related to water treatment operations.
| | | | | | | | |
Released: March 27, 2026 | | Page 218 of 275 |
| | | | | | | | |
NI 43-101 Technical Report – Haile Gold Mine, South Carolina, United States |
| |
| |
Some increased costs have been assumed/identified in the Life of Mine cost preparation round from:
•Additional maintenance repair costs around the crushing/conveying section from increased wear associated with higher ore hardness from deeper sourced ore
•Increased labor rates for HGM staff over the last 24 months
•Increased costs for key reagents from inflationary pressures on suppliers
•Inflationary increases to the unit electricity cost
Unit costs have allowed for an increase in the contact water treatment plant capacity and the introduction of a reverse osmosis stage in the process in 2025 to ensure ongoing compliance. This has led to an approximate increase of 17% of the water treatment unit cost.
17.5Contact Water Treatment Plant
The Contact Water Treatment Plant operates on a continuous basis to treat contact water for discharge off site. Contact water from the mining areas (pit dewatering, PAG storage areas) is collected in a series of lined ponds and treated via a conventional single stage pH adjustment water treatment process using lime, oxidants and coagulants followed by microfiltration to remove dissolved metals and suspended solids. In 2022 the original two stage pH adjustment water treatment plant was expanded with two additional trains consisting of a first stage pH adjustment and multiflo clarifier followed by three parallel trains of microfiltration and then pH adjustment to increase capacity from a nominal 1,100 gpm to 2,640 gpm.
In 2025 the addition of a reverse osmosis stage was added to the flowsheet to reduce the hardness of the discharged water to assist in achieving compliance with the biotic Whole Effluent Toxicity (WET) test. Input flowrates to the water treatment plant remains similar, brine from the reverse osmosis circuit is pumped to the tailings dam. Recommissioning of the large Minetek evaporators on a causeway within the tailings dam is underway to allow control of the process water pool in the dam through evaporation of this additional water input.
17.6Concentrate Leach Circuit Upgrade
Based on the results of testwork conducted as part of the Ledbetter Underground Feasibility study Ausenco was retained to undertake an Engineering Feasibility Study to separate the concentrate and flotation tailings streams during leaching and to extend the residence time for concentrate to 96 hours. This will be achieved by construction of an additional leach/adsorption circuit to the north of the current refinery building incorporating 4 new 750m3 leach tanks followed by a Kemix Carousel adsorption circuit operating as a Carbon in Pulp (CIP) flowsheet. Use of CIP as the technology for the concentrate leach was driven by the higher feed grades and solution tenors in the concentrate stream and to provide higher gold loadings on carbon and lower solution tail grades than CIL would provide and minimizing the total carbon inventory in the plant overall.
The existing refinery will be upgraded with the installation of a second acid wash column to allow parallel washing of carbon from both the concentrate and flotation tailings circuit ahead of stripping in the current strip column and regeneration circuit. With higher carbon loadings from the use of the CIP circuit on concentrate, strip capacity of the current circuit is sufficient to support the gold production rate in the order of 200-220koz per year over the remaining Life of Mine plan from 2028.
| | | | | | | | |
Released: March 27, 2026 | | Page 219 of 275 |
| | | | | | | | |
NI 43-101 Technical Report – Haile Gold Mine, South Carolina, United States |
| |
| |
For the economic modeling for the Ledbetter Underground a capital cost estimate of USD45M was assumed offsetting the additional recovery of approximately 63koz of gold from the extended residence time.
Detailed design, construction and commissioning is estimated at 24 months, and it is planned to complete detailed engineering in late Q3 2026 with procurement and construction to continue through 2027 with the circuit fully commissioned by the end of Q1 2028 well ahead of mining of Ledbetter Underground ore commencing. The location and layout of the new equipment is shown in the below Figure 17-7 from the Navisworks model developed during the Feasibility design phase.
Source: OceanaGold, 2025
Figure 17-7 Proposed New Concentrate Leach CIP Circuit Location
| | | | | | | | |
Released: March 27, 2026 | | Page 220 of 275 |
| | | | | | | | |
NI 43-101 Technical Report – Haile Gold Mine, South Carolina, United States |
| |
| |
18 Project Infrastructure
18.1Tailing Storage Facility
Currently, the Duckwood TSF has been permitted to be constructed in six stages to a crest elevation of 204 m. As of December 31, 2025, Duckwood holds approximately 25.6 Mt of tailings and the facility has an ultimate capacity of the 63 Mt. The first three stages of the embankment construction have been completed to a crest elevation of 183 m, and the Stage 4 embankment raise is currently being constructed. Once completed in the 1st Quarter of 2026, the crest elevation will be at 192 m, and the facility will have an approximate capacity of 43 Mt. The ultimate Duckwood TSF layout is presented in Figure 18-1 and Figure 18-2 shows the typical embankment cross-section.
Stage V construction involves raising the embankment, and the following improvements:
•Realign portions of the following local roads and highways:
•US Highway 601
•Duckwood Road
•Old Jefferson Highway
•Estridge Avenue
•Pit a Tat Road
•Crossbow Lane
•Reconstruct all perimeter runoff collection channels
•Relocate and construct a new channel for upper Camp Branch Creek
•Remove existing stormwater sediment collection basin P2, infiltration basin P3.
•Construct perimeter stormwater sediment collection basins: P1, P3.
•Reshape the Existing TSF Growth Media Stockpile
•Relocate the Hilton Archaeological Site
The deposition of tailings into the TSF is via a HDPE pipeline located around the perimeter of the embankment crest. Deposition will occur from banks of spigots installed on tailings distribution line along the crestline and the supernatant pond will be maintained in the centre of the facility. Tailings deposition will strategically progress around the facility to maintain slightly sloped surface to drain process water and direct precipitation towards the decant pond that is in the centre of the facility. A causeway has been constructed from the eastern crest to the centre of the facility to facilitate reclaiming the decant pond. Water from the decant pond will be recycled back to the mill for make-up water.
The TSF is designed as a zero-discharge facility. This facility has been sized to accommodate the anticipated tailing storage and operating pool requirements, the Probable Maximum Precipitation (PMP) storm event, and an additional 4 ft of freeboard at all times.
| | | | | | | | |
Released: March 27, 2026 | | Page 221 of 275 |
| | | | | | | | |
NI 43-101 Technical Report – Haile Gold Mine, South Carolina, United States |
| |
| |
Source: OceanaGold, 2026
Figure 18-1: Tailing Storage Facility Layout
| | | | | | | | |
Released: March 27, 2026 | | Page 222 of 275 |
| | | | | | | | |
NI 43-101 Technical Report – Haile Gold Mine, South Carolina, United States |
| |
| |
Source: OceanaGold, 2026
Figure 18-2: Tailing Storage Facility Typical Section
| | | | | | | | |
Released: March 27, 2026 | | Page 223 of 275 |
| | | | | | | | |
NI 43-101 Technical Report – Haile Gold Mine, South Carolina, United States |
| |
| |
18.2Overburden Storage
During the mine life from the present, eight different OSAs underground and pit backfill will be utilized for the storage of approximately 105 Mt of additional material generated from the open pit, waste rehandle, and underground development. The material generated from the development of the pits will be classified as either potentially acid generating (PAG) or Non-PAG overburden material. 53 Mt of PAG material will be stored in the West PAG OSA, or in mined out pits. The 52 Mt of non-PAG material will be used for TSF embankment construction, backfill in underground stopes, capping PAG material in the pit backfill or placed at the existing green OSA (Ramona and South). The OSAs will be developed according to the pit progression.
Grass lined sediment collection control channels will be constructed around the footprint of each OSA. Sediment control structures will be constructed at the outfall of the sediment control channels for each facility. Water retained within the ponds is routed through a low-level riser pipe to an adjacent drainage. All the OSAs will be developed with a final reclaimed overall 3(H):1(V) slope.
18.3Potential Acid Generating (PAG) Overburden Storage Areas
With the current mining permit, West PAG Overburden Storage Area (OSA), and pit backfill are the only remaining dedicated facilities with capacity for storing the PAG material. It is estimated that the current mine plan will generate an additional 53 Mt PAG material of which 37 Mt will need to be stored above ground in the lined West PAG OSA.
The West PAG OSA, presented in Figure 18-3, is currently being expanded into its final phases. The facility is lined with a composite lining system utilizing a low permeability soil layer overlain by a geomembrane. The geomembrane will be covered with a 600 mm drainage layer. A pipe network will be installed within the drainage layer to collect and transmit infiltration through the PAG material and direct flow into the contact water collection ponds.
The West PAG OSA has two new contact water collection ponds, 541 and 463 Ponds. The 541 Pond has a capacity of 130 million litres (ML), including an extra 37 ML for additional contact water storage for staging to the contact water treatment plant. The remaining 93 ML is sized to contain the predicted runoff from the 100 year/24-hour storm event on the first two phases. The south expansion will drain to the 463 Pond, which is sized to hold 100 ML which exceeds to the predicted runoff from the 100 year/24-hour storm event for the third phase. When complete, the perimeter runoff collection channels for the full West PAG build out will drain to either the 465 (existing), 541 (existing) or 463 Pond (currently under construction). The PAG solution and storm water collected in the 465 and 463 Ponds will be pumped to the 541 Pond, and from there to the existing 19 Ponds for treatment and release, or for use in the milling process.
The ultimate footprint of West PAG OSA will have an overall footprint of approximately 62 ha and the PAG material will be loaded with an overall slope of 3(H):1(V).
| | | | | | | | |
Released: March 27, 2026 | | Page 224 of 275 |
| | | | | | | | |
NI 43-101 Technical Report – Haile Gold Mine, South Carolina, United States |
| |
| |
Source: OceanaGold, 2026
Figure 18-3: West PAG Overburden Storage Area
| | | | | | | | |
Released: March 27, 2026 | | Page 225 of 275 |
| | | | | | | | |
NI 43-101 Technical Report – Haile Gold Mine, South Carolina, United States |
| |
| |
18.4Site Wide Water Management
The existing site wide water management plan will remain unchanged. Incoming water from Upper Haile Gold Mine Creek will be detained by the Fresh Water Storage Dam (FWSD) at the upper reaches of the watershed. The as-built dam is shown in Figure 18-4. Water from the FWSD is pumped around the pits using the existing pumps and pipelines installed with the embankment. The pumps are sized to maintain the water storage elevation below 143 m to allow for sufficient freeboard for the 100-year storm event within the upper Haile Gold Mine Creek watershed. Low flow pumps are included to maintain the minimum flow of 15.9 L/s in Haile Gold Mine Creek, per the mining permit. The FWSD has capacity to store approximately 590 ML of fresh water. Should the FWSD level reach elevation 148 m, an emergency spillway is sized to pass the ½ PMP event safely into the pits to allow ample time for evacuation.
| | | | | | | | |
Released: March 27, 2026 | | Page 226 of 275 |
| | | | | | | | |
NI 43-101 Technical Report – Haile Gold Mine, South Carolina, United States |
| |
| |
Source: OceanaGold, 2022
Figure 18-4: As Built Fresh Water Storage Dam
| | | | | | | | |
Released: March 27, 2026 | | Page 227 of 275 |
| | | | | | | | |
NI 43-101 Technical Report – Haile Gold Mine, South Carolina, United States |
| |
| |
18.5Site Wide Water Balance
A GoldSim site wide water balance model was developed to evaluate operations associated with the Mill, TSF, contact water treatment plant, freshwater storage dam (FWSD) and associated water management facilities. Analyses looked at multiple possible scenarios covering a range of potential occurrences. Results from the study provide a variety of potential outcomes allowing risk-based decision making. The balance includes all major facilities that are expected to add water to the system, facilities that store water, facilities that use water and facilities for water treatment / release.
Sources of water can be considered to fall into three different categories: process water, contact water and non-contact water. Contact water requires treatment before it can be released but can be used in the process. Process water includes water in the mill process or TSF which cannot be released; process water is recycled to minimize the amount of water required at the mine.
Process water comes from:
•Free water in the TSF including direct precipitation on the TSF and runoff into the TSF
•Underdrain from the TSF
•Any fresh water in the Mill process stream
•Natural moisture in the processed ore after it enters the process circuit
Contact water comes from:
•Runoff and underdrain from PAG OSA and Low-Grade Ore Stockpile
•Direct precipitation and runoff accumulating in the active and inactive pits
•Crusher pad and coarse ore stockpile containment areas
•Water pumped from the underground workings
Contact water can be used in the process as make up water or be treated in the CWTP and discharged. Non-contact water includes water that does not require treatment (beyond sediment control, as required that can be released to the environment.
Sources of non-contact water include:
•Groundwater from pit depressurization
•Municipal water
•Runoff from Topsoil Stockpiles
•Runoff from Non-PAG Overburden Storage Areas
•Runoff from Undisturbed Ground
•Runoff from TSF Outer Perimeter
•Runoff from the Plant Site (process water is contained within the process)
The results of the site wide water balance analysis indicate that under the full range of meteorological conditions evaluated, there is expected to be adequate storage in the TSF to contain process and anticipated meteorological water falling within the TSF catchment. Municipal supplies and non-contact water generated on site are expected to be sufficient to meet water demands.
| | | | | | | | |
Released: March 27, 2026 | | Page 228 of 275 |
| | | | | | | | |
NI 43-101 Technical Report – Haile Gold Mine, South Carolina, United States |
| |
| |
18.6Water Supply
Fresh water required for dust suppression and the process plant will be supplied by the pit depressurization wells and meteoric water intercepted prior to running into the pits. WTP treated water may also be used to meet dust suppression water demands. Any excess water from the depressurization wells will be pumped to the FWSD and / or the FWST (Fresh Water Storage Tank) before releasing to the environment. Mill process water will be sourced from TSF reclaim pond and make-up water will be sourced from pit run-in and surface catchment at the FWSD. PAG OSAs can also be used as mill make up water if necessary. The underground operations water supply will be sourced from WTP treated water or from the fresh water sources located on site either ponds or the Fresh Water Detention Dam and then transported via an HDPE line to the underground facilities. A water storage tank will then provide clean water down the decline for underground mining equipment and water use at the underground yard. The site is connected to the town of Kershaw municipal water system for potable water supply.
18.7Surface Roads and Bridges
The existing Highway 601 overpass provides both a traffic crossing and a means of carrying the tailings delivery line across Highway 601 from the Process Plant. The existing overpass has been upgraded to allow fully loaded 175 tonne haul trucks to deliver random fill from the Mine to the TSF for the construction of TSF. TSF Stage 5 will require Highway 601 to be relocated pending final design of the TSF and road expansions.
18.8Underground Surface Infrastructure
Currently the Horseshoe Underground Surface Infrastructure contains facilities such as mobile and fixed maintenance workshops, backfill/shotcrete batch plant, water storage facilities, compressed air facilities, office facilities, Run of Mine Stockpile, aggregate crushing circuit for CRF, and water retention ponds. Future expansion of the batch plant to increase capacity and a metal removal plant is currently planned. A single lane haulage road from the surface infrastructure down to the portals with multiple pull overs for passing traffic is established and maintained. Figure 18-5 has an overview of the surface infrastructure for Horseshoe.
Palomino will utilize Horseshoe’s current infrastructure with exception of a high voltage line run over to the future site of the main ventilation shaft. This site will also host an additional substation and a backup generator.
Ledbetter infrastructure is separated into two main areas - the in-pit area and surface area, reference Figure 18-6. The surface area will contain the offices, maintenance shop, warehouse, water storage, and main electrical infrastructure from the overhead power line. The in-pit area will contain the batch plant, crush/screen plant, metal removal plant, ore & waste dumps, laydowns, and sumps. Surface ventilation shafts and escapeway raises will intercept the surface at the 1020 m RL bench in the open pit.
| | | | | | | | |
Released: March 27, 2026 | | Page 229 of 275 |
| | | | | | | | |
NI 43-101 Technical Report – Haile Gold Mine, South Carolina, United States |
| |
| |
Source: OceanaGold, 2025
Figure 18-5: Underground Surface Infrastructure Detail
Source: OceanaGold, 2025
Figure 18-6:Proposed Ledbetter Underground Surface Infrastructure
| | | | | | | | |
Released: March 27, 2026 | | Page 230 of 275 |
| | | | | | | | |
NI 43-101 Technical Report – Haile Gold Mine, South Carolina, United States |
| |
| |
18.9Power Supply
All incoming power demand for the site is met by the local grid and supplied by Lynches River Electric Cooperative.
The total power demand for the site (including underground operations) is estimated to be 23 MVA. The study undertaken by Lynches River Electric Cooperative confirmed the availability of power to site with some upgrades to the existing 69 kV substation and transmission line. These minor upgrades including the installation of a second 69/24kV transformer have been completed as of December 31, 2025.
As part of the Ledbetter Underground Feasibility study the power demands from the execution of the earlier Ledbetter Phase 4 open pit as an underground operation were estimated and the site power system model updated to account for the change in load and the operation of concurrent underground operations. The investigation confirmed the Lynches River upgrade to the 69 kV supply to site and existing on-site distribution systems were suitable to support the changed LoM plan.
| | | | | | | | |
Released: March 27, 2026 | | Page 231 of 275 |
| | | | | | | | |
NI 43-101 Technical Report – Haile Gold Mine, South Carolina, United States |
| |
| |
19 Market Studies and Contracts
General
Haile Gold Mine has been operating continuously since 2016 and has current contracts and purchase arrangements in place for doré refining and other goods and services required for the operation.
Bullion Production and Sales
The market for gold doré is well established. Market predictions and discussions for gold are beyond the scope of this document. The impacts of gold price volatility on the mine plan and process operation are well understood.
A contract is in place with Metalor USA Refining Corporation (Metalor), located in North Attleboro, Massachusetts, for the refining of doré bullion. This company is a subsidiary of Metalor Technologies SA which is a well known and established precious metal refiner. Metalor Technologies SA is a subsidiary of Japan's Tanaka Kikinzoku Group and is headquartered in Marin, Switzerland.
The contract with an Effective Date of January 31, 2020, has an amendment extending the contract to January 31, 2027, subject to termination by either party. This contract also sets a range of prices and surcharges for refining the doré under terms and conditions which generally comply with industry norms. It is assumed that these contract terms will be renewed through the LoM operation without changes or will be negotiated with a new refiner, if necessary.
Gold Price Hedging and Forward Sales Contracts
Haile currently has no forward sales, gold price hedging, gold loans, offtake or similar type agreements. OceanaGold does from time to time enter into group wide pre-sales agreements. Currently, these represent a relatively minor component of total gold production. OceanaGold has four operating mines across which these can be spread. Key contracts and status are shown in Table 19-1.
| | | | | | | | |
Released: March 27, 2026 | | Page 232 of 275 |
| | | | | | | | |
NI 43-101 Technical Report – Haile Gold Mine, South Carolina, United States |
| |
| |
Table 19-1: Key Contracts and Status Requirements
| | | | | | | | | | | |
Vendor | Purpose | Address | End Date of Contract |
Roberts Shell | Diesel | Kershaw, South Carolina | Feb-26 |
Sandvik | Parts | Smyrna, Georgia | Sep-26 |
Blanchard Machinery | Parts | West Columbia, South Carolina | Jun-29 |
Linder Industrial | Parts | Atlanta, Georgia | Jan-30 |
Linkan Engineering | RO Plant | Elko, Nevada | Dec-26 |
Lynches River | Electricity | Pageland, South Carolina | Dec-30 |
McCarthy Tire Services | Tires | Wilkes-Barre, Pennsylvania | Dec-26 |
Nelson Brothers LLC | Blasting Open Pit | Birmingham, Alabama | Jul-30 |
Orica | Blasting Underground | Centennial, Colorado | Jul-30 |
Covoro Corporation | Cyanide | Memphis, Tennessee | Dec-27 |
Magotteaux | Grinding Media | Franklin, Tennessee | Apr-27 |
Moly-Cop | Grinding Media | Kansas City, Missouri | Apr-27 |
Source: OceanaGold, 2025
| | | | | | | | |
Released: March 27, 2026 | | Page 233 of 275 |
| | | | | | | | |
NI 43-101 Technical Report – Haile Gold Mine, South Carolina, United States |
| |
| |
20 Environmental Studies, Permitting, and Social or Community Impact
Haile’s current mine plan is based on construction, mining operation, closure, and reclamation of eight open pits, with three of those pits being left as pit lakes (Champion, Small, and Ledbetter) and one as a partial pit lake (Snake). Due to the 2022 Supplemental Environmental Impact Statement NEPA process, Haile received the permits required for current operations.
On May 24, 2018, Haile applied to the US Army Corp of Engineers (USACE) to initiate the National Environmental Policy Act (NEPA) process and launch a Supplemental Environment Impact Statement (SEIS). USACE has jurisdictional responsibility for all waters of the United States and works cooperatively with US Environmental Protection Agency (USEPA), and South Carolina Department of Environmental Services (SCDES) for modifications such as this that have impacts to wetlands, groundwater and surface water conditions, and air emissions. Haile submitted a Project Description, Alternatives Analysis, and 127 additional technical reports in support of this application. These technical reports cover a wide range of topics including impact assessments to the wetlands, air, land, vegetation, groundwater, surface water, flora and fauna, cultural heritage sites, socioeconomic conditions, and reclamation plans.
To adjust mine plan expansions, a modified application of the 404 Permit under the Clean Water Act of 1972 (CWA) was submitted in Quarter 4 2020. The final SEIS was published on August 19, 2022. The record of decision and modified 404 permit was received on December 12, 2022. Various permitting approvals/certifications were also required from SCDES, including modification of Haile’s Mine Operating Permit which was received on December 14, 2022, and 401 Water Quality certification which was received November 8, 2022. Other federal and state agencies included in the review process during the SEIS included: EPA, United States Fish and Wildlife Service (US FWS), SC DNR, South Carolina State Historic Preservation Office (SC SHPO), South Carolina Department of Transportation (SC DOT) and Catawba Indian Nation. NEPA process also allows NGOs and other interested parties an opportunity for review and comment on the anticipated impacts.
Since December 14, 2022, SCDES has approved two additional modifications to Haile’s Mine Operating Permit. An expansion of the Horseshoe underground operation was approved on February 21, 2024, and the Palomino underground operation was approved on March 15, 2024.
Haile is unique in that mining occurs wholly on private land owned by Haile Gold Mine and does not impact federal/public (BLM or USFS) lands that would be subject to projected modifications from these surface management agencies.
This provides financial assurance to the State of South Carolina that funds will be available (in the event of default by Haile Gold Mine) to implement and complete the Reclamation Plan and for implementing, maintaining, repairing, or enhancing any aspect of reclamation, closure, and post closure activities. The financial assurance is in the form of surety bonds and an interest-bearing trust account.
| | | | | | | | |
Released: March 27, 2026 | | Page 234 of 275 |
| | | | | | | | |
NI 43-101 Technical Report – Haile Gold Mine, South Carolina, United States |
| |
| |
Table 20-1 is a summary of the current HGM permits as issued under the 2014 Environmental Impact Statement, 2022 Supplemental Environmental Impact Statement, and subsequent state permitting processes.
| | | | | | | | |
Released: March 27, 2026 | | Page 235 of 275 |
| | | | | | | | |
NI 43-101 Technical Report – Haile Gold Mine, South Carolina, United States |
| |
| |
Table 20-1: Mine Permits
| | | | | | | | | | | |
Agency | Permit/ Authorization Number | Date Received | Description |
US Army Corps of Engineers | 404 Permit – SAC-1992-24122-4IA | October 27, 2014 | Permit to affect wetlands and streams per the approved Mine Plan. |
US Army Corps of Engineers | 404 Permit – SAC-1992-24122-4IA | December 19, 2022 | Modified Permit to affect wetlands and streams per the approved Mine Plan. |
U.S. Army Corps of Engineers | Permit 2004-1G-157 | October 16, 2007 | Permit to fill a portion of the old North Fork Creek |
Mine Safety and Health Administration (MSHA) | MSHA ID: 38-00600 | February 5, 2010 | Operate mine within MSHA standards |
Federal Communications Commission | Call Sign: WQJB814 | July 18, 2008 | Base station frequency, ten local frequencies |
South Carolina Department of Environmental Services (SCDES), Bureau of Water | 401 Water Quality Certification | November 8, 2022 | Water Quality certification to construction and operate a gold mine on HGMC, Camp Branch Creek, unnamed tributaries and adjacent wetlands. |
SCDES, Division of Mining and Solid Waste Management | Mining/Operating Permit No. I-000601 | December 14, 2022 | Mine Operating Permit – Regulation of closure and reclamation. |
SCDES, Bureau of Solid and Hazardous Waste Management | Permit No. SCD987596806 | April 4, 2022 | Conditionally exempt very small quantity generator |
SCDES, Industrial Wastewater Permitting Section | WTR-Wastewater Construction Permit Permit No. 19852-IW | January 30, 2015 | Permit to construct sewer lines |
SCDES, Bureau of Water, Industrial, Agricultural, and Storm Water Permitting Division | Dams and Reservoirs Safety Permit 29-0007 (Issued October 7, 2013) | October 7, 2013 | Dam Safety Permit – Significant Hazard (Construction). Stability during earthquake-induced ground motion was evaluated by SCDHEC prior to issuance of the TSF construction permit. SCDES completed evaluation of the seismic stability study pursuant to the International Commission of Large Dam (ICOLD) design and performance standards. |
SCDES, National Pollutant Discharge Elimination System (NPDES) Program, Water Facilities Permitting Division SWPPP General permit | General Permit for Stormwater Discharges for Small and Large mining (Activities Permit) SCR100000 | July 1, 2022 | Discharge of stormwater in connection with construction of structures not covered under the Industrial General Permit – requires submittal of Storm Water Pollution Prevention Plan (SWPPP) and public notice prior to construction |
SCDES, NPDES Program, Water Facilities Permitting Division | Wastewater discharges associated with mining activity Permit No. SC0040479 | June 1, 2022 | Discharge of wastewater in connection with mining activities |
SCDES, Office of Environmental Quality, Bureau of Air Quality | Bureau of Air Quality, State Title V No. 1460-0070 | July 1, 2021 | Authorizes the operation of this facility and the equipment specified herein in accordance with valid construction permits, and the plans, specifications, and other information. |
Lancaster County Council | Floodplain Development Permit June 27, 2013 | January 27, 2013 | Floodplain Administrator oversees and implements the provisions of the Flood Damage Prevention Ordinance. |
South Carolina Department of Transportation, (SCDOT) | 177006 | January 14, 2015 | Encroachment Permit |
Source: OceanaGold, 2025
| | | | | | | | |
Released: March 27, 2026 | | Page 236 of 275 |
| | | | | | | | |
NI 43-101 Technical Report – Haile Gold Mine, South Carolina, United States |
| |
| |
20.1 Required Permits and Status
All required mining permits have been received. Minor modification will need to be completed for the change of mining method for Ledbetter Phase 4 from and open pit to an underground is expected to be completed in 2027 with estimated approval to take two to three months based on the minor modifications completed for Horseshoe and Palomino in 2024.
20.2 Environmental Studies
There are no current environmental studies required at this time.
20.3 Environmental Bond
As required by Haile’s Mine Operating Permit, a progressive US$112 million (M) Bond plus a US$20 million Reclamation Trust Agreement is in place between HGM and SCDES. Currently, the US$112 million has been posted under the agreed upon schedule. The bond is increased periodically by SCDES to provide financial assurance to the State of South Carolina that funds will be available (in the event of default by HGM) to implement and complete the Reclamation Plan and for implementing, maintaining, repairing, or enhancing any aspect of reclamation, closure, and post closure activities. The financial assurance is in the form of surety bonds and an interest-bearing trust account.
21
| | | | | | | | |
Released: March 27, 2026 | | Page 237 of 275 |
| | | | | | | | |
NI 43-101 Technical Report – Haile Gold Mine, South Carolina, United States |
| |
| |
21Capital and Operating Costs
21.1Capital Expenditure Estimates
The Capital costs for LOM were developed considering the planned mine physicals and historical costings with current price trends and supporting studies.
Sustaining capital reflects the continuation of mining operations for items such as tailings storage facilities, PAG equipment replacement and or planned component replacement or additional identified equipment needs and processing infrastructure.
Non-Sustaining capital reflects the development phases of the underground deposits of PUG and LUG along with metallurgy upgrades that support the underground deposit in the process plant.
Capitalized open-pit pre-strip reflects the pit waste stripping costs and UG Mine Development reflects life of mine waste development of ventilation drives and raises, along with main declines.
A summary of the total capital expenditure is provided in Table 21-1.
Table 21-1: Total Capital Expenditure Summary (US$000’s)
| | | | | | | | | | | |
Description | Non-Sustaining Capex | Sustaining Capex | Total |
OP Capitalized Pre-Strip |
| 147,541 | 147,541 |
OP Mining Property, Plant, & Equipment (PP&E) |
| 103,320 | 103,320 |
UG Mining PP&E |
| 66,296 | 66,296 |
UG Mine Development Capitalized | 57,372 | 98,363 | 155,735 |
UG PUG – Development Phase(1) | 135,538 |
| 135,538 |
UG LUG – Development Phase(1) | 152,929 |
| 152,929 |
Processing | 67,107 | 66,143 | 133,250 |
Infrastructure | 126 | 92,515 | 92,641 |
External Affairs and Social Performance (EA&SP) | 2,000 |
| 2,000 |
Total Net Capex | 415,072 | 574,178 | 989,250 |
Reclamation/Closure (2) | 123,465 | - | 123,465 |
Total LoM Net Capex | 538,537 | 574,178 | 1,112,715 |
Source: OceanaGold, 2025
1 Sustaining Capex captured under general UG Mine Development Capitalized
2 Captured as Capex in Cashflow
21.2Operating Cost Estimates
The total LoM operating cost (excluding capitalized operating cost) is US$2,455 million. Operating costs have been estimated based on historical performance at Haile, supplier quotations, estimates from consultants with appropriate expertise and otherwise estimated internally by appropriately credentialled HGM staff.
The total LoM operating cost unit rate of US$80.93/t processed is summarized in Table 21-2.
| | | | | | | | |
Released: March 27, 2026 | | Page 238 of 275 |
| | | | | | | | |
NI 43-101 Technical Report – Haile Gold Mine, South Carolina, United States |
| |
| |
Table 21-2: LoM Operating Cost Summary
| | | | | | | | |
Description | US$000’s | US$/t Mined |
OP Mining ($/t rock mined (ore and waste)) - All Material | 727,076 | 6.68 |
OP Mining ($/t rock mined (ore and waste)) - (excl. capitalized cost) | 579,535 | 5.33 |
UG Mining ($/t rock mined (ore and waste)) – All Material | 913,855 | 61.29 |
UG Mining ($/t rock mined (ore and waste)) - (excl. capitalized cost) | 758,120 | 50.85 |
US$000’s | US$/t Ore Processed |
Subtotal Mining (Operational Material Only) | 1,337,655 | 44.11 |
Processing | 706,105 | 23.28 |
G&A Cost | 402,627 | 13.28 |
Bullion Refining/Freight Costs | 8,209 | 0.27 |
Total Operating Costs | $2,454,596 | $80.93 |
Source: OceanaGold, 2026
There are cost items excluded from the operating cost, as detailed in Table 21-3, which OceanaGold does not consider to be direct operating costs, but is considered under the Indirect costs for the operation and these costs are included in the economic analysis. There is a US$10.1 million commitment remaining to pay on the Reclamation Trust Agreement to get to the US$20 million obligation. The Reclamation Trust Agreement will be returned at the end of LOM, hence the reversal.
Table 21-3: LoM Indirect Costs Summary
| | | | | | | | |
Description | US$000’s | US$/t
Ore Processed |
Reclamation Trust Agreement – Remaining Contributions | 10,080 | 0.33 |
Reclamation Trust Agreement - Release | -20,000 | -0.66 |
Community Contributions | 9,200 | 0.30 |
Interest Expense - Capital Leases | 3,562 | 0.12 |
Principal Payment - Capital Leases: Sustaining | 25,877 | 0.85 |
Principal Payment - Capital Leases: Non-Sustaining | 13,086 | 0.43 |
Total Non-Operating Costs | 41,804 | 1.38 |
Source: OceanaGold, 2025
| | | | | | | | |
Released: March 27, 2026 | | Page 239 of 275 |
| | | | | | | | |
NI 43-101 Technical Report – Haile Gold Mine, South Carolina, United States |
| |
| |
22 Economic Analysis
All costs, prices, and financial indices in Section 22 are presented in United States Dollars unless otherwise noted. The metrics reported in this volume are based on the annual cash flow model results. The metrics are on both a pre-tax and after-tax basis, on a 100% equity basis with no Project financing inputs and are in Q4 2025 U.S. constant dollars.
22.1Principal Assumptions and Input Parameters
The indicative economic results summarized in this Section 22 are based upon work performed by OceanaGold in 2025 and 2026. Key criteria used in the analysis are discussed in detail throughout this section. Principal Project assumptions used are summarized in Table 22-1.
Table 22-1: Basic Model Parameters
| | | | | |
Description | Value |
Time Zero Start Date | January 1, 2026 |
OP Operations Start | January 1, 2026 |
UG Operations Start | January 1, 2026 |
OP Mine Life | 8 years |
UG Mine Life | 10 years |
Mill Operations | 11 years |
Closure Period | 4 years |
Gold Price ($/oz) | $2,200 |
Silver Price ($/oz) | $25 |
Discount Rate | 5% |
Source: OceanaGold, 2025
All costs incurred prior to January 2026 are considered sunk with respect to this analysis. Note that because the Project is operating and is valued on a total project basis with prior capital treated as sunk, and not by an incremental analysis of the UG and mill expansions, an IRR value is not relevant in this analysis.
The selected Project discount rate is 5%. A sensitivity analysis of the discount rate is shown in Section 22.4.3. Foreign exchange impacts were deemed negligible as most, if not all, costs and revenues are denominated in US dollars.
Gold pricing assumptions used in the economic model include a constant LoM gold price of US$2,200/oz and a LoM silver price of US$25/oz consistent with the Mineral Reserves assumptions. Results for an Alternative Price Case with commodity prices reflecting current market conditions is summarized in Section 22.5.
Doré refining / freight costs are modeled as follows:
•99.996% payable Au
•US$1.70/ oz Au treatment and refining charge
Silver is included in the current Mineral Reserve estimates and Cashflow Forecasts.
| | | | | | | | |
Released: March 27, 2026 | | Page 240 of 275 |
| | | | | | | | |
NI 43-101 Technical Report – Haile Gold Mine, South Carolina, United States |
| |
| |
The silver by-product credit in the economic model is calculated using a constant silver price of US$25/ oz and an average recovery of 70%. The additional silver related doré refining costs are as follows:
•99.0% payable Ag
•US$1.10/ oz Ag treatment charge
Produced doré transportation charges are estimated and applied in the model at US$4,150 per weekly transport.
The assumptions used for working capital for this estimate are as follows:
•Accounts Receivable (A/R): 5-day delay
•Accounts Payable (A/P): 30-day delay
•Zero opening balance for A/P and A/R
Annual adjustments to working capital levels are made in the economic model with all working capital recaptured by the end of the mine life resulting in a LoM net free cash flow (FCF) impact of US$0.
22.2Taxes, Royalties and Other Interests
22.2.1Taxation
As the Project is currently in operation, an estimate of depletion and depreciation deductions for the remainder of the mine life has been incorporated into the economic model. The main taxation assumptions utilized within the model are as follows:
•Corporate Income Tax (CIT) rates are 21% for Federal and 5% for South Carolina
•Existing Net Operating Loss (NOL) pools are not considered
•Federal Depletion allowance is estimated for each period by applying a depletion rate of US$192/oz
•A Tax Depreciation allowance schedule has been included. The tax depreciation schedule provided yields US$1,805 million of depreciation from the whole year 2026 through LoM:
•The total tax deductions calculated for the operation from 2026 through the LoM are presented in Table 22-2.
Table 22-2: Haile Tax Deductions (US$000’s)
| | | | | |
Tax Deductions | LoM US$(000’s) |
Depreciation | 1,804,759 |
Depletion | 363,753 |
Total Tax Deductions | $2,168,512 |
Source: OceanaGold, 2026
22.2.2Royalties
There are no third-party government or private royalties or government severance taxes due on the Project during LoM. The economic model was created on a project level basis and no fractional ownership, if applicable, was considered in the result.
| | | | | | | | |
Released: March 27, 2026 | | Page 241 of 275 |
| | | | | | | | |
NI 43-101 Technical Report – Haile Gold Mine, South Carolina, United States |
| |
| |
22.2.3Financing Costs
Financing costs, including principal and interest associated with finance leases, have been included in the economic analysis. Finance lease principal and interest payments have been treated as capital‑equivalent expenditures to ensure consistent economic treatment between leased and purchased equipment and to maintain neutrality with respect to equipment acquisition methods.
22.3Pricing Model Results – Reserves Case
At OceanaGold Reserve prices ($2,200/oz gold price, $25/oz silver price) Haile delivers post-tax financial metrics of:
•$565 million undiscounted cashflow (UCF)
•$414 million net present value (NPV) at a 5% discount rate
•$1,592/oz All-In Sustaining Cost (AISC)
Annualised financial performance is summarised in Figure 22-1 and Table 22-3.
Source: OceanaGold, 2026
Figure 22-1: Project After-Tax Metrics Summary
| | | | | | | | |
Released: March 27, 2026 | | Page 242 of 275 |
| | | | | | | | |
NI 43-101 Technical Report – Haile Gold Mine, South Carolina, United States |
| |
| |
Table 22-3: Financial Performance Summary (Reserve Case)
| | | | | | | | | | | | | | | | | | | | | | | | | | | | | | | | | | | | | | | | | | | | |
Item | Unit | Total | 2026 | 2027 | 2028 | 2029 | 2030 | 2031 | 2032 | 2033 | 2034 | 2035 | 2036 | 2037(1) |
Market Prices | | | | | | | | | | | | | | |
Gold | $/oz | 2,200 | | 2,200 | | 2,200 | | 2,200 | | 2,200 | | 2,200 | | 2,200 | | 2,200 | | 2,200 | | 2,200 | | 2,200 | | 2,200 | | 2,200 | |
Silver | $/oz | 25 | | 25 | | 25 | | 25 | | 25 | | 25 | | 25 | | 25 | | 25 | | 25 | | 25 | | 25 | | 25 | |
Produced Metal | | | | | | | | | | | | | | |
Produced Gold | koz | 1.90 | | 0.25 | | 0.23 | | 0.21 | | 0.20 | | 0.20 | | 0.21 | | 0.17 | | 0.17 | | 0.14 | | 0.08 | | 0.03 | | - | |
Produced Silver | koz | 2.24 | | 0.13 | | 0.15 | | 0.13 | | 0.13 | | 0.21 | | 0.24 | | 0.31 | | 0.34 | | 0.28 | | 0.21 | | 0.09 | | - | |
Revenue | | | | | | | | | | | | | | |
Gross Gold Revenue | $M | 4,170 | | 549 | | 508 | | 457 | | 440 | | 444 | | 471 | | 382 | | 367 | | 318 | | 175 | | 57 | | - | |
Silver By-Product Credit | $M | 56 | | 3 | | 4 | | 3 | | 3 | | 5 | | 6 | | 8 | | 9 | | 7 | | 5 | | 2 | | - | |
Total Gross Revenue (Gold Only) | $M | 4,170 | | 549 | | 508 | | 457 | | 440 | | 444 | | 471 | | 382 | | 367 | | 318 | | 175 | | 57 | | - | |
Operating Costs | | | | | | | | | | | | | | |
Mining | $M | 1,338 | | 177 | | 125 | | 148 | | 145 | | 155 | | 168 | | 144 | | 119 | | 86 | | 62 | | 10 | | - | |
Processing | $M | 706 | | 72 | | 69 | | 67 | | 67 | | 67 | | 66 | | 65 | | 62 | | 63 | | 57 | | 53 | | - | |
General & Administration | $M | 403 | | 52 | | 50 | | 45 | | 44 | | 40 | | 39 | | 37 | | 35 | | 26 | | 20 | | 15 | | - | |
Selling Costs | $M | 8 | | 1 | | 1 | | 1 | | 1 | | 1 | | 1 | | 1 | | 1 | | 1 | | 1 | | 0 | | - | |
Direct Operating Costs (inc. By-Product Credit) | $M | 2,399 | | 298 | | 240 | | 257 | | 254 | | 257 | | 268 | | 239 | | 208 | | 168 | | 134 | | 75 | | - | |
Community and Bond Related Costs | $M | (1) | | 3 | | 3 | | 3 | | 3 | | 2 | | 2 | | 1 | | 1 | | 1 | | 1 | | - | | (20) | |
Lease Payments & Interest | $M | 43 | | 14 | | 13 | | 11 | | 4 | | 1 | | - | | - | | - | | - | | - | | - | | - | |
Non-Operating Costs | $M | 42 | | 17 | | 16 | | 14 | | 6 | | 3 | | 2 | | 1 | | 1 | | 1 | | 1 | | - | | (20) | |
Operating Cash Flow (Pre-Tax) | $M | 1,729 | | 234 | | 252 | | 186 | | 180 | | 183 | | 202 | | 143 | | 158 | | 149 | | 40 | | (18) | | 20 | |
Income Tax | $M | 51 | | 19 | | 23 | | 7 | | - | | - | | - | | - | | - | | - | | - | | - | | 1 | |
Working Capital | $M | 0 | | (7) | | (1) | | 0 | | 6 | | (7) | | 0 | | 0 | | 2 | | 2 | | 0 | | 2 | | 4 | |
Sustaining Capital | $M | 574 | | 138 | | 138 | | 97 | | 70 | | 55 | | 32 | | 25 | | 9 | | 6 | | 2 | | 1 | | - | |
Non-sustaining Capital | $M | 539 | | 81 | | 149 | | 88 | | 76 | | 14 | | 5 | | 3 | | 21 | | 14 | | 32 | | 12 | | 43 | |
After-Tax Net Cash Flow | $M | 565 | | 3 | | (57) | | (7) | | 28 | | 121 | | 164 | | 115 | | 127 | | 127 | | 6 | | (33) | | (28) | |
After-Tax NPV @ 5% | $M | 414 | | 3 | | (53) | | (6) | | 24 | | 97 | | 126 | | 83 | | 88 | | 84 | | 4 | | (20) | | (15) | |
Stock Movement (Cash) | $M | (17) | | 54 | | 26 | | 39 | | 14 | | 11 | | 22 | | 1 | | (1) | | (49) | | (69) | | (65) | | - | |
LoM All-In Sustaining Costs (AISC) | $M | 3,018 | | 392 | | 364 | | 327 | | 315 | | 305 | | 280 | | 264 | | 219 | | 224 | | 205 | | 142 | | (20) | |
LoM AISC Metric | $ /oz Au | 1,592 | | 1,571 | | 1,577 | | 1,573 | | 1,575 | | 1,513 | | 1,307 | | 1,519 | | 1,314 | | 1,553 | | 2,579 | | 5,435 | | - | |
ItemSource: OceanaGold, 2026
(1) Closure and Rehabilitation Costs beyond 2037 are reflected in 2037 for presentation.
| | | | | | | | |
Released: March 27, 2026 | | Page 243 of 275 |
| | | | | | | | |
NI 43-101 Technical Report – Haile Gold Mine, South Carolina, United States |
| |
| |
Figure 22-1 presents annual cash flow metrics vs. recovered gold production and shows that the Project does not generate positive free cash flow in 2027 and 2028 due to the level of capital expenditure during that period, and then again from 2036 as the operation winds down due to lower tonnage and grade through the mill and closure and rehabilitation costs.
As a result of the tax deductions identified in Section 22.2, the operation, as modeled, is expected to pay approximately US$51 million in income tax over the life of the operation. As this project is being modeled on a simplified basis in isolation at fixed prices and costs, actual results may differ, including as a result of changes in legislation, operating performance, or corporate structuring amongst other factors.
22.4Sensitivity Analysis
22.4.1Operational Sensitivity
After-tax sensitivity analyses for key operational parameters are shown in Figure 22-2. The Project is nominally most sensitive to revenue. The Project’s sensitivities to capital and operating costs are similar but the Project is slightly more susceptible to variations in operating costs.
Source: OceanaGold, 2026
Figure 22-2: Operational Sensitivity Analysis
| | | | | | | | |
Released: March 27, 2026 | | Page 244 of 275 |
| | | | | | | | |
NI 43-101 Technical Report – Haile Gold Mine, South Carolina, United States |
| |
| |
22.4.2 Gold Price Sensitivity
Additional gold price sensitivity analyses are shown with after-tax Project NPV 5% at constant ±25% sensitivity prices of US$2,750/oz (+25%) and US$1,650/oz (-25%), and an alternative price deck that is more in line with the current price environment (Alternative Price Profile), which is a flat price deck at US$4,000/oz Au and US$45/oz Ag.
Figure 22-3 shows the gold price sensitivity analysis.
Source: OceanaGold, 2026
Figure 22-3: Gold Price Sensitivity Analysis
22.4.3Discount Rate Sensitivity
A sensitivity analysis of discount rates presented in Figure 22-4shows that the Project as currently modeled would be NPV positive through a 20% discount rate.
| | | | | | | | |
Released: March 27, 2026 | | Page 245 of 275 |
| | | | | | | | |
NI 43-101 Technical Report – Haile Gold Mine, South Carolina, United States |
| |
| |
Source: OceanaGold, 2026
Figure 22-4: Discount Rate Sensitivity Analysis
22.4.4Alternative Pricing Model Result
For the Alternative Price Case Haile delivers post-tax financial metrics of:
•$3,258 million undiscounted cashflow
•$2,583 million NPV
•$1,569 /oz AISC.
The modeled indicative economic results are presented in Table 22-4 at the Alternative price profile.
| | | | | | | | |
Released: March 27, 2026 | | Page 246 of 275 |
| | | | | | | | |
NI 43-101 Technical Report – Haile Gold Mine, South Carolina, United States |
| |
| |
Table 22-4: Indicative Economic Results at Alternative Price Profile
| | | | | |
Description | US$000’s |
Market Prices |
Gold (US$/oz) | 4,000 |
Payable Gold (Moz) | 1.9 |
Revenue |
Gross Gold Revenue | 7,581,084 |
Silver By-Product Credit (at ~ US$45 / oz Ag) | 100,618 |
Total Gross Revenue | $7,681,702 |
Operating Costs |
OP Mining | (579,535) |
UG Mining | (758,120) |
Processing | (706,105) |
Site G&A | (402,627) |
Selling/Refining | (8,209) |
Non-Operating Costs | (41,804) |
Total Operating Costs | (2,496,401) |
Operating Margin (EBITDA) | 5,185,301 |
Taxes |
Income Tax | (814,474) |
Total Taxes | (814,474) |
Working Capital | - |
Operating Cash Flow | 4,370,827 |
Capital |
Sustaining Capital | (574,178) |
Non-Sustaining Capital | (538,537) |
Total Capital | (1,112,715) |
Metrics |
Pre-Tax Free Cash Flow | 4,072,586 |
After-Tax Free Cash Flow | 3,258,112 |
Pre-Tax NPV at 5% | 3,265,974 |
After-Tax NPV at 5% | 2,583,459 |
Source: OceanaGold, 2026
23Adjacent Properties
The Carolina terrane contains numerous historical gold mines and mining districts. Over 1,500 gold prospects have been documented. Most of these deposits were discovered in the 1800’s. Significant gold deposits in South Carolina include the Haile, Ridgeway, Brewer, and Barite Hill Mines. Numerous quartz vein-hosted mines of the Gold Hill and Cid Mining Districts occur in neighboring North Carolina. Some gold deposits have similar geologic and mineralization features to Haile, and several are polymetallic with Cu, Ag, Pb and Zn.
| | | | | | | | |
Released: March 27, 2026 | | Page 247 of 275 |
| | | | | | | | |
NI 43-101 Technical Report – Haile Gold Mine, South Carolina, United States |
| |
| |
23.1Ridgeway Mine
The Ridgeway Mine is located 8 km east of Ridgeway, South Carolina and 40 km north of Columbia, South Carolina. Kennecott produced 1.5 Moz (46,655 kg) of gold from 1988 to 1999 from two open pits in low-grade oxide and sulfide ore from siliceous deposits in the Richtex Formation. The Ridgeway deposit has strong geological similarities to Haile (Gillon et al., 1995, 1998). The saprolite, volcanic and metasedimentary rocks are quartz-sericite-pyrite altered in mineralized areas. Post-mineral mafic and diabase dikes crosscut the deposit and are often accompanied by shearing and/or faulting. Gold grade is related to lithology, cleavage development, pyrite grain size and abundance, and silica content. Molybdenite is also associated with the mineralization.
The mine and mill had a production capacity of 13,608 tpd. Ore was milled to minus 200 mesh, then fed into a modified carbon-in-leach circuit. Carbon was stripped of gold, electroplated onto steel wool cathodes, and then transferred to electro-refining cells where gold was plated onto stainless steel plates. Mine closure and reclamation were successfully completed in the early 2000's.
23.2Brewer Mine
The Brewer gold mine is located 12 km northeast of Haile in Jefferson County. Brewer rocks include schist, volcanics, and granite overlain by 40 to 60 ft of saprolite and sand. Gold mineralization is associated with quartz-sericite-pyrite altered schist, strong silicification and brecciation, and >2% pyrite. Gold ore was produced from a breccia body of hydrothermal origin and a related smaller body of fault-controlled ore. Pyrite content is generally 2% to 5%, unevenly distributed as aggregates and individual crystals in quartz veins. Gold grades were reported in the 1.41 g/t to 4.06 g/t range with associated silver, copper, tin, and bismuth. Brewer is classified as a high sulfidation breccia pipe hosted in the Persimmon Fork volcanics and may have deep porphyry roots.
Like Haile and other mines in the region, the mine produced gold intermittently, first as a placer, then as a surface and underground mine, and finally as a low-grade, heap leach operation in the 1980s. In 1987, Westmont Mining estimated a non-NI 43-101 compliant reserve for Brewer of 4.6 Mt grading 1.4 g/t gold (188,000 oz) (Scheetz, et al. 1991). The reserve does not conform to NI 43-101 standards and is reported for historical purposes only. The most recent production was from 1987 to 1995 by Westmont Mining/Costain Ltd Group. Ore was mined using conventional truck and loader open pit methods and ore was processed using cyanide leaching.
Brewer has been managed by the EPA as an active Superfund site since 1999 due to Acid Rock Drainage (ARD). Westmont mined and heap leached 12 Mt of ore with dilute cyanide solutions from 1987 to 1995. Heavy rains in April 1990 broke the tails dam; over 10 Mt of cyanide solution flowed into Little Fork Creek and downstream into Lynches Creek. The tails dam was repaired in 1991 and mining continued until 1995 when reserves were mined out. Mine reclamation commenced in 1995 with SCDES guidance.
As of December 31, 2025, OceanaGold has entered into a joint venture agreement with Carolina Rush for further exploration of the Brewer Mine Deposit.
| | | | | | | | |
Released: March 27, 2026 | | Page 248 of 275 |
| | | | | | | | |
NI 43-101 Technical Report – Haile Gold Mine, South Carolina, United States |
| |
| |
23.3Barite Hill Mine
The Barite Hill Mine is located 4 km southwest of McCormick, South Carolina. It is within the Lincolnton-McCormick Mining District, which includes other small mines and prospects of gold, silver, copper, zinc, lead, kyanite, and manganese.
The Barite Hill deposit was mined from 1989 to 1994 by Nevada Goldfields, Inc. The mine produced 59,000 oz of gold (1.8 million grams) and 109,000 oz (3.4 million grams) of silver, mainly from oxidized ore in the 20-acre (8 ha) Main Pit and the 4-acre (1.6 ha) Rainsford Pit. The mine used conventional open pit mining methods and an on/off pad heap leach process.
In June 1999, Nevada Goldfields Inc. filed for Chapter 7 bankruptcy and abandoned the property. The property came under control of the South Carolina Department of Environmental Services (SCDEC) and the site became part of the EPA Superfund program. Reclamation and closure work began in October 2007.
The Barite Hill deposit is hosted by sericitized felsic metavolcanic and metasedimentary rock of the Persimmon Fork Formation. The deposit occurs along the contact between upper and lower pyroclastic units. Mafic to intermediate post-mineralization dikes and sills cross-cut NE-trending mineralized zones. Multiple Main Pit ore zones are associated with lenses of siliceous barite rock and pyrite-quartz altered breccias, some of which are offset by normal faulting. Rainsford Pit ore zones are associated with silicified rock and chert. The Barite Hill deposit is interpreted to be the result of a Kuroko-type submarine volcanogenic base-metal sulfide system followed by epithermal precious metal deposition (Clark, 1999).
| | | | | | | | |
Released: March 27, 2026 | | Page 249 of 275 |
| | | | | | | | |
NI 43-101 Technical Report – Haile Gold Mine, South Carolina, United States |
| |
| |
24 Other Relevant Data and Information
The QP knows of no other relevant data or information available at this time, other than what has been presented, to make the Technical Report understandable and not misleading.
| | | | | | | | |
Released: March 27, 2026 | | Page 250 of 275 |
| | | | | | | | |
NI 43-101 Technical Report – Haile Gold Mine, South Carolina, United States |
| |
| |
25 Interpretation and Conclusions
25.1Geology and Mineralization
Haile is situated within the northeast-trending Carolina Terrane, also known as the Carolina Slate Belt, which hosts the past-producing Ridgeway, Brewer and Barite Hill gold mines in South Carolina. Haile is the largest gold deposit in the eastern USA. The Haile district consists of nine gold deposits within a 3.5 km x 1 km area. The deposits occur within a variably deformed ENE-trending structural zone at or near the contact between metamorphosed Neoproterozoic volcanic and sedimentary rocks. The deposits are hosted in laminated siltstones and volcanic rocks of the Upper Persimmon Fork Formation and are dissected by barren NNW-striking diabase dikes. Deformation includes brittle and ductile styles with ENE-trending foliation, faults, brecciation, and isoclinal folds. Sedimentary rocks are folded within an ENE-trending anticlinorium with a steep SE limb and a gentle NW limb. The age of gold mineralization is assumed at ~549 Ma, based on closely associated molybdenite dated using Rhenium-Osmium (Re-Os) isotopes (Mobley et al., 2014), which postdates peak volcanism. The Re-Os date coincides with a major tectonostratigraphic change from intermediate volcanism and tuffaceous to epiclastic sedimentation to basinal turbiditic sedimentation. Quartz-sericite-pyrite alteration is overprinted by regional greenschist facies metamorphism with carbonate-chlorite-pyrite alteration. Pressure shadows around pyrite grains, stretched pyrite and pyrrhotite grains, and flattened hydrothermal breccia clasts indicate that some deformation has occurred subsequent to sulfide mineralization. However, the bulk geometry and orientation of the deposits, and association of mineralization with structures hosting late-stage dykes, imply emplacement subsequent to folding.
Haile is currently interpreted as a structurally controlled, low-sulfidation, disseminated gold deposit with local epithermal veining.
25.2Resource Estimation
The Mineral Resources, which include Mineral Reserves, have been estimated in accordance with the Canadian Institute of Mining, Metallurgy and Petroleum Standard Definitions for Mineral Resources and Mineral Reserves dated May 10, 2014 (CIM definitions).
OceanaGold has a comprehensive Resource model governance process in places, including model validation, peer review, external review and production reconciliation. OceanaGold continue to develop and improve these processes.
25.2.1Open Pit
The drillhole database and Resource estimation methodology are appropriate for the purposes of estimating the open pit gold Resources. In addition to QA/QC processes, this is supported by reasonable long term Resource model to mine-to-mill reconciliation performance. The local grade variability remains a challenge and open pit reconciliation analysis together with sensitivity modeling, suggest that the short to medium term reconciliation variance previously experienced will remain a feature of the Resource estimates.
| | | | | | | | |
Released: March 27, 2026 | | Page 251 of 275 |
| | | | | | | | |
NI 43-101 Technical Report – Haile Gold Mine, South Carolina, United States |
| |
| |
25.2.2Underground
The drillhole database and Resource estimation methodology are appropriate for the purposes of estimating the underground gold Resources. OceanaGold has completed industry standard Resource definition drilling at Horseshoe, Palomino and Ledbetter underground deposits to support the current Mineral Resource estimation. The work has been accompanied by an industry standard QA/QC program showing good quality analytical results. OceanaGold has conducted extensive core logging resulting in a high-quality geologic model. The results of the drilling, sampling, analytical testing, core logging and geologic interpretation provide good support for an industry standard Resource estimation.
25.3Status of Exploration, Development and Operations
Systematic target generation and rationalization supported by mapping, drilling, geochemistry, and geophysics will continue to guide exploration over the next five years, particularly in the search for underground deposits. Regional exploration is ongoing.
Reserve growth has been enabled by 3D geologic interpretation, higher gold prices, and deeper drilling of a previously underexplored gold system. This has been recently exemplified by continued growth of the Horseshoe underground reserve (0.52 Moz) in 2023 and announcement of an initial reserve at Palomino in 2024 (0.38 Moz).
In-house core drilling continues by OceanaGold focused on high-grade underground targets proximal to the sedimentary-volcanic contact and at the base of metasedimentary rocks. Underground development at the Horseshoe deposit in 2023 has provided access for underground drill stations, and as development continues, will extend access along the prospective 2 km long Horseshoe-Palomino trend.
25.4Mining Reserves
The Mineral Reserves have been estimated in accordance with the Canadian Institute of Mining, Metallurgy and Petroleum Standard Definitions for Mineral Resources and Mineral Reserves dated May 10, 2014 (CIM definitions).
The Project confirms a positive cash flow using only Measured and Indicated resources for the conversion of Mineral Reserves using a US$2,200/oz gold price and US$25/oz silver price.
An open pit vs. underground trade-off study has been completed that shows the mineralization that formed the basis of the Ledbetter Phase 04 open pit phase produces a better economic outcome when mined by underground methods. Ledbetter Phase 04 has been removed from the open pit Mineral Reserve and added to the underground Mineral Reserve. This change is reflected in the operating schedule and economic assessment presented in this report.
The mine plan is based on a specific set of assumptions and therefore the results of this Technical Report are subject to various risks including, but not limited to:
•Commodity prices and foreign exchange assumptions (particularly relative movement of gold and oil prices)
•Unanticipated inflation of capital or operating costs
•Significant changes in equipment productivities
| | | | | | | | |
Released: March 27, 2026 | | Page 252 of 275 |
| | | | | | | | |
NI 43-101 Technical Report – Haile Gold Mine, South Carolina, United States |
| |
| |
•Geotechnical assumptions
•Ore dilution or loss
•Throughput and recovery rate assumptions
25.4.1Open Pit
Open pit mining is completed using conventional drill-and blast and load-and-haul methods with diesel-hydraulic excavators and diesel rigid-frame dump-trucks. The mine design supports the style and size of equipment selected for operations.
The mine operating and capital costs have been estimated from first principles and operational knowledge from current mine operations. The equipment is sized to meet minimum SMU requirements that support the dilution and mine recovery factors while providing bulk earthwork capability for the expected production rates.
As well as the general risks noted above, technical risks to the open pit Mineral Reserve have been reviewed and there are two specific relevant risk areas have been identified.
Beyond the usual geotechnical risk associated with open pit mining, the south wall of Ledbetter Phase 3 is currently under evaluation and management for an area of instability. The main risk from any required management is potentially to schedule and cost for remediating this area and continued mining beneath the area under management. This is not considered to be a material risk to the Mineral Reserve.
The depleted Mill Zone open pit is currently being used for excess water storage. This has the potential to limit access to the Haile Phase 2 open pit, due to the planned mining of the saddle between Haile Phase 1 and Mill Zone. Management plans are in place to remove the water in Mill Zone prior to the planned schedule for mining Haile Phase 2, and is therefore not considered to be a material risk to the Mineral Reserve.
OceanaGold knows of no existing environmental, permitting, legal, socio-economic, marketing, political, or other factors that might materially affect the Mineral Reserve estimate.
25.4.2Underground
Geotechnical
Geotechnical field characterization programs have been undertaken to assess the expected rock quality at the underground targets. These programs included geotechnical core logging, laboratory strength testing, in situ stress measurements and oriented core logging of discontinuities. The results of these programs have provided adequate quantity and quality of data for feasibility-level designs of Horseshoe, Palomino, and Ledbetter.
Geotechnical assessments of the Horseshoe, Palomino, and Ledbetter orebody shapes and ground conditions have determined that longhole open stoping mining is an appropriate mining method. The design has been laid out using empirical design methods based on similar case histories. Stopes have been sized to maintain stability once mucked empty. A primary/secondary extraction sequence with tight backfilling allows optimization of ore recovery while maintaining ground stability. Primary stopes will be backfilled with cemented rockfill.
| | | | | | | | |
Released: March 27, 2026 | | Page 253 of 275 |
| | | | | | | | |
NI 43-101 Technical Report – Haile Gold Mine, South Carolina, United States |
| |
| |
Mining
Longhole stoping is seen as the appropriate mining method for the three underground deposit geometries. The large stope sizes minimize cost, and grades are not overly diluted. Mine planning work considered revenue for Au and a CoG of 1.86 g/t Au was used for design purposes. A 3D detailed mine design was completed.
Productivities were developed from first principles and using historical performance data. Input from mining contractors, blasting suppliers and equipment vendors was considered for key parameters such as drilling penetration rates, blasthole size and spacing, explosives loading time, bolt and mesh installation time, etc. The rates developed from first principles were adjusted based on benchmarking and the experience and judgment of OceanaGold. Equipment used is standard equipment used worldwide with standard package/automation features.
The UG production schedule was completed using Deswik scheduling software and is based on mining operations occurring 365 days/year, seven days/week, with two 12-hour shifts each day. A production rate of approximately 3,000 metric tonnes per day (t/d) was targeted with ramp-up to full production as quickly as possible. Resource levelling was used on a monthly basis for ore tonnage and lateral development.
25.5Mineral Processing and Metallurgical Testing
The Haile process plant has been in operation for approximately 9 years and has been progressively upgraded from its original nameplate capacity of 2.3 Mt/yr and planned to treat up to 3 Mt/yr through utilizing existing equipment. Recovery of gold from both concentrate and flotation tailings streams is in line with modeling from ore testwork and provides a robust estimate of gold recovery.
Ongoing future ore test programs are conducted on material in the LoM plan and on any new proposed resources. The laboratory flowsheet has been effective at predicting the recovery performance of the sulfide ore sources tested and treated in the plant.
No novel, experimental or unproven technologies are used for the Haile process plant.
25.6Recovery Methods
There has been no effective change to the existing plant recovery method for the plant following its expansion compared to the original circuit configuration. Ongoing metallurgical development will continue to target improvements in gold recovery and focusing on controlling unit costs and seek upside from improved mill utilization in the future.
The processing rates required to support the LoM plan are within the capability demonstrated by the process plant historically.
A planned upgrade to the concentrate leach circuit is moving into execution to increase residence time prior to the Ledbetter Underground ore reaching the plant to offset the effects of gold deportment in tellurides in part of the resource.
| | | | | | | | |
Released: March 27, 2026 | | Page 254 of 275 |
| | | | | | | | |
NI 43-101 Technical Report – Haile Gold Mine, South Carolina, United States |
| |
| |
25.7Project Infrastructure
Open Pit Infrastructure
A significant portion of the required open pit infrastructure is in place as part of the existing operation. The remaining requirements are overburden storage facilities and the costs for these are included as sustaining capital.
Tailings and Overburden Infrastructure
Duckwood TSF Stage 4 expected to be completed in the 1st Quarter of 2026and Stage 5 has begun. Stage 5 expansion will require several road relocations that will need to be coordinated with the State of South Carolina. The Underdrain Collection Pond and run-off collection channels will need to be relocated. The final phase of West PAG OSA is currently under construction.
Underground Support Infrastructure
A significant portion of the required underground infrastructure is in place as part of the existing operation for the Horseshoe deposit which will support the Palomino development except for extension of high voltage power lines and the sinking of a ventilation shaft to support necessary airflow requirements.
Ledbetter underground development will include the capital costs to support the construction of all necessary facilities to support mining as a stand-alone deposit.
25.8Environmental Studies and Permitting
There is a significant amount of existing background and environmental baseline data available for the Project. This data continues to be collected and reported to the regulators as part of operational controls.
In Q1 2024, South Carolina Department of Health and Environmental Control approved two modifications to Haile’s Mine Operating Permit. An expansion of the Horseshoe underground operation was approved on February 21, 2024, and the Palomino underground operation was approved on March 15, 2024. A permit modification will be completed in 2027 for the change of mining method for Ledbetter Phase 4 from an Open Pit to and Underground.
Permits currently held by the HGM may be kept, modified, terminated, or replaced during the mining process.
25.9Economic Analysis
The Project consists of an operating surface and underground mine with a mill. The milling facility is mainly fed by the OP mine. The mill feed is supplemented with ore from a UG 1.6 Mt/yr max annual capacity operation.
The Project is expected to produce 1.9 Moz of payable gold over a 11-year life at an average rate of 172 koz Au per year during full production years with a LoM AISC of US$1,592/oz Au.
The Project is expected to incur sustaining capital in the amount of US$574 million over the modeled life and a non-sustaining capital spend, including rehabilitation costs, of US$539 million for total capital expenditure of US$1,113 million.
| | | | | | | | |
Released: March 27, 2026 | | Page 255 of 275 |
| | | | | | | | |
NI 43-101 Technical Report – Haile Gold Mine, South Carolina, United States |
| |
| |
Project metrics using a constant US$2,200/oz gold price include pre-tax and after-tax NPV 5% values of US$462 million and US$414 million, respectively. This result would change at higher metal prices. Because the Project is operational and is valued on a total project basis and not by an incremental analysis, an IRR value is not relevant in this analysis. In terms of sensitivity, the Project is, not surprisingly, most sensitive to gold grade and price followed by operating costs and capital costs.
| | | | | | | | |
Released: March 27, 2026 | | Page 256 of 275 |
| | | | | | | | |
NI 43-101 Technical Report – Haile Gold Mine, South Carolina, United States |
| |
| |
26 Recommendations
26.1Recommended Work Programs
26.1.1Exploration
OceanaGold aims to continue to expand Resources and Reserves in the Haile district through core drilling aligned with LoM plans. OceanaGold are executing up to 35,000 m of drilling from surface and underground platforms to support this. Systematic target generation and rationalization driven by mapping, drilling, geochemistry, and geophysics will continue to guide exploration over the next five years, particularly in the search for underground deposits. OceanaGold has developed advanced lithogeochemistry models and structural frameworks that will be used to define the next generation of targets.
These 3D geologic models continue to be integrated with metallurgical data to facilitate and enhance geometallurgical modeling. OceanaGold continues to use portable XRF testing or other technologies to further refine the geology interpretation (in tandem with in-pit studies).
26.1.2Resource Estimation
Open Pit
OceanaGold continue to optimize the gold estimation methodology via reconciliation analysis and geological review. Also, the Company continues to focus on capturing geometallurgical characteristics in the resource block model.
Continued infill drilling programs for open pit resources with focus on risk mitigation and conversion drilling to Measured and Indicated Resources.
Underground
A rolling front of pre-production infill drilling at approximately 15 m x 15 m spacing will be maintained from underground development to provide additional confidence in the tonnes and grade to support a Measured Mineral Resource and refine the mine design. A small number of longitudinal holes will better define cross-cutting barren diabase dike swarms sub-parallel to existing drilling. Future capital development and resource infill drilling will further improve the geological interpretation.
Continue to collect additional metallurgical samples from drilling core to confirm recovery estimates for both Palomino and Ledbetter underground deposits.
26.1.3Status of Exploration; Development and Operations
OceanaGold continues to expand resources adjacent to open pit and underground reserves in the Haile district through core drilling aligned with LoM plans.
| | | | | | | | |
Released: March 27, 2026 | | Page 257 of 275 |
| | | | | | | | |
NI 43-101 Technical Report – Haile Gold Mine, South Carolina, United States |
| |
| |
26.1.4Mining and Reserves
Open Pit
Key recommendations for open-pit mining include:
•Continue to identify additional continuous improvement initiatives focusing on drill / blast practices, equipment performance, technician and operator training, and other cost reduction opportunities.
•Continue to develop and implement mitigation plans for geotechnical anomaly in the South Wall of the Ledbetter open-pit.
•Continue to develop management plans for the water currently stored in Mill Zone to mitigate the risk to mining in the Haile open-pit.
These recommendations are being actioned internally by HGM and OceanaGold staff, with costs included in the operating costs shown in Section 21.
Underground
Completion of feasibility study for paste tailings usage is recommended as this geotechnical study is advanced. Additional geochemical material characterization is recommended. Although the base case design considers cemented rock fill material for backfilling stopes, the option for using paste fill is still under consideration. If the paste fill solution is chosen, the necessary underground infrastructure should be re-evaluated.
26.1.5Mineral Processing and Metallurgical Testing
Ongoing mineralogical and diagnostic leach work on monthly composites should continue to track gold deportment and losses as each ore source is processed to track variability and understand the impact of regrind size impact for each stage.
Infill drilling presents the opportunity to continue test work on available core samples to confirm recovery estimates for any new reserves that are defined. This should occur as material becomes available to de-risk the use of current budgeting models and to ensure any new sources are not affected by telluride minerology.
A structured geometallurgical program should continue to focus on understanding expected ore competency to allow for improved scheduling and blending to maximize throughput opportunities.
Modification of the current concentrate leach circuit to a separate CIP train should be completed prior to Ledbetter Underground ore production to ensure maximum gold recovery can be achieved.
26.1.6Project Infrastructure
General site and open-pit infrastructure is either established or processes are established for further expansion. There are no further recommendations currently.
| | | | | | | | |
Released: March 27, 2026 | | Page 258 of 275 |
| | | | | | | | |
NI 43-101 Technical Report – Haile Gold Mine, South Carolina, United States |
| |
| |
26.1.7Environmental Study Results
Recommend establishing Best Management Practice Devices – 1) Erosion Prevention – slope surfaces, seeding, and erosion controls; 2) Sediment Control - check dams, sediment dams, sediment ponds, and silt fencing and 3) Additional biodiversity monitoring – benthic, avian, bat, turtle, and fish surveys.
26.1.8Economic Analysis
The current metal price environment is strong. If prices are forecast to remain elevated for long periods, the Project reserves and resources should be updated and optimized and evaluated with an economic model at a revised price deck reflective of the long-term price forecasts.
26.2Recommended Work Program Costs
Table 26-1 lists the estimated costs for the recommended work described in section 25. Note that these costs are not included in the cost schedules presented in Section 21.
| | | | | | | | |
Released: March 27, 2026 | | Page 259 of 275 |
| | | | | | | | |
NI 43-101 Technical Report – Haile Gold Mine, South Carolina, United States |
| |
| |
Table 26-1: Summary of Costs for Recommended Work
| | | | | | | | | | | |
Discipline | Program Description | Cost
(US$) | No Further Work is Recommended Reason: |
Exploration | OceanaGold exploration programs and development drilling | 8,300,000 |
|
Resource Estimation | Open Pit and Underground Infill drilling programs |
| Included in Section 21 costs |
Mining and Reserves – Open Pit Mining | Identify Continuous Improvement initiatives |
| Salaries Only |
Mining and Reserves – Open Pit Mining | Ledbetter South Wall Mitigation | 5,000,000 |
|
Mining and Reserves – Open Pit Mining | Mill Zone Water Management Plans |
| Included in Section 21 costs |
Mining and Reserves – Underground Mining | Complete Paste Fill Feasibility Study | 1,500,000 |
|
Mining and Reserves – Open Pit and Underground Mining | Improve geometallurgical models – Plant throughput and metallurgical recovery | 500,000 |
|
Mineral Processing and Metallurgical Testing | Regrind size impact study | 200,000 |
|
Mineral Processing and Metallurgical Testing | CIL circuit upgrades |
| Included in Section 21 costs |
Environmental Studies | Construction of Best Management Practice Devices with new infrastructure |
| Included in Section 21 Costs |
Environmental Studies | Additional biodiversity monitoring |
| Included in Section 21 Costs |
Economic Analysis | Site-wide mine schedule optimization and economic evaluation |
| Salaries Only |
Total US$ |
| 15,500,000 |
|
Source: OceanaGold 2025
| | | | | | | | |
Released: March 27, 2026 | | Page 260 of 275 |
| | | | | |
| |
NI 43-101 Technical Report – Haile Gold Mine, South Carolina, United States |
27 References
ALS Metallurgy Kamloops, BC, Canada, December 2016, Comminution Testing on Samples from the Haile Gold Mine KM 5180
ALS Metallurgy Kamloops, BC, Canada, Comminution and Thickening Testing for Haile Gold Mine KM 5293
Ayuso, R. A., Wooden, J. L., Foley, N. K., Seal, R. R., and Sinha, A. K., 2005, U-Pb Zircon Ages and Pb Isotope Geochemistry of Gold Deposits in the Carolina Slate Belt of South Carolina: Economic Geology, v. 100, p. 225-252.
Bell, H., 1980. Preliminary geologic map and section of the Kershaw quadrangle, Kershaw and Lancaster Counties, South Carolina: U.S. Geological Survey Open-File Report 80-226, 1 Plate: 33.60 x 30.42 inches, https://doi.org/10.3133/ofr80226.
BGC Engineering Inc., 2017. “Haile Gold Mine Optimization Study - Open Pit Slope Designs”, Final report issued to OceanaGold Corp. July 21, 2017
Bierlein, F.P., & Crowe, D. (2000).Phanerozoic Orogenic Lode Gold Deposits. Reviews in Economic Geology, 103-139.
Butler, J. R., and Secor, D. T., 1991, The Central Piedmont, in Horton, W., and Zullo, V., eds., The Geology of the Carolinas: Knoxville, TN, University of Tennessee Press, p. 59-78.
Call & Nicholas, Inc. (2022). Design Angle Recommendations for the Haile Gold Mine, June 20, 2022.
CIM (2014). Canadian Institute of Mining, Metallurgy and Petroleum (CIM) Standards on Mineral Resources and Reserves: Definitions and Guidelines, May 10, 2014.
Clark, L., and R. Pakalnis (1997). An Empirical Design Approach for Estimating Unplanned Dilution from Open Stope Hangingwalls and Footwalls. Presentation at 99th Canadian Institute of Mining annual conference, Vancouver, B.C.
Clark, S., 1999, Geologic Maps and Block Diagrams of the Barite Hill Gold-Silver Deposit and Vicinity, South Carolina and Georgia: U.S. Geological Survey Open-File Report 99-148A
Cochrane, D.R., 1986, In-house notes on geological mapping new Haile-Bumalo pits and immediate environs: Piedmont Mining Company, Inc., Kershaw, South Carolina, unpublished report, p. 73, Four maps.
Daniels, D., 2005 South Carolina Aeromagnetic and Gravity Maps and Data: USGS Open-File Report 2005-1022
Feiss, P. G., Vance, R. K., and Weslowki, D. J., 1993, Volcanic rock hosted gold and base metal mineralization associated with Neoproterozoic-Early Paleozoic back-arc extension in the Carolina Terrane, southern Appalachian Piedmont: Geology, v. 21, p. 439-442.
| | | | | | | | |
Released: March 27, 2026 | | Page 261 of 275 |
| | | | | |
| |
NI 43-101 Technical Report – Haile Gold Mine, South Carolina, United States |
Foley, N. K., Ayuso, R. A., and Seal, R. R., 2001, Remnant colloform pyrite at the Haile gold deposit, South Carolina: A textural key to genesis: Economic Geology, v. 96, p. 891-902.
Foley, N. K., and Ayuso, R. A., 2012, Gold deposits of the Carolina slate belt, southeastern United States: Age and origin of the major gold producers: USGS open file report 2012-1179
Fullagar, P. D., and Butler, J. R., 1979, 325 to 265 Ma-old granitic plutons in the Piedmont of the southeastern Appalachians: American Journal of Science, v. 279, p. 161-185
G&T Metallurgical Services Ltd (G&T), Kamloops, Canada November 24, 2011, Flotation & Cyanidation Testing on Samples from the Horseshoe Deposit, Haile Gold Mine KM3076
Gekko Global Cyanide Detox Group (Gekko), Ballarat, Australia, July 18, 2016, OceanaGold Haile Gold Mine Cyanide Detox Test Work DTXSC021
Gillon, K.A., Spence, W.H., Duckett, R.P., and Benson, C.J., 1995, Geology of the Ridgeway gold deposits, Ridgeway, South Carolina: Society of Economic Geologists Guidebook Series, v. 24, p. 53–94.
Gillon, K.A., Mitchell, T.L., Dinkowitz, S.R., Barnett, R.L., 1998, The Ridgeway gold deposits -A window to the evolution of a Neoproterozoic intra-arc basin in the Carolina Terrane, South Carolina: South Carolina Geology, 40, p. 29–70.
Haile 2025, Haile Environmental Studies, Permitting & Social or Community Impact Report, by Haile Gold Mine, Kershaw, South Carolina, December 31, 2025
Hardy, L. S., 1989, Hydrothermal potassium feldspar at the Haile gold mine, South Carolina: Economic Geology, v. 84, p. 2307-2310.
Hayward,N., 1991, Orogenic processes, deformation, and mineralization history of portions of the Appalachian orogen, USA, based on microstructural analysis (Doctoral dissertation, James Cook University of North Queensland)
Hayward, N., 1992, Controls on syntectonic replacement mineralization in parasitic antiforms, Haile gold mine, Carolina Slate Belt, U. S. A.: Economic Geology, v. 87, p. 91-112.
Hibbard, J. P., Shell, G., Bradley, P., Samson, S., and Wortman, G., 1998, The Hyco shear zone in North Carolina and southern Virginia: implications for the Piedmont zone-Carolina zone boundary in the southern Appalachians: American Journal of Science, v. 298, p. 85 - 107.
Hibbard, J.P., van Staal, C.R., and Rankin, D.W., 2010, Comparative analysis of the geological evolution of the northern and southern Appalachian orogen: Late Ordovician-Permian: in Tollo, R.P., Bartholomew, M.J., Hibbard, J.P., and Karabinos, P.M., eds., From Rodinia to Pangea: The Lithotectonic Record of the Appalachian Region: Geological Society of America Memoir 206, p. 51-69.
| | | | | | | | |
Released: March 27, 2026 | | Page 262 of 275 |
| | | | | |
| |
NI 43-101 Technical Report – Haile Gold Mine, South Carolina, United States |
Hibbard, J.P., Stoddard, E. F., Secor, D. T., and Dennis, A. J., 2002, The Carolina Zone: overview of Neoproterozoic to early Proterozoic peri-Gondwanan Terranes along the eastern flank of the southern Appalachians; Earth Science reviews vol. 57, pp. 299-339.
Hutchinson, Douglas J, and Mark S. Diederichs. Cablebolting in Underground Mines. Richmond, B.C: BiTech Publishers, 1996. Print.
Jory, J., 2019, Haile legacy 1975-1994 drillhole data validation 2019, OceanaGold internal report, 11 p.
KML Metallurgical Services, (KML), Kershaw, South Carolina, December 27, 2012, HGM Years 1 – 3 Silver Characterization Project Test Report
Larson, A., and Worthington, J.,1989, Geophysical mapping at the Haile mine: report for Piedmont Mining Company, January 1989, 22p.
Maddry, J.W., and Kilbey, T.R., 1995, Geology of the Haile gold mine, selected mineral deposits of the Gulf Coast and southeastern United States: Part II. Gold deposits of the Carolina slate belt: Society of Economic Geologists Guidebook Series, v. 24, p. 147−172.
Mathews, K. E., Hoek, D.C., Wyllie, D.C., and Stewart, S.B.V. 1980. Prediction of stable excavation spans for mining at depths below 1000 metres in hard rock. Report to Canada Centre for Mining and Energy Technology (CANMET), Department of Energy and Resources; DSS File No. 17SQ.23440-0-90210. Ottawa, 1980.
McCauley, C. K., and Butler, J. B.,1966, Gold resources of South Carolina, Bulletin 32, State Development Board, South Carolina, 76 p.
Metso Minerals Industries Inc. (Metso), York, Pennsylvania, December 7, 2009, Test Plant Report No. 20000134-135
Metso Minerals Industries, Inc. (Metso), York, Pennsylvania, February 2011, Stirred Media Detritor and Jar Mill Grindability Test on Bulk Flotation Concentrate T11-04
Mitchell, RJ, Olsen, RS & Smith, JD 1982, ‘Model studies on cemented tailings used in mine backfill’, Canadian Geotechnical Journal, vol. 19, no. 1, pp. 14–28.
Mobley, R.M., Yogodzinski, G.M., Creaser, R.A., and Berry, J.M., 2014, Geologic History and Timing of Mineralization at the Haile Gold Mine, South Carolina: Economic Geology, v. 109, p. 1863-1881.
Newton, Edmund; Gregg, D.B.; Mosier, McHenry. (1940). “Operations at the Haile gold mine, Kershaw, SC” Information Circular: Volume 7111, U.S Department of the interior: Bureau of Mines.
Nystrom, P. G., Jr., Willoughby, R. H., and Price, L. K., 1991, Cretaceous and Tertiary stratigraphy of the upper Coastal Plain, South Carolina: in Horton, J. W., Jr., and Zullo, V. A. eds., The
| | | | | | | | |
Released: March 27, 2026 | | Page 263 of 275 |
| | | | | |
| |
NI 43-101 Technical Report – Haile Gold Mine, South Carolina, United States |
Geology of the Carolinas: Knoxville, Tennessee, The University of Tennessee Press, p. 221-240
Oceana Gold, 2024a, Haile Gold Mine Revised Overburden Classification Technical Support Document. Submitted to South Carolina Department of Health and Environmental Control, April 2024. 73 pp.
Oceana Gold, 2024b, Revised Haile Gold Mine Overburden Management Plan. Submitted to South Carolina Department of Health and Environmental Control, April 2024. 23 pp.
Pardee, J.T.; Park Jr., C.T. (1948) Gold deposits of the southern Piedmont: USGS Professional Paper 213.
Phillips Enterprises, LLC (Phillips) 17 September 2008, Progress Report #2 Process and Metallurgical Testing on Haile Gold Mine Ore Project No. 082003i
Pocock Industrial Inc. (Pocock) Salt Lake City, Utah, May 2009, Flocculant Screening, Gravity Sedimentation, Pulp Rheology, Vacuum Filtration and Pressure Filtration Studies Conducted for Romarco Minerals Haile Gold Project
Resource Development Inc. (RDi), Wheat Ridge, Colorado, September 16, 2009, Romarco Minerals, Inc. Haile Gold Project, Metallurgical Report
Resource Development Inc. (RDi), Wheat Ridge, Colorado, March 31, 2010, Romarco Minerals, Inc. Work Index Data for Haile Composite Sample
Resource Development Inc. (RDi), Wheat Ridge, Colorado, March 31, 2010, Romarco Minerals, Inc. Metallurgical Testing of Ledbetter Extension Samples
Resource Development Inc. (RDi), Wheat Ridge, Colorado, May 27, 2010, Romarco Minerals, Inc. Flash Flotation, Cyanide Destruction & Leaching of Concentrate and Tailing for Haile Composites
Resource Development Inc. (RDi), Wheat Ridge, Colorado, September 27, 2010, Romarco Minerals, Inc. Optimization of Leaching of Flotation Concentrate
Resource Development Inc. (RDi), Wheat Ridge, Colorado, August 2010, Metallurgical Testing of Horseshoe Zone Samples
Resource Development Inc. (RDi), Wheat Ridge, Colorado, June 6, 2011, Production of Flotation Concentrate and Confirmation Testing of Flowsheet
Schafer Limited LLC (2015). Revised Haile Gold Mine Overburden Management Plan. September 2015. 25 pp.
Schafer Limited LLC, 2019, Mine Expansion Plan Geochemistry Update – Haile Gold Mine. April 22, 2019.
Scheetz, J.W., Stonehouse, J. M., and Zwaschka, M. R., 1991, Geology of the Brewer Gold Mine in South Carolina: Mining Engineering, pp. 38-42
| | | | | | | | |
Released: March 27, 2026 | | Page 264 of 275 |
| | | | | |
| |
NI 43-101 Technical Report – Haile Gold Mine, South Carolina, United States |
Secor, D. T., Jr., and Wagener, H. D., 1968, Stratigraphy, structure and petrology of the Piedmont in Central South Carolina: Columbia, South Carolina: South Carolina Geological Survey, Geologic Notes, v. 12, p. 67-84.
Speer, W. E., and Maddry, J. W., 1993, Geology and recent discoveries at the Haile gold mine, Lancaster County, South Carolina: South Carolina Geology, v. 35, p. 9-26.
Spence, W. H., Maddry, J. W., Worthington, J. E., Jones, E. M., and Kiff, I. T., 1980, Origin of the gold mineralization at the Haile gold mine, Lancaster County, South Carolina: Mining Engineering, v. 32, p. 70-73.
SRK, (2017). Geochemical Summary Report Feasibility Study Haile Gold Mine Lancaster County, South Carolina, prepared for OceanaGold Corporation, by SRK Consulting (U.S.), Inc., D.Bird, June 2, 2017.
SRK, (2024). NI 43-101 Technical Report Haile Gold Mine Lancaster County, South Carolina, prepared for OceanaGold Corporation, by SRK Consulting (U.S.), Inc., D. Carr, D. Londono, J. Moore, B. Drury, L. Standridge, R. Cook, J.N. Janney-Moore, W.L. Kingston, M. Sullivan, B.M. Clarkson, March 28, 2024.
Stein, H. J., Markley, R. J., Morgan, J. W., Hannah, J. L., Zak, K., and Sundblad, K., 1997, Re-Os dating of shear-hosted Au deposits using molybdenite: in Papunen, H., ed., Mineral Deposits, Research and Explorations: Where Do They Meet? Proceedings of the Fourth Biennial SGA Meeting, Turku, Finland, 11-13 August 1997, p. 313-317.
Tomkinson, M. J. (1985) The geology, geochemistry and petrology of a number of gold deposits in the southern Appalachians. University of Southampton, Doctoral Thesis. Tomkinson, M. J., 1988, Gold mineralization in phyllonites at the Haile Mine, South Carolina: Economic Geology, v. 83, p. 1392-1400.
Tosdal, R.M., 2020, Haile structural geology evaluation, OceanaGold internal report.
Weis, T., 2016, Extended Haile geophysical interpretation: report for OceanaGold, December 2016, 143 p.
Womble Carlyle Sandridge & Rice, (2015). Titles and Mineral Rights Due Diligence Report, July 4, 2015.
Worthington, J. E., and Kiff, I.T., 1970, A suggested volcanogenic origin for certain gold deposits in the slate belt of the Carolina piedmont: Economic Geology, v. 65, p. 529-537.
US Climate Data. (n.d.). Climate Kershaw, South Carolina. https://www.usclimatedata.com/climate/kershaw/south-carolina/united-states/ussc0178US.
| | | | | | | | |
Released: March 27, 2026 | | Page 265 of 275 |
| | | | | |
| |
NI 43-101 Technical Report – Haile Gold Mine, South Carolina, United States |
28 Glossary
The Mineral Resources and Mineral Reserves have been classified according to CIM (CIM, 2014). Accordingly, the Resources have been classified as Measured, Indicated or Inferred, the Reserves have been classified as Proven, and Probable based on the Measured and Indicated Resources as defined below.
28.1Mineral Resources
A Mineral Resource is a concentration or occurrence of solid material of economic interest in or on the Earth’s crust in such form, grade or quality and quantity that there are reasonable prospects for eventual economic extraction. The location, quantity, grade or quality, continuity and other geological characteristics of a Mineral Resource are known, estimated or interpreted from specific geological evidence and knowledge, including sampling.
An Inferred Mineral Resource is that part of a Mineral Resource for which quantity and grade or quality are estimated on the basis of limited geological evidence and sampling. Geological evidence is sufficient to imply but not verify geological and grade or quality continuity. An Inferred Mineral Resource has a lower level of confidence than that applying to an Indicated Mineral Resource and must not be converted to a Mineral Reserve. It is reasonably expected that the majority of Inferred Mineral Resources could be upgraded to Indicated Mineral Resources with continued exploration, however, there is no guarantee that all or any part of an Inferred Mineral Resource will ever be upgraded to a higher category.
An Indicated Mineral Resource is that part of a Mineral Resource for which quantity, grade or quality, densities, shape and physical characteristics are estimated with sufficient confidence to allow the application of Modifying Factors in sufficient detail to support mine planning and evaluation of the economic viability of the deposit. Geological evidence is derived from adequately detailed and reliable exploration, sampling and testing and is sufficient to assume geological and grade or continuity between points of observation. An Indicated Mineral Resource has a lower level of confidence than that applying to a Measured Mineral Resource and may only be converted to a Probable Mineral Reserve. A Measured Mineral Resource is that part of a Mineral Resource for which quantity, grade or quality, densities, shape, and physical characteristics are estimated with confidence sufficient to allow the application of Modifying Factors to support detailed mine planning and final evaluation of the economic viability of the deposit. Geological evidence is derived from detailed and reliable exploration, sampling and testing and is sufficient to confirm geological and grade or quality continuity between points of observation. A Measured Mineral Resource has a higher level of confidence than that applying to either an Indicated Mineral Resource or an Inferred Mineral Resource. It may be converted to a Proven Mineral Reserve or to a Probable Mineral Reserve.
28.2Mineral Reserves
A Mineral Reserve is the economically mineable part of a Measured and/or Indicated Mineral Resource. It includes diluting materials and allowances for losses, which may occur when the material is mined or extracted and is defined by studies at Pre-Feasibility or Feasibility level as appropriate that include application of Modifying Factors. Such studies demonstrate that, at the time of reporting, extraction could reasonably be justified.
| | | | | | | | |
Released: March 27, 2026 | | Page 266 of 275 |
| | | | | |
| |
NI 43-101 Technical Report – Haile Gold Mine, South Carolina, United States |
The reference point at which Mineral Reserves are defined—typically the location where the ore is delivered to the processing plant—must be clearly identified and specified in the report.
It is important that, in all situations where the reference point is different, such as for a saleable product, a clarifying statement is included to ensure that the reader is fully informed as to what is being reported. The public disclosure of a Mineral Reserve must be demonstrated by a Pre-Feasibility Study or Feasibility Study.
A Probable Mineral Reserve is the economically mineable part of an Indicated Mineral Resource, and in some circumstances, a Measured Mineral Resource. The confidence in the Modifying Factors applying to a Probable Mineral Reserve is lower than that applying to a Proven Mineral Reserve.
A Proven Mineral Reserve is the economically mineable part of a Measured Mineral Resource. A Proven Mineral Reserve implies a high degree of confidence in the Modifying Factors.
28.3Definition of Terms
The following general mining terms may be used in this report.
Table 28-1: Definition of Terms
| | | | | |
Term | Definition |
Assay | The chemical analysis of mineral samples to determine the metal content. |
Capital Expenditure | All other expenditures not classified as operating costs. |
Composite | Combining more than one sample result to give an average result over a larger distance. |
Concentrate | A metal-rich product resulting from a mineral enrichment process such as gravity concentration or flotation, in which most of the desired mineral has been separated from the waste material in the ore. |
Crushing | Initial process of reducing ore particle size to render it more amenable for further processing. |
Cut-off Grade
(CoG) | The grade of mineralized rock, which determines as to whether or not it is economic to recover its gold content by further concentration. |
Dilution | Waste, which is unavoidably mined with ore. |
Dip | Angle of inclination of a geological feature/rock from the horizontal. |
Fault | The surface of a fracture along which movement has occurred. |
Footwall | The underlying side of an orebody or stope. |
Grade | The measure of concentration of gold within mineralized rock. |
Hanging wall | The overlying side of an orebody or slope. |
Haulage | A horizontal underground excavation which is used to transport mined ore. |
Hydrocyclone | A process whereby material is graded according to size by exploiting centrifugal forces of particulate materials. |
Igneous | Primary crystalline rock formed by the solidification of magma. |
| | | | | | | | |
Released: March 27, 2026 | | Page 267 of 275 |
| | | | | |
| |
NI 43-101 Technical Report – Haile Gold Mine, South Carolina, United States |
| | | | | |
Term | Definition |
Kriging | An interpolation method of assigning values from samples to blocks that minimizes the estimation error. |
Level | Horizontal tunnel the primary purpose is the transportation of personnel and materials. |
Lithological | Geological description pertaining to different rock types. |
LoM Plans | Life-of-Mine plans. |
Material Properties | Mine properties. |
Milling | A general term used to describe the process in which the ore is crushed and ground and subjected to physical or chemical treatment to extract the valuable metals to a concentrate or finished product. |
Mineral/Mining Lease | A lease area for which mineral rights are held. |
Mining Assets | The Material Properties and Significant Exploration Properties. |
Ongoing Capital | Capital estimates of a routine nature, which is necessary for sustaining operations. |
Overburden | Material that overlies a mineral deposit and must be removed prior to mining. At Haile, overburden is waste material mined from the open pits. |
Pillar | Rock left behind to help support the excavations in an underground mine. |
RoM | Run-of-Mine. |
Sedimentary | Pertaining to rocks formed by the accumulation of sediments, formed by the erosion of other rocks. |
Shaft | An opening cut downwards from the surface for transporting personnel, equipment, supplies, ore and waste. |
Sill | A thin, tabular, horizontal to sub-horizontal body of igneous rock formed by the injection of magma into planar zones of weakness. |
Smelting | A high temperature pyrometallurgical operation conducted in a furnace, in which the valuable metal is collected to a molten matte or doré phase and separated from the gangue components that accumulate in a less dense molten slag phase. |
Stope | Underground void created by mining. |
Stratigraphy | The study of stratified rocks in terms of time and space. |
Strike | Direction of line formed by the intersection of strata surfaces with the horizontal plane, always perpendicular to the dip direction. |
Sulfide | A sulfur bearing mineral. |
Tailings | Finely ground waste rock from which valuable minerals or metals have been extracted. |
Thickening | The process of concentrating solid particles in suspension. |
Total Expenditure | All expenditures including those of an operating and capital nature. |
| | | | | | | | |
Released: March 27, 2026 | | Page 268 of 275 |
| | | | | |
| |
NI 43-101 Technical Report – Haile Gold Mine, South Carolina, United States |
| | | | | |
Term | Definition |
Variogram | A statistical representation of the characteristics (usually grade). |
Waste | Rock that must be broken and disposed of to gain access to and excavate the ore. Costs of mining and processing exceed the value of recoverable metals. At Haile, waste refers to material produced from underground mine development. |
28.4Abbreviations
The following abbreviations may be used in this report.
Table 28-2: Abbreviations
| | | | | |
Abbreviation | Unit or Term |
% | percent |
~ | approximately |
° | degree |
°C | temperature in degrees Celsius |
°F | temperature in degrees Fahrenheit |
2D | two-dimensional |
3D | three-dimensional |
ABA | Acid-Base Accounting |
AGP | acid generation potential |
AHK | AHK Geochem |
AISC | All-In Sustaining Cost |
AHK | Alfred H Knight |
ALS | ALS Limited |
ANP | Acid Neutralization Potential |
ARD | acid rock drainage |
Au | gold |
Amax | Amax Gold Inc. |
BD | bulk density |
BLM | United States Department of the Interior Bureau of Land Management |
| |
BMWi | Bond Ball Mill Work Index |
Breccia | brecciated rocks |
Cat | Caterpillar |
CDF | cumulative distribution functions |
CIL | Carbon-In-Leach |
| | | | | | | | |
Released: March 27, 2026 | | Page 269 of 275 |
| | | | | |
| |
NI 43-101 Technical Report – Haile Gold Mine, South Carolina, United States |
| | | | | |
CIM | Canadian Institute of Mining, Metallurgy and Petroleum |
CIT | Corporate Income Tax |
CoG | cut-off grade |
COK | Ordinary Co-kriging |
cm | centimetre |
CPS | coastal plain sands |
CRF | cemented rock backfill |
CRM | Certified Reference Materials |
CSB | Carolina Slate Belt |
Cyprus | Cyprus Exploration Company |
CWTP | Contact Water Treatment Plant |
DAC | design acceptance criteria |
DDH | diamond drilling |
DWi | drop weight index |
EA & SP | External Affairs and Social Performance |
ELOS | equivalent linear overbreak/slough |
EM | electromagnetic |
EPA | Environmental Protection Agency (US) |
FA | fire assay |
Fill | back-fill from historical mining |
FoS | factor of safety |
FS | feasibility study |
g | gram |
g/t | grams per tonne |
gpm | gallons per minute |
GTRCK | geotechnical rock type |
Ha | hectares |
Haile | Haile Gold Mine |
HCT | Humidity Cell Test |
HDPE | high-density polyethylene |
HGM | Haile Gold Mine, Inc. |
HGMC | Hail Gold Mine Creek |
HMC | Haile Mining Company |
HMV | Haile Mine Venture, joint venture between Amax and Piedmont |
HUG | Horseshoe Underground |
IMC | Independent Mining Consultants, Inc. |
| | | | | | | | |
Released: March 27, 2026 | | Page 270 of 275 |
| | | | | |
| |
NI 43-101 Technical Report – Haile Gold Mine, South Carolina, United States |
| | | | | |
IRR | initial rate of return |
ISA | Interramp Slope Angle |
ISO/IEC | International Electrotechnical Commission |
ISO-9001 | International Organization for Standardization |
IP | induced polarization |
kg | kilogram |
Kinross | Kinross Gold Corporation |
km | Kilometre |
KML | Kershaw Mineral Lab |
KNA | Kriging Neighborhood Analysis |
koz | thousand troy ounce |
kt | thousand tonnes |
kV | kilovolt |
L/min | litres per minute |
LDL | lab detection limit |
Leapfrog | Seequent Leapfrog® Geo software |
LoM | life-of-mine |
LUG | Ledbetter Underground |
m | metre |
m3 | cubic metre |
Ma | mega-annum (or Million years) |
MI | laminated metasediments |
MIBC | methyl isobutyl carbinol |
MIK | Multiple Indicator Kriging |
min | minute |
ML | million litres |
mm | millimetre |
Moz | million troy ounces |
MS | Metasediments |
Ms | silicified metasediments |
Mt | million tonnes |
Mt/yr | million tonnes per year |
MV | Metavolcanics |
MVA | Mega Volt-Ampere |
MW | megawatt (million watts) |
NEPA | National Environmental Policy Act |
| | | | | | | | |
Released: March 27, 2026 | | Page 271 of 275 |
| | | | | |
| |
NI 43-101 Technical Report – Haile Gold Mine, South Carolina, United States |
| | | | | |
NGO | Non-governmental organization |
NI 43-101 | Canadian National Instrument 43-101 |
NN | nearest neighbor |
NNP | net neutralization potential |
NP | Neutralization potential |
NPDES | National Pollutant Discharge Elimination System |
NPV | net present value |
OceanaGold | OceanaGold Corporation |
OK | Ordinary Kriging |
OMP | Overburden Management Plan |
OP | open pit |
OSA | overburden storage area |
ozs | troy ounces |
PAG | potential acid generating |
Piedmont | Piedmont Mining Company |
PP & E | Property, Plant, and Equipment |
Project | Haile Gold Mine |
ppm | parts per million |
PUG | Palomino Underground |
QA/QC | Quality assurance/Quality control |
QP | Qualified Persons |
QSP | quartz-sericite-pyrite |
RC | reverse circulation |
RDi | Resource Development Inc. |
Re-Os | Rhenium-Osmium |
RL | Reduced Level |
RM | rock mass |
RMI | Romarco Minerals, Inc. |
RMR | Rock Mass Rating |
RoM | run-of-mine |
RQD | rock quality designation |
RS | Linear rock mass |
S | sulfur |
SAG | Semi-Autogenous Grinding |
SABC | SAG ball mill pebble crusher |
Sap | Saprolite |
SCDES | South Carolina Department of Environmental Services |
| | | | | | | | |
Released: March 27, 2026 | | Page 272 of 275 |
| | | | | |
| |
NI 43-101 Technical Report – Haile Gold Mine, South Carolina, United States |
| | | | | |
SCDOT | South Carolina Department of Transportation |
SCSE | SAG Circuit Specific Energy |
SCSHPO | South Carolina State Historic Preservation Office |
SEIS | Supplemental Environmental Impact Statement |
SEIS ROD | Supplemental Environmental Impact Statement Record of Decision |
SGS | Société Générale de Surveillance |
SMC | SAG Mill Comminution |
SMU | selective mining unit |
SO2 | sulfur dioxide |
SRK | SRK Consulting (U.S.), Inc. |
st | short ton (2,000 pounds) |
ST | total sulfur |
SD | standard deviation |
s.u. | Standard units |
t | metric tonne |
t/d | tonnes per day |
t/h | tonnes per hour |
t/yr | tonnes per year |
TCS | triaxial compressive strength |
TSF | tailings storage facility |
UCF | Undiscounted cashflow |
UCS | uniaxial compressive strength |
UG | Underground |
UGC | Underground grade control core |
URF | Unconsolidated Rock Fill |
US$ | United States Dollar |
USA | United States of America |
USACE | United States Army Corps of Engineers |
USFS | United States Forest Service |
USFWS | United States Fish and Wildlife Service |
USGS | United States Geological Survey |
VO | variable orientation |
WAD | weak acid dissociable |
Wi | work indices |
Y | Year |
µm | microns |
| | | | | | | | |
Released: March 27, 2026 | | Page 273 of 275 |
| | | | | |
| |
NI 43-101 Technical Report – Haile Gold Mine, South Carolina, United States |
Appendices
| | | | | | | | |
Released: March 27, 2026 | | Page 274 of 275 |
| | | | | |
| |
NI 43-101 Technical Report – Haile Gold Mine, South Carolina, United States |
Appendix A: Certificates of Qualified Persons
| | | | | | | | |
Released: March 27, 2026 | | Page 275 of 275 |
| | | | | |
| |
NI 43-101 Technical Report – Haile Gold Mine, South Carolina, United States |
CERTIFICATE OF QUALIFIED PERSON
I, David Read Carr, MAusIMM CP (Met), do hereby certify that:
1.I am the Head of Metallurgy of OceanaGold Corporation (“OceanaGold”), Suite 1020, 400 Burrard Street, Vancouver, British Columbia, V6C 3A6, Canada.
2.This certificate applies to the technical report titled “NI 43-101 Technical Report, Haile Gold Mine, Lancaster County, South Carolina” with an effective date of December 31, 2025 (the “Technical Report”).
3.I graduated with a degree in Bachelor of Engineering in Metallurgical Engineering (Hons) from the University of South Australia in 1993. I am a Member and Chartered Professional of the Australasian Institute of Mining and Metallurgy. I have worked as a metallurgist for a total of 33 years since my graduation from university. My relevant experience includes base metal flotation, flotation and leaching of gold ores, pressure oxidation of refractory sulphide ores, ultrafine grinding, process plant design, project evaluation and plant commissioning.
4.I have read the definition of “qualified person” set out in National Instrument 43-101 (“Nl 43- 101”) and certify that by reason of my education, affiliation with a professional/technical association, (as defined in Nl 43-101) and past relevant work experience, I fulfill the requirements of a "qualified person" for the purposes of Nl 43-101.
5.I have visited the site in numerous times from 2015 to 2025 with the most recent visit from June 16th for 55 days.
6.I have been employed by OceanaGold or its subsidiaries since January 21, 2003.
7.I am responsible for mineral processing, all of Sections 13 and 17, Section 18.10, the process plant capital and operating costs of section 21, and portions of Sections 1, 25 and 26 summarized therefrom, of this Technical Report.
8.I am not independent of the issuer applying all the tests in Section 1.5 of Nl 43-101 as I have been a full time employee of OceanaGold since January 21, 2003.
9.Prior to my employment with OceanaGold, I had no prior involvement with the property that is the subject of the Technical Report.
10.I have read Nl 43-101 and Form 43-101F1 and the sections of the Technical Report I am responsible for have been prepared in compliance with NI 43-101 and Form 43-101F1.
11.As of the aforementioned effective date, to the best of my knowledge, information and belief, the sections of the Technical Report I am responsible for contain all scientific and technical information that is required to be disclosed to make the Technical Report not misleading.
| | | | | |
Dated: March 27, 2026. | |
| |
“Signed and Sealed” |
|
David Read Carr, MAusIMM CP (Met) |
| | | | | |
OceanaGold Corporation Suite 1020 – 400 Burrard Street, Vancouver, British Columbia, V6C 3A6, Canada T: 604-678-4123 www.oceanagold.com | 1 |
| | | | | |
| |
NI 43-101 Technical Report – Haile Gold Mine, South Carolina, United States |
CERTIFICATE OF QUALIFIED PERSON
I, Gregory Hollett, BEng (Mining Engineering), P.Eng (EGBC), do hereby certify that:
1.I am the Head of Mine Engineering of OceanaGold Corporation (“OceanaGold”), Suite 1020, 400 Burrard Street, Vancouver, British Columbia, V6C 3A6, Canada.
2.This certificate applies to the technical report titled “NI 43-101 Technical Report, Haile Gold Mine, Lancaster County, South Carolina” with an effective date of December 31, 2025 (the “Technical Report”).
3.I graduated with a degree in Mining Engineering from Curtin University in 2000. In addition, I obtained a Master of Business Administration from Torrens University Australia in 2017. I am a Professional Engineer (P.Eng) registered with Engineers and Geoscientists of British Columbia (EGBC, #157783). I have worked as a mining engineer for a total of 25 years since my graduation from university. My relevant experience includes open-pit operational management, mine design and implementation, short- and long-term scheduling, haulage analysis, equipment selection, and cost estimation.
4.I have read the definition of “qualified person” set out in National Instrument 43-101 (“Nl 43- 101”) and certify that by reason of my education, affiliation with a professional/technical association, (as defined in Nl 43-101) and past relevant work experience, I fulfill the requirements of a "qualified person" for the purposes of Nl 43-101.
5.I have visited the site on November 11-14, 2025, and completed numerous other site visits during 2018-2024.
6.I have been employed by OceanaGold or its subsidiaries since 18 September 2018.
7.I am responsible for the preparation of Sections 2, 3, the open pit portions of Section 15 and 16.3, Section 16 opening statements, Sections 16.1, 16.1.1, 16.1.3, 16.1.4, 16.1.5, 16.1.7, 16.1.8, 18.7, 19, 20, the open pit operating costs portion of section 21, the other/G&A portions of the operating costs in section 21, 22, 24, 27, 28, and portions of Sections 1, 25, and 26 summarized therefrom of the Technical Report.
8.I am not independent of the issuer applying all the tests in Section 1.5 of Nl 43-101 as I have been a full time employee of OceanaGold since 18 September 2018.
9.Prior to my employment with OceanaGold, I had no prior involvement with the property that is the subject of the Technical Report.
10.I have read Nl 43-101 and Form 43-101F1 and the sections of the Technical Report I am responsible for have been prepared in compliance with NI 43-101 and Form 43-101F1.
11.As of the aforementioned effective date, to the best of my knowledge, information and belief, the sections of the Technical Report I am responsible for contain all scientific and technical information that is required to be disclosed to make the Technical Report not misleading.
| | | | | |
Dated: March 27, 2026. | |
| |
“Signed and Sealed” | |
| |
Gregory Hollett, BEng(Mining Engineering), P.Eng (EGBC) |
OceanaGold Corporation
Suite 1020 – 400 Burrard Street, Vancouver, British Columbia, V6C 3A6, Canada
T: 604-678-4123
www.oceanagold.com
| | | | | |
| |
NI 43-101 Technical Report – Haile Gold Mine, South Carolina, United States |
CERTIFICATE OF QUALIFIED PERSON
I, Brianna Drury, Registered Member with the Society of Mining, Metallurgy & Exploration (SME RM #4151277), do hereby certify that:
1.I am the Engineering Superintendent UG of OceanaGold Corporation (“OceanaGold”), 6911 Snowy Owl Road, Kershaw, South Carolina 29067.
2.This certificate applies to the technical report titled “NI 43-101 Technical Report, Haile Gold Mine, Lancaster County, South Carolina” with an effective date of December 31, 2025 (the “Technical Report”).
3.I hold a BSc in Mining Engineering as well as being a Registered Member with the Society of Mining, Metallurgy & Exploration (SME RM #4151277) with 16 years of experience in hard rock metals mining engineering; and
4.I have read the definition of “qualified person” set out in National Instrument 43-101 (“NI 43- 101”) and certify that by reason of my education, affiliation with a professional/technical association, (as defined in NI 43-101) and past relevant work experience, I fulfill the requirements of a "qualified person" for the purposes of NI 43-101.
5.I am currently based on site in South Carolina.
6.I am responsible for the preparation of underground Mineral Reserves, the underground portions of Section 15 and 16.3, Sections 16.2, 16.2.1, 16.2.3, 16.2.5, 16.2.6, 16.2.7, 18.8, the capital costs portion of Section 21 with the exception of processing capital, the underground mining operating costs portion of Section 21, and portion of Sections 1, 25, and 26 summarized therefrom, of this Technical Report.
7.I am not independent of the issuer applying all the tests in Section 1.5 of NI 43-101 as I have been a full-time employee of OceanaGold since August 31, 2020.
8.Prior to my employment with OceanaGold, I had no prior involvement with the property that is the subject of the Technical Report.
9.I have read NI 43-101 and Form 43-101F1 and the sections of the Technical Report. I am responsible for have been prepared in compliance with NI 43-101 and Form 43-101F1.
10.As of the aforementioned effective date, to the best of my knowledge, information and belief, the sections of the Technical Report I am responsible for contain all scientific and technical information that is required to be disclosed to make the Technical Report not misleading.
Dated: March 27, 2026
| | | | | |
“Signed and Sealed” |
|
Brianna Drury, BSc Mining Engineering, SME-RM #415127 |
| | | | | |
OceanaGold Corporation | 1 |
www.oceanagold.com | |
| | | | | |
| |
NI 43-101 Technical Report – Haile Gold Mine, South Carolina, United States |
CERTIFICATE OF QUALIFIED PERSON
I, Jonathan Moore, BSc (Hons) Geology, GradDip (Physics), MAusIMM CP, do hereby certify that:
1.I am the Head of Resource Development of OceanaGold Corporation (“OceanaGold”), Suite 1020, 400 Burrard Street, Vancouver, British Columbia, V6C 3A6, Canada.
2.This certificate applies to the technical report titled “NI 43-101 Technical Report, Haile Gold Mine, Lancaster County, South Carolina” with an effective date of December 31, 2025 (the “Technical Report”).
3.I graduated with an honours degree in Geology from Otago University in 1985. In addition, I obtained a Graduate Diploma in Physics from Otago University in 1993. I am a member and Chartered Professional of the AusIMM (#227252) and have worked as a geologist for over 30 years since my graduation from university. My relevant experience includes open pit and underground resource and mine geology.
4.I have read the definition of “qualified person” set out in National Instrument 43-101 (“Nl 43- 101”) and certify that by reason of my education, affiliation with a professional/technical association, (as defined in Nl 43-101) and past relevant work experience, I fulfill the requirements of a "qualified person" for the purposes of Nl 43-101.
5.I have visited the site on November 17-19, 2025 and November 24 to December 4, 2025, and have completed numerous site visits between 2015 - 2024.
6.I have been employed by OceanaGold or its subsidiaries since 6 May 1996.
7.I am responsible for the preparation of Sections 4 through 12, the open pit and Horseshoe underground portions of section 14 and 23, and portions of Sections 1, 25, and 26 summarized therefrom, of this Technical Report.
8.I am not independent of the issuer applying all the tests in Section 1.5 of Nl 43-101 as I have been a full-time employee of OceanaGold since May 6, 1996.
9.Prior to my employment with OceanaGold, I had no prior involvement with the property that is the subject of the Technical Report.
10.I have read Nl 43-101 and Form 43-101F1 and the sections of the Technical Report I am responsible for have been prepared in compliance with NI 43-101 and Form 43-101F1.
11.As of the aforementioned effective date, to the best of my knowledge, information and belief, the sections of the Technical Report I am responsible for contain all scientific and technical information that is required to be disclosed to make the Technical Report not misleading.
Dated: March 27, 2026.
“Signed and Sealed”
Jonathan Moore, BSc (Hons) Geology, MAusIMM CP.
OceanaGold Corporation
Suite 1020 – 400 Burrard Street, Vancouver, British Columbia, V6C 3A6, Canada
T: 604-678-4123
www.oceanagold.com
| | | | | |
| |
NI 43-101 Technical Report – Haile Gold Mine, South Carolina, United States |
CERTIFICATE OF QUALIFIED PERSON
I, Douglas Corley, MAIG RPGeo, do hereby certify that:
1.I am the Principal Geologist – Resource Development of OceanaGold Corporation (“OceanaGold”), Suite 1020, 400 Burrard Street, Vancouver, British Columbia, V6C 3A6, Canada.
2.This certificate applies to the technical report titled “NI 43-101 Technical Report Haile Gold Mine Lancaster County, South Carolina” with an effective date of December 31, 2025 (the “Technical Report”).
3.I graduated with a degree in Science in Applied Geology (BSc), from the Queensland University of Technology in 1989. In addition, I obtained an Honors degree in Science in Geology (BSc Hons), from the James Cook University of North Queensland in 1991. I am Registered Professional Geoscientist with the Australian Institute of Geoscientists (member number 1505). I have worked as a geologist for over 35 years since my graduation from university. My relevant experience includes 18 years in open-cut and underground production mining environments and over 16 years in Mineral Resource estimation, for a variety of commodities in various jurisdictions across the world.
4.I have read the definition of “qualified person” set out in National Instrument 43-101 (“NI 43- 101”) and certify that by reason of my education, affiliation with a professional/technical association, (as defined in NI 43-101) and past relevant work experience, I fulfill the requirements of a "qualified person" for the purposes of NI 43-101.
5.I have visited the site on the 12 June 2024 and was at site until the 2 July 2024.
6.I have been employed by OceanaGold or its subsidiaries since 01 December 2020.
7.I am responsible for the preparation of the Palomino and Ledbetter underground portions of Section 14 and portions of Sections 1, 25, and 26 of the Technical Report.
8.I am not independent of the issuer applying all the tests in Section 1.5 of NI 43-101 as I have been a full time employee of OceanaGold since 01 December 2020.
9.Prior to my employment with OceanaGold, I had no prior involvement with the property that is the subject of the Technical Report.
10.I have read NI 43-101 and Form 43-101F1 and the sections of the Technical Report I am responsible for have been prepared in compliance with NI 43-101 and Form 43-101F1.
11.As of the aforementioned effective date, to the best of my knowledge, information and belief, the sections of the Technical Report I am responsible for contain all scientific and technical information that is required to be disclosed to make the Technical Report not misleading.
| | | | | |
Dated: March 27, 2026. | |
| |
“Signed and Sealed” |
|
Douglas Corley, BSc (Hons) Geology, MAIG RPGeo |
| | | | | |
OceanaGold Corporation Suite 1020 – 400 Burrard Street, Vancouver, British Columbia, V6C 3A6, Canada T: 604-678-4123 www.oceanagold.com | 1 |
| | | | | |
| |
NI 43-101 Technical Report – Haile Gold Mine, South Carolina, United States |
CERTIFICATE OF QUALIFIED PERSON
I, Larry Standridge, PE, MSE Mining, Geological, and Geophysical Engineering do hereby certify that:
1.I am a Principal Engineer, Geotechnical Engineer of Call and Nicholas, Inc., 2475 North Coyote drive, Tucson, AZ USA 85750.
2.This certificate applies to the technical report titled "Nl 43-101 Technical Report, Haile Gold Mine, Lancaster County, South Carolina" with an effective date of December 31, 2025 (the "Technical Report").
3.I graduated with a MS in Mining, Geological, and Geophysical Engineering from The University of Arizona in 2001. In addition, I have obtained a BA in Geology from The University of North Carolina in 1996. I am a registered Professional Engineer (Geological) in the State of Arizona (No. 64435). I have worked as an engineer for a total of 25 years since my graduation from university. My relevant experience includes 21 years of pit slope and waste dump design, prefeasibility and feasibility studies, field mapping, 3D modelling, stability analyses, debris flow analyses, and numerous other geotechnical activities in support of the mining industry
4.I have read the definition of "qualified person" set out in National Instrument 43-101 (NI 43-101) and certify that by reason of my education, registration as a Professional Engineer in the state of Arizona (as defined in NI 43-101) and past relevant work experience, I fulfill the requirements to be a "qualified person" for the purposes of Nl43-101.
5.I visited the Haile property on November 29, 2017 for 2 days, October 10, 2018 for 2 days, January 14, 2020 for 3 days, May 18, 2021 for 3 days, January 24, 2024 for 1 day, and January 20, 2026 for 2 days.
6.I have been employed by Call & Nicholas, Inc. since November, 2005.
7.I am responsible for the preparation of Sections 16.1.2 and portions of Sections 1, 25, and 26 of the Technical Report.
8.I am independent of the issuer applying all of the tests in section 1.5 of NI 43-101.
9.I have had prior involvement with the property that is the subject of the Technical Report. The nature of my prior involvement is providing slope design recommendations for the open pits and waste dumps, develop mitigation options for several geotechnical hazards, and assisting with geotechnical data collection.
10.I have read Nl 43-101 and Form 43-101F1 and the sections of the Technical Report I am responsible for have been prepared in compliance with NI 43-101 and Form 43-101F1.
11.As of the aforementioned effective date, to the best of my knowledge, information and belief, the sections of the Technical Report I am responsible for contain all scientific and technical information that is required to be disclosed to make the Technical Report not misleading.
Dated: March 27, 2026
| | | | | | | | |
“Signed and Sealed” | | |
| | |
| | |
Larry Standridge, PE, MSE | | Expiration Date__________ |
| | | | | |
OceanaGold Corporation | 1 |
www.oceanagold.com | |
| | | | | |
| |
NI 43-101 Technical Report – Haile Gold Mine, South Carolina, United States |
CERTIFICATE OF QUALIFIED PERSON
I, Robert Cook, PE, RM-SME, do hereby certify that:
1.I am the Principal II Geological Engineer of Call & Nicholas, 2475 N Coyote Dr. Tucson, AZ USA.
2.This certificate applies to the technical report titled "Nl 43-101 Technical Report, Haile Gold Mine, Lancaster County, South Carolina" with an effective date of December 31, 2025 (the "Technical Report").
3.I graduated with a degree in Geological Engineering from University of Arizona in 2008. I am a Registered Member of the Society for Mining, Metallurgy, & Exploration (SME). I have worked as a Geological Engineer for a total of 17 years since my graduation from university. My relevant experience includes 5 years as an underground geological engineer for Newmont Mining Corporation in operations using the longhole open stoping (LHOS) method as well as consulting on LHOS projects for more than 11 years with Call & Nicholas.
4.I have read the definition of "qualified person" set out in National Instrument 43-101 ("Nl 43- 101") and certify that by reason of my education, affiliation with a professional/technical association, (as defined in Nl 43-101) and past relevant work experience, I fulfill the requirements of a "qualified person" for the purposes of Nl 43-101.
5.I have visited the site on January 13 through 15, 2026.
6.I have been employed by Call & Nicholas since June 2014.
7.I am responsible for the preparation of Sections 16.2.2 and portions of Sections 1, 25 and 26 of the Technical Report.
8.I am independent of the issuer applying all the tests in Section 1.5 of Nl 43-101.
9.I have not had prior involvement with the property that is the subject of the Technical Report.
10.I have read Nl 43-101 and Form 43-101F1 and the sections of the Technical Report I am responsible for have been prepared in compliance with Nl 43-101 and Form 43-101F1.
11.As of the aforementioned effective date, to the best of my knowledge, information and belief, the sections of the Technical Report I am responsible for contain all scientific and technical information that is required to be disclosed to make the Technical Report not misleading.
Dated: March 27, 2026
| | | | | |
"Signed and Sealed" | |
| |
| |
Robert Cook, PE, RM-SME | |
| | | | | |
OceanaGold Corporation | 1 |
www.oceanagold.com | |
CERTIFICATE OF QUALIFIED PERSON
I, Jay Newton Janney-Moore, PE, RM-SME, do hereby certify that:
1.I am an Engineer of NewFields Mining & Technical Services LLC ("NewFields"), 9540 Maroon Circle, Suite 300, Englewood, Colorado 80112, USA.
2.This certificate applies to the technical report titled "NI 43-101 Technical Report, Haile Gold Mine, Lancaster County, South Carolina" with an Effective Date of December 31, 2025 (the "Technical Report").
3.I graduated with a degree in Bachelor of Science in Civil Engineering from University of Colorado Denver in 1998. I am a registered professional engineer in the State of South Carolina (No. 28306) and in the State of Colorado (No. 37571). I have worked as an engineer a total of 28 years since my graduation from university. My relevant includes designing heap leach pads, tailings storage facilities, surface water diversions, and other supporting infrastructure.
4.I have read the definition of "qualified person" set out in National Instrument 43-101 (NI 43-101) and certify that by reason of my education, affiliation with a professional association (as defined in NI 43-101) and past relevant work experience, I fulfill the requirements to be a "qualified person" for the purposes of NI 43-101.
5.I have visited the Haile Gold Mine property October 29, 2025 for 2 days.
6.I have been employed by NewFields since 2012.
7.Jay Newton Janney-Moore, PE, RM-SME, (NewFields Senior Project Manager I), is the QP responsible for tailing and overburden storage, Sections 18.1, 18.2, 18.3, 18.4, 18.5, and portions of Sections 1, 25 and 26 summarized therefrom, of this Technical Report.
8.I am independent of the issuer applying all of the tests in Section 1.5 of NI 43-101.
9.I have had prior involvement with the property that is the subject of the Technical Report. The nature of my prior involvement is the engineer of record for the Potentially Acid Overburden Storage Areas, Contact Water Ponds, Fresh Water Storage Dam, and Duckwood Tailings Storage Facility. I have also been a QP on reports titled "NI 43-101 Technical Report Haile Gold Mine Lancaster County, South Carolina" dated August 9, 2017, June 30, 2020, March 30, 2022 and March 28, 2024.
10.I have read NI 43-101 and Form 43-101F1 and the sections of the Technical Report I am responsible for have been prepared in compliance with that instrument and form.
11.As of the aforementioned Effective Date, to the best of my knowledge, information and belief, the sections of the Technical Report I am responsible for contains all scientific and technical information that is required to be disclosed to make the Technical Report not misleading.
Dated this 27th Day of March, 2026.
| | | | | |
"Signed and Sealed" | |
| |
| |
Jay Newton Janney-Moore, P.E. | |
CERTIFICATE OF QUALIFIED PERSON
I, William Lucas Kingston, MSc, PG, RM-SME, do hereby certify that:
1.I am an Associate Hydrogeologist of NewFields Mining & Technical Services LLC ("NewFields"}, 9540 Maroon Circle, Suite 300, Englewood, Colorado 80112, USA.
2.This certificate applies to the technical report titled "NI 43-101 Technical Report, Haile Gold Mine, Lancaster County, South Carolina" with an Effective Date of December 31, 2025 (the "Technical Report").
3.I graduated with a degree in Geology rom Tulane University in 1984. In addition, I obtained a Master of Science degree in Hydrogeology and Hydrology from the University of Nevada - Reno in 1989. I am a professional geologist in the State of South Carolina (No. 2666), in the State of Wyoming (No. 3645), in the State of Utah (No. 13308445-2250), and in the State of California (No. 8679). I have worked as a Hydrogeologist for a total of 36 years since my graduation from university. My relevant experience includes water supply, pit dewatering, and mine water management studies that often include elements of data collection, development of conceptual groundwater flow models, and numerical predictive modeling.
4.I have read the definition of "qualified person" set out in National Instrument 43-101 (NI 43-101) and certify that by reason of my education, affiliation with a professional association (as defined in NI 43-101) and past relevant work experience, I fulfill the requirements to be a "qualified person" for the purposes of NI 43-101.
5.I visited the Haile Gold Mine property on December 4, 2019 for two days and August 31, 2021 for 3 days.
6.William Lucas Kingston, MSc, P.G., RM-SME, Hydrogeology and Groundwater Management, (NewFields Associate Hydrogeologist) is the QP responsible for hydrogeology, Sections 16.1.9, 16.2.8, 18.6 and portions of Sections 1, 25 and 26 summarized therefrom, of this Technical Report.
7.I am independent of the issuer applying all of the tests in Section 1.5 of NI 43-101.
8.I have had prior involvement with the property that is the subject of the Technical Report. The nature of my prior involvement is managing pit dewatering design, numerical groundwater modeling studies, and preparation of quarterly groundwater and surface water monitoring reports.
9.I have read NI 43-101 and Form 43-101F1 and the sections of the Technical Report I am responsible for have been prepared in compliance with that instrument and form.
10.As of the aforementioned Effective Date, to the best of my knowledge, information and belief, the sections of the Technical Report I am responsible for contains all scientific and technical information that is required to be disclosed to make the Technical Report not misleading.
Dated this 27th Day of March, 2026.
| | | | | |
"Signed and Sealed" | |
| |
| |
William Lucas Kingston, MSc, PG. | |
| | | | | |
| SRK Consulting (U.S.), Inc. Suite 400 999 Seventeenth Street Denver, CO 80202 T: 303.985.1333 F: 303.985.9947 denver@srk.com www.srk.com |
CERTIFICATE OF QUALIFIED PERSON
I, Brooke J. Miller, MSc, C.P.G. do hereby certify that:
1.I am Principal Consultant (Geology) of SRK Consulting (U.S.), Inc., 5250 Neil Road, Suite 300, Reno, Nevada, USA, 89502.
2.This certificate applies to the technical report titled “NI 43-101 Technical Report, Haile Gold Mine, Lancaster County, South Carolina” with an Effective Date of December 31, 2025 (the “Technical Report”).
3.I graduated with a degree in Bachelor of Arts degree in Geology from Lawrence University in 2002. In addition, I have obtained a Master of Science degree in Geological Sciences from The University of Oregon in 2004. I am a Certified Professional Geologist of the American Association of Professional Geologists. I have worked as a Geologist for a total of 21 years since my graduation from university. My relevant experience includes mining and exploration geology, geochemical characterization, and geologic modeling.
4.I have read the definition of “qualified person” set out in National Instrument 43-101 (NI 43-101) and certify that by reason of my education, affiliation with a professional association (as defined in NI 43-101) and past relevant work experience, I fulfill the requirements to be a “qualified person” for the purposes of NI 43-101.
5.I visited the Haile property on November 14, 2023, for one day.
6.I am responsible for geochemistry Sections 16.1.6 and 16.2.4 and portions of Sections 1, 25, and 26 summarized therefrom, of this Technical Report.
7.I am independent of the issuer applying all of the tests in section 1.5 of NI 43-101.
8.I have had prior involvement with the property that is the subject of the Technical Report. The nature of my prior involvement is serving as QP on the report titled “NI 43-101 Technical Report, Haile Gold Mine, Lancaster County, South Carolina” dated March 28, 2024.
9.I have read NI 43-101 and Form 43-101F1 and the sections of the Technical Report I am responsible for have been prepared in compliance with that instrument and form.
10.As of the aforementioned Effective Date, to the best of my knowledge, information and belief, the sections of the Technical Report I am responsible for contains all scientific and technical information that is required to be disclosed to make the Technical Report not misleading.
Dated this 27th Day of March, 2026.
"Signed"
| | | | | | | | |
| | [Seal or Stamp] |
| | |
Brooke J. Miller, CPG | | |
| | | | | | | | | | | | | | | | | |
| U.S. Offices: | Canadian Offices: | Group Offices: |
| Anchorage | 907.677.3520 | Saskatoon | 306.955.4778 | Africa |
| Clovis | 559.452.0182 | Sudbury | 705.682.3270 | Asia |
| Denver | 303.985.1333 | Toronto | 416.601.1445 | Australia |
| Elko | 775.753.4151 | Vancouver | 604.681.4196 | Europe |
| Reno | 775.828.6800 | | | North America |
| Tucson | 520.544.3688 | | | South America |