Exhibit 99.60
NI 43-101 Technical Report
Waihi District Pre-feasibility Study, New Zealand
Effective Date: June 30, 2024
Report Date: December 11, 2024
Report Prepared by:
OceanaGold Corporation
Suite 1020, 400 Burrard Street
Vancouver, BC V6C 3A6
Canada
Signed by Qualified Persons:
David Townsend, Assoc Deg (Surveying), GDip (Mining), MAusIMM CP (Min) (OceanaGold Mining
Manager)
Leroy Crawford-Flett, BCA/BSc. (Management/Geology), MPM, MAusIMM CP (Geo), (OceanaGold
Exploration and Geology Manager)
Kirsty Hollis, BEng Mineral Processing, FAusIMM CP (Met) (OceanaGold Principal Metallurgist)
Euan Leslie, BEng Mining, BCom Economics, MAusIMM CP (Min) (OceanaGold Group Mining Engineer)
Trevor Maton, ARSM, BSc. (Eng) Mining (Hons), MSc. Economics, MAusIMM CP (Min) (OceanaGold
Study Director)
Document ID: STU-063-REP-002-0 | Released: 11th December 2024 | Page ii |
OceanaGold Corporation | ||
NI 43-101 Technical Report – Waihi District Pre-feasibility Study, New Zealand | ||
Cautionary Note Regarding Forward-Looking Statements
This report contains certain “forward-looking statements” and “forward-looking information” (collectively,
“forward-looking statements”) within the meaning of applicable Canadian securities laws. All statements,
other than statements of historical fact regarding OceanaGold Corporation (OceanaGold) or the Waihi
District (including Martha Underground (MUG), Martha Open Pit (MOP), Gladstone Open Pit (GOP) and
Wharekirauponga Underground (WUG)), are forward-looking statements. The words “believe”, “expect”,
“anticipate”, “contemplate”, “target”, “plan”, “intend”, “project”, “continue”, “budget”, “estimate”, “potential”,
“may”, “will”, “can”, “could” and similar expressions identify forward-looking statements. In particular, this
report contains forward-looking statements with respect to cash flow forecasts, projected capital,
operating and exploration expenditures, targeted cost reductions, mine life and production rates, potential
mineralization and metal or mineral recoveries, and information pertaining to potential improvements to
financial and operating performance and mine life at the Waihi District. All forward-looking statements in
this report are necessarily based on opinions and estimates made as of the date such statements are
made and are subject to important risk factors and uncertainties, many of which cannot be controlled or
predicted. Material assumptions regarding forward-looking statements are discussed in this report, where
applicable. In addition to such assumptions, the forward-looking statements are inherently subject to
significant business, economic and competitive uncertainties and contingencies. Known and unknown
factors could cause actual results to differ materially from those projected in the forward-looking
statements. Such factors include, but are not limited to: fluctuations in the spot and forward price of
metals and commodities (including gold, diesel fuel, natural gas and electricity); the speculative nature of
mineral exploration and development; changes in mineral production performance, exploitation and
exploration successes; diminishing quantities or grades of reserves; increased costs, delays,
suspensions, and technical challenges associated with the construction of capital projects; operating or
technical difficulties in connection with mining or development activities, including disruptions in the
maintenance or provision of required infrastructure and information technology systems; damage to
OceanaGold’s or the Waihi District’s reputation due to the actual or perceived occurrence of any number
of events, including negative publicity with respect to the handling of environmental matters or dealings
with community groups, whether true or not; risk of loss due to acts of war, terrorism, sabotage and civil
disturbances; uncertainty whether the Waihi District will meet OceanaGold’s capital allocation objectives;
the impact of global liquidity and credit availability on the timing of cash flows and the values of assets
and liabilities based on projected future cash flows; the impact of inflation; fluctuations in the currency
markets; changes in interest rates; changes in national and local government legislation, taxation,
controls or regulations and/or changes in the administration of laws, policies and practices; expropriation
or nationalization of property and political or economic developments; failure to comply with
environmental and health and safety laws and regulations; timing of receipt of, or failure to comply with,
necessary permits and approvals; litigation; contests over title to properties or over access to water,
power and other required infrastructure; increased costs and physical risks including extreme weather
events and resource shortages, related to climate change; and availability and increased costs associated
with mining inputs and labour. In addition, there are risks and hazards associated with the business of
mineral exploration, development, and mining, including environmental hazards, industrial accidents,
unusual or unexpected formations, pressures, cave-ins, flooding and gold bullion, copper cathode or gold
or copper concentrate losses (and the risk of inadequate insurance, or inability to obtain insurance, to
cover these risks).
Many of these uncertainties and contingencies can affect OceanaGold’s actual results and could cause
actual results to differ materially from those expressed or implied in any forward-looking statements made
by, or on behalf of, OceanaGold. All of the forward-looking statements made in this report are qualified by
these cautionary statements and OceanaGold and the qualified persons who authored this report
undertake no obligation to update publicly or otherwise revise any forward‐looking statements whether as
a result of new information or future events or otherwise, except as may be required by law.
Document ID: STU-063-REP-002-0 Released: 11th December 2024Page 1 of 244
OceanaGold Corporation | ||
NI 43-101 Technical Report – Waihi District Pre-feasibility Study, New Zealand | ||
Table of Contents
1 | SUMMARY ............................................................................................................................................ | 12 | |
1.1 | Property Description, Location and Ownership .................................................................. | 12 | |
1.2 | Geology and Mineralization ................................................................................................... | 14 | |
1.3 | Status of Exploration, Development and Operation ........................................................... | 15 | |
1.4 | Mineral Processing and Metallurgical Test Work ................................................................ | 15 | |
1.5 | Mineral Resources Estimate .................................................................................................. | 16 | |
1.6 | Mineral Reserves Estimate .................................................................................................... | 18 | |
1.7 | Mining Method .......................................................................................................................... | 20 | |
1.8 | Recovery Methods .................................................................................................................. | 23 | |
1.9 | Project Infrastructure ............................................................................................................... | 24 | |
1.10 | Environment Studies, Permitting and Social or Community Impact ................................ | 25 | |
1.11 | Capital and Operating Costs .................................................................................................. | 27 | |
1.12 | Economic Analysis .................................................................................................................... | 29 | |
1.13 | Conclusions and Recommendations .................................................................................... | 32 | |
2 | INTRODUCTION .................................................................................................................................. | 35 | |
2.1 | Terms of Reference ................................................................................................................. | 35 | |
2.2 | Qualified Persons .................................................................................................................... | 35 | |
2.3 | Details of Inspections .............................................................................................................. | 35 | |
2.4 | Information Sources and References ................................................................................... | 35 | |
2.5 | Effective Dates ......................................................................................................................... | 36 | |
2.6 | Units of Measure ....................................................................................................................... | 36 | |
3 | RELIANCE ON OTHER EXPERTS ................................................................................................... | 37 | |
4 | PROPERTY DESCRIPTION AND LOCATION ............................................................................... | 38 | |
4.1 | Property Location ...................................................................................................................... | 38 | |
4.2 | Property Ownership and Access Arrangements ................................................................. | 39 | |
5 | ACCESSIBILITY, CLIMATE, PHYSIOGRAPHY, LOCAL RESOURCES, AND INFRASTRUCTURE ..................................................................................................................... | 42 | |
5.1 | Accessibility ............................................................................................................................... | 42 | |
5.2 | Climate and Physiography ...................................................................................................... | 42 | |
5.3 | Local Resources and Infrastructure ....................................................................................... | 42 | |
5.4 | Physiography ............................................................................................................................. | 42 | |
5.5 | Mining Area Infrastructure ....................................................................................................... | 42 | |
6 | HISTORY ............................................................................................................................................... | 43 | |
6.1 | Waihi ........................................................................................................................................... | 43 | |
6.2 | Previous Studies and Resource Estimates .......................................................................... | 44 | |
6.3 | Historical Data ........................................................................................................................... | 44 | |
Document ID: STU-063-REP-002-0 Released: 11th December 2024Page 2 of 244
OceanaGold Corporation | ||
NI 43-101 Technical Report – Waihi District Pre-feasibility Study, New Zealand | ||
7 | GEOLOGICAL SETTING AND MINERALIZATION ....................................................................... | 46 | |
7.1 | Regional Geology ..................................................................................................................... | 46 | |
7.2 | Waihi Geology ........................................................................................................................... | 48 | |
7.3 | Wharekirauponga ..................................................................................................................... | 51 | |
8 | DEPOSIT TYPES ................................................................................................................................. | 53 | |
9 | EXPLORATION .................................................................................................................................... | 54 | |
9.1 | Pre-OceanaGold ....................................................................................................................... | 54 | |
9.2 | OceanaGold .............................................................................................................................. | 54 | |
10 | DRILLING .............................................................................................................................................. | 55 | |
10.1 | Drill Methods ............................................................................................................................ | 55 | |
10.2 | Geological Logging .................................................................................................................. | 55 | |
10.3 | Drill Core Recovery .................................................................................................................. | 56 | |
10.4 | Collar Surveys .......................................................................................................................... | 56 | |
10.5 | Downhole Surveys .................................................................................................................. | 57 | |
10.6 | Geotechnical Drilling ............................................................................................................... | 57 | |
10.7 | Drill Spacings and Orientations ............................................................................................. | 57 | |
11 | SAMPLE PREPARATION, ANALYSES, AND SECURITY .......................................................... | 59 | |
11.1 | Sampling Methods and Preparation ..................................................................................... | 59 | |
11.2 | Quality Assurance and Quality Control ................................................................................ | 59 | |
11.3 | Laboratory Analyses ................................................................................................................ | 62 | |
11.4 | Database .................................................................................................................................... | 62 | |
11.5 | Sample Security. ....................................................................................................................... | 63 | |
11.6 | Density Determinations ............................................................................................................ | 63 | |
11.7 | Opinion on Adequacy (Security, Sample Preparation, Analysis) ..................................... | 65 | |
12 | DATA VERIFICATION ........................................................................................................................ | 66 | |
12.1 | Internal and External Reviews ................................................................................................ | 66 | |
12.2 | Opinion on Adequacy (Data Verification) .............................................................................. | 68 | |
13 | MINERAL PROCESSING AND METALLURGICAL TESTING ................................................... | 69 | |
13.1 | MUG ............................................................................................................................................ | 69 | |
13.2 | MOP ............................................................................................................................................ | 79 | |
13.3 | GOP ............................................................................................................................................ | 80 | |
13.4 | WUG ........................................................................................................................................... | 81 | |
13.5 | Comments on Adequacy (Processing and Metallurgy) ...................................................... | 97 | |
13.6 | Future Work Program ............................................................................................................... | 97 | |
14 | MINERAL RESOURCE ESTIMATES ............................................................................................... | 98 | |
14.1 | MUG ............................................................................................................................................ | 99 | |
14.2 | MOP ............................................................................................................................................ | 105 | |
Document ID: STU-063-REP-002-0 Released: 11th December 2024Page 3 of 244
OceanaGold Corporation | ||
NI 43-101 Technical Report – Waihi District Pre-feasibility Study, New Zealand | ||
14.3 | Gladstone Pit ............................................................................................................................. | 111 | |
14.4 | Wharekirauponga ..................................................................................................................... | 115 | |
14.5 | Classification of Mineral Resources ..................................................................................... | 122 | |
14.6 | Cut–off Grade Estimates ......................................................................................................... | 123 | |
14.7 | Mining Factors or Assumptions .............................................................................................. | 123 | |
14.8 | Risks ........................................................................................................................................... | 128 | |
14.9 | Mineral Resource Statement ................................................................................................. | 129 | |
15 | MINERAL RESERVE ESTIMATES ................................................................................................... | 131 | |
15.1 | MUG ............................................................................................................................................ | 131 | |
15.2 | WUG ........................................................................................................................................... | 132 | |
15.3 | Mineral Reserve Statement .................................................................................................... | 133 | |
16 | MINING METHODS ............................................................................................................................. | 135 | |
16.1 | Status of Current Mine Development ................................................................................... | 135 | |
16.2 | MUG ............................................................................................................................................ | 135 | |
16.3 | WUG ........................................................................................................................................... | 146 | |
16.4 | Production Schedule ................................................................................................................ | 158 | |
17 | RECOVERY METHODS ..................................................................................................................... | 161 | |
17.1 | Ore Processing ........................................................................................................................ | 161 | |
17.2 | Operational Results .................................................................................................................. | 165 | |
17.3 | Process Unit Costs ................................................................................................................... | 166 | |
17.4 | Water Treatment Plant ............................................................................................................ | 167 | |
18 | PROJECT INFRASTRUCTURE ........................................................................................................ | 171 | |
18.1 | Existing Mine Site Surface Infrastructure ............................................................................ | 171 | |
18.2 | Tailings Storage Facility .......................................................................................................... | 172 | |
18.3 | Waste Rock Storage and Usage ........................................................................................... | 174 | |
18.4 | Site Wide Water Management ............................................................................................... | 177 | |
18.5 | Site Wide Water Balance ........................................................................................................ | 178 | |
18.6 | Water Supply ............................................................................................................................ | 179 | |
18.7 | Power and Electrical ............................................................................................................... | 179 | |
18.8 | Willows Facilities (for WUG) .................................................................................................. | 180 | |
19 | MARKET STUDIES AND CONTRACTS ......................................................................................... | 182 | |
19.1 | General ...................................................................................................................................... | 182 | |
19.2 | Bullion Production and Sales .................................................................................................. | 182 | |
19.3 | Contracts and Forward Sales Contracts ............................................................................... | 182 | |
20 | ENVIRONMENTAL STUDIES, PERMITTING, AND SOCIAL OR COMMUNITY IMPACT .... | 183 | |
20.1 | Mineral Rights and land access ............................................................................................. | 183 | |
20.2 | Land Access Status .................................................................................................................. | 183 | |
Document ID: STU-063-REP-002-0 Released: 11th December 2024Page 4 of 244
OceanaGold Corporation | ||
NI 43-101 Technical Report – Waihi District Pre-feasibility Study, New Zealand | ||
20.3 | Required Permits and Status .................................................................................................. | 184 | |
20.4 | Permitting Process and Schedule .......................................................................................... | 184 | |
20.5 | Environmental Studies ............................................................................................................. | 184 | |
20.6 | Stakeholder Engagement ........................................................................................................ | 187 | |
20.7 | Social and Cultural Impacts .................................................................................................... | 188 | |
20.8 | Rehabilitation and Bonds ........................................................................................................ | 189 | |
21 | CAPITAL AND OPERATING COSTS .............................................................................................. | 190 | |
21.1 | Capital Expenditure Estimates ............................................................................................... | 190 | |
21.2 | Operating Cost Estimates ....................................................................................................... | 194 | |
22 | ECONOMIC ANALYSIS ...................................................................................................................... | 198 | |
22.1 | Principal Assumptions and Input Parameters ..................................................................... | 198 | |
22.2 | Cashflow Forecasts and Annual Production Forecasts ...................................................... | 199 | |
22.3 | Taxes, Royalties and Other Interests .................................................................................... | 206 | |
22.4 | Sensitivity Analysis ................................................................................................................... | 207 | |
22.5 | OceanaGold Pricing Model Result ........................................................................................ | 209 | |
23 | ADJACENT PROPERTIES ................................................................................................................ | 213 | |
24 | OTHER RELEVANT DATA AND INFORMATION ......................................................................... | 214 | |
25 | INTERPRETATION AND CONCLUSIONS ..................................................................................... | 215 | |
25.1 | Geology and Mineralization .................................................................................................... | 215 | |
25.2 | Resource Estimation ................................................................................................................ | 215 | |
25.3 | Status of Exploration, Development and Operations .......................................................... | 215 | |
25.4 | Geotechnical, Hydrology, Mining and Reserves .................................................................. | 216 | |
25.5 | Mineral Processing, and Water Treatment .......................................................................... | 218 | |
25.6 | Project Infrastructure ................................................................................................................ | 218 | |
25.7 | Mineral Tenure, Surface Rights, Royalties, Environment, Social and Permits ............... | 219 | |
25.8 | Economic Analysis .................................................................................................................... | 220 | |
26 | RECOMMENDATIONS ....................................................................................................................... | 221 | |
26.1 | Recommended Work Programs ............................................................................................ | 221 | |
26.2 | Recommended Work Program Costs .................................................................................... | 223 | |
27 | REFERENCES ...................................................................................................................................... | 224 | |
28 | GLOSSARY .......................................................................................................................................... | 226 | |
28.1 | Mineral Resources .................................................................................................................... | 226 | |
28.2 | Mineral Reserves ...................................................................................................................... | 226 | |
28.3 | Definition of Terms .................................................................................................................... | 227 | |
28.4 | Abbreviations ............................................................................................................................. | 228 | |
Document ID: STU-063-REP-002-0 Released: 11th December 2024Page 5 of 244
OceanaGold Corporation | ||
NI 43-101 Technical Report – Waihi District Pre-feasibility Study, New Zealand | ||
Appendices
APPENDICES ................................................................................................................................................. | 235 |
APPENDIX A – CERTIFICATES OF QUALIFIED PERSONS ............................................................... | 236 |
Document ID: STU-063-REP-002-0 Released: 11th December 2024Page 6 of 244
OceanaGold Corporation | ||
NI 43-101 Technical Report – Waihi District Pre-feasibility Study, New Zealand | ||
Tables
Table 1-1: Summary of Mineral Resources Estimate as of June 30, 2024 .................................... | 16 |
Table 1-2: MUG and WUG Combined Mineral Reserves Estimate as of June 30, 2024 ............ | 19 |
Table 1-3: WUG Mine Production Annual Mining Schedule ............................................................. | 21 |
Table 1-4: MUG Mine Production Annual Mining Schedule .............................................................. | 22 |
Table 1-5: Total Capital Cost Summary ($M) ........................................................................................ | 28 |
Table 1-6: LoM Operating Cost Summary ($M and $/t) ...................................................................... | 29 |
Table 1-7: Indicative Economic Results ................................................................................................. | 31 |
Table 1-8: Gold Price Sensitivity Analysis ............................................................................................ | 32 |
Table 2-1: Qualified Persons Responsible for Preparing this Technical Report ........................ | 35 |
Table 6-1: Mine Production Since 1988 - 2023 ..................................................................................... | 45 |
Table 10-1: Current Project Drill Spacings ............................................................................................ | 58 |
Table 11-1: Grade Control QAQC Samples for RC Sampling ........................................................... | 61 |
Table 11-2: Grade Control QAQC Samples for Open Pit Channels ................................................ | 62 |
Table 11-3: Density Values Used in MUG .............................................................................................. | 63 |
Table 11-4: Mined Variable Values Used Around Historical Workings ......................................... | 64 |
Table 11-5: Density values Used in GOP ............................................................................................... | 64 |
Table 11-6: Bulk Density Values in MOP ............................................................................................... | 64 |
Table 11-7: Bulk Density Values Used in WUG .................................................................................... | 65 |
Table 13-1: Testwork Program 2018 ....................................................................................................... | 69 |
Table 13-2: Testwork Program 2019 ....................................................................................................... | 69 |
Table 13-3: Testwork Program 2020 ....................................................................................................... | 69 |
Table 13-4: Summary of MUG Composite Samples Tested .............................................................. | 70 |
Table 13-5: Metallurgical Samples Contained within MUG Stopes ................................................ | 70 |
Table 13-6: Gold Extraction Results for Historical Composites ..................................................... | 71 |
Table 13-7: Gold Extraction Results for 2019 Composites ............................................................... | 72 |
Table 13-8 Gold Extraction Results for 2020 Composites ................................................................ | 73 |
Table 13-9: Historical Comminution Results on Ore from MUG -2011 .......................................... | 75 |
Table 13-10: Summary of Comminution Testing of 2019 MUG Mineralization Samples .......... | 76 |
Table 13-11: Summary of Comminution Testing of 2020 MUG Mineralization Samples .......... | 77 |
Table 13-12: Combined Comminution Testing results 2019 and 2020 .......................................... | 78 |
Table 13-13: MUG Recovery Models ....................................................................................................... | 78 |
Table 13-14: Recovery Estimate ............................................................................................................... | 81 |
Table 13-15: Comminution Testing of GOP Mineralization Samples ............................................. | 81 |
Table 13-16: 2018 Wharekirauponga Composite Locations ............................................................. | 82 |
Table 13-17: 2019 Wharekirauponga Composite Locations ............................................................. | 83 |
Table 13-18: Wharekirauponga Composite Head Assay Results ................................................... | 84 |
Document ID: STU-063-REP-002-0 Released: 11th December 2024Page 7 of 244
OceanaGold Corporation | ||
NI 43-101 Technical Report – Waihi District Pre-feasibility Study, New Zealand | ||
Table 13-19: 2018 Composite Gold Recovery Results ....................................................................... | 85 |
Table 13-20: 2019 Composite Gold Recovery Results ....................................................................... | 85 |
Table 13-21: 2020 WUG Au Geometallurgical Matrix – Mass Balance ........................................... | 86 |
Table 13-22: 2020 WUG Au Geometallurgical Matrix – Gold Balance ............................................ | 87 |
Table 13-23: 2020 WUG Au Geometallurgical Matrix .......................................................................... | 88 |
Table 13-24: 2020 Composite Gold Recovery Results ....................................................................... | 89 |
Table 13-25: 2022 WUG Au Geometallurgical Matrix – Mass Balance ........................................... | 90 |
Table 13-26: 2022 WUG Au Geometallurgical Matrix – Gold Balance ............................................ | 90 |
Table 13-27: 2022 WUG Au Geometallurgical Matrix .......................................................................... | 91 |
Table 13-28: 2022 Composite Gold Recovery Results ....................................................................... | 92 |
Table 13-29: 2022 WUG As Geometallurgical Matrix – Mass Balance ........................................... | 93 |
Table 13-30: 2022 WUG As Geometallurgical Matrix – Gold Balance ............................................ | 93 |
Table 13-31: 2022 Composite Results (Geomet Domain 4-9 g/t Au and 150-500 ppm As) ....... | 94 |
Table 13-32: 2019 WUG Comminution Testwork ................................................................................. | 96 |
Table 13-33: 2020 WUG Comminution Testwork ................................................................................. | 96 |
Table 14-1: Model Closeout Dates ........................................................................................................... | 98 |
Table 14-2: Summary Statistics of Composite Au Values for MUG ............................................... | 100 |
Table 14-3: Summary Statistics of Cut Au Values for MUG ............................................................. | 101 |
Table 14-4: MUG Block Model Dimensions ........................................................................................... | 102 |
Table 14-5: Fields in the MUG Model ...................................................................................................... | 102 |
Table 14-6: MUG Summary of Search Neighbourhood Parameters for Au Estimate ................ | 104 |
Table 14-7. MUG Resource Estimate vs Mill-Reconciled Stope and Development .................... | 105 |
Table 14-8: Summary Statistics of Composite Au Values for MOP ................................................ | 106 |
Table 14-9: Summary Statistics of Cut Au for MOP ............................................................................ | 108 |
Table 14-10: MOP5 Block Model Dimensions ....................................................................................... | 109 |
Table 14-11: MOP Estimation Parameters used in Estimate ............................................................ | 109 |
Table 14-12: List of Fields in MOP Model .............................................................................................. | 110 |
Table 14-13: Summary Statistics for Composite Au Values for GOP ............................................ | 112 |
Table 14-14: GOP Estimation Parameters ............................................................................................. | 113 |
Table 14-15: GOP Block Model Dimensions ......................................................................................... | 114 |
Table 14-16: Summary Statistics of Composite Au Values for WUG ............................................. | 116 |
Table 14-17: WUG Estimation Parameters ............................................................................................ | 120 |
Table 14-18: WUG Block Model Dimensions ........................................................................................ | 120 |
Table 14-19: List of Fields in WUG Model ............................................................................................. | 121 |
Table 14-20: Classification Criteria ......................................................................................................... | 122 |
Table 14-21: Resource Cut-off Grade Estimates ................................................................................. | 123 |
Table 14-22: Summary of Mineral Resources Estimate as of June 30, 2024 ............................... | 130 |
Document ID: STU-063-REP-002-0 Released: 11th December 2024Page 8 of 244
OceanaGold Corporation | ||
NI 43-101 Technical Report – Waihi District Pre-feasibility Study, New Zealand | ||
Table 15-1: Underground Mining Dilution Factors .............................................................................. | 131 |
Table 15-2: MUG Underground Mining Dilution and Recovery Factors ........................................ | 132 |
Table 15-3: WUG Mining Dilution and Recovery Factors .................................................................. | 133 |
Table 15-4: MUG and WUG Reserve Estimate as of 30 June 2024 ................................................. | 133 |
Table 16-1: MUG Cut-off Grade Calculation .......................................................................................... | 136 |
Table 16-2. Summary of Laboratory Tests ............................................................................................ | 138 |
Table 16-3. Summary of Allowable Strike Lengths ............................................................................. | 139 |
Table 16-4: Underground Mining Rates ................................................................................................. | 142 |
Table 16-5: Mobile Diesel Fleet Ventilation Requirements ............................................................... | 144 |
Table 16-6: WUG Cut-off Calculation ...................................................................................................... | 146 |
Table 16-7: Dewatering Estimates for WUG .......................................................................................... | 151 |
Table 16-8: WUG Mining Rates ................................................................................................................. | 156 |
Table 16-9: WUG Mobile Equipment Fleet ............................................................................................. | 156 |
Table 16-10: Annual Production Profile ................................................................................................. | 160 |
Table 18-1: Tailings Storage Plan ............................................................................................................ | 173 |
Table 18-2: Waihi Power Demands .......................................................................................................... | 179 |
Table 21-1: Life of Mine Capital Costs ($ 000’s) ................................................................................... | 190 |
Table 21-2. WUG Contingency Breakdown ........................................................................................... | 191 |
Table 21-3: Underground Capital Cost Summary (Growth and Sustaining) ................................ | 192 |
Table 21-4: Processing Capital Cost Summary ................................................................................... | 193 |
Table 21-5: Tailings Storage Capital Cost Summary .......................................................................... | 193 |
Table 21-6: Other Capital Cost Summary .............................................................................................. | 194 |
Table 21-7: LoM Operating Cost Summary ........................................................................................... | 194 |
Table 21-8: MUG Cost Summary .............................................................................................................. | 195 |
Table 21-9: WUG Cost Summary ............................................................................................................. | 196 |
Table 21-10: Processing Cost Summary ............................................................................................... | 197 |
Table 21-11: General and Administration Operating Costs .............................................................. | 198 |
Table 22-1: Basic Model Parameters ...................................................................................................... | 198 |
Table 22-2: Annual Mine Production ....................................................................................................... | 199 |
Table 22-3: Annual Process Plant Production ..................................................................................... | 200 |
Table 22-4: LoM Operating Cost Summary ........................................................................................... | 201 |
Table 22-5: Life of Mine Capital Costs ($ 000’s) ................................................................................... | 202 |
Table 22-6: Indicative Economic Results .............................................................................................. | 203 |
Table 22-7: LoM AISC Contribution ......................................................................................................... | 205 |
Table 22-8: Annual AISC Curve Profile .................................................................................................. | 206 |
Table 22-9: Gold Price Sensitivity analysis ........................................................................................... | 208 |
Table 22-10: Gold Price .............................................................................................................................. | 209 |
Document ID: STU-063-REP-002-0 Released: 11th December 2024Page 9 of 244
OceanaGold Corporation | ||
NI 43-101 Technical Report – Waihi District Pre-feasibility Study, New Zealand | ||
Table 22-11: Key Economic Metrics ........................................................................................................ | 210 |
Table 22-12: Cash Flow Summary Mineral Reserves (Reserve Case Price) ................................ | 211 |
Table 22-13. Cash Flow Summary Mineral Reserves (Alternative Case Price) ........................... | 212 |
Table 26-1: Recommended Work Program Costs ............................................................................... | 223 |
Table 28-1: Definition of Terms ................................................................................................................ | 227 |
Table 28-2: Abbreviations .......................................................................................................................... | 228 |
Document ID: STU-063-REP-002-0 Released: 11th December 2024Page 10 of 244
OceanaGold Corporation | ||
NI 43-101 Technical Report – Waihi District Pre-feasibility Study, New Zealand | ||
Figures
Figure 1-1: General Location Map of the Waihi Operation ............................................................... | 12 |
Figure 1-2: Map Showing Location of WUG and the Waihi Operations ........................................ | 14 |
Figure 1-3: Resource Versus Reserve Example Schematic ............................................................. | 17 |
Figure 1-4: Waihi Process Flowsheet ..................................................................................................... | 23 |
Figure 1-5: Waihi Existing and Planned Infrastructure ...................................................................... | 24 |
Figure 1-6. Annual AISC and Total Cost Curve Profile ...................................................................... | 30 |
Figure 4-1: Map Showing the Location of the Waihi Operation ....................................................... | 38 |
Figure 4-2: Location of the Waihi Operations and WUG Area, Declines and Tunnels, Willows Facilities, and Mining Permits .................................................................................................. | 39 |
Figure 4-3: Location of the Projects within the Favona Mining Permit (NZTM grid) .................. | 40 |
Figure 7-1: Regional Geological Map of the Coromandel Peninsula (NZTM grid) ...................... | 47 |
Figure 7-2: Geological Map and Section Across the Waihi Area .................................................... | 49 |
Figure 7-3: Geological Cross Section Through the Gladstone Vein System. The Location of this Section Line is Shown as B-B1 in Plan View in Figure 7-2 .................................................. | 51 |
Figure 7-4: a) Geological Map Across the Wharekirauponga Vein Systems and b) A Cross Section Facing NNE Showing the Architecture of Veining at Depth. Majority of the Au Mineralization Occurs Along the EG Vein at the Intersection with the EG HW Veins ............... | 52 |
Figure 11-1: Sample Preparation Flow Sheet for SGS laboratory in Waihi .................................. | 61 |
Figure 13-1: Gold Extraction as a Function of Feed Grade .............................................................. | 74 |
Figure 13-2: Arsenic Grade / Recovery Relationship ......................................................................... | 79 |
Figure 13-3: Historical Open Pit Performance ..................................................................................... | 80 |
Figure 13-4: Cross-Section of WUG Geometallurgical Samples ..................................................... | 95 |
Figure 14-1: List of Fields in GOP Model ............................................................................................... | 115 |
Figure 14-2: Vein 425 uncapped – (top) plot of Au ppm in histogram / (bottom) probability plot of Au ........................................................................................................................................................ | 117 |
Figure 14-3: Summary of Back-Transformed Variogram Parameters (Vein = 410) .................... | 118 |
Figure 14-4: Summary of Back-Transformed Variogram Parameters (Vein = 425) .................... | 119 |
Figure 14-5: Resource Versus Reserve Conceptual Schematic for Martha Pit ........................... | 123 |
Figure 14-6: Plan of Martha Phase 5 Pit ................................................................................................. | 125 |
Figure 14-7: MUG Mineral Resource Long Section ............................................................................. | 126 |
Figure 14-8: Gladstone Pit Geotechnical Domains ............................................................................. | 127 |
Figure 14-9: WUG Mineral Resource Long Section ............................................................................ | 128 |
Figure 14-10: WUG Mineral Resource Plan View ................................................................................. | 128 |
Figure 16-1: MUG Mining Cross Section Looking South East from Hanging Wall .................... | 135 |
Figure 16-2: Underground Mining Operating Costs 2009 to 2023 .................................................. | 136 |
Figure 16-3: Plan and Long Section of Geotechnically Logged Drill Holes ................................. | 137 |
Figure 16-4: Plot of Structure Data for MUG ......................................................................................... | 137 |
Document ID: STU-063-REP-002-0 Released: 11th December 2024Page 11 of 244
OceanaGold Corporation | ||
NI 43-101 Technical Report – Waihi District Pre-feasibility Study, New Zealand | ||
Figure 16-5: MUG Primary Ventilation Layout ...................................................................................... | 144 |
Figure 16-6: Martha Primary Pumping Station Layout ....................................................................... | 145 |
Figure 16-7: WUG Mining Method and Extraction Sequence ........................................................... | 148 |
Figure 16-8: Wharekirauponga Catchment Drainage ......................................................................... | 149 |
Figure 16-9: WUG Potential Groundwater Impact Areas ................................................................... | 150 |
Figure 16-10: Waihi North Project Configuration ................................................................................ | 152 |
Figure 16-11: WUG Long Section looking NW from Footwall .......................................................... | 153 |
Figure 16-12: Bulk Mining (left) vs Avoca Only Mining (Right)........................................................ | 154 |
Figure 16-13: Isometric View of WUG Underground Layout (Looking from Hanging Wall) .... | 155 |
Figure 16-14: WUG Ventilation Shaft Construction Methodology .................................................. | 157 |
Figure 16-15. Annual Mine Production ................................................................................................... | 158 |
Figure 16-16: Annual Processing Profile ............................................................................................... | 159 |
Figure 17-1: Process Flow Sheet ............................................................................................................. | 161 |
Figure 17-2: General Arrangement for Proposed Process Plant Upgrade ................................... | 164 |
Figure 17-3: Proposed Reefton Crusher Installation .......................................................................... | 164 |
Figure 17-4: Proposed Tower Mill Installation ..................................................................................... | 165 |
Figure 17-5: Underground Mill Feed Tonnes and Recovery 2009-2023 ........................................ | 166 |
Figure 17-6: Actual Process Unit Costs 2009-2023 ............................................................................. | 166 |
Figure 17-7: Water Treatment Plant Flowsheet .................................................................................... | 167 |
Figure 17-8: General Arrangement of Water Treatment Plant Upgrade ........................................ | 170 |
Figure 18-1: Waihi Existing Infrastructure ............................................................................................ | 171 |
Figure 18-2: Plan View of TSF3 to 142 mRL .......................................................................................... | 173 |
Figure 18-3: Tailings Storage and TSF Construction Chart ............................................................. | 174 |
Figure 18-4: Site Wide Water Management ........................................................................................... | 177 |
Figure 18-5: Willows Infrastructure and Buildings ............................................................................. | 181 |
Figure 22-1: Annual Mine Production ..................................................................................................... | 199 |
Figure 22-2: Annual Process Plant Production ................................................................................... | 200 |
Figure 22-3: Project After-Tax Metrics Summary at $1,750 /oz Au ................................................. | 204 |
Figure 22-4: Project After-Tax Metrics Summary at $2,400 /oz Au ................................................. | 204 |
Figure 22-5: Annual AISC and Total Cash Cost Curve Profile ......................................................... | 206 |
Figure 22-6: NPV Sensitivity Analysis .................................................................................................... | 207 |
Figure 22-7: Gold Price Sensitivity Analysis ........................................................................................ | 208 |
Document ID: STU-063-REP-002-0 Released: 11th December 2024Page 12 of 244
OceanaGold Corporation | ||
NI 43-101 Technical Report – Waihi District Pre-feasibility Study, New Zealand | ||
1SUMMARY
This Technical Report has been prepared in accordance with National Instrument 43-101 – Standards of
Disclosure for Mineral Projects (NI 43-101). The purpose of this report is to disclose the results of the
Waihi Mineral Resource and Mineral Reserve estimates and the completed Pre-Feasibility Study on
Wharekirauponga Underground (WUG). This report will be available on OceanaGold Corporation’s
(OceanaGold or the Company) website at oceanagold.com and under the Company’s profile on SEDAR+
at sedarplus.com.
The previous NI 43-101 technical report for the Waihi operation was filed in March 2021.
This technical report prepared in accordance with NI 43-101 for the Waihi operation (Technical Report)
summarises work completed that covers the conversion of Mineral Resources to Mineral Reserves for the
Martha and Wharekirauponga deposits. This report supports Mineral Resources and Mineral Reserves
estimates as of the June 30, 2024.
1.1Property Description, Location and Ownership
The Waihi operation is located within the Hauraki District on the North Island of New Zealand. The Waihi
operation is owned and managed by Oceana Gold (New Zealand) Limited and Waihi Gold Company
Limited, both 100 % owned subsidiaries of OceanaGold. The general location of the Waihi operation is
illustrated in Figure 1-1.
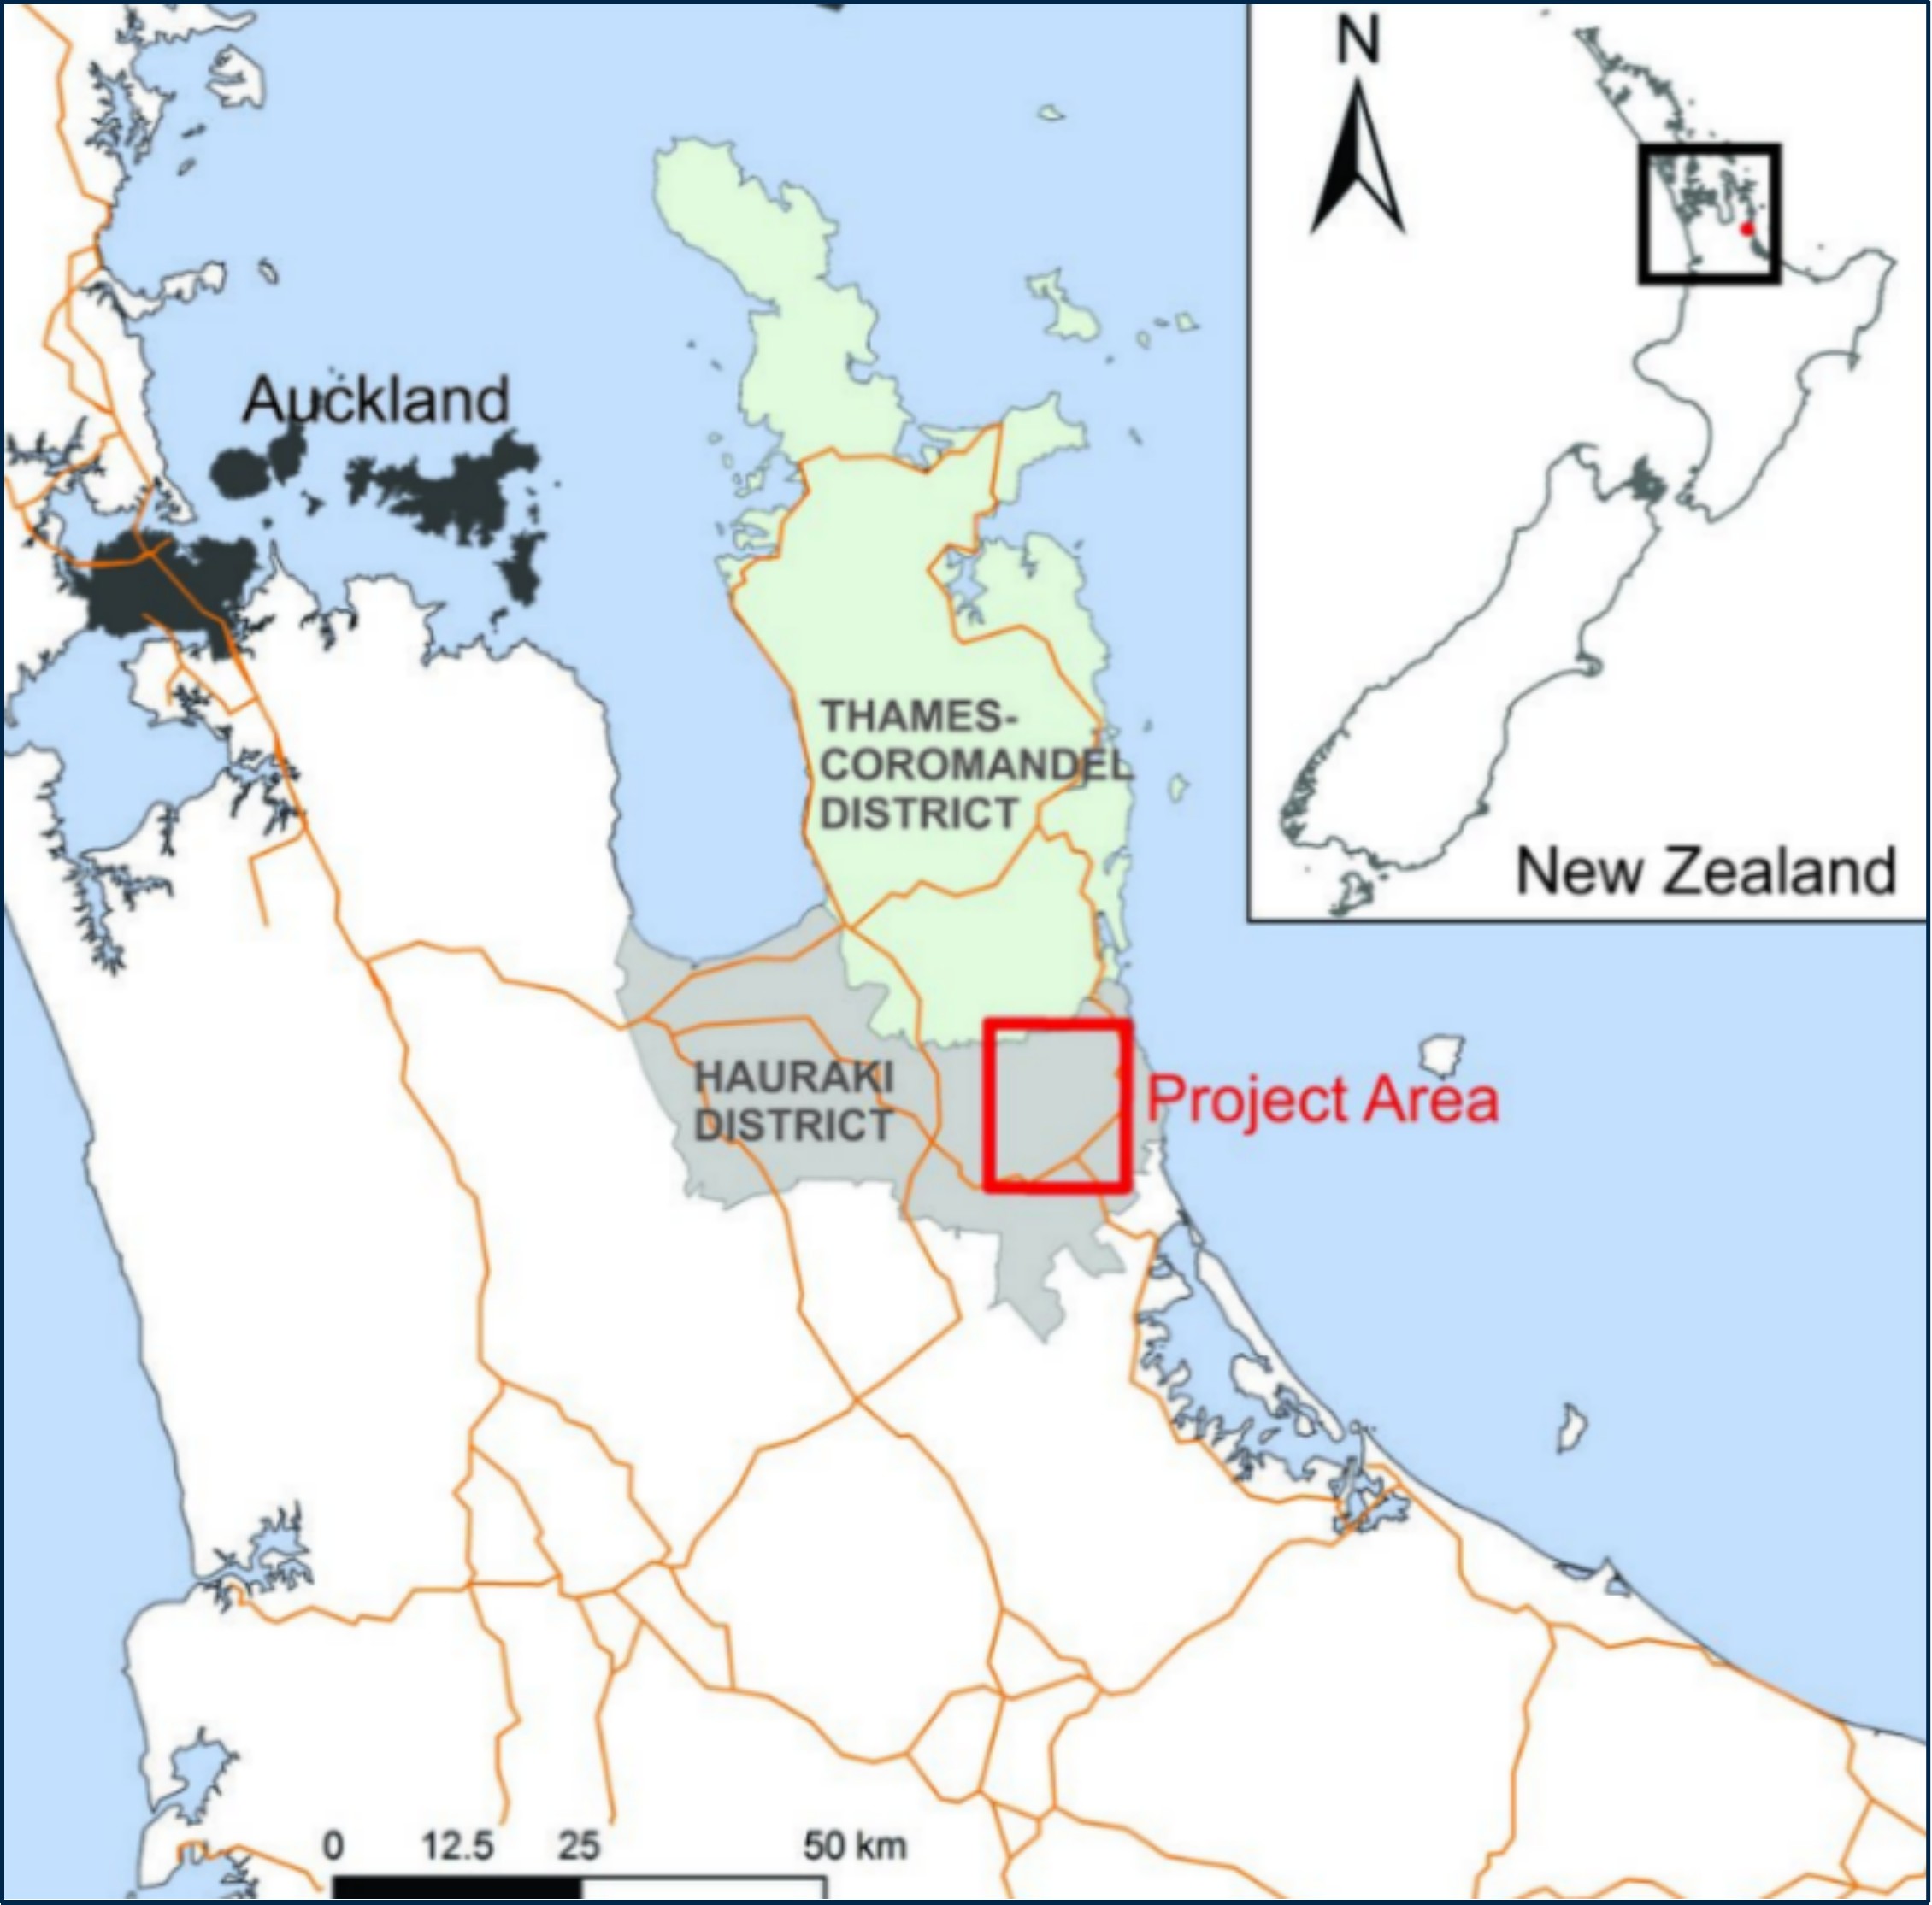
Figure 1-1: General Location Map of the Waihi Operation
Document ID: STU-063-REP-002-0 Released: 11th December 2024Page 13 of 244
OceanaGold Corporation | ||
NI 43-101 Technical Report – Waihi District Pre-feasibility Study, New Zealand | ||
Prospecting, Exploration and Mining Permits issued under the Crown Minerals Act 1991 (CMA) provide
exclusive rights to minerals owned by the Crown, including gold and silver, and confer rights to access
those minerals underground, but not at surface without landowner access approval. All existing gold
mining activities in Waihi including the current Martha Underground (MUG), the ore processing plant,
existing tailings facilities and the inactive Martha open pit are within the existing Favona Mining Permit
41808 (MP 41808) and are on land owned by OceanaGold or for which requisite surface land access
rights are in place.
Wharekirauponga is located approximately 10 km to the north of Waihi and is held under the
Wharekirauponga Mining Permit 60541 (MP 60541). WUG and the related access tunnels and surface
infrastructure are within land owned and administered by government agencies including the Department
of Conservation (DOC), are within OceanaGold owned land, or have no surface expression for which land
access rights are required. Approvals processes are underway or planned to secure the surface access
rights over government land as required for exploration, environmental management and monitoring
activities, vent rise structures and utilities connecting the proposed new surface facilities site at Willows to
the existing Waihi operations.
An access arrangement between DOC and OceanaGold has been granted to allow for exploration
activities (including surface drilling) to take place within MP 60541. Approvals processes are underway or
planned to secure land access for additional exploration sites and environmental management and
monitoring activities.
1.1.1Current Waihi Operations
MP 41808 extends across an area of 1573 hectares characterized by urban and rural land use. Land
ownership is variable including parcels owned by OceanaGold, private landowners and government
agencies. As noted above, all requisite landowner approvals are in place as required for surface land
access to support the existing operations. In addition to land access and mineral rights, OceanaGold
holds a suite of resource consents from the Hauraki District Council (HDC) and Waikato Regional Council
(WRC) authorising mining within the MP 41808 area.
1.1.2Wharekirauponga Underground (WUG)
MP 60541 extends across an area of 3,272 hectares. The proposed WUG mine, vent stacks, dual access
tunnel and surface exploration activities are located within MP 60541 on land primarily owned by the
Crown and administered by DOC as a conservation/forest park. Portal access to the mine together with
other associated surface infrastructure and the proposed Processing Plant to Willows access tunnel are
located on land owned by OceanaGold, private landowners or government agencies.
The Waihi North Project (WNP) includes WUG, access tunnels from a box cut portal at Willows to WUG,
Processing Plant to Willows access tunnel, surface facilities and infrastructure at Willows, high voltage
(HV) power upgrade, processing and water treatment plant upgrades, Martha Open Pit Stage 4
infrastructure upgrade and a new tailings storage facility (TSF3).
Requirements for third party surface access rights, including access arrangements issued under the CMA
or licences and easements, are confined to government agencies, with processes underway or planned to
secure these as part of the WNP permitting and consenting work plan. Figure 1-2 outlines the WNP,
Martha Open Pit (MOP), MUG, and the existing Waihi surface facilities at the processing plant.
Document ID: STU-063-REP-002-0 Released: 11th December 2024Page 14 of 244
OceanaGold Corporation | ||
NI 43-101 Technical Report – Waihi District Pre-feasibility Study, New Zealand | ||
OceanaGold will require a suite of resource consents authorising mining of WUG and the construction
and operation of associated infrastructure within the MP 60541 and MP 41808 areas. Processes are
underway or planned to secure these as part of the permitting and consenting work plan. It is anticipated
these consents will be secured in 2025, enabling surface works to commence in 2025 and underground
tunnelling to commence in mid-late 2026. First stope ore at WUG is planned for 2033.
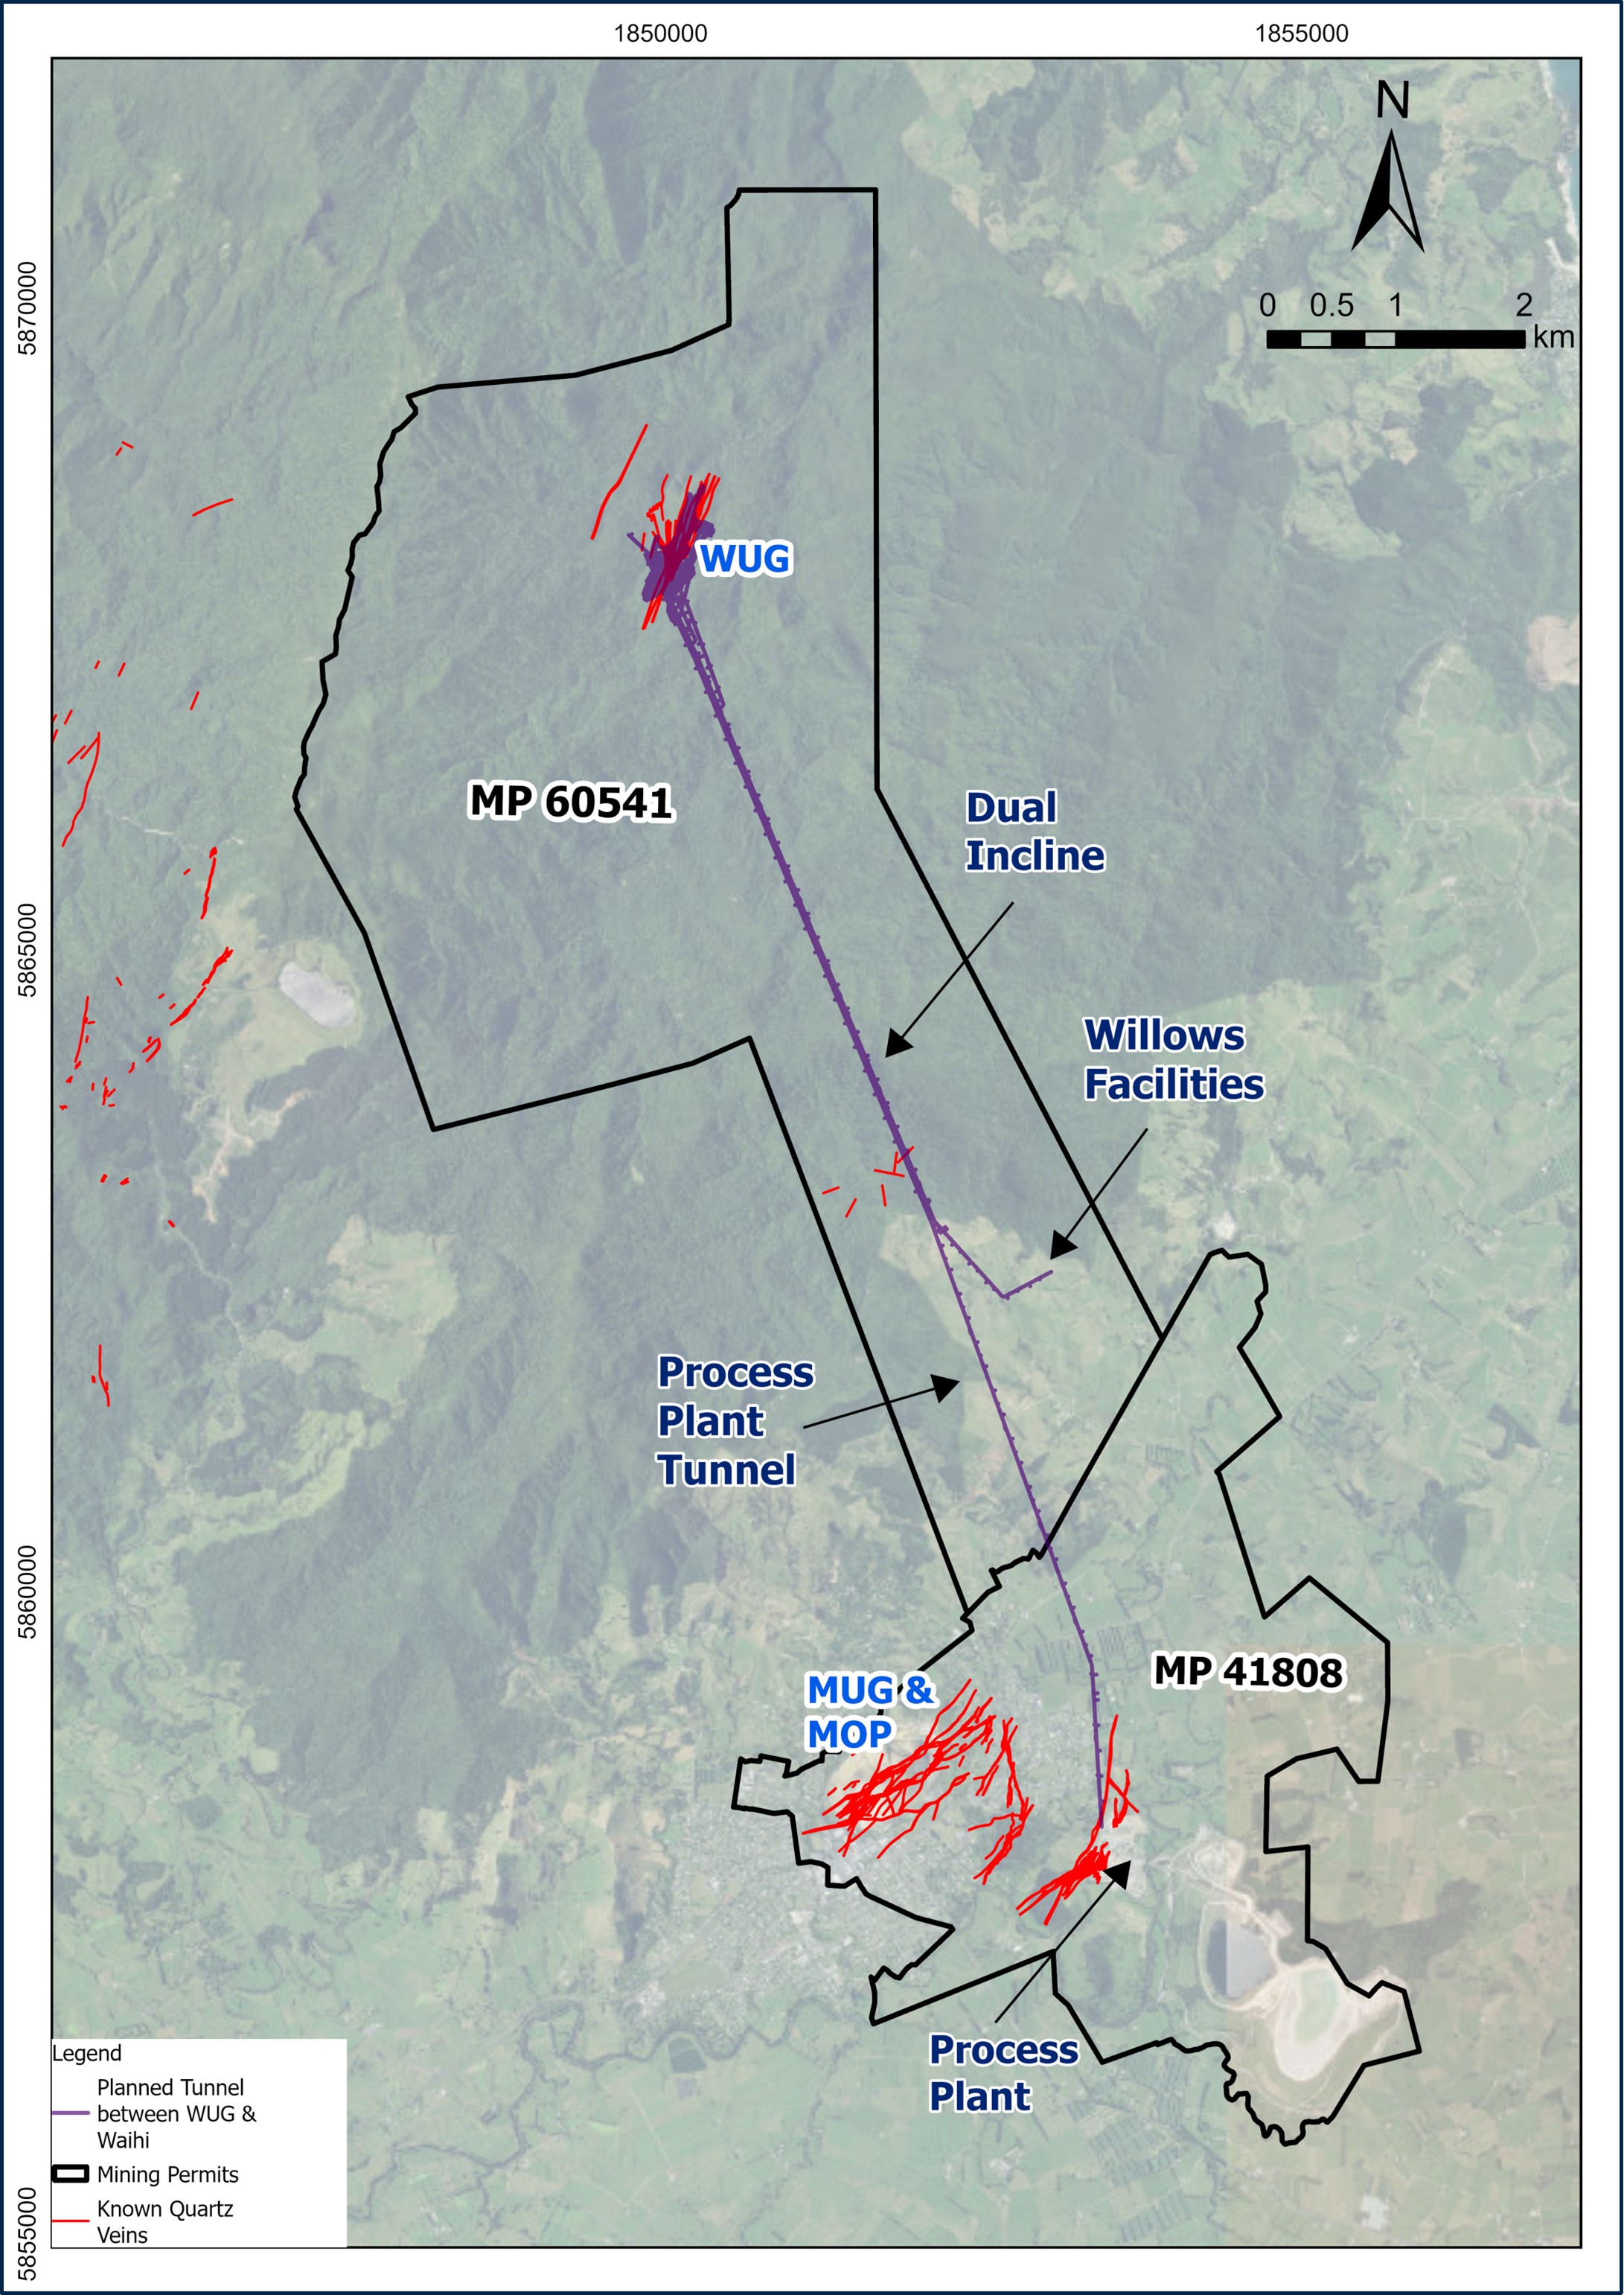
Figure 1-2: Map Showing Location of WUG and the Waihi Operations
1.2Geology and Mineralization
WUG and MUG are located within the Coromandel Peninsula which hosts over 50 known gold and silver
deposits that make up the Hauraki Goldfield. The peninsula is built up of Miocene to Quaternary volcanic
rocks (the Coromandel Volcanic Zone) overlying a Mesozoic basement. It is bound to the west by the
Document ID: STU-063-REP-002-0 Released: 11th December 2024Page 15 of 244
OceanaGold Corporation | ||
NI 43-101 Technical Report – Waihi District Pre-feasibility Study, New Zealand | ||
Hauraki Rift, a large graben filled with Quaternary and Tertiary sediments, and to the south by volcanics
deposited by the presently active Taupo Volcanic Zone (TVZ).
The gold and silver mineralization occurs within low-sulphidation, epithermal quartz vein systems
occupying large, north to northeast trending, normal faults and their subsidiary extensional structures. The
vein systems comprise a 3D network of multiple vein sets that collectively strike >1000 m, with a current
vertical range of 300 m (Wharekirauponga) and >500 m (Waihi) and include veins typically between 0.5
and 5 m in width (but up to 30 m locally). The main gold bearing minerals are electrum and silver
sulphides developed within quartz veins.
The geological controls on mineralization are well understood and is sufficient to support the estimation of
Mineral Resources and Mineral Reserves.
1.3Status of Exploration, Development and Operation
Historical underground mining took place in Waihi from 1879 to 1952 on the Martha vein system
producing approximately 5.0 Moz Au. The Martha vein system was then mined in an open pit from 1988
to 2015 and produced 2 Moz Au. Underground mining recommenced in 2004, and various vein systems
have since been mined around Waihi to date. Minor historical underground mining took place at
Wharekirauponga between 1893 to 1897 producing 19 oz of gold.
Exploration completed in Waihi has included underground and open pit mapping, geochemical sampling,
spectral analysis, airborne geophysical surveys, ground resistivity geophysics, extensive diamond drilling
and engineering studies. Exploration conducted around Wharekirauponga since 1986 has consisted of
geological and structural mapping, geochemical sampling, airborne, ground and downhole geophysical
surveys, surface drilling, engineering studies and mining operations.
Approximately 370 km of diamond core has been drilled within the Martha and Gladstone areas since
1980 (as of June 2024) and Wharekirauponga has had ~64 km of diamond drilling since 1980 (as of June
2024). Additionally, 86 km has been drilled in approximately 4,000 reverse circulation grade control holes
during the open pit operation. Recent diamond drilling has largely focused on the Wharekirauponga,
Martha and Gladstone deposits. The exploration programs completed to date are appropriate to the style
of the deposit and prospects.
1.4Mineral Processing and Metallurgical Test Work
With more than 35 years of proven operating performance, there is a high level of confidence that the
Waihi process flowsheet is well suited to regional geology. Significant operating experience and
metallurgical testwork data have been accumulated over the life-of-mine informing the development and
selection of processing options for future orebodies.
Metallurgical testwork on Wharekirauponga mineralization has been used to generate recovery and
throughput estimates for inclusion in the WUG technical and financial models. To support the test work
program, a geometallurgical matrix was developed identifying the main gold bearing domains and
composites targeted for metallurgical analysis. The basis was that the existing grind/leach process would
be suitable for treatment of the WUG orebody.
Testwork results support ongoing use of the existing Waihi plant flowsheet, with plant expansions to
enable higher WUG throughput rates. Metallurgical analysis also confirmed that the existing P80 targets
Document ID: STU-063-REP-002-0 Released: 11th December 2024Page 16 of 244
OceanaGold Corporation | ||
NI 43-101 Technical Report – Waihi District Pre-feasibility Study, New Zealand | ||
of 75 µm for open-pit ores and 53 µm for underground ores will continue to deliver gold recoveries of
greater than 90 %.
1.5Mineral Resources Estimate
The Mineral Resources at Waihi comprise both open pit and underground resources. Separate block
models were generated for the respective open pit and underground areas. Mineral Resources were
classified in accordance with the 2014 CIM Definition standards. The Mineral Resource statement, as of
June 30 2024, for Waihi District is presented in Table 1-1.
Table 1-1: Summary of Mineral Resources Estimate as of June 30, 2024
Area | Indicated | Inferred | ||||||||
Tonnes | Grade | Grade | Au | Ag | Tonnes | Grade | Grade | Au | Ag | |
(Mt) | (g/t Au) | (g/t Ag) | (Moz) | (Moz) | (Mt) | (g/t Au) | (g/t Ag) | (Moz) | (Moz) | |
MOP | 6.50 | 1.95 | 13.4 | 0.41 | 2.81 | 2.3 | 2.1 | 12.1 | 0.2 | 0.9 |
GOP | 3.22 | 1.44 | 3.76 | 0.15 | 0.39 | 0.8 | 1.0 | 2.6 | 0.03 | 0.1 |
MUG | 6.42 | 5.29 | 25.5 | 1.09 | 5.27 | 2.7 | 4.7 | 27.1 | 0.4 | 2.4 |
WUG | 2.39 | 17.9 | 28.0 | 1.37 | 2.15 | 1.3 | 9.6 | 17.1 | 0.4 | 0.7 |
Total Mineral Resources | 18.5 | 5.07 | 17.8 | 3.02 | 10.6 | 7.1 | 4.3 | 17.6 | 1.0 | 4.0 |
Notes:
Mineral Resources are reported inclusive of Mineral Reserves. Mineral Resources that are not Mineral
Reserves do not have demonstrated economic viability.
Mineral Resources estimate was reviewed and approved by, or is based on information prepared by or
under the supervision of, Leroy Crawford-Flett, BSc Geology, MAusIMM CP (Geology), the Company’s
Exploration and Geology Manager and a qualified person under NI 43-101.
Mineral Resources are reported at a gold price of $1,950/oz.
Mineral Resources estimate for MUG is reported below the MOP design and constrained to within a
conceptual underground design based upon the incremental cut-off grade of 2.15 g/t Au.
Mineral Resources estimate for Wharekirauponga WUG is reported within a conceptual underground design
at a 2.10 g/t Au cut-off grade.
Mineral Resources estimates for MOP and GOP are reported within conceptual pit designs and incremental
cut-off grades of 0.50 g/t and 0.56 g/t, respectively. The MOP conceptual pit design is limited by
infrastructural considerations.
Tonnage and grade measurements are in metric units. Gold ounces are reported as troy ounces and “g/t”
represents grams per tonne.
No dilution is included in the reported figures and no allowances for processing or mining recoveries have
been made.
All figures have been rounded; totals may therefore not sum exactly.
OceanaGold is not aware of any environmental, permitting, legal, socio-economic, marketing, political, or
other factors that might materially affect the Mineral Resource estimates. The QPs acknowledge that the
consenting timeline is a risk, however, are satisfied with the Company’s risk mitigation plans.
Document ID: STU-063-REP-002-0 Released: 11th December 2024Page 17 of 244
OceanaGold Corporation | ||
NI 43-101 Technical Report – Waihi District Pre-feasibility Study, New Zealand | ||
MUG and WUG Resources are reported within conceptual stopes, only for material above the nominated
cut-off grade. This constrains the tonnes and grade reporting to the mineralized or vein interpretation as
shown in Figure 1-3.
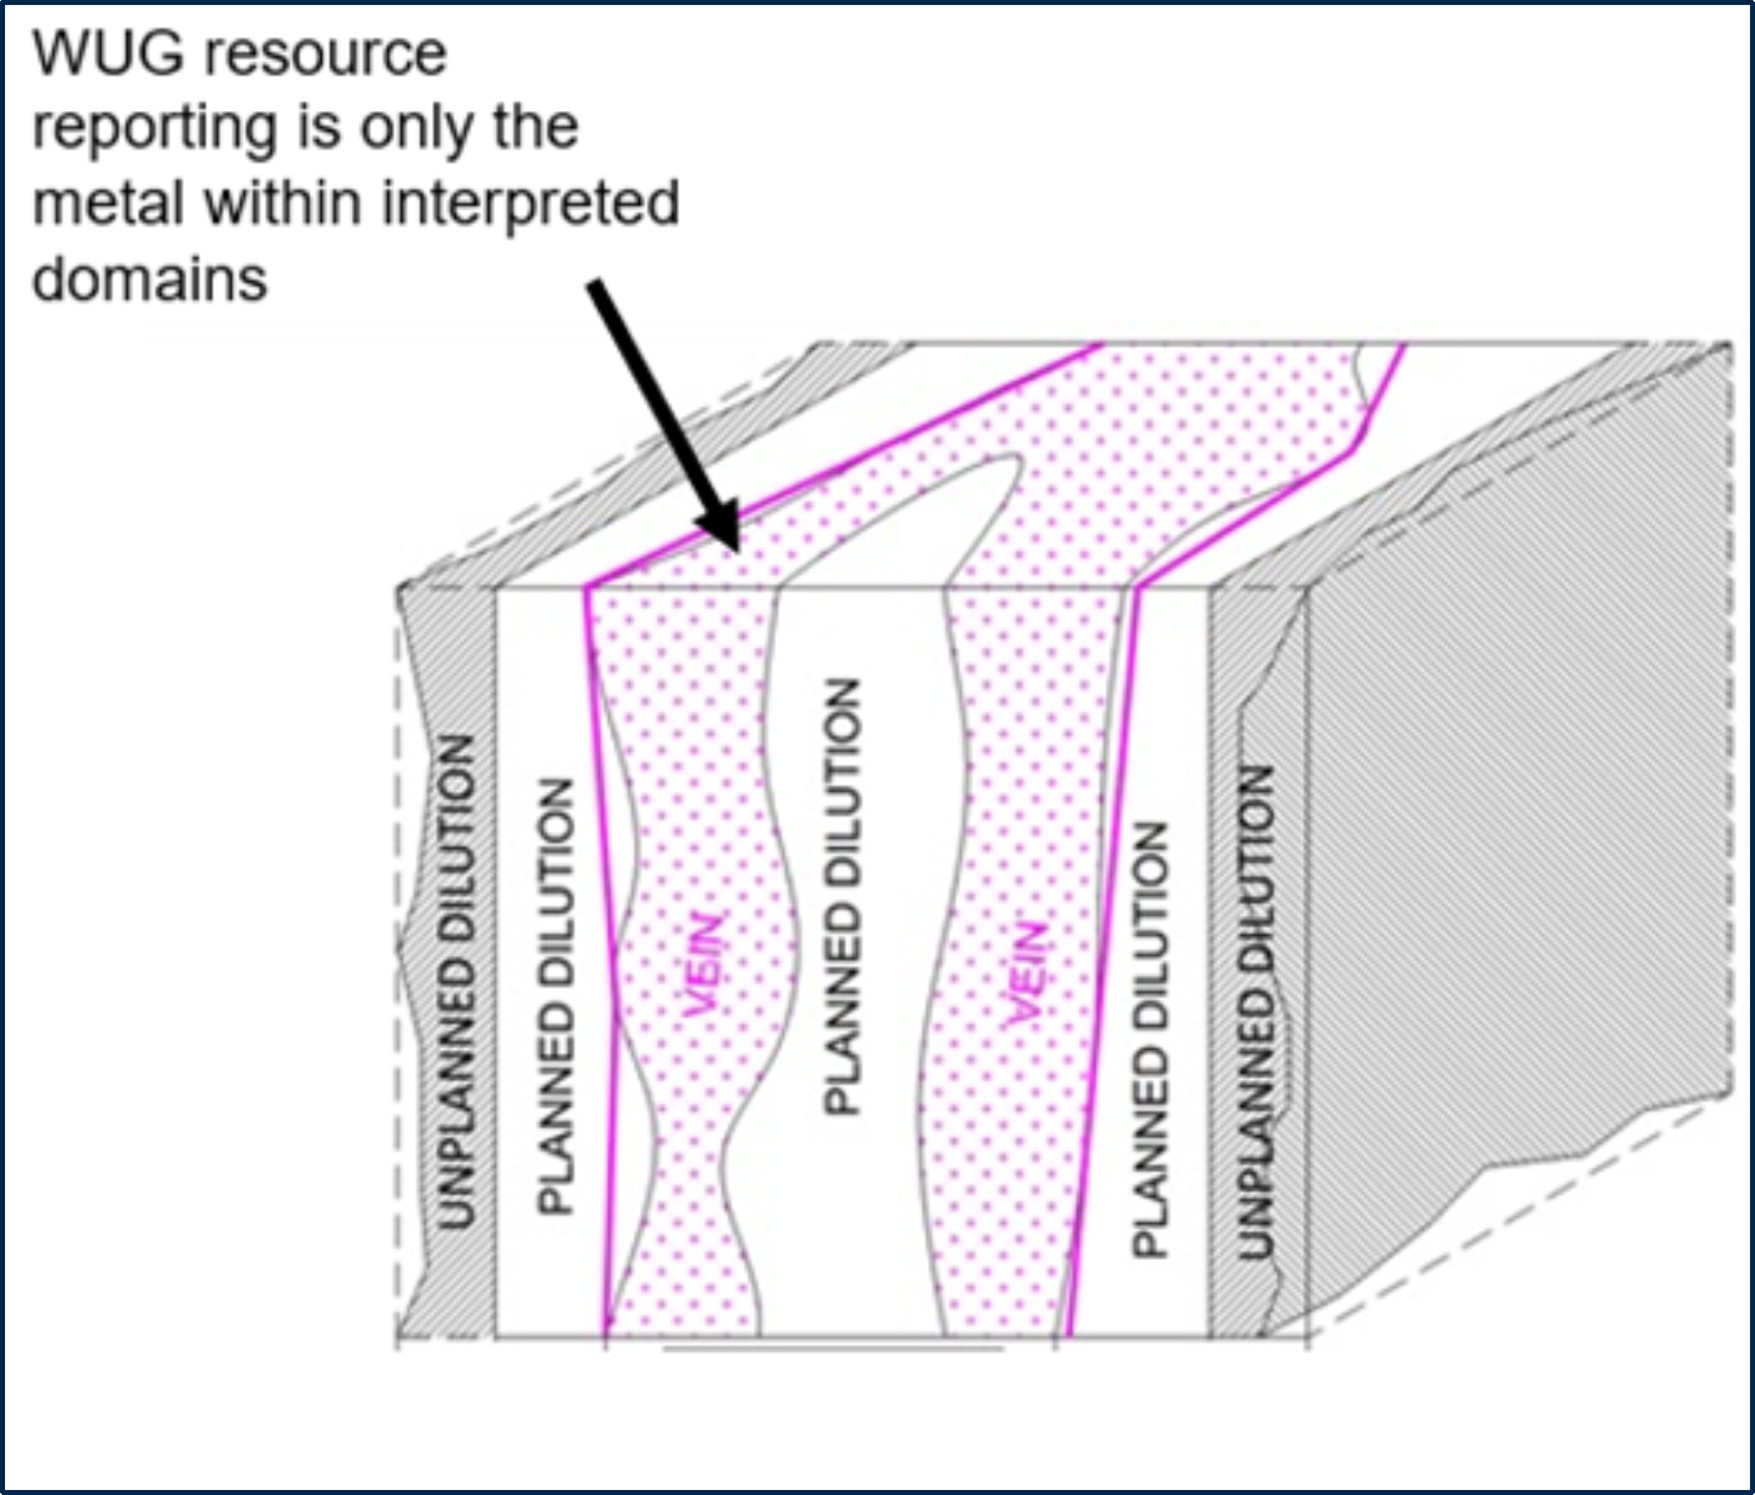
Figure 1-3: Resource Versus Reserve Example Schematic
1.5.1MUG Resource Estimate
Data available in June 2024 were included in the MUG Resource estimate. Estimations were performed in
individual geological domains using 1 m and 2 m length-weighted downhole composites. Estimation was
undertaken via Ordinary Kriging for Au and Ag, and inverse distance squared for As. Grades were
estimated into parent 10 mE x 10 mN x 10 mRL blocks with sub-blocking to 1 mE x 1 mN x 1 mRL.
Mineral Resources were reported within conceptual stope designs which were created using the Deswik®
Stope Optimiser (SO). Stope widths vary, depending on the thickness of the mineralization with a
minimum economic mining width of 1.3 m used. A maximum stope width of 15 m was used with a
minimum pillar width between stopes of 5 m. The Mineral Resource is reported within the SO shapes
above a 2.15 g/t cut-off grade, excluding dilution within SO shapes from the reporting of the resources. No
unclassified material contained within the SO shapes is reported. No mining recovery or dilution factors
were applied to the Mineral Resource estimate.
The Mineral Resources are classified as Indicated and Inferred Mineral Resources, based primarily on
drillhole spacing. Manual interpretations of Indicated and Inferred boundaries were applied to domains
material to Life of Mine (LoM) Plan.
1.5.2Martha Open Pit Resource Estimate
Drillhole data available in April 2024 was included in the MOP Resource estimate. The assay coverage for
gold and silver covers all core and RC drilling. However, for open pit channel sampling pertaining to the
mined volume, silver assay data is significantly sparser than for gold. Silver grade estimates are provided
for metallurgical considerations (carbon stripping and electro-winning) as well as for revenue estimation,
albeit silver is a minor contributor to revenue.
Grades were estimated into parent 10 mE x 10 mN x 10 mRL blocks with sub-blocking to 1.25 mE x
1.25 mN x 1.25 mRL, using 2 m and 3 m run-length composites. Grade estimation was completed in
Document ID: STU-063-REP-002-0 Released: 11th December 2024Page 18 of 244
OceanaGold Corporation | ||
NI 43-101 Technical Report – Waihi District Pre-feasibility Study, New Zealand | ||
Leapfrog EDGE® software, using Ordinary Kriging to produce estimates for gold. Resources are reported
at a cut-off grade of 0.50 g/t within an open pit design that is limited by infrastructural considerations. The
Mineral Resources are classified as Indicated and Inferred Mineral Resources, based primarily on
drillhole spacing.
1.5.3Gladstone Pit Resource Estimate
Drillhole data available in June 2024 were included in the GOP Resource estimate. The assay coverage
for gold, silver and arsenic covers all core drilling. Grades were estimated into parent 5 mE x 10 mN x
10 mRL blocks with sub-blocking to 2.5 mE x 2.5 mN x 2.5 mRL, using 3 m run-length composites. Grade
estimation was done in Vulcan software, using Ordinary Kriging to produce estimates for gold. Resources
are reported at a cut-off grade of 0.56 g/t within an open pit design. The Mineral Resources are classified
as Indicated and Inferred Mineral Resources, based primarily on drillhole spacing.
1.5.4Wharekirauponga Underground Resource
Drillhole data available in June 2024 was included in the WUG Resource estimate. The estimations were
performed in individual geological domains using 1 m length weighted downhole composites, via Ordinary
Kriging for Au and Ag, and inverse distance squared for other elements. Grades were estimated into
parent 4 mE x 16 mN x 16 mRL blocks with sub-blocking to 1 mE x 1 mN x 1 mRL.
Mineral Resources were reported within conceptual stope designs which were created using the Deswik®
Stope Optimiser. Stope widths vary, depending on the thickness of the mineralization with a minimum
mining width of 2 m used. A maximum stope width of 15 m was used, where no cemented rock fill of
stopes are proposed a minimum pillar width between stopes of 8 m was applied. The Mineral Resource is
reported within the Stope Optimiser shapes above a 2.10 g/t cut-off grade, excluding dilution within SO
shapes from the reporting of the resources. No unclassified material contained within the Stope Optimiser
shapes is reported. No mining recovery or dilution factors were applied to the Mineral Resource estimate.
The Mineral Resources are classified as Indicated and Inferred Mineral Resources, based primarily on
drillhole spacing and then manual interpretation of Indicated and Inferred boundaries are applied to
domains that comprise >90 % of system endowment within economic optimized stopes.
1.6Mineral Reserves Estimate
Mineral Reserves at Waihi comprise underground Resources. Permits are in place to extract the Martha
Mineral Reserve. Permits are required to extract the Wharekirauponga Mineral Reserves and
OceanaGold assumes these permits authorising the commencement of works to be issued at the end of
2025.
Mineral Reserves were classified in accordance with the 2014 CIM Definition standards. The Mineral
Reserve Statement, as of June 30, 2024, is presented in Table 1-2 . There are no Mineral Reserves for
MOP. Note the inclusion of modifying factors (dilution and recovery) to the Mineral Resources results in a
net increase in tonnes (due to the inclusion of dilution factors), a reduction in ounces (due to the inclusion
of recovery factors) and a reduction in grade (due to a combination of dilution and recovery factors).
Document ID: STU-063-REP-002-0 Released: 11th December 2024Page 19 of 244
OceanaGold Corporation | ||
NI 43-101 Technical Report – Waihi District Pre-feasibility Study, New Zealand | ||
Table 1-2: MUG and WUG Combined Mineral Reserves Estimate as of June 30, 2024
Reserve Area | Class | Tonnes (Mt) | Au (g/t) | Ag (g/t) | Au (Moz) | Ag (Moz) |
MUG | Proven | - | - | - | - | - |
Probable | 4.4 | 3.8 | 16.1 | 0.5 | 2.3 | |
Total MUG | 4.4 | 3.8 | 16.1 | 0.5 | 2.3 | |
WUG | Proven | - | - | - | - | - |
Probable | 4.1 | 9.2 | 16.1 | 1.2 | 2.1 | |
Total WUG | 4.1 | 9.2 | 16.1 | 1.2 | 2.1 | |
Total Mineral Reserve | 8.5 | 6.4 | 16.1 | 1.7 | 4.4 | |
Note:
The WUG Mineral Reserves estimate was reviewed and approved by, or is based on information prepared
by or under the supervision of, Euan Leslie, MAusIMM (CP), the Company’s Group Mining Engineer and a
qualified person under NI 43-101.
The MUG Mineral Reserves estimate was reviewed and approved by, or is based on information prepared
by or under the supervision of, David Townsend, MAusIMM (CP), the Company’s Mining Manager and a
qualified person under NI 43-101.
Mineral Reserves are reported based on OceanaGold’s mine design, mine plan, mine schedule and cash
flow model at a gold price of $1,750 /oz.
Tonnages include allowances for losses resulting from mining methods. Tonnages are rounded to the
nearest 100,000 tonnes.
Ounces are estimates of metal contained in the Mineral Reserves and do not include allowances for
processing losses. Ounces are rounded to the nearest hundred thousand ounces.
All figures have been rounded; totals may therefore not sum exactly.
Tonnage and grade measurements are in metric units. Gold ounces are reported as troy ounces and ”g/t”
represents grams per tonne.
1.6.1Martha Underground (MUG)
MUG has been in development and production since 2020 using a predominantly Avoca bottom-up
mining method. Mineral Reserves are based on similar mining methods, mining productivities employed
to date and with five main production areas delineated. A spacing of generally 18 m between levels is
used. Cemented rock fill (CRF) is used to backfill selected historical stopes.
The underground mine design process resulted in underground Mineral Reserves of 4.4 Mt (diluted) with
an average grade of 3.8 g/t Au. This estimate is based on a mine design cut-off grade of 3.0 g/t Au. The
modifying factors include a 50 % to 90 % mining recovery based on type of opening (stope, development,
etc.) to the designed wireframes in addition to a 0 % to 13 % unplanned dilution using zero grade for
dilution.
1.6.2Wharekirauponga Underground (WUG)
Based on the orientation, depth, and geotechnical characteristics of mineralization, transverse sublevel
open stoping (longhole) and modified Avoca methods are planned for WUG. Transverse open stopes will
be 15 m along strike and stope width will vary based on mineralization grade and geotechnical
considerations. A spacing of 20 m between levels is used. CRF will be used to backfill the primary stopes.
There will be an opportunity for some non-cemented waste rock to be used in selected stopes based on
Document ID: STU-063-REP-002-0 Released: 11th December 2024Page 20 of 244
OceanaGold Corporation | ||
NI 43-101 Technical Report – Waihi District Pre-feasibility Study, New Zealand | ||
the mining sequence. The CRF will have sufficient strength to allow for mining adjacent to backfilled
stopes.
The deposit has been divided into three production areas. One northern and two southern blocks
separated by a crown pillar at -60 mRL. The underground mine design process resulted in underground
mining Reserves of 4.1 Mt (diluted) with an average grade of 9.2 g/t Au.
This estimate is based on a mine design cut-off of 2.4 g/t Au. The numbers include an 80 % to 100 %
mining recovery based on type of opening (transverse, Avoca, development, etc.) to the designed
wireframes in addition to a 0 % to 20 % unplanned dilution using zero grade for dilution.
1.7Mining Method
1.7.1Geotechnical WUG
A geotechnical field characterization program has been undertaken to assess the expected rock quality.
This program included logging core, laboratory strength testing, in situ stress measurements and oriented
core logging of jointing. The results of this program have provided adequate quantity and quality of data
for prefeasibility-level design of the underground workings.
A geotechnical assessment of the orebody shape and ground conditions has determined that a
combination of longhole open stoping in wide areas and modified Avoca stoping in narrow areas are
appropriate mining methods. Stopes have been sized to maintain stability once mucked empty. Within the
wider areas, a primary/secondary extraction sequence with tight backfilling allows optimization of ore
recovery while maintaining ground stability. Primary stopes and selected secondary stopes will be
backfilled with cemented rockfill.
The design has been laid out using empirical design methods based on similar case histories. The
modelling results confirm that stopes and access drifts are predicted to remain stable during active
mining.
1.7.2Mining WUG
Stope optimization was completed on the resource model based on a level interval of 20 m high. In the
wider transverse stoping areas, the stope length was set to 15 m along strike and the maximum width
limited to 20 m, whereas in the narrower Avoca areas, stope length was based on geotechnical
considerations.
Within the transverse mining area, each stope has a 5 m x 5 m access located at the bottom of the stope.
Top accesses (also 5 m x 5 m) are designed to give access to stopes on the next level and to allow for
backfilling. The stopes are drilled from the top and rings are blasted from the end of a stope toward the
footwall access. The blasted material is mucked using tele-remote equipment. A primary/secondary
stoping sequence will be used. The stopes are connected to a level access located in waste material and
to the main ramp which located in the footwall. Each level access is connected to the ventilation system.
Ore will be mucked from the bottom stope access using 15 t loaders and loaded into 50 t trucks for
haulage to surface.
The underground mine production schedule is based on the productivity rates developed from a
combination of existing MUG benchmarking, first principles and benchmarking against similar projects
where applicable. The schedule was completed based on mining operations occurring 365 days/year,
Document ID: STU-063-REP-002-0 Released: 11th December 2024Page 21 of 244
OceanaGold Corporation | ||
NI 43-101 Technical Report – Waihi District Pre-feasibility Study, New Zealand | ||
7 days/week, with two 12 hour shifts each day. A production rate of approximately 2,200 tonnes per day is
targeted, with ramp-up to full production in mid to late 2033.
The commencement of surface works is planned for 2025, assuming all consents are received from
authorities. Underground portal development is scheduled to begin in late 2026. Portal development is
required before the decline access can begin. Material development ore is achieved in 2032 with first
production from the stopes scheduled to occur in 2033 and will last through to 2038 based on the current
Mineral Reserves (Table 1-3).
Table 1-3: WUG Mine Production Annual Mining Schedule
Year | Mineralized Tonnes (kt) | Au (g/t) | Ounces (koz) |
2031 | 3 | 5.5 | 1 |
2032 | 139 | 11.4 | 51 |
2033 | 620 | 10.1 | 201 |
2034 | 798 | 9.6 | 245 |
2035 | 799 | 10.7 | 276 |
2036 | 795 | 8.2 | 209 |
2037 | 662 | 7.8 | 165 |
2038 | 240 | 7.4 | 57 |
Total | 4,057 | 9.2 | 1,205 |
1.7.3Mining MUG
MUG is accessed via the existing Favona portal through the existing Trio and Correnso workings and
shares the ventilation development and shafts as well as the underground workshop, crib room and
dewatering systems.
Exploration drives were completed on 800 mRL and 920 mRL in 2018. Development of MUG commenced
in mid-2019. Development has focussed on ramp access for Edward, Empire, Rex and Royal mine areas,
footwall, fill, and ore drive development, ventilation and secondary egress connections, and drilling
platforms. Two portal breakthroughs have been completed in the southwestern corner of the Martha open
pit and are being used for ventilation and secondary egress purposes and dumping of underground waste
into the bottom of the pit.
The development strategy involves mining of declines for access to five main stoping blocks. Access
drives are mined to develop drilling and loading levels, generally intersecting the orebodies centrally.
Access drives are spaced generally at 14 m to 18 m vertically over the height of the mine. Ore drives will
be developed in both directions along strike from the access drives. Stockpiles are mined off the decline
and in levels for truck loading.
The key differences with recent operating practices involve the development of footwall drives, crosscuts
and pass systems in selected locations mainly confined to Edward, Empire east and west to backfill the
historical workings. Crosscut spacing is generally at 15 m spacing. Historical stopes are backfilled to
provide both regional and local stability.
Mining options available for MUG are limited because of the permit conditions, blasting and backfill
constraints. Modified Avoca mining was selected as the preferred mining method. MUG has been
1 The effective reporting date is 30 June 2024, therefore H1 has been removed from Table 1-4. The full
year’s Au production for MUG in 2024 is 48-52koz.
Document ID: STU-063-REP-002-0 Released: 11th December 2024Page 22 of 244
OceanaGold Corporation | ||
NI 43-101 Technical Report – Waihi District Pre-feasibility Study, New Zealand | ||
designed with a 14 m to 18 m level spacing, floor to floor primarily to limit blast vibration but this also
assists hanging wall and footwall stability.
Approximately 50 % of the Mineral Reserves will involve the extraction of remnant skins in the footwall or
hanging wall of previously mined (historical) stopes, or the extraction of both remnant skins. Historical
backfill may also be mined as this material may be above the cut-off grade. However, as it is currently
classified as Inferred Resource it is not included as Mineral Reserve.
Following operating practices and detailed studies over the last nine years, the following methods are
applied for the extraction of remnant areas, adjacent to historic workings:
•Modified Avoca method whereby the historic stope is backfilled with cemented fill prior to stoping
and the remnant skin is extracted by conventional modified Avoca using rockfill in a bottom-up
sequence that exposes the cemented fill
•Modified Avoca method adjacent to the collapsed historic stope where backfill with CRF is not
feasible and a stand off from the historic wall of 3.0 m is maintained with lower estimated
recoveries, higher dilution
•Remote, side ring method where the historic backfill is extracted together with remnant wall rock
in a top-down sequence with cemented backfill
•Transverse stoping method where the historic backfill is extracted together with remnant wall rock
in a top down or bottom-up sequence with cemented or rock backfill.
The side ring and transverse mining method for the extraction of remnant skins and historic backfill use
conventional drilling and remote loading methods. This method involves additional waste development
adjacent to the remnant stopes, which increases overall development quantities and mining costs. Permit
conditions and the mining method require all stopes and selected developments to be backfilled. The
current Mineral Reserves are shown in Table 1-4.
Table 1-4: MUG Mine Production Annual Mining Schedule
Year | Mineralized Tonnes (kt) | Au (g/t) | Ounces (koz) |
2024 (H2) | 275 | 2.98 | 261 |
2025 | 453 | 3.42 | 50 |
2026 | 493 | 3.48 | 55 |
2027 | 516 | 3.61 | 60 |
2028 | 503 | 3.71 | 60 |
2029 | 485 | 3.85 | 60 |
2030 | 472 | 3.96 | 60 |
2031 | 492 | 3.79 | 60 |
2032 | 356 | 5.20 | 60 |
2033 | 365 | 4.04 | 47 |
Total | 4,410 | 3.80 | 538 |
Document ID: STU-063-REP-002-0 Released: 11th December 2024Page 23 of 244
OceanaGold Corporation | ||
NI 43-101 Technical Report – Waihi District Pre-feasibility Study, New Zealand | ||
1.8Recovery Methods
The Waihi process flowsheet is illustrated in Figure 1-4, with a conventional process being used for gold
recovery. The processing plant has been operational since 1988, undergoing one major upgrade in 1999
to increase throughput capacity of open-pit mill feed, and one minor upgrade in 2006 to introduce
campaign treatment of underground ore. Its current throughput capacity is 1.25 million tonnes per annum
on open-pit mill feed and 0.66 million tonnes per annum on underground ore.
Considerable operating experience and metallurgical testwork data have been accumulated over the life-
of-mine, and this informs the development and selection of processing options for future orebodies.
Metallurgical testwork on MUG and WUG orebodies supports ongoing use of the existing flowsheet with
plant expansions to enable higher throughput rates. These expansions will be timed to align with the
development of WUG. Key elements of the expansions include, installation of an upstream jaw crusher,
replacement of the 1.2 MW ball mill with a 1.8 MW tower mill; refurbishment of the adsorption circuit; and
new pumps and pipework for delivery of tailings to TSF3. This will increase throughput capacity to 0.8
million tonnes per annum on underground ore.
Open-pit and underground ores would be treated on a campaign basis as required. This is due to
differences in ore hardness and gold liberation size, with open-pit ores softer than underground ores and
gold liberation occurring at a coarser grind size. This means that open-pit ores are treated at higher
throughput rates than underground ores and their target grind size is coarser. Further to this, metallurgical
testwork has confirmed that the existing P80 targets of 75 µm for open-pit ores and 53 µm for
underground ores will continue to deliver gold recoveries of +90 %.
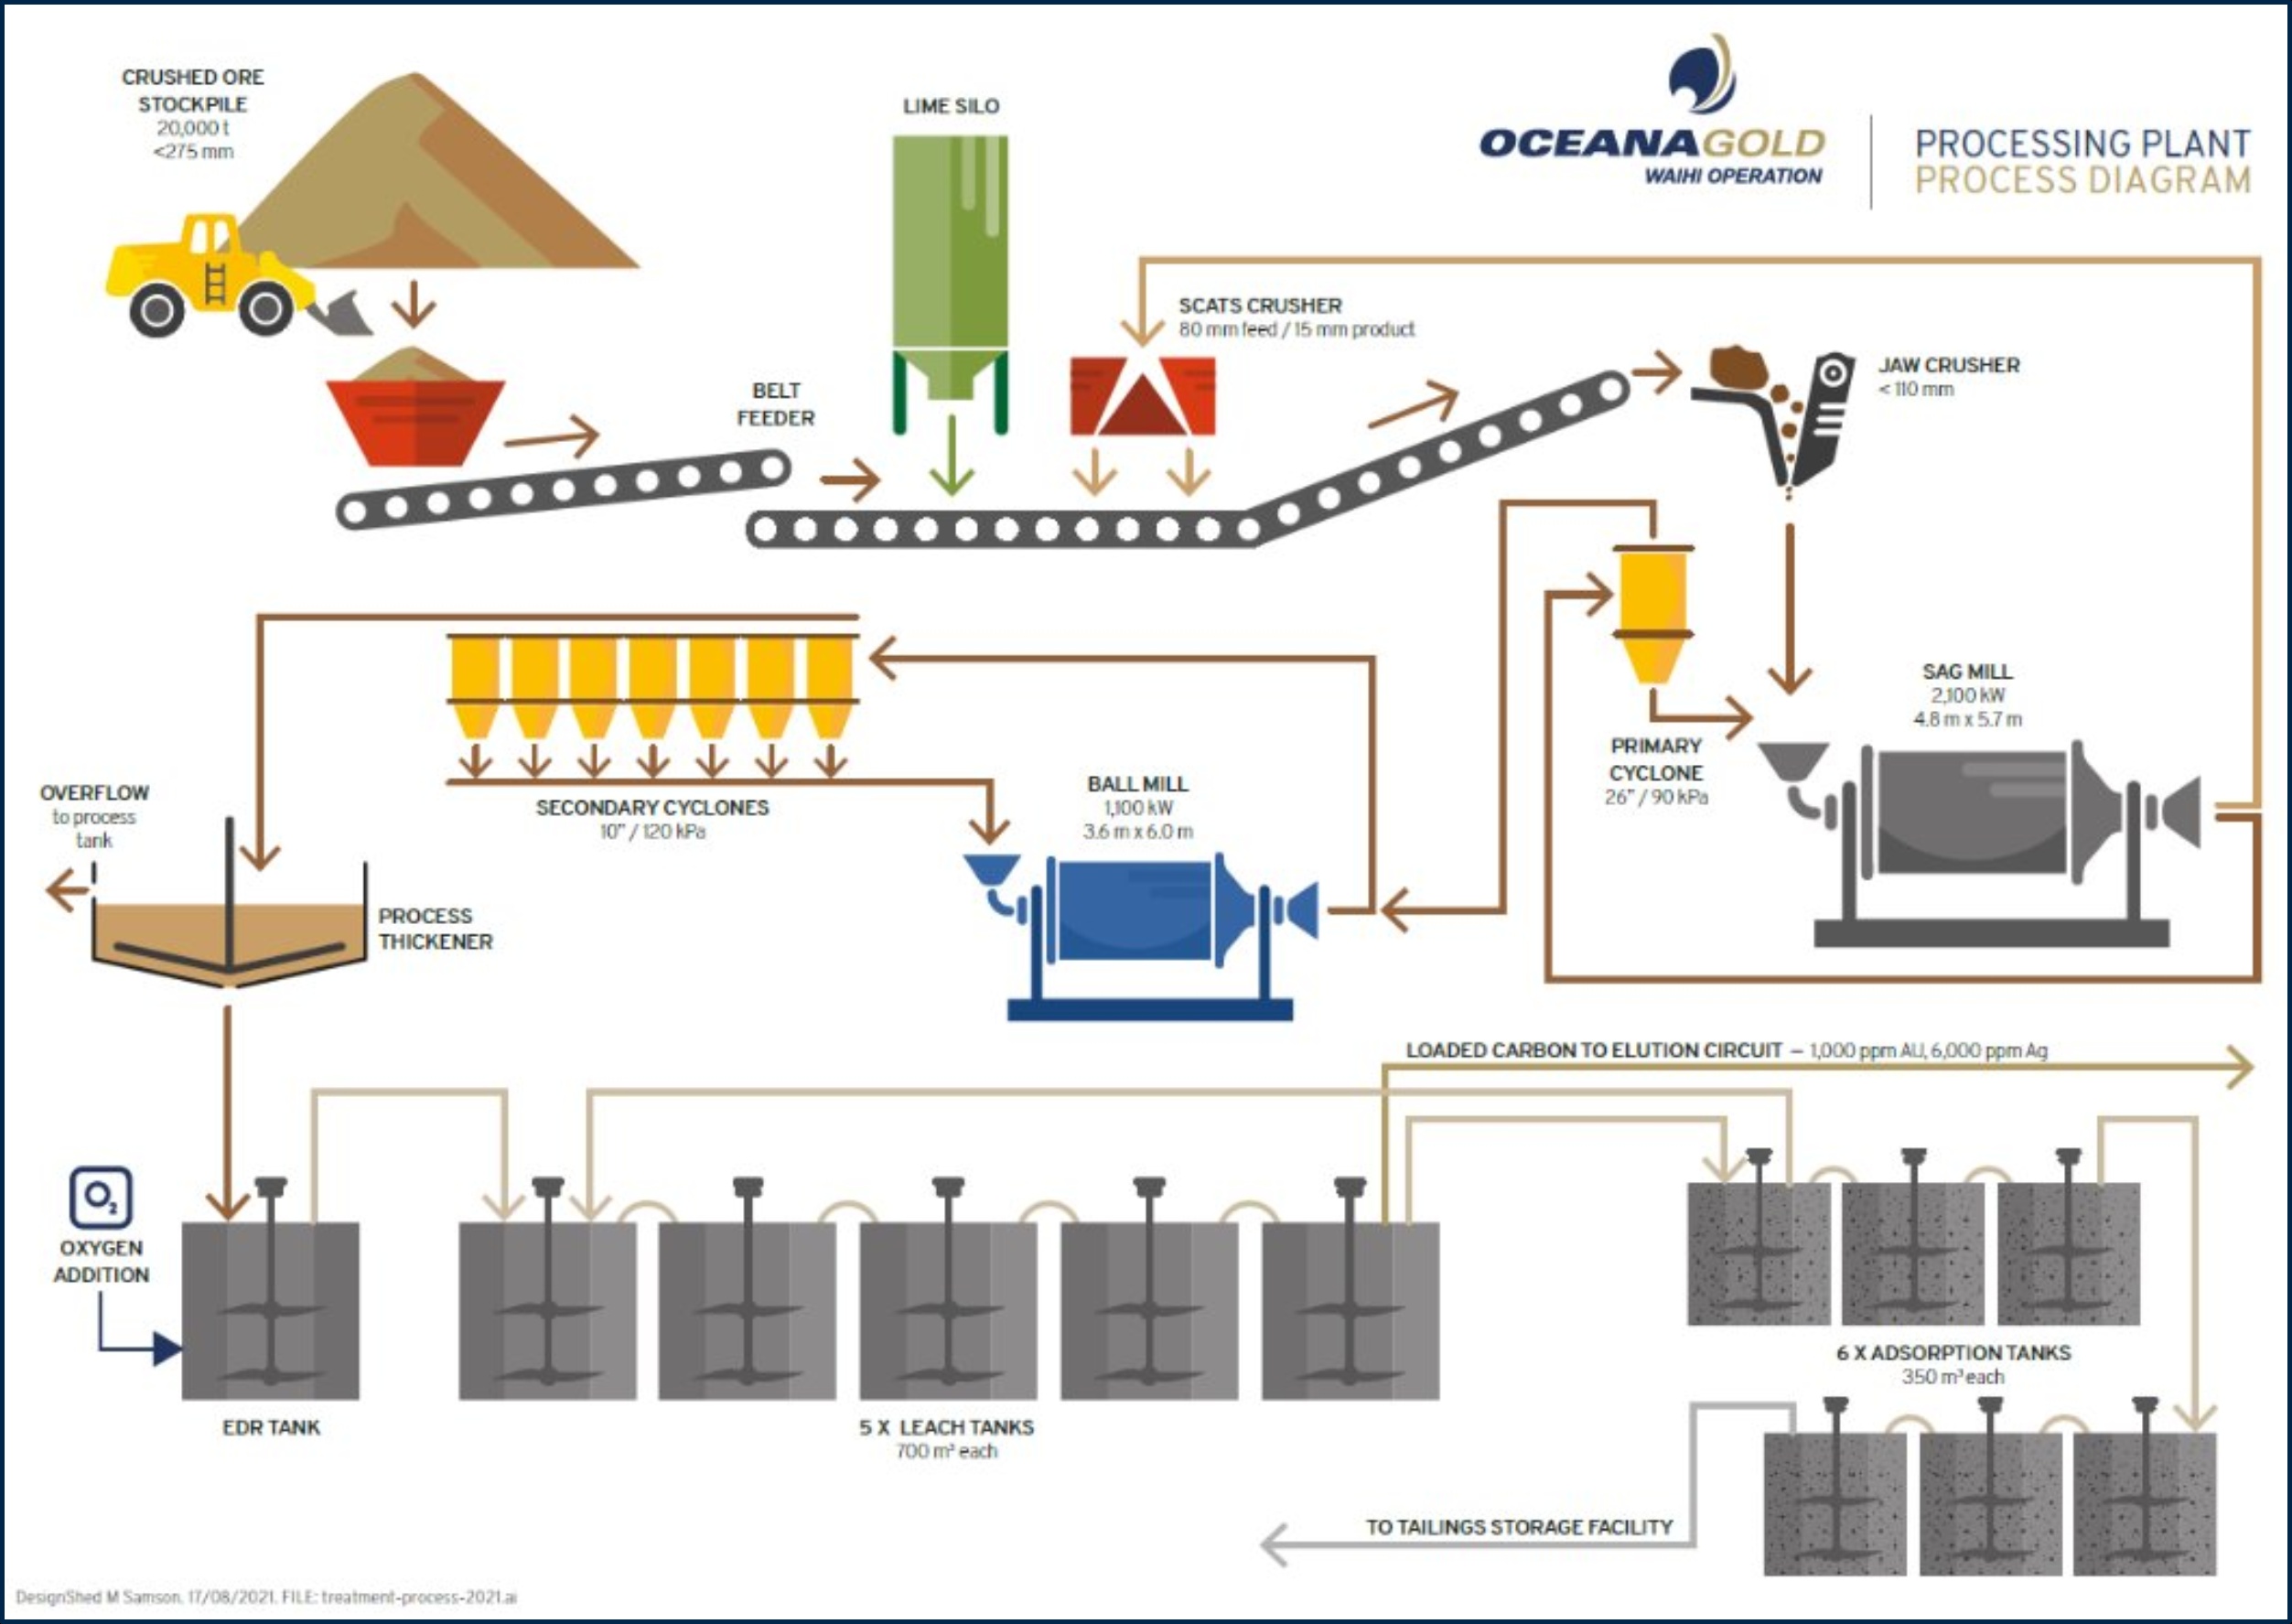
Figure 1-4: Waihi Process Flowsheet
Document ID: STU-063-REP-002-0 Released: 11th December 2024Page 24 of 244
OceanaGold Corporation | ||
NI 43-101 Technical Report – Waihi District Pre-feasibility Study, New Zealand | ||
1.9Project Infrastructure
The modern Waihi Operation has been in production since 1988 with site infrastructure developed to
support the MOP and MUG operations. MUG uses the existing process facilities, tailings storage, water
treatment facilities and other site infrastructure. The power supply is provided from the national grid and
supplied to the site substation at the processing plant area. The location of the existing and planned
infrastructure at Waihi is shown below in Figure 1-5.
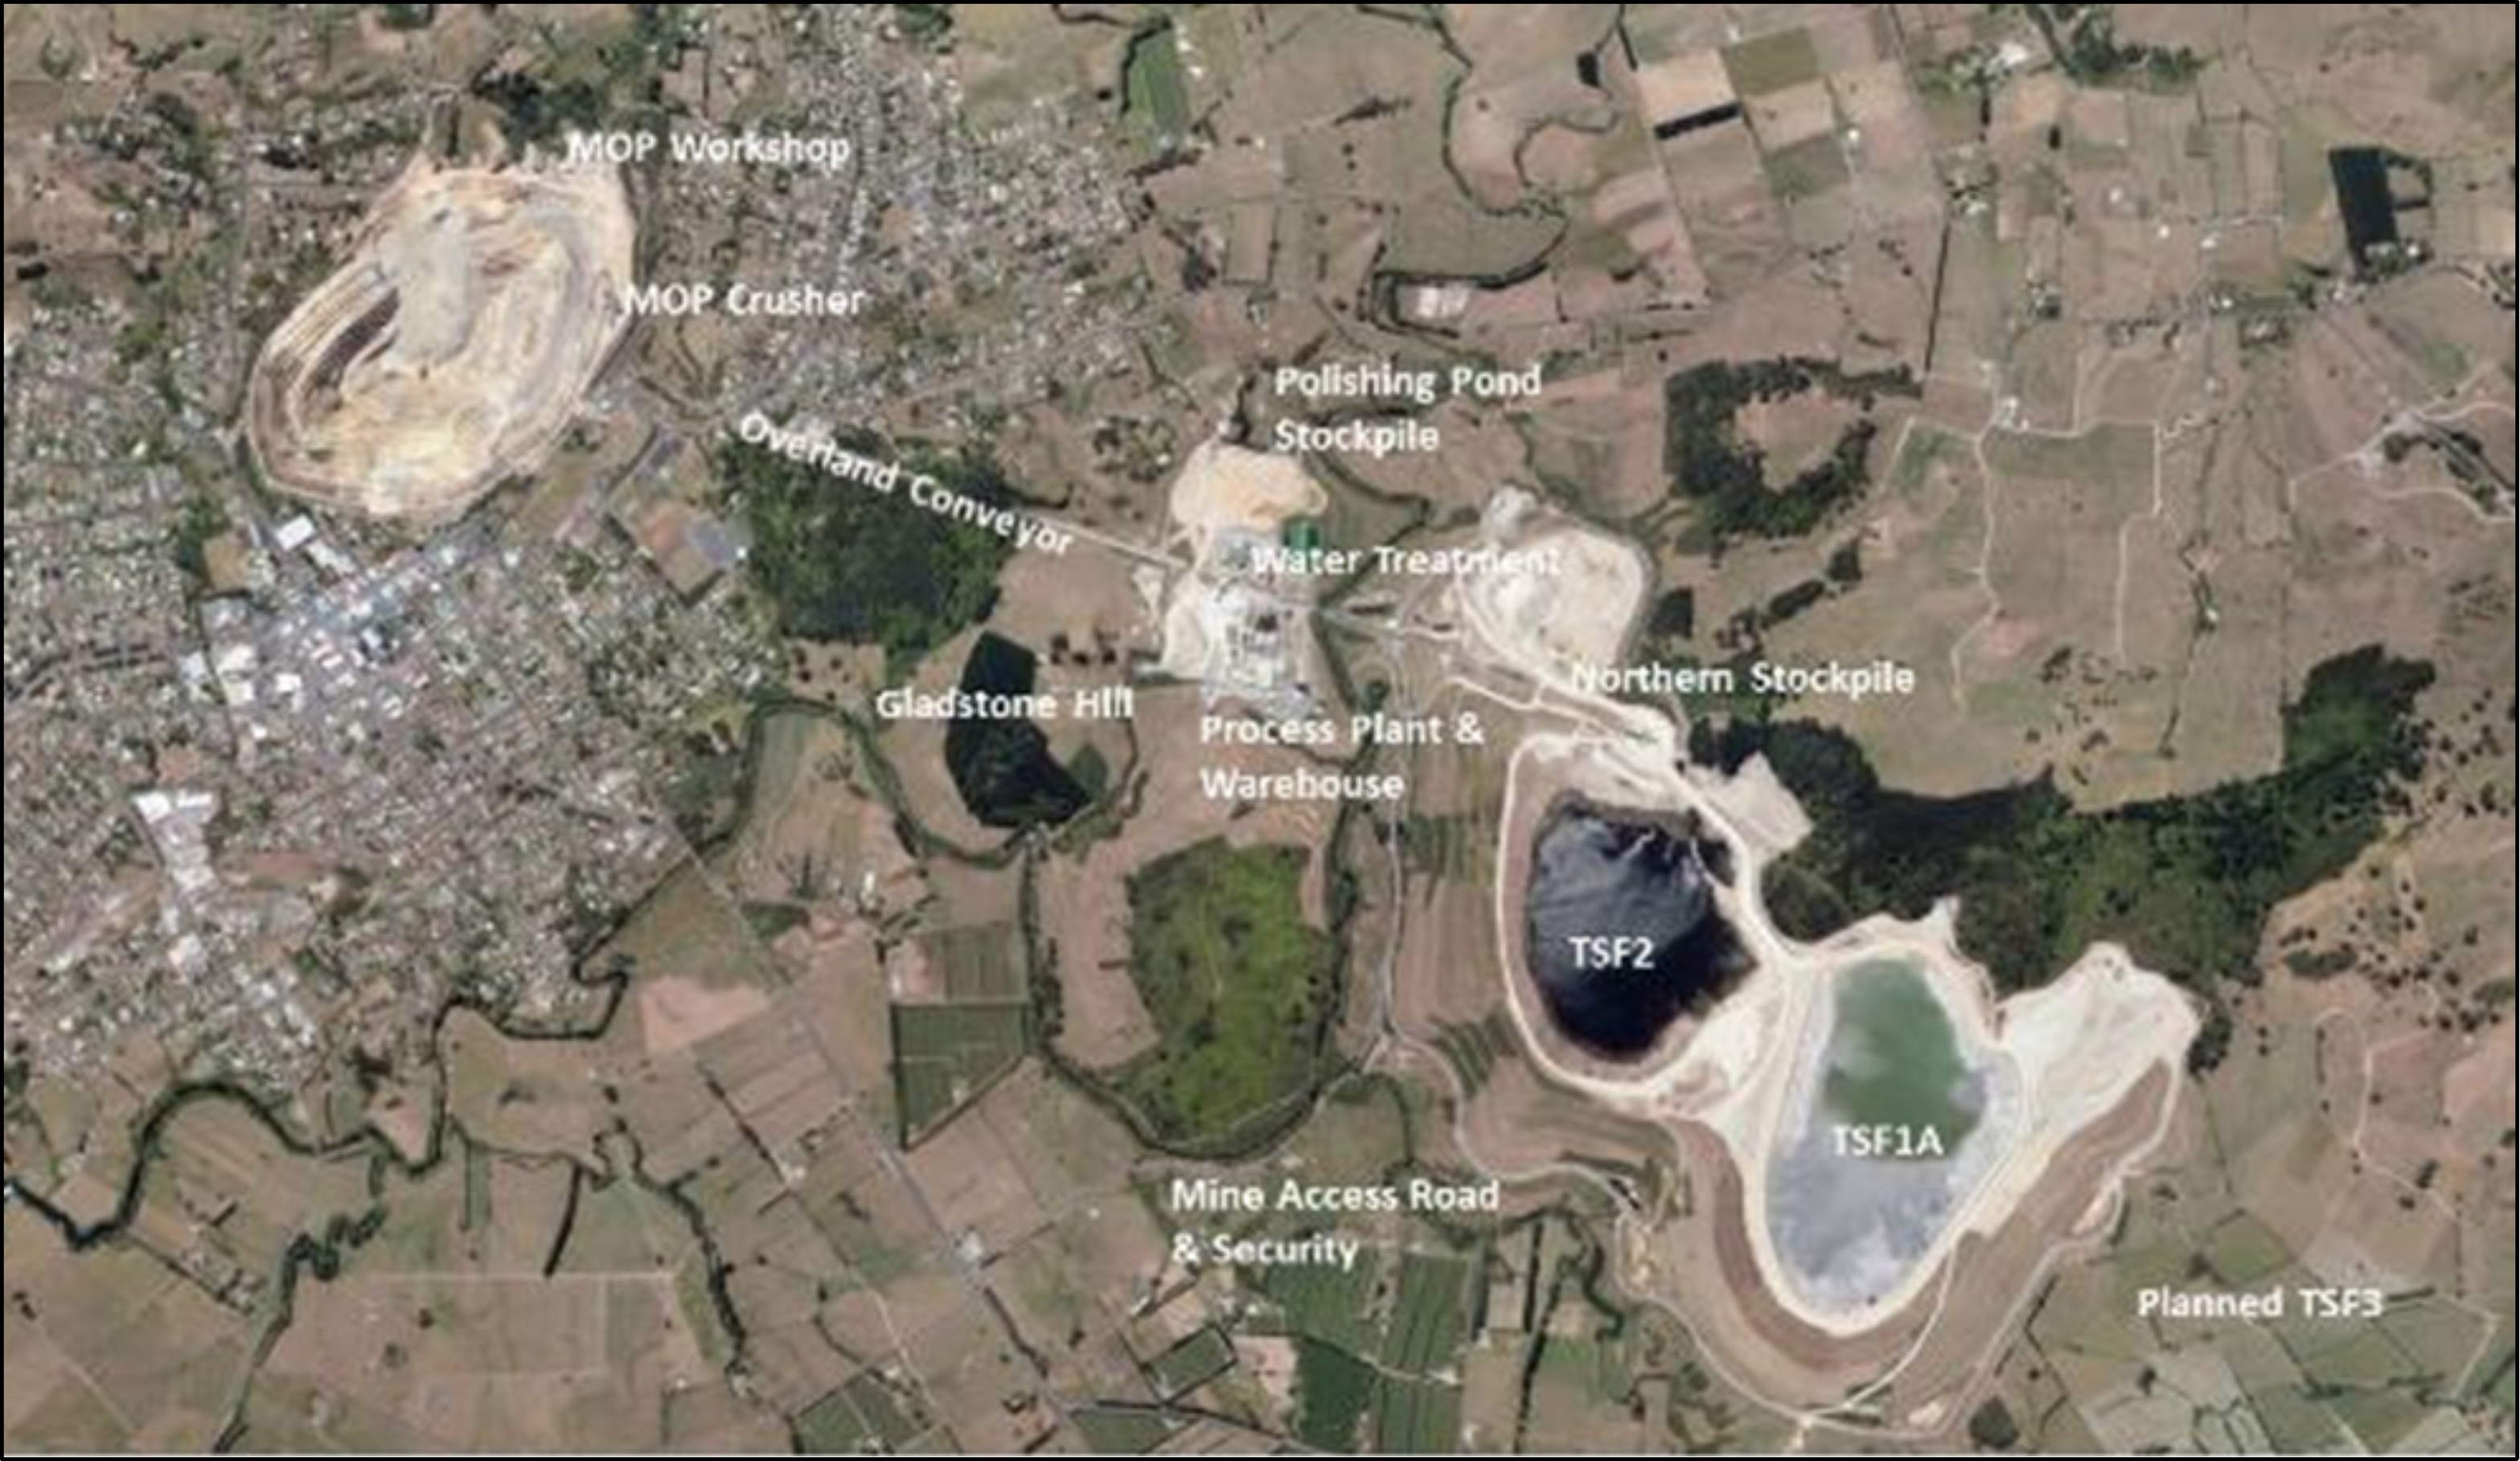
Figure 1-5: Waihi Existing and Planned Infrastructure
New surface facilities and infrastructure will be required for WUG, including tailings and waste rock
disposal, stockpiling, water treatment, and power supply, which are described below. The Willows,
adjacent to the Coromandel Forest Park, was purchased in 2021. This area will form the initial access to
WUG and service the mine. The area will include the following infrastructure:
•Temporary waste rock stack to accommodate development waste rock, all of which will be
returned underground as backfill
•Boxcut portal façade excavation
•Access road to portal
•Bulk earthworks and drainage
•Collection/silt ponds and associated pumping requirements
•Surface Facilities Area (SFA):
-Maintenance workshop
-Small general warehouse facility
Document ID: STU-063-REP-002-0 Released: 11th December 2024Page 25 of 244
OceanaGold Corporation | ||
NI 43-101 Technical Report – Waihi District Pre-feasibility Study, New Zealand | ||
-Electricity supply and substations
-Temporary/backup generators
-Air compressor
-Administration offices, security hut, crib room, clean/dirty room (change house), breezeway,
muster room and ablution facilities. (including sanitary system, potable and raw water tanks
and pumping system)
-Light vehicle car parking
-Tyre change facility
-Fuel facility
-Heavy vehicle and light vehicle washbay facility (including oily water separator).
•Explosives storage magazine
•Services Trench between the process plant and Willows (approximately 5 km) for water
treatment, potable water, mine dewatering, electrical supply, communications (fibre optic cables)
•Sealed road from the Willows Road to the mine plant area to minimise dust
•An upgrade of the existing SH 25 and Willows Road intersection
•Improvements to Willows Road (Signage and road markings)
•Noise bunding.
A new tailings storage facility, TSF3, is to be constructed adjacent to existing tailings facilities at Baxter
Road for the Waihi Operations, featuring downstream construction and associated stockpiles,
containment ponds and diversion drains.
A high voltage (HV) power upgrade is required from the Transpower Waikino grid exit point (GXP) in
Hauraki District Council (HDC) Road Reserve to a new 33 kV / 11 kV substation at the Waihi Baxter Road
operations.
1.10Environment Studies, Permitting and Social or Community Impact
1.10.1Permitting
Prospecting, Exploration and Mining Permits issued under the CMA provide exclusive rights to minerals
owned by the Crown, including gold and silver, and confer land access rights to those minerals
underground, but not at surface. All existing gold mining activities in Waihi including the current MUG, the
ore processing plant, existing tailings facilities and the inactive Martha open pit are within the existing MP
41808, which extends across an area of 1573 hectares, and are on land owned by OceanaGold or for
which requisite surface land access rights are in place.
WUG is held under MP 60541, which extends across an area of 3,272 hectares. WUG and the related
access tunnels and surface infrastructure are within land owned and administered by government
agencies including DOC, are within OceanaGold owned land, or have no surface expression for which
land access rights are required. Approvals processes are underway or planned to secure surface access
rights over government land as required for exploration, environmental management and monitoring
Document ID: STU-063-REP-002-0 Released: 11th December 2024Page 26 of 244
OceanaGold Corporation | ||
NI 43-101 Technical Report – Waihi District Pre-feasibility Study, New Zealand | ||
activities, ventilation rise structures, the proposed surface facilities site at Willows, the services trench
connecting Willows to the existing Waihi operations and the new tailings storage facility.
An access arrangement between DOC and OceanaGold has been granted to allow for existing
exploration activities (including surface drilling) to take place within MP 60541. Approvals processes are
underway or planned to secure land access for additional exploration sites and environmental
management and monitoring activities.
1.10.2Resource Consents
MP 41808 is within land characterized by urban and rural land use. In addition to land access and mineral
rights, OceanaGold holds a suite of resource consents from HDC and WRC authorising mining within the
MP 41808 area.
WUG, including ventilation stacks, the dual access tunnel and surface exploration activities are located on
land primarily owned by the Crown and administered by DOC as a conservation/forest park and zoned,
for resource consenting purposes, as conservation land. An area of council-owned unformed road reserve
(“paper road”), located within the forest park, is effectively zoned as conservation land.
Portal access to the mine together with other associated surface infrastructure and the Processing Plant
to Willows access tunnel are located on land variously owned by OceanaGold, private landowners and
various government agencies and characterized by urban and rural land use. Requirements for third party
surface access rights, in the form of access arrangements issued under the CMA or licences and
easements, are confined to government agencies, with processes underway or planned to secure these
as part of the WNP permitting and consenting work plan.
OceanaGold will require a suite of resource consents authorising mining of WUG and the construction
and operation of associated WNP infrastructure within the MP 60541 and MP 41808 areas. Processes are
underway or planned to secure these as part of the WNP permitting and consenting work plan.
Using the New Zealand government’s proposed Fast-track Approvals Bill, together with existing permitting
and consenting processes, OceanaGold assumes resource consent approval, and the other approvals as
required for the development of the WNP to commence, by the end of 2025.
1.10.3Environmental and Social Impact Studies
As part of existing consenting processes OceanaGold has commissioned independent experts to provide
a range of specialist environmental technical reports on the actual and potential effects on the
environment of allowing the activities associated with developing and operating the WNP. These effects
include:
•Biodiversity
•Water
•Landscape and Visual
•Transport
•Amenity
•Air Quality
•Rehabilitation and Closure.
Document ID: STU-063-REP-002-0 Released: 11th December 2024Page 27 of 244
OceanaGold Corporation | ||
NI 43-101 Technical Report – Waihi District Pre-feasibility Study, New Zealand | ||
The technical assessments conclude that the WNP’s effects are all able to be managed through the
application of the effects management hierarchy, to produce environmental, social and cultural outcomes
that are appropriate within the context of regulatory requirements, having regard to the scale and location
of the WNP activities. The WNP will manage the majority of its potential adverse effects through
prevention and mitigation, including the use of offsetting and compensation for residual effects on
terrestrial and aquatic biodiversity and habitat values, such that residual effects are minor. The WNP is
targeting a biodiversity net gain, as it incorporates measures proposed for the sole purpose of providing
benefits to the environment in recognition of the conservation purpose of the land above the proposed
WUG operations.
Community engagement commenced in 2020 and less formal engagement with iwi and regulators began
much earlier, around 2017. OceanaGold has well-established positive working relationships with key
stakeholders, and this has provided a solid platform for understanding and respecting diverse viewpoints.
Understanding the relationship between the business and the external context is crucial to effective
stakeholder engagement. Building trust through the sharing of information and perspectives helps
streamline decision making, based on mutual trust and shared values.
In 2022, an independent Social Impact Assessment (SIA) was completed for the WNP which follows the
International Association of Impact Assessment’s guidance for preparing an SIA. The WNP will have
positive social impacts in so far as it will contribute to:
•Job security and sustained livelihoods
•Social uplift from reduced local unemployment
•Social uplift from increased business activity and indirect employment opportunities.
The assessment identified the following effects that were assessed as having moderate to high negative
significance:
•Increased demand for accommodation.
•Change in sense of place for residents around the Willows area (location of the SFA for the WUG)
•Reduced amenity, as a result of increased traffic movements along Willows Road.
The Company recognises the special relationship that iwi have with land and water, and that this
relationship is important to spiritual and cultural wellbeing. The Company has had a consultation program
in place with iwi for many years covering the operating mine, the mineral exploration program and new
projects, and this is ongoing.
Of the nine groups that claim cultural interests and associations with the proposed WNP area, five have
agreed that they will provide a Cultural Impact Assessment for the WNP. The remaining four iwi groups
have either chosen not to complete an assessment, to defer to another iwi group they have recognized as
having authority over specific matters, or to not engage with the Company further.
1.11Capital and Operating Costs
All costs, unit costs and prices are in United States dollars unless otherwise noted.
Document ID: STU-063-REP-002-0 Released: 11th December 2024Page 28 of 244
OceanaGold Corporation | ||
NI 43-101 Technical Report – Waihi District Pre-feasibility Study, New Zealand | ||
1.11.1Capital Cost
Non-Sustaining (growth) capital is $556 million, including underground capitalized development linked
mainly to the development of WUG. The sustaining capital cost is $342 million, which is primarily for mine
development, surface infrastructure, underground mine equipment replacements associated with MUG
and site rehabilitation works. The total LoM capital cost is $897 million as summarized in Table 1-5.
Capital costs have been estimated with reference to actual experience in undertaking the same or similar
works at Waihi, quotations from suppliers and estimates provided by consultants with appropriate
expertise. The capital cost estimation is consistent with proposed development programs and ongoing
requirements and were undertaken to an appropriate level of estimation accuracy. It is likely that over the
life of the mine actual expenditures will vary, due to modifications, upgrades, introduction of new
technology and other unforeseen factors.
Table 1-5: Total Capital Cost Summary ($M)
Description | Non-Sustaining Capex | Sustaining Capex | Total |
WUG | 357.9 | 62.9 | 420.9 |
MUG | - | 102.1 | 102.1 |
Processing and Water Treatment | 92.8 | 8.4 | 101.2 |
TSF's | 44.4 | 80.5 | 124.9 |
Other Capital | 60.6 | 16.0 | 76.7 |
Rehabilitation | - | 71.6 | 71.6 |
Total | 555.8 | 341.6 | 897.4 |
1.11.2Operating Cost
The total life of mine operating cost (excluding capitalized operating cost) is $1,200 million. Operating
costs have been estimated with reference to actual operating experience at Waihi, supplier quotations,
estimates from consultants with appropriate expertise and otherwise estimated internally by appropriately
credentialled OceanaGold people. The operating cost estimates include allowance for performance
related improvement opportunities that have been identified.
The total operating cost unit rate of $141.8 /t processed are summarized in Table 1-6. A notional carbon
cost for a diesel equipped mine has been included in the operating cost estimate based on the New
Zealand climate change commission research report recommendations.
Document ID: STU-063-REP-002-0 Released: 11th December 2024Page 29 of 244
OceanaGold Corporation | ||
NI 43-101 Technical Report – Waihi District Pre-feasibility Study, New Zealand | ||
Table 1-6: LoM Operating Cost Summary ($M and $/t)
Description | $M | $/t Ore Mined |
UG Mining – MUG | 488.8 | 110.8 |
UG Mining – WUG | 264.4 | 65.2 |
Subtotal Mining | 753.2 | 89.0 |
$M | $/t Ore Processed | |
Processing | 222.7 | 26.3 |
G&A Costs | 191.0 | 22.6 |
Refining / Freight Costs | 5.6 | 0.7 |
Other - Carbon Costs and stockpile movements | 28.2 | 3.3 |
Total Operating Costs | 1,200.8 | 141.8 |
1.12Economic Analysis
All revenues, costs, prices and economic indices are in United States dollars unless otherwise noted.
Economic analysis is undertaken in real terms, i.e. constant 2024 dollars. No inflation or escalation
included.
The economic analysis covers the operating MUG, the planned WUG, and a mill processing 0.8 Mtpa of
underground ore. MUG and WUG are expected to produce 1.6 million ounces of payable gold over a
15 year mine life at a maximum rate of 253 koz Au per year during full WUG production years with a LoM
all-in sustaining cost (AISC) of $994 /oz.
The underground mines are expected to require sustaining capital of $342 million (including closure and
rehabilitation costs of $72 million) and a non-sustaining (growth) capital spend of $556 million over the
modelled life, for total capital expenditure of $897 million. At a constant $1,750 /oz gold price assumption,
the WNP generates pre-tax and after-tax NPV5.0% values of $259 million and $138 million, respectively.
OceanaGold has also estimated WNPs value using an alternative price assumption (refer to section
22.4.2) of a flat $2,400 /oz gold price over the life of the operation. At these prices and a 5 % discount rate
the project is estimated to produce a pre-tax and after-tax NPV value of $902 million and $621 million
respectively.
A summary of the model results for both the reserve case and the OceanaGold price case is presented in
Table 1-7. The project’s NPV is most sensitive to gold grade and price, followed by operating costs and
capital costs.
Document ID: STU-063-REP-002-0 Released: 11th December 2024Page 30 of 244
OceanaGold Corporation | ||
NI 43-101 Technical Report – Waihi District Pre-feasibility Study, New Zealand | ||
Figure 1-6 shows the annual AISC trend over the life of mine. The improvement in AISC is due to the
commencement of WUG and is primarily due to the improvement in grade. Over the WUG production life
(2033-2038) the AISC is $634 /oz.
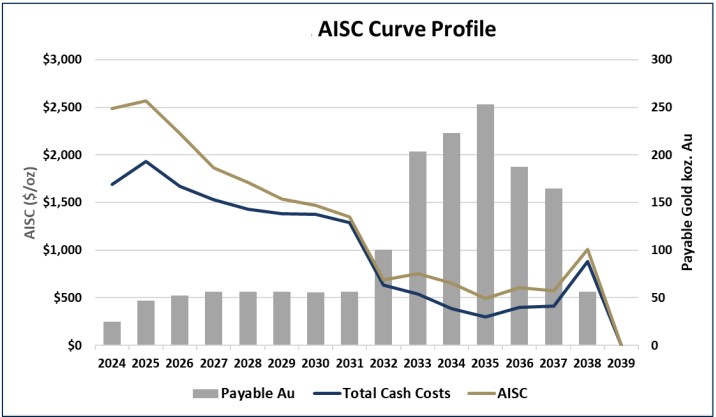
Figure 1-6. Annual AISC and Total Cost Curve Profile
Document ID: STU-063-REP-002-0 Released: 11th December 2024Page 31 of 244
OceanaGold Corporation | ||
NI 43-101 Technical Report – Waihi District Pre-feasibility Study, New Zealand | ||
Table 1-7: Indicative Economic Results
Description | Reserve Case Price | Alternative Price |
Market Prices | ||
Gold ($/oz) | 1,750 | 2,400 |
Payable Gold (koz) | 1,593 | 1,593 |
Revenue ($ 000’s) | ||
Gross Gold Revenue | 2,788,394 | 3,824,083 |
Silver By-Product Credit (at $20 /oz Ag) | 54,598 | 54,598 |
Total Gross Revenue | 2,842,992 | 3,878,682 |
Direct Operating Costs ($ 000’s) | ||
Mining | 753,223 | 753,223 |
Processing | 222,717 | 222,717 |
Site G&A | 191,026 | 191,026 |
Selling/Refining | 5,584 | 5,584 |
Other - Carbon Costs and stockpile movements | 28,232 | 28,232 |
Total Direct Operating Costs | 1,200,783 | 1,200,783 |
Non-Direct Operating Costs ($ 000’s) | ||
Royalties payable to Government | 58,213 | 98,343 |
Other Royalties | 38,582 | 52,742 |
Total Non-Direct Operating Costs | 96,795 | 151,085 |
Operating Cash Flow | 1,545,414 | 2,526,815 |
Taxes ($ 000’s) | ||
Income Tax | 217,309 | 482,089 |
Capital ($ 000’s) | ||
Sustaining Capital | 341,590 | 341,590 |
Non-Sustaining Capital | 555,807 | 555,807 |
Total Capital | 897,397 | 897,397 |
Metrics ($ 000’s) | ||
Pre-Tax Free Cash Flow | 648,017 | 1,629,418 |
After-Tax Free Cash Flow | 430,709 | 1,147,329 |
Pre-Tax NPV at 5% | 258,543 | 902,338 |
After-Tax NPV at 5% | 137,726 | 620,707 |
IRR | 9.2% | 24.0% |
Document ID: STU-063-REP-002-0 Released: 11th December 2024Page 32 of 244
OceanaGold Corporation | ||
NI 43-101 Technical Report – Waihi District Pre-feasibility Study, New Zealand | ||
1.12.1Sensitivity Analysis
Additional gold price sensitivity analyses were conducted with NPV5%, and IRR summarized in Table 1-8.
Table 1-8: Gold Price Sensitivity Analysis
NI 43-101 Sensitivity to Gold price | ||
After tax NPV5% ($M) | IRR (%) | |
Gold $1,100 | -387 | N/A |
Gold $1,500 | -52 | N/A |
Gold $1,750 | 138 | 9.2 % |
Gold $2,000 | 326 | 14.8 % |
Gold $2,400 | 621 | 24.0 % |
1.13Conclusions and Recommendations
1.13.1Geology and Mineral Resources
Resource growth and conversion at Wharekirauponga have achieved outstanding success since the initial
resource was announced at in February 2019. Indicated Resource endowment has grown from 0.41 Mt at
an average Au grade of 18 g/t containing 0.23 Moz of gold to 2.39 Mt at an average Au grade of 17.88 g/t
containing 1.37 Moz of gold. Inferred Resource growth has also replaced conversion over the same
period.
Forward budgeted work programmes continue to allocate resources to both resource conversion and
growth. This includes 5,000 meters of conversion drilling and 3,600 m of growth drilling planned and
budgeted in 2025. A broad development and drilling strategy is planned to extend WUG resources in a
south-westward direction from Drill Site 9, where consented drilling platforms enable testing of 500 m
extension to the EG vein corridor. Infill drilling in the northern and central area of WUG will target the
conversion of 400,000 oz of Inferred Au Resources to Indicated in 2025 and 2026.
In accordance with Wharekirauponga Mining Permit conditions OceanaGold will undertake resource
definition drilling to further delineate the extent of the resource which remains open in several aspects
along strike, in vertical extent, and with potential for identification of additional veins. Exploration will also
be conducted along the decline route to identify opportunity for incidental ore discovery and prevent
sterilisation. Given the potential of WUG, the Company expects to be investing in exploration for a
number of years.
Waihi 3D geological models are supported by diamond core drilling, logging, analytical testing and mine
mapping to reflect controls to mineralization. Geologic domains are used to guide gold grade
interpolation. Exploration drilling has been accompanied by an industry standard QA/QC program
showing good quality analytical results in terms of precision and accuracy. The results of the drilling,
sampling, analytical testing, core logging and geologic interpretation provide good support for an industry
standard resource estimation. Models are updated at least biannually, internally peer reviewed and
Document ID: STU-063-REP-002-0 Released: 11th December 2024Page 33 of 244
OceanaGold Corporation | ||
NI 43-101 Technical Report – Waihi District Pre-feasibility Study, New Zealand | ||
integrated into mine and exploration planning. Models have also been reviewed by independent, external
experts in 2024 in respect of WUG, MUG and MOP and in 2022 in respect of GOP.
Planning is advanced to increase drilling programme capabilities through available regulatory channels
including the government’s Fast-track Approvals Bill in which the WNP is a listed project. Grade control
drilling is scheduled ahead of production by means of fanned holes from underground drill stations.
1.13.2Mining and Reserves
Longhole stoping and modified Avoca are seen as the appropriate mining methods for the WUG deposit
geometry. The large stope sizes minimize cost and grades are not overly diluted. Mine planning work
considered revenue for Au and a cut-off grade (CoG) of 2.4 g/t Au was used. A detailed 3D mine design
was completed around economically minable areas above cutoff grade.
Tonnage and grades presented in the Reserve include dilution and recovery that are benchmarked to
similar operations. Productivities were generated from a combination of existing MUG benchmarking, first
principles and benchmarking against similar projects where applicable. Equipment used in this study is
standard equipment used worldwide with only standard package/automation features.
The underground access and ventilation system are appropriate for the extraction of the Reserve. A
production schedule was generated using Deswik® software targeting 2,200 tonnes per day.
Planned future work includes:
•Extensional and infill drilling to further optimise capital infrastructure requirements
•Continued geotechnical investigations for WUG including data collection for crown pillar area,
footwall development and EG Vein areas, investigative drillholes for each ventilation shaft and
numerical modelling for both crown and pillar stability
•Material balance analysis for TSF construction methodology and options
•Detailed mine equipment fleet and material handling optioneering
•Staged ventilation modelling and optimisation.
1.13.3Mineral Processing and Metallurgical Testing
Metallurgical testwork on WUG mineralization has been used to generate recovery and throughput
estimates for inclusion in the WNP’s technical and financial models. To support the testwork program, a
series of geometallurgical matrices were developed in conjunction with the geology team. These
geometallurgical matrices identified the main gold bearing domains and the minimum number of
composites to be targeted for metallurgical testwork.
Testwork results support ongoing use of the existing plant flowsheet with plant expansions to enable
higher throughput rates. Metallurgical testwork also confirmed that the existing P80 targets of 75 µm for
open-pit ores and 53 µm for underground ores will continue to deliver gold recoveries of +90 %.
Infill drilling presents the opportunity to continue test work on core samples to confirm metallurgical
assumptions for any new Reserves that are defined.
Document ID: STU-063-REP-002-0 Released: 11th December 2024Page 34 of 244
OceanaGold Corporation | ||
NI 43-101 Technical Report – Waihi District Pre-feasibility Study, New Zealand | ||
1.13.4Recovery Methods
Gold recovery at Waihi is achieved via a conventional process flowsheet. Current plant capacity is 1.25
million tonnes per annum on open-pit ore, and 0.66 million tonnes per annum on underground ore.
Capacity on underground ore needs to increase to 0.8 million tonnes per annum when WUG comes on
stream.
Metallurgical testwork supports ongoing use of the existing flowsheet with minor plant expansions to
enable the higher throughput rates. These expansions will be timed to align with the development of new
orebodies.
1.13.5Infrastructure
Detailed design and execution works is planned for the services trench to join existing processing plant to
Willows, the water treatment plant upgrade and bulk earthworks for the Willows area. Geotechnical
investigations will continue to enable portal boxcut and waste rock stack detailed design, and the first
1.5 km of decline to Ventilation Shaft No.1.
Supporting infrastructure is included in the capital estimates, including:
•Supporting surface infrastructure for the new WNP portals
•Building of a new tailings storage facility, TSF3
•The capacity of the water treatment plant (WTP) will be doubled to allow treatment of mine
dewatering from WUG and decant water off TSF3. This aligns with expected dewatering flows
and the newly consented discharge regime (Regime E).
A geotechnical borehole investigation will be conducted around the ridges to the east of the proposed
TSF3 and borrow pits to identify suitable materials for construction of the embankment and extent of
earthworks required. Additional infrastructure design works includes:
•Undertake drilling with man portable drill rig that does not require vegetation clearance to identify
near surface conditions favourable for construction of the ventilation shafts within the Coromandel
Forest Park
•Confirming the methodology for construction of ventilation shafts with specialist contractors
•Confirming the suitability of the proposed plant upgrade as metallurgical testwork and mine
schedule plans are updated
•Completion of detailed design for the 33 kV buried powerline upgrade from Waikino and the
Processing Plant and Willows substations.
1.13.6Economic Analysis
The current metal price environment is attractive. If the gold price remains above the $1,750 /oz
assumption for a long period, at a 5 % discounted rate there is the potential for WUG and MUG Reserves
and Resources estimates to be updated via an economic model applying a higher gold price assumption.
At $1,750 /oz the after tax NPV5% is $138 M. At $2,400 /oz the after tax NPV5% is $621 M.
Over the WUG production period (2033 to 2038) AISC is $634 /oz providing a robust economic outlook for
the project.
Document ID: STU-063-REP-002-0 Released: 11th December 2024Page 35 of 244
OceanaGold Corporation | ||
NI 43-101 Technical Report – Waihi District Pre-feasibility Study, New Zealand | ||
2INTRODUCTION
2.1Terms of Reference
This report provides Mineral Resource and Mineral Reserve Estimates, and a classification of Mineral
Resources and Reserves prepared in accordance with the Canadian Institute of Mining, Metallurgy and
Petroleum Standards on Mineral Resources and Reserves: Definitions and Guidelines 10 May 2014 (CIM,
2014). References in this report to “OceanaGold” include OceanaGold Corporation, Oceana Gold (New
Zealand) Limited, Waihi Gold Company Limited and their subsidiaries and associates, as the context
requires. This report has been prepared to satisfy OceanaGold obligations as a reporting issuer in
Canada.
2.2Qualified Persons
The Qualified Persons (QP) for the report are OceanaGold employees engaged for the preparation of this
Technical Report, as listed in Table 2-1.
Table 2-1: Qualified Persons Responsible for Preparing this Technical Report
QPs | Employer | Position | Technical Report Item(s) Contributed |
David Townsend (not Independent) Assoc. De.g (Surveying), GDip. (Mining), MAusIMM CP (Min), | OceanaGold | Mining Manager | Sections: 1.6 - 1.7, 1.13, 15.1, 15.3, 16.1 - 16.2, 16.4, 25.4, and 26 |
Leroy Crawford-Flett (not Independent) BCA/BSc. (Management/Geology), MPM, MAusIMM CP (Geo) | OceanaGold | Exploration and Geology Manager | Sections: 1.1 - 1.3, 1.5, 1.13, 2 – 4, 6 – 12, 14, 23 -24, 25.1 - 25.3, and 26 |
Kirsty Hollis (not Independent) BEng (Mineral Processing), FAusIMM CP (Met) | OceanaGold | Principal Metallurgist | Sections: 1.4, 1.8, 1.13, 2, 13, 17, 18.4, 18.5, 25.5, 25.6, and 26 |
Euan Leslie (not Independent) BEng. Mining (Hons), BCom. Economics, MAusIMM CP (Min), | OceanaGold | Group Mining Engineer | Sections: 1.6 - 1.7, 1.13, 2 - 3, 15.2 - 15.3, 16.3 - 16.4, 25.4, and 26 |
Trevor Maton (not Independent) ARSM, BSc. (Eng) Mining (Hons), MSc. Economics, MAusIMM CP (Min), | OceanaGold | Study Manager | Sections: 1.9 – 1.13, 2 - 3, 5, 18 – 22, 24, 25.6 - 25.8 and 26 |
2.3Details of Inspections
All the QPs are based permanently on-site in Waihi.
2.4Information Sources and References
This report is based in part on internal and external technical reports, previous studies, maps, published
government reports, company letters and memoranda, and public information as cited throughout this
report and listed in the References Section 27.
Document ID: STU-063-REP-002-0 Released: 11th December 2024Page 36 of 244
OceanaGold Corporation | ||
NI 43-101 Technical Report – Waihi District Pre-feasibility Study, New Zealand | ||
2.5Effective Dates
The effective date of this Technical Report is 30 June 2024.
2.6Units of Measure
The metric system has been used throughout this report except for contained metal which is expressed in
troy ounces. Tonnes are metric of 1,000 kg, or 2,204.6 lb. All currency is in United States dollars ($)
unless otherwise stated.
Document ID: STU-063-REP-002-0 Released: 11th December 2024Page 37 of 244
OceanaGold Corporation | ||
NI 43-101 Technical Report – Waihi District Pre-feasibility Study, New Zealand | ||
3RELIANCE ON OTHER EXPERTS
The Authors used their experience to determine if the information from previous reports was suitable for
inclusion in this technical report and adjusted information that required amending. This report includes
technical information, which required subsequent calculations to derive subtotals, totals, and weighted
averages. Such calculations inherently involve a degree of rounding and consequently introduce a margin
of error. Where these occur, the Authors do not consider them to be material.
The Authors have relied upon memos from:
•Alison Paul, Senior Vice President Legal and Public Affairs, OceanaGold, issued on 29 November
2024, for information regarding the legal, political, social and tax matters, permitting process,
surface land ownership/agreements, as well as the mineral titles for the Waihi District
•Mark Burroughs, Superintendent Environment, OceanaGold, issued on 21 November 2024, for
information on the Favona Mining Permit and the Wharekirauponga Resource Consent, including
environmental impacts and controls covering biodiversity, landscape and visual, transport,
amenity, air quality, rehabilitation, closure and bonds.
Document ID: STU-063-REP-002-0 Released: 11th December 2024Page 38 of 244
OceanaGold Corporation | ||
NI 43-101 Technical Report – Waihi District Pre-feasibility Study, New Zealand | ||
4PROPERTY DESCRIPTION AND LOCATION
4.1Property Location
The Waihi Operation is located within the small township of Waihi, 142 km southeast of Auckland, in the
North Island of New Zealand (Figure 4-1). The geographic centre of the mine is at 37° 22’ 49” S latitude
and 175° 54’ 08” E longitude. Waihi is located at the foot of the Coromandel Peninsula and is accessed by
the State Highway 2 dual carriageway. Martha Underground (MUG), Martha Open Pit (MOP) and
Gladstone Open Pit (GOP) Resources are within the Waihi town and within Mining Permit MP 41808
(Figure 4-2). The Wharekirauponga Underground (WUG) is located approximately 10 km north of Waihi
within Mining Permit MP 60541 (Figure 4-2).
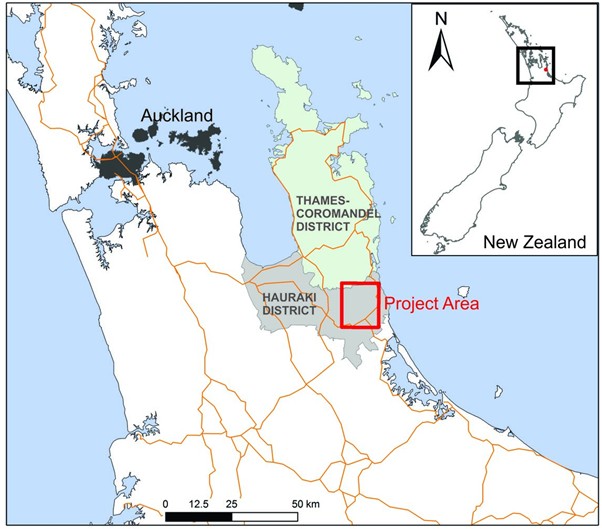
Figure 4-1: Map Showing the Location of the Waihi Operation
Document ID: STU-063-REP-002-0 Released: 11th December 2024Page 39 of 244
OceanaGold Corporation | ||
NI 43-101 Technical Report – Waihi District Pre-feasibility Study, New Zealand | ||
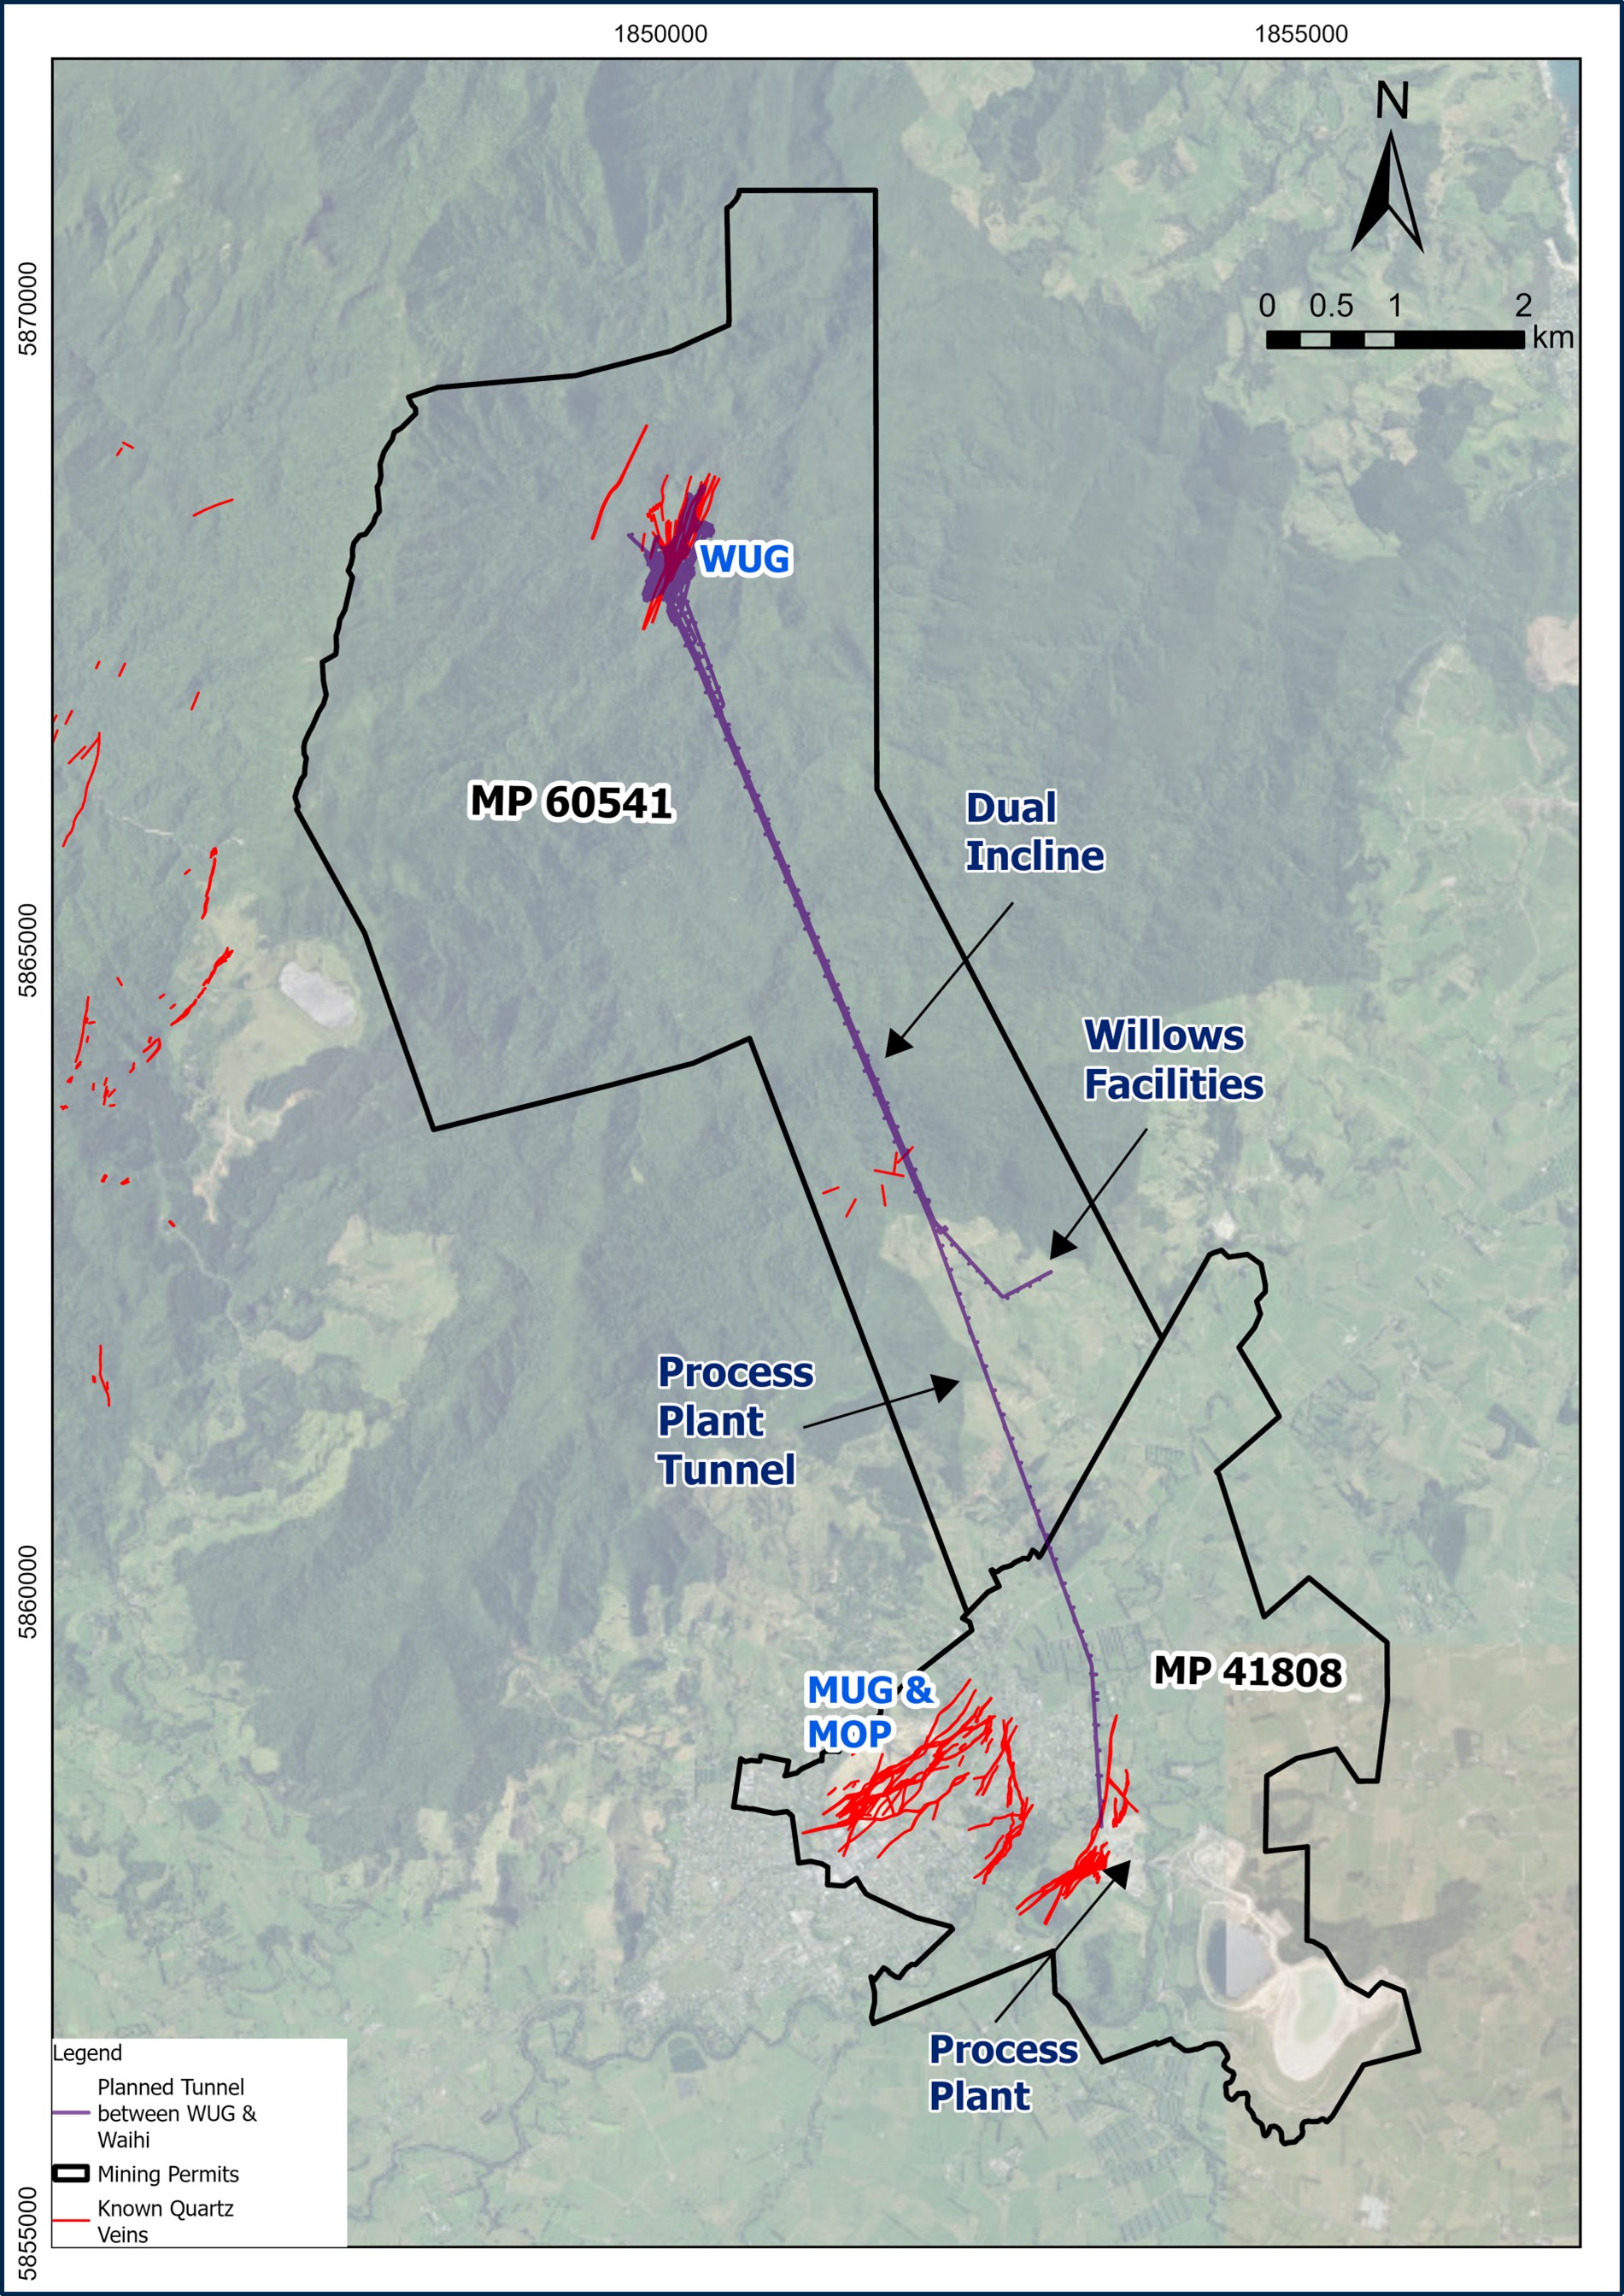
Source: OceanaGold GIS database, LINZ online GIS data service and New Zealand Petroleum and
Minerals Data Service
Figure 4-2: Location of the Waihi Operations and WUG Area,
Declines and Tunnels, Willows Facilities, and Mining Permits
4.2Property Ownership and Access Arrangements
4.2.1Martha Open Pit (MOP), Martha Underground (MUG) and Gladstone Open Pit (GOP)
The Waihi Operation is owned and administered by Oceana Gold (New Zealand) Limited and Waihi Gold
Company Limited, which are wholly owned subsidiaries of OceanaGold Corporation (OceanaGold).
References in this document to OceanaGold refer to the parent company together with its subsidiaries.
The locations of MUG, MOP and GOP are illustrated in Figure 4-3.
All gold mining activities in Waihi including the current underground mining operation, the processing
plant, tailings facility and the inactive MOP are within the existing MP 41808. The land on which these
activities take place is owned by various stakeholders including OceanaGold. In accordance with the
Document ID: STU-063-REP-002-0 Released: 11th December 2024Page 40 of 244
OceanaGold Corporation | ||
NI 43-101 Technical Report – Waihi District Pre-feasibility Study, New Zealand | ||
requirements of the CMA, where mining activities involve surface disturbance on land not owned by
OceanaGold an access arrangement with the landowner is required.
The MUG Project underlies land owned by various proprietors including the Crown (administered by Land
Information New Zealand (LINZ)), DOC, the HDC and various private landowners. The portal to MUG is
on land owned by OceanaGold which is accessed adjacent to the processing plant and water treatment
plant.
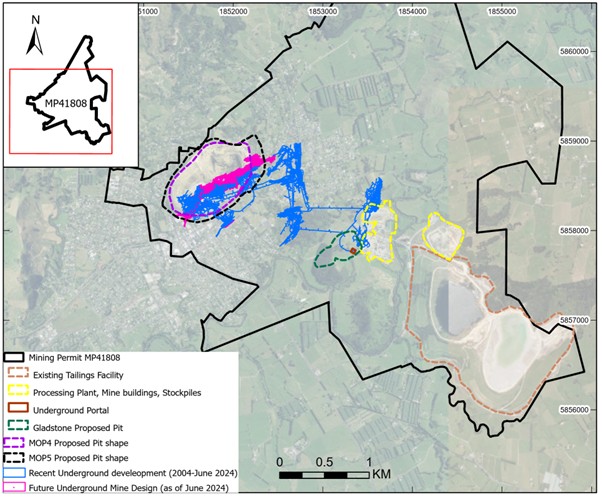
Source: OceanaGold GIS database and LINZ online GIS database
Figure 4-3: Location of the Projects within the Favona Mining Permit (NZTM grid)
Majority of the land covering MOP is owned by the Crown and administered by LINZ. There are two
parcels adjacent to the MOP that are administered for the Crown by DOC. OceanaGold has entered into
an access arrangement with LINZ and a separate access arrangement with DOC providing for ongoing
formal entry on the various publicly owned land parcels for CMA purposes.
Land within the mining permit that hosts the conveyor belt corridor, the water treatment plant (and an
associated pipeline for the discharge of the treated water into the Ohinemuri River), the process plant and
the tailings storage facilities, is all owned by OceanaGold except for one parcel where the conveyor belt
corridor runs through land adjoining the Union Hill area, which is in the name of the Commissioner of
Crown Lands administered by LINZ, and portions of public roads, road reserve and river reserve.
Document ID: STU-063-REP-002-0 Released: 11th December 2024Page 41 of 244
OceanaGold Corporation | ||
NI 43-101 Technical Report – Waihi District Pre-feasibility Study, New Zealand | ||
OceanaGold has entered into an access arrangement with LINZ providing for ongoing formal entry on the
conveyor belt corridor for CMA purposes. GOP and MOP occur on land owned by OceanaGold and
government agencies. Additional access arrangements will be required for the Martha Open Pit Phase 5
(MOP5).
The MUG Project requires mining beneath privately owned land, for which no access arrangements are
required but resource consents remain a requirement. Resource consents currently in place set out a
process (including arbitration) for addressing certain impacts on owners of land above stopes and
development drives. For MUG, public road access is provided to the OceanaGold underground amenities
and processing plant site via Baxter Road and to the open pit mine by Seddon Street.
4.2.2WUG and WNP
WUG is located within Mining Permit (MP 60541), on land owned by the Crown and administered by DOC
as a conservation/forest park. An access arrangement between DOC and OceanaGold has been made to
allow for exploration activities (including surface drilling) to take place within MP 60541. Known
environmental liabilities are managed through stipulated conditions in the DOC access arrangement and
Regional and District Council Consents including conditions that protect the conservation (biodiversity,
heritage and amenity) values of the land.
An area of council-owned unformed road reserve, located within the forest park, is subject to an existing
access arrangement authorising surface exploration activities, field studies and the location of ventilation
stacks (subject to conditions).
Portal access to WUG together with other associated surface infrastructure, including the services trench
and the proposed Processing Plant to Willows access tunnel are located on land variously owned by
OceanaGold, private landowners and various government agencies. Identified requirements for third party
surface access rights are confined to government agencies and are expected to take the form of access
arrangements, licences and/or easements already in place or for which processes are planned or
underway.
The Waihi North Project (WNP) includes WUG, access tunnels from a box cut portal at Willows to WUG,
Processing Plant to Willows access tunnel, surface facilities and infrastructure at Willows, high voltage
(HV) power upgrade, processing and water treatment plant upgrades, Martha Open Pit Stage 4 (MOP4)
infrastructure upgrade and new tailings storage facility (TSF3).
Document ID: STU-063-REP-002-0 Released: 11th December 2024Page 42 of 244
OceanaGold Corporation | ||
NI 43-101 Technical Report – Waihi District Pre-feasibility Study, New Zealand | ||
5ACCESSIBILITY, CLIMATE, PHYSIOGRAPHY, LOCAL
RESOURCES, AND INFRASTRUCTURE
5.1Accessibility
The Waihi property is easily accessible on paved roads and highways from State Highway 2 to the mine
entrance on Baxter Road, located 1 km south of Waihi, New Zealand. The major international airport at
Auckland, is a 90-minute drive from the mine.
5.2Climate and Physiography
The climate is temperate. Mean temperatures range from 8 °C in the South Island to 16 °C in the North
Island. January and February are the warmest months, July the coldest. New Zealand does not have a
large temperature range, but the weather can change rapidly and unexpectedly. Winds in New Zealand
are predominantly from the West and South-West, in winter, when the climate is dominated by regular
depressions. In summer, winds are more variable with a northerly predominance associated with the
regular large anti cyclones which cover all the country.
5.3Local Resources and Infrastructure
Local resources (labour force, manufacturing, supplies, housing, utilities, emergency services, etc.) and
infrastructure are in place and are widely utilized at Waihi. Numerous small communities exist around the
Waihi operations with populations ranging from 700 to 10,000 people. Power is available in the area via
an existing 33 kV transmission grid. Surrounding nearby land use is dominantly for agriculture,
horticulture, and timber.
5.4Physiography
The Waihi township is at the foot of the Coromandel Peninsula, to the west are the hills of the Kaimai
Ranges. In the Waihi region:
•Earthquakes are common, though usually not severe, averaging 3,000 per year. Mostly less than
three on the Richter scale
•Volcanic activity is most common on the central North Island Volcanic Plateau approximately
200 km to 300 km from Waihi
•Tsunamis would not have any direct impact on Waihi
•Droughts are not regular and occur less frequently over much of the North Island between
January and April
•Flooding is the most regular natural hazard.
5.5Mining Area Infrastructure
There are large industrial centres near the mine. Equipment and sources of logistical and professional
expertise can be obtained from the major cities of Hamilton, Tauranga, and Auckland which are within
two-hour travel of the mine. Multiple contractors provide skilled workers for the operation. There is
adequate labour for operations.
Document ID: STU-063-REP-002-0 Released: 11th December 2024Page 43 of 244
OceanaGold Corporation | ||
NI 43-101 Technical Report – Waihi District Pre-feasibility Study, New Zealand | ||
6HISTORY
6.1Waihi
The town of Waihi became established when the original Martha Mine opened as an underground
operation in 1879. The mine was productive, producing approximately 1,056 tonnes of gold-silver bullion
from about 12 million tonnes of ore by 1952. The historic mine extracted five main sub-parallel lodes
together with numerous branch and cross lodes. Early stoping employed the cut and fill method, but this
was phased out and largely replaced after 1914 by the shrink stoping method. Stopes were generally not
backfilled after 1914 but left open. The workings reached a total depth of 600 m from surface on 16 levels.
Seven main shafts were used to access miners and supplies underground, and numerous other shafts
were developed for ventilation and exploration. In 1894, the Waihi Gold Mining Company adopted the
cyanide process for gold extraction, which was first trialled in the world at a nearby mine in Karangahake.
Exploration drilling between 1979 and 1984 by Waihi Mining and Development Ltd. and AMAX Exploration
Ltd. identified large open pit mineralization within the confines of the historic mining area. Following the
granting of permits, MOP began operation in 1988 as an unincorporated joint venture between
subsidiaries of Normandy Mining Limited Group and Otter Gold Mines Ltd. The Otter Gold holding was
acquired by Normandy in 2002 and the Newmont Mining Corporation acquired full ownership of the Waihi
operations in 2002 through the acquisition of the Normandy Mining Group.
MOP produced 22 Mt for 2.2 Moz. Au when a localized failure of the north wall undercut the main access
ramp suspending open pit mining operations.
MP 41808 was granted in March 2004 for a duration of 25 years to mine the Favona vein system.
Underground mining resumed at Waihi in 2004 with the development of the Favona mine located
approximately 2 km east of MOP. Mining of the Favona vein system led to further extensions of
underground development towards the nearby Moonlight, Trio and Correnso deposits. The Mining
License, ML 322388 expired in July 2017 and was amalgamated into the existing Favona MP 41808.
OceanaGold obtained full ownership of the Waihi property in October 2015. Resource consent for
underground mining of the remnant mineralization around the Martha vein system and the MOP4 was
granted on the 12 December 2018. Table 6-1 summarizes the annual production from Waihi since 1988.
Wharekirauponga
Early prospecting and mining at Wharekirauponga were attempted between 1893-1897, but only 19 oz of
gold bullion was recovered from a 14-ton test parcel and mining was soon abandoned. Modern
prospecting and exploration recommenced between 1978 and 1993 by Amoco, BP and others which
included 5,500 m of drilling in 23 drill holes. Newmont acquired a controlling interest in the property in
2005 and started a reconnaissance geological mapping, sampling, CSAMT geophysics and drilling
campaigns targeting high-grade underground minable veins.
In 2010, drilling intersected the main T-Stream Vein containing 156 m at 1.6 g/t Au. Wide spaced follow up
drilling confirmed the presence of three prospective vein zones each striking more than one km in length,
namely the Western Vein, the T-Stream Vein and the EG Vein. Newmont completed 7 km of diamond
drilling in 15 holes intersecting locally high-grade gold mineralization in each hole. Newmont ceased
exploration in 2013 and the prospect remained idle until 2015 when OceanaGold acquired Newmont’s
New Zealand assets. Exploration then continued in 2017 in the form of diamond drilling along the EG
Document ID: STU-063-REP-002-0 Released: 11th December 2024Page 44 of 244
OceanaGold Corporation | ||
NI 43-101 Technical Report – Waihi District Pre-feasibility Study, New Zealand | ||
target where quartz veining and Au mineralization were intersected along the EG trend. Since the initial
discovery, 97 diamond drill holes have been drilled into the EG vein system from which a geological
model has been produced and a resource estimate calculated.
6.2Previous Studies and Resource Estimates
Resource estimates and exploration results have previously been publicly reported for MUG, MOP, WUG
and GOP. These reports are available through the OceanaGold company website.
6.3Historical Data
It is estimated that the historical Martha Underground produced approximately 5.0 Moz gold between
1879 and 1952. The underground workings extended over 15 vertical levels, 600 m deep and 1.6 km
along strike. The Martha vein system was subsequently mined from an open pit, between 1988 and 2015
which produced approximately 2 Moz of gold.
Underground mine production recommenced in 2006 at the Favona vein system situated approximately
two km southeast of the Martha deposit followed by the Union-Trio-Amaranth vein system and Correnso
Vein System. Mining produced 470 koz of gold from the Favona deposit between 2006 and 2013, 230 koz
of gold from the Trio deposit between 2013 and 2015 and 583 koz from the Correnso deposit between
2015 and 2023. Mine production from Waihi since 1988 is presented in Table 6-1.
Large scale mechanized underground mining has continued uninterrupted since 2008. Current mining is
focused on MUG. No significant gold production is recorded from WUG, apart from 19 oz Au recovered
from a 14-ton test parcel in the late 1890’s.
Document ID: STU-063-REP-002-0 Released: 11th December 2024Page 45 of 244
OceanaGold Corporation | ||
NI 43-101 Technical Report – Waihi District Pre-feasibility Study, New Zealand | ||
Table 6-1: Mine Production Since 1988 - 2023
Martha Open Pit | Favona | Trio | Correnso | MUG | ||||||||||||||||
Mined | Recovered | Mined | Recovered | Mined | Recovered | Mined | Recovered | Mined | Recovered | |||||||||||
Year End | Tonnes | Au (g/t) | Au (koz) | Au (koz) | Tonnes | Au (g/t) | Au (koz) | Au (koz) | Tonnes | Au (g/t) | Au (koz) | Au (koz) | Tonnes | Au (g/t) | Au (koz) | Au (koz) | Tonnes | Au (g/t) | Au (koz) | Au (koz) |
30/06/1988 | 68,179 | 2.4 | 5.3 | 3.6 | ||||||||||||||||
30/06/1989 | 775,240 | 2.8 | 69.8 | 63.1 | ||||||||||||||||
30/06/1990 | 879,294 | 3.1 | 87.6 | 78.9 | ||||||||||||||||
30/06/1991 | 858,173 | 3.4 | 93.8 | 84.2 | ||||||||||||||||
30/06/1992 | 834,472 | 3.1 | 83.2 | 74.5 | ||||||||||||||||
30/06/1993 | 817,003 | 3.2 | 84.1 | 75.7 | ||||||||||||||||
30/06/1994 | 800,203 | 3.3 | 84.9 | 77.8 | ||||||||||||||||
30/06/1995 | 880,580 | 2.5 | 70.8 | 66.4 | ||||||||||||||||
30/06/1996 | 892,859 | 2.9 | 83.3 | 79.2 | ||||||||||||||||
30/06/1997 | 915,135 | 3.0 | 88.3 | 82.7 | ||||||||||||||||
30/06/1998 | 917,346 | 3.1 | 91.4 | 85.6 | ||||||||||||||||
30/06/1999 | 907,790 | 3.6 | 105.1 | 95.5 | ||||||||||||||||
30/06/2000 | 1,030,062 | 3.3 | 109.3 | 102.0 | ||||||||||||||||
30/06/2001 | 1,202,938 | 2.7 | 104.4 | 95.1 | ||||||||||||||||
30/06/2002 | 1,343,925 | 3.3 | 142.6 | 129.9 | ||||||||||||||||
31/12/2002 | 638,210 | 3.5 | 71.6 | 64.4 | ||||||||||||||||
31/12/2003 | 1,231,521 | 3.1 | 120.8 | 109.7 | ||||||||||||||||
31/12/2004 | 1,274,790 | 3.4 | 141.0 | 127.6 | ||||||||||||||||
31/12/2005 | 1,158,385 | 4.8 | 180.2 | 167.7 | ||||||||||||||||
31/12/2006 | 794,231 | 4.0 | 102.9 | 97.0 | 135,304 | 7.9 | 34.2 | 30.0 | ||||||||||||
31/12/2007 | 273,414 | 1.7 | 15.2 | 13.3 | 225,276 | 11.1 | 80.1 | 72.2 | ||||||||||||
31/12/2008 | 536,360 | 1.9 | 32.6 | 29.7 | 330,619 | 11.1 | 118.0 | 101.5 | ||||||||||||
31/12/2009 | 951,481 | 2.0 | 62.4 | 57.7 | 333,103 | 8.2 | 87.8 | 79.4 | ||||||||||||
31/12/2010 | 564,031 | 2.4 | 44.1 | 39.7 | 367,577 | 6.2 | 73.8 | 66.1 | ||||||||||||
31/12/2011 | 691,763 | 2.5 | 54.5 | 48.9 | 304,609 | 6.0 | 58.4 | 51.6 | ||||||||||||
31/12/2012 | 15,972 | 4.8 | 2.5 | 2.2 | 51,580 | 5.6 | 9.3 | 8.6 | 340,391 | 5.4 | 59.1 | 54.6 | ||||||||
31/12/2013 | 165,569 | 2.8 | 14.8 | 12.8 | 52,200 | 4.3 | 7.2 | 6.5 | 463,854 | 6.4 | 95.7 | 88.0 | ||||||||
31/12/2014 | 684,473 | 3.1 | 68.0 | 61.7 | 6,820 | 7.4 | 1.7 | 1.6 | 301,694 | 7.7 | 75.1 | 69.1 | 7,912 | 2.8 | 0.7 | 0.6 | ||||
31/12/2015 | 234,935 | 3.3 | 25.2 | 24.3 | 474,036 | 8.8 | 133.7 | 119.5 | ||||||||||||
31/12/2016 | 489,300 | 8.1 | 126.1 | 116.0 | ||||||||||||||||
31/12/2017 | 472,450 | 8.6 | 130.4 | 119.1 | ||||||||||||||||
31/12/2018 | 433,593 | 6.77 | 94.4 | 83.5 | ||||||||||||||||
31/12/2019 | 433,389 | 5.6 | 78.0 | 68.1 | ||||||||||||||||
31/12/2020 | 100,880 | 6.09 | 19.7 | 17.6 | 36,527 | 2.1 | 2.5 | 2.2 | ||||||||||||
31/12/2021 | 43,492 | 4.97 | 6.9 | 6.3 | 243,936 | 2.94 | 23.1 | 21.1 | ||||||||||||
31/12/2022 | 2,586 | 3.55 | 0.3 | 0.3 | 355,624 | 3.66 | 41.9 | 39.0 | ||||||||||||
31/12/2023 | 472,642 | 3.48 | 52.9 | 48.9 | ||||||||||||||||
Total | 22,338,334 | 3.1 | 2,240 | 2,050.9 | 1,807,088 | 8.1 | 470.48 | 417.4 | 1,105,939 | 6.49 | 229.9 | 211.7 | 2,455,052 | 7.39 | 583.1 | 524.4 | 1,108,729 | 3.38 | 120.3 | 111.2 |
Document ID: STU-063-REP-002-0 Released: 11th December 2024Page 46 of 244
OceanaGold Corporation | ||
NI 43-101 Technical Report – Waihi District Pre-feasibility Study, New Zealand | ||
7GEOLOGICAL SETTING AND MINERALIZATION
7.1Regional Geology
Both the Waihi operations and WUG are located within the Coromandel Peninsula which hosts over fifty
gold and silver deposits that make up the Hauraki Goldfield. The peninsula is built up of Miocene to
Quaternary volcanic rocks, the Coromandel Volcanic Zone (CVZ) overlying a Mesozoic basement. It is
bound to the west by the Hauraki Rift, a large graben filled with Quaternary and Tertiary sediments, and to
the south by volcanics deposited by the presently active Taupo Volcanic Zone (TVZ).
A schematic geological map of the Coromandel Peninsula is illustrated in Figure 7-1. Jurassic greywacke
basement and intruded granitic stocks and dykes of the Mania Hill Group are exposed in the northern part
of Coromandel, becoming progressively down faulted to the south and covered by younger volcanics.
Coromandel geology is dominated by the CVZ, Miocene to Pliocene aged volcanics formed during three
main phases of volcanism (Christie et al. 2007). The first phase constitutes the widespread andesites and
dacites of the Coromandel group (18 to 3 Ma). The second phase encompasses the predominantly
rhyolitic units of the Whitianga Group (9.1 to 6 Ma) and the third phase is dominated by Strombolian
volcanoes and dykes of the Mercury Bay Basalts (6.0 to 4.2 Ma) (Skinner 1986). Epithermal veins and
hydrothermal alteration are observed within the Mania Hill Group, the Coromandel Group and Whitianga
Groups.
Coromandel Group can be subdivided into the Kuaotunu Subgroup andesites and dacites, occurring in
the northern region of the goldfield (18 to 11 Ma), the Waiwawa Subgroup andesites, dacites and
rhyodacites in the southern and eastern parts of the goldfield (10 to 5.6 Ma), as well as the Omahine (8.1
to 6.6 Ma) and Kaimai (5.6 to 3.8 Ma) andesite and dacite Subgroups in the southern parts of the
goldfield.
Mineralized sequences are overlain in places by post-mineral andesitic to dacitic flows of the Kaimai
Subgroup, rhyolitic ignimbrites of the Ohinemuri Subgroup and more recent, Pleistocene age sediments
and ash units. Although these post-mineral units do not blanket the mineralized units, they can be
extensive and reach hundreds of meters in thickness.
The CVZ hosts low- to medium-sulphidation epithermal Au-Ag and minor Cu porphyry deposits along its
length (Christie et al. 2007). The porphyry Cu-Mo-Au deposits are associated with diorite-granodiorite
composition intrusions and volcanic rocks and dated between 18.1 and 16.4 Ma. Epithermal deposits in
the CVZ appear younger in age and formed between 14 and 5 Ma.
The Au-Ag deposits of the Waihi District and Wharekirauponga are classical low-sulphidation, epithermal
quartz vein systems associated with north to northeast trending faults. The main ore minerals are
electrum and silver sulphides developed within quartz veins. Other minerals present within the veins
Document ID: STU-063-REP-002-0 Released: 11th December 2024Page 47 of 244
OceanaGold Corporation | ||
NI 43-101 Technical Report – Waihi District Pre-feasibility Study, New Zealand | ||
include ubiquitous pyrite and more localized adularia, calcite, illite, smectite, sphalerite, galena,
chalcopyrite and rhodochrosite. Base metal sulphide content is low but generally increases with depth.
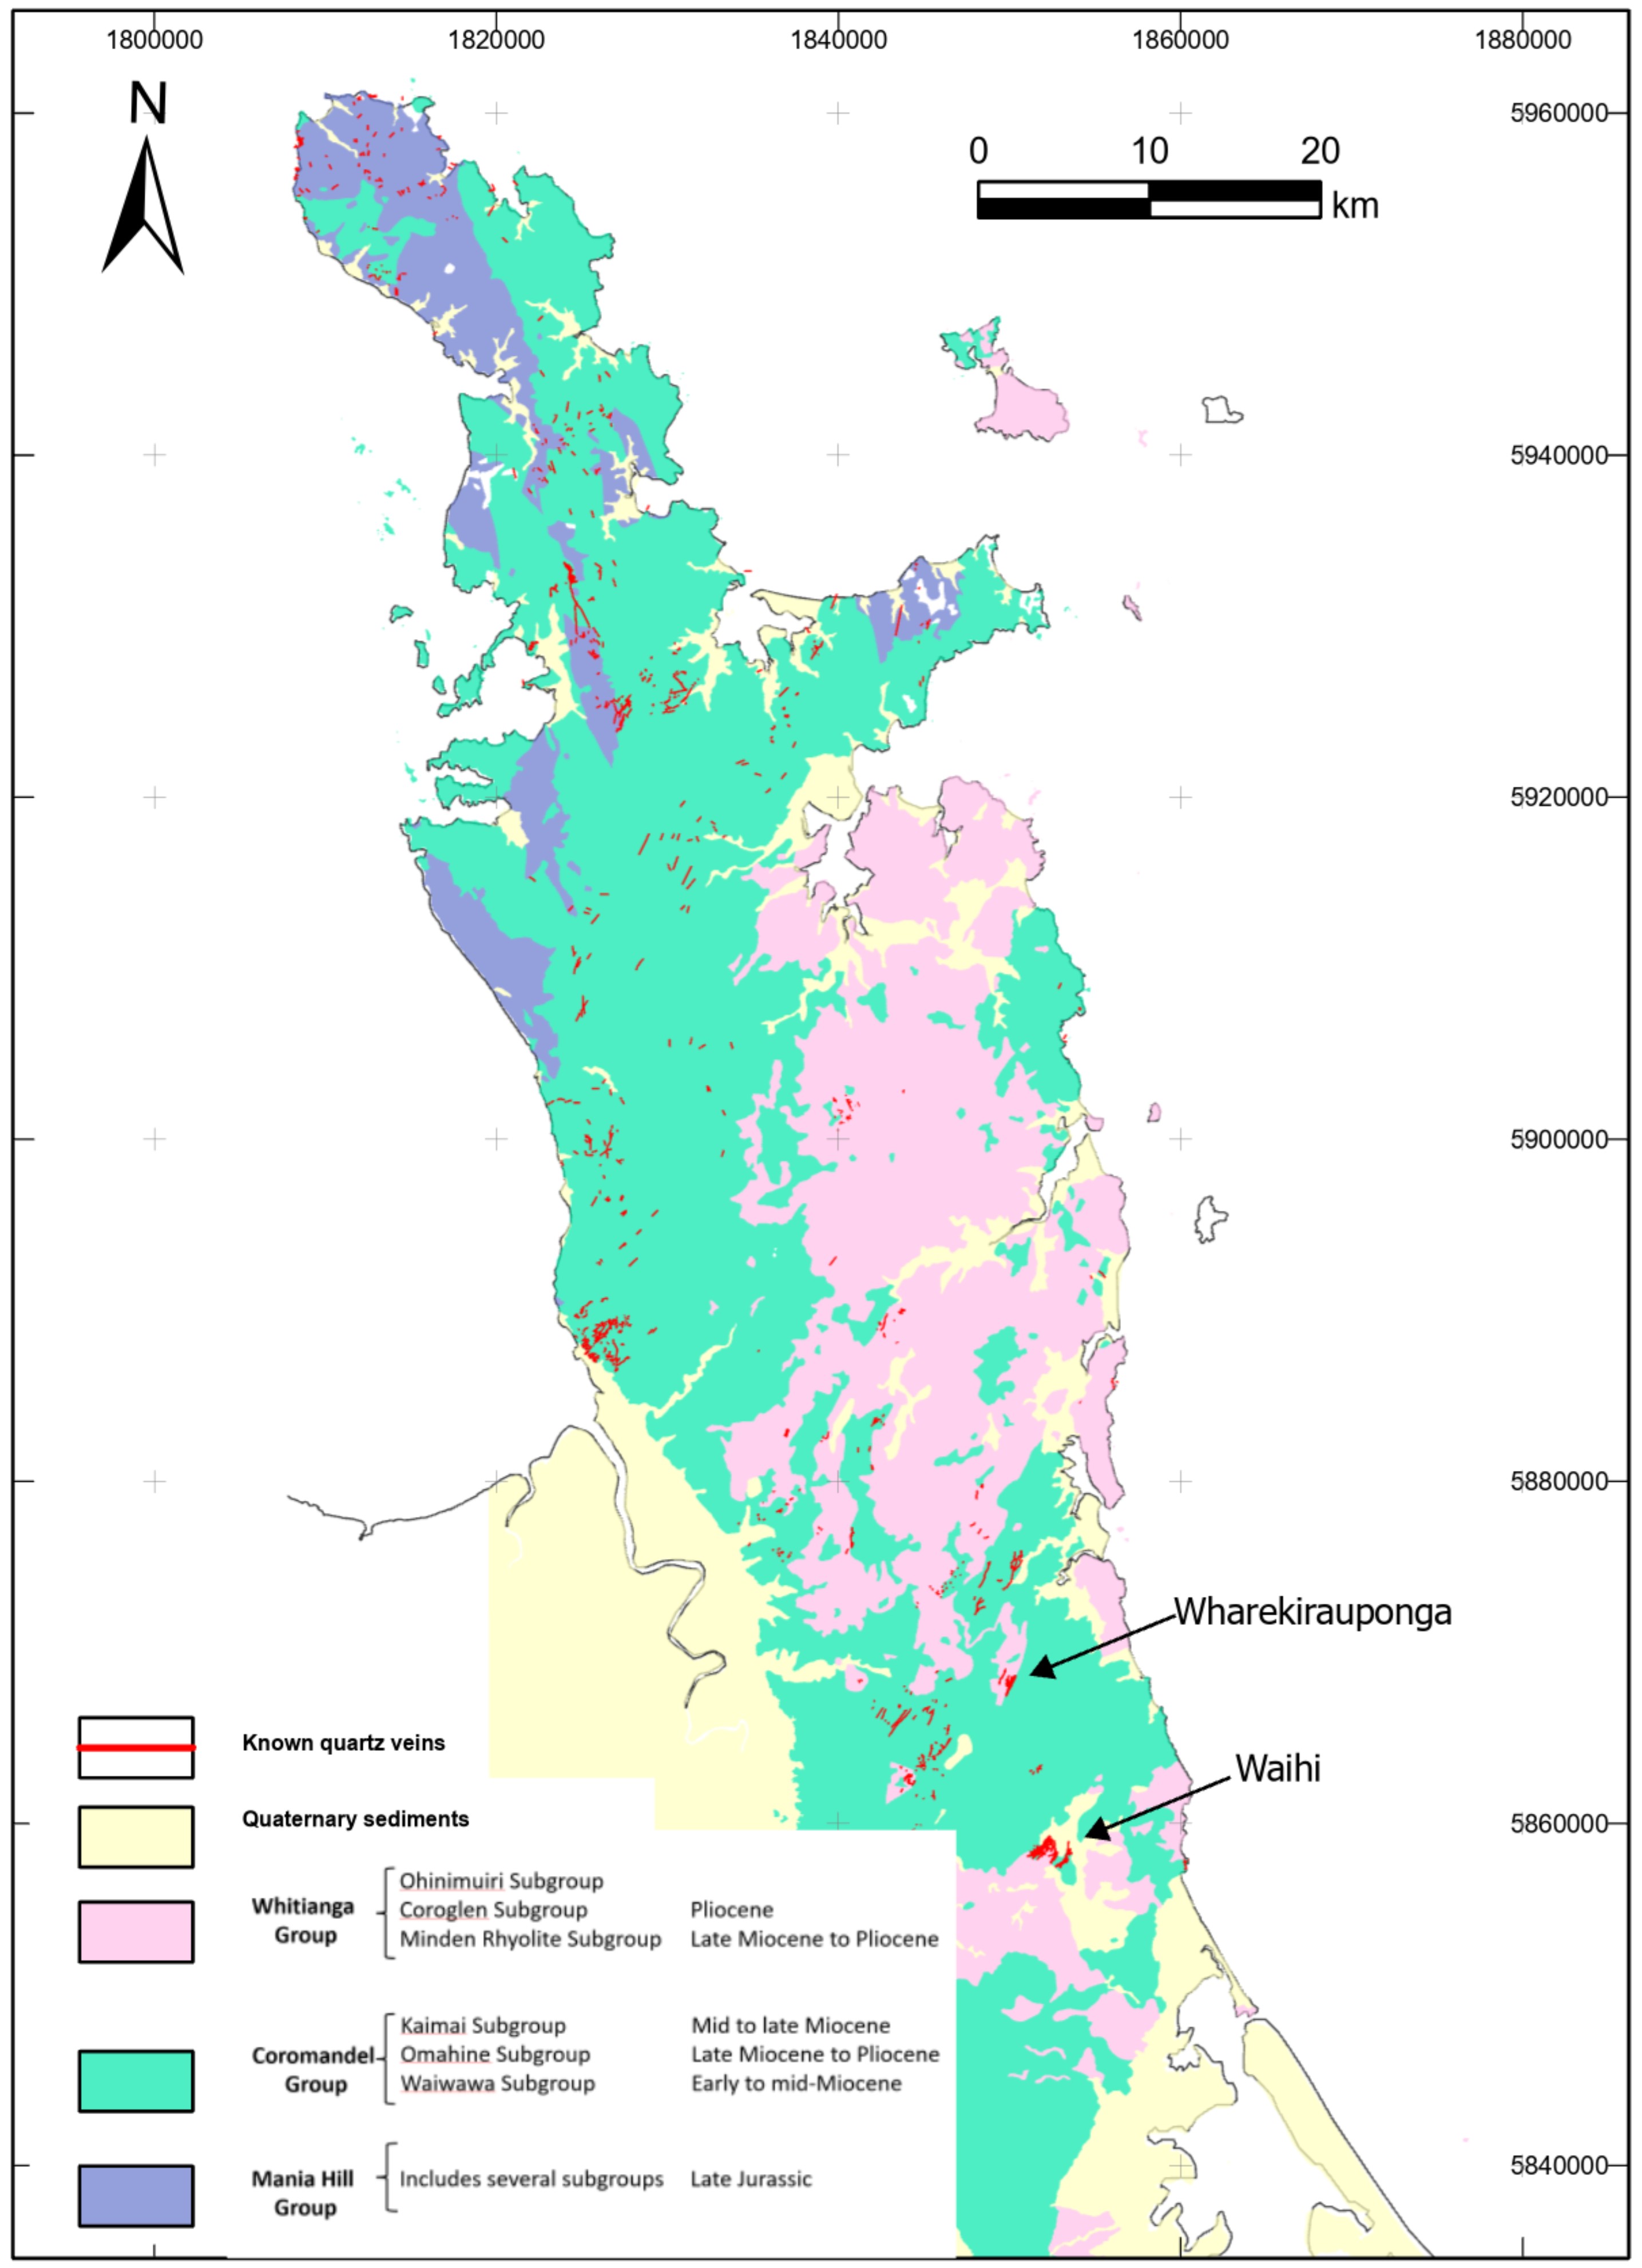
Figure 7-1: Regional Geological Map of the Coromandel Peninsula (NZTM grid)
Document ID: STU-063-REP-002-0 Released: 11th December 2024Page 48 of 244
OceanaGold Corporation | ||
NI 43-101 Technical Report – Waihi District Pre-feasibility Study, New Zealand | ||
7.2Waihi Geology
The Waihi vein system is hosted within andesitic flows, intrusives and volcaniclastic units of late Miocene
age (7.36 to 6.76 Ma) Waipupu Formation. The Waipupu Formation in Waihi can be subdivided into an
upper quartz-phenocryst poor unit and a lower quartz-phenocryst rich unit which dip shallowly towards the
SE. Some of the veining and gold mineralization in Waihi appears to be better developed within the lower
quartz-rich andesite flows, with the exception of the Favona, Moonlight and Gladstone vein systems
which are solely hosted within the upper andesite unit. Much of the mineralized andesites in Waihi are
overlain by post-mineral rocks including dacite flows of the Uretara Formation (5.23 Ma), Pleistocene
ignimbrites and recent ash deposits. Where veining is exposed close to the surface, the quartz-adularia
altered andesite appears to have formed resistant paleo-topo ‘highs’ that project through the post-mineral
cover sequences.
A generalized map of the surface geology of Waihi and the location of veining at depth is illustrated in
Figure 7-2. All known Au and Ag mineralization in Waihi is confined to veining or vein fragment within
hydrothermal eruption breccia. The major mineralized veins are typically coincident with dip-slip, normal
faults believed to have formed in an extensional setting related to early, back-arc rifting of the TVZ dated
at ca 6.1 Ma (Mauk et al 2011). Some of the main mineralized veins within the Waihi area include the
Martha Vein System (which incorporates the Martha, Empire, Welcome, Royal, Edward, Rex and Albert
veins among many others) in the NW and the Correnso, Daybreak, Union, Trio, Amaranth, Favona,
Moonlight and GOP veins progressively southeast (Figure 7-2).
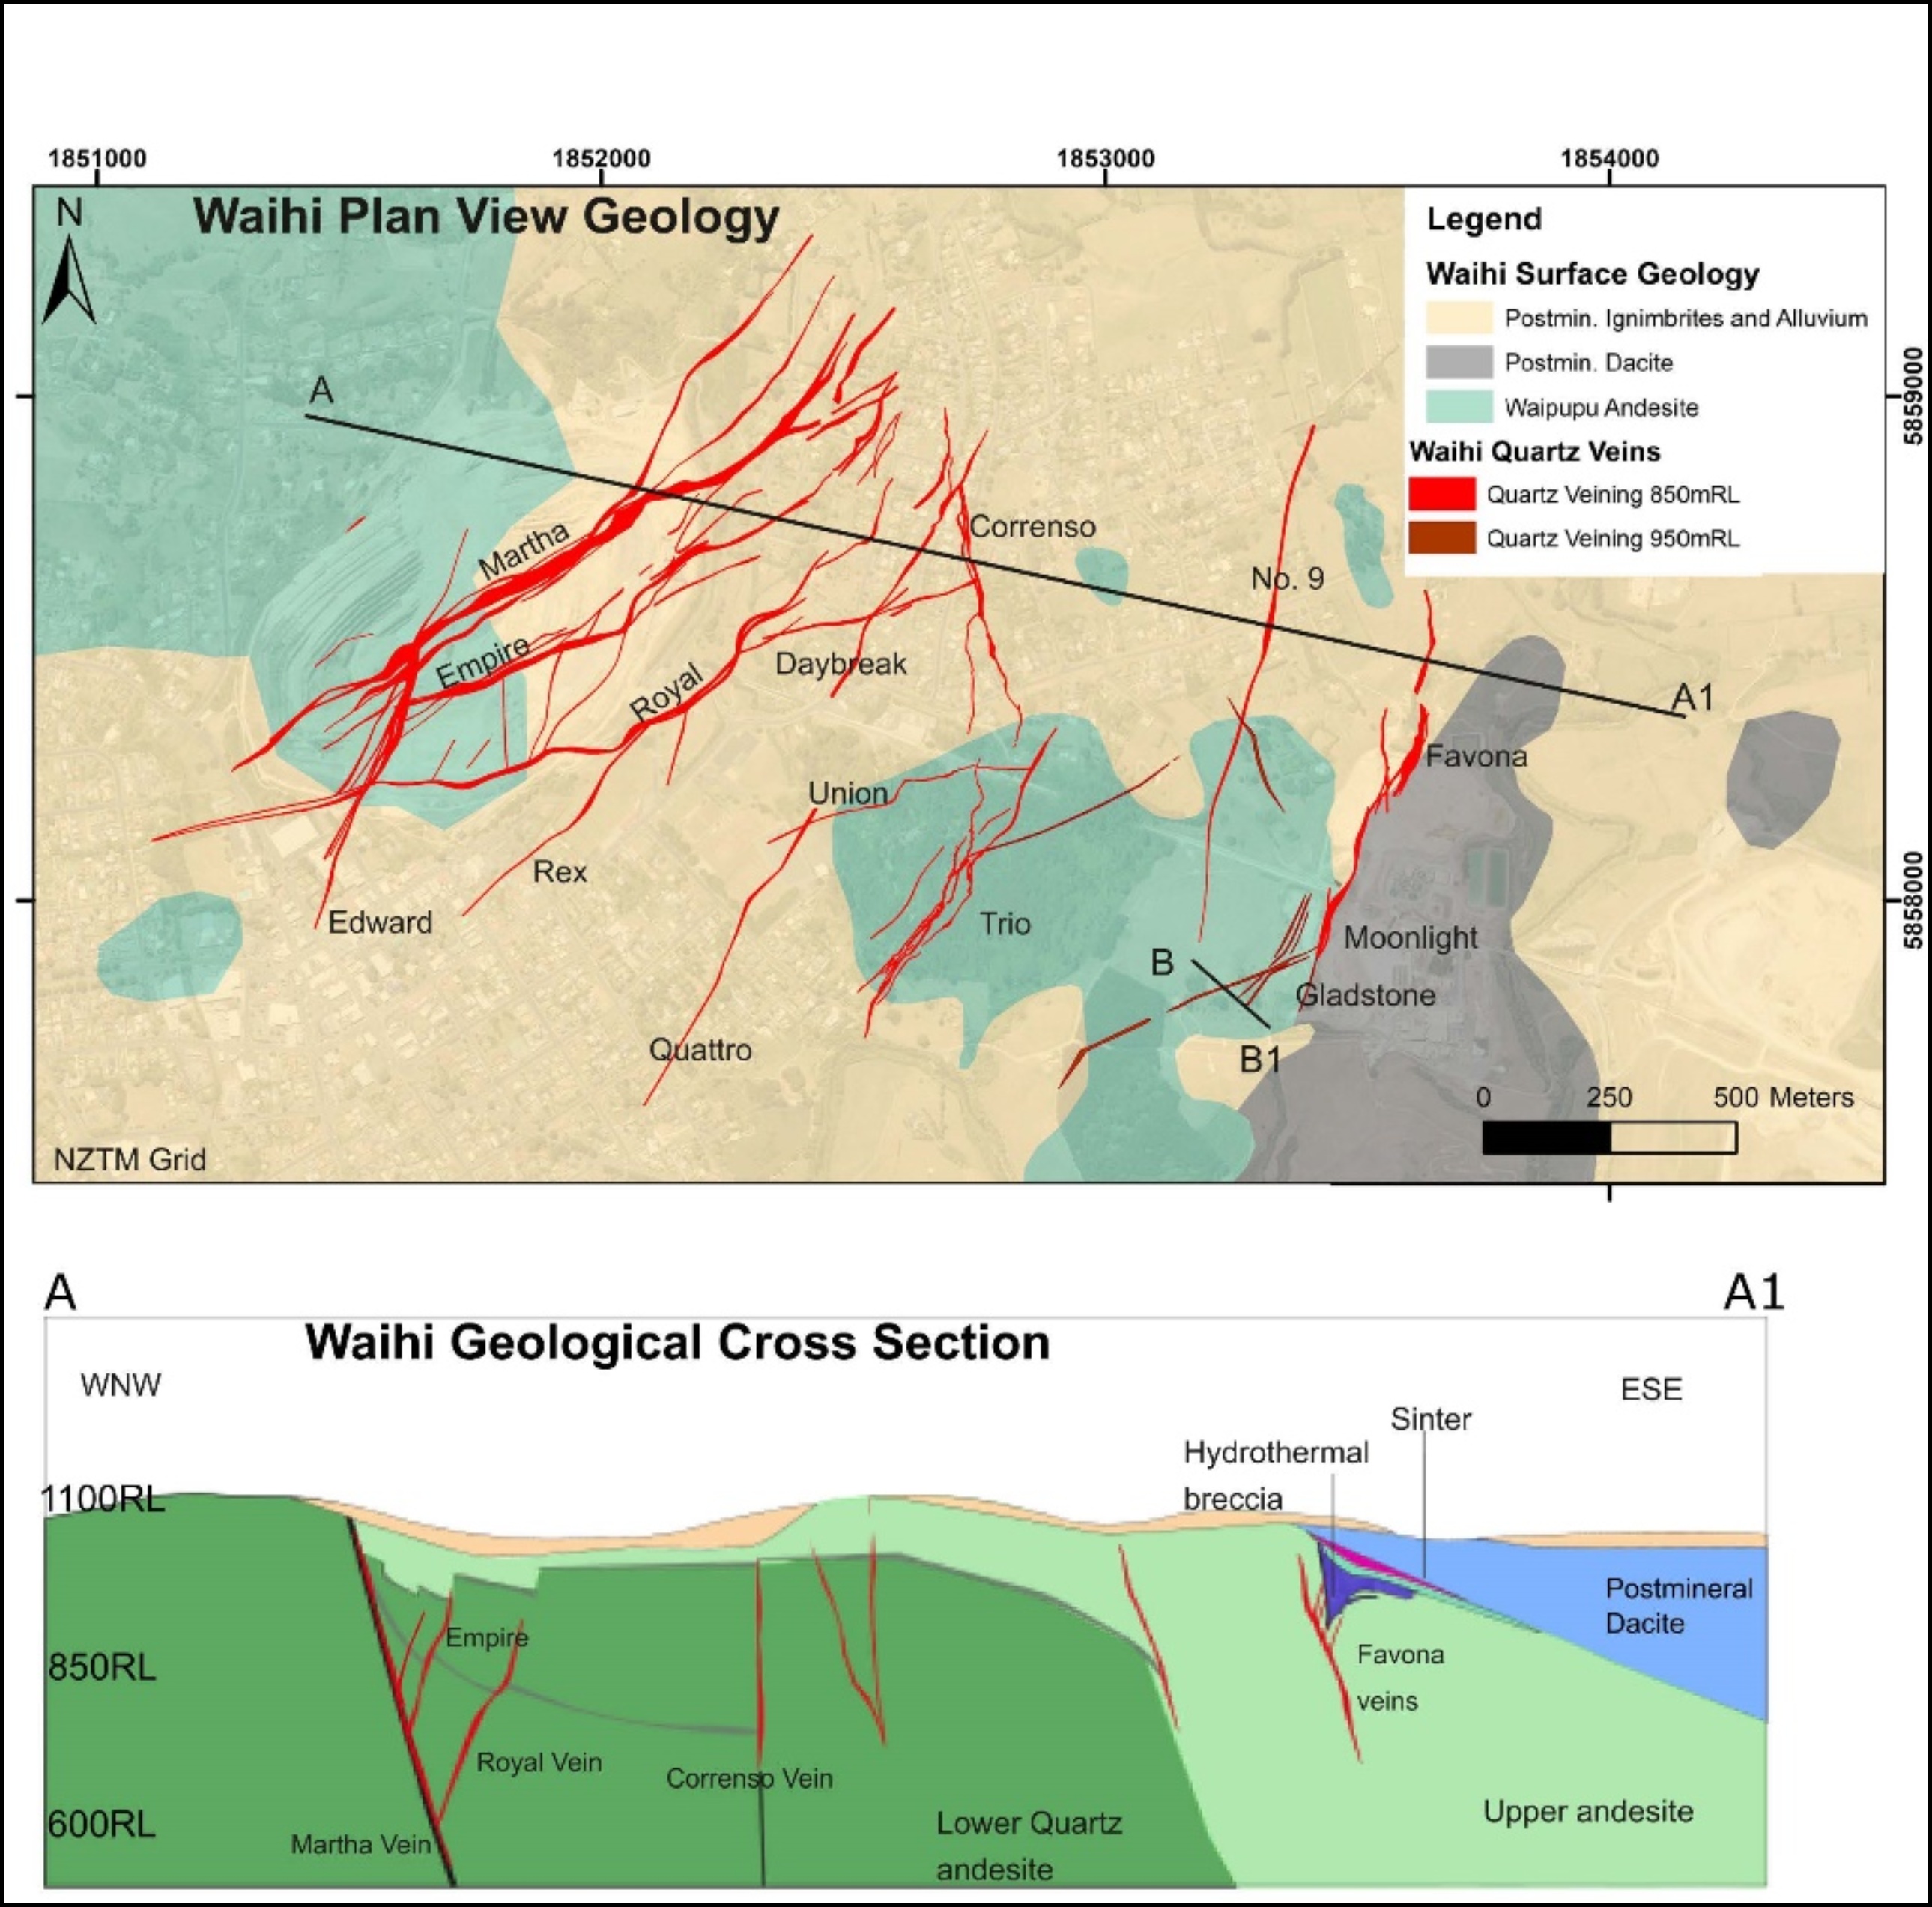
Modified from 1:50 000 scale IGNS Waihi Geological map using OceanaGold drilling data, mapping data and internal reports (as of Feb 2021).
Document ID: STU-063-REP-002-0 Released: 11th December 2024Page 49 of 244
OceanaGold Corporation | ||
NI 43-101 Technical Report – Waihi District Pre-feasibility Study, New Zealand | ||
Figure 7-2: Geological Map and Section Across the Waihi Area
7.2.1Martha Vein System
The Martha Vein System is the largest and most documented of the vein networks in Waihi. The veins are
numerous and form a large network that extends for more than 1600 m along strike and 600 m below the
surface. The vein network although complex in detail, simply comprises the dominant southeast-dipping
Martha vein and several northwest-dipping hanging wall splays including the Empire, Welcome, Royal
and Rex veins. The Martha vein is the largest vein structure reaching up to 30 m in thickness in places
but averages 6-15 m wide. Increased vein widths are closely associated with the steepening of vein dips
from an average of 65 to 70° to approximately 85° to the southeast. Steeper portions of the vein tend to
contain higher concentrations of Au and Ag. The vein itself comprises mainly intact brecciated quartz vein
material evidence for vein emplacement during the late stages of dip-slip faulting. The quartz is
characterized by multiphase brecciation, and banding (colloform and crustiform) and quartz textures are
highly variable from a fine, microcrystalline, and chalcedonic character to more coarsely crystalline
particularly at depth. Apart from the main Martha vein, the hanging wall splay veins are also significant
mineralized structures reaching 18 m width. The hanging wall splays closest to Martha link up with the
Martha vein at depth often forming a higher-grade lode at the intersection. The hanging wall splays further
away from Martha either thin out at depth or are not drilled deep enough to make out their relationship
with Martha at depth. Additional, smaller-scale splay veins are present linking the larger vein structures
and form a valuable contribution to the mineralization particularly in MOP. These splays typically comprise
smaller veins between 5 and 50 cm in width infilling extensional structures with no fault displacement,
dipping moderately towards the northwest. Two steeply dipping, NNE-trending and well mineralized vein
structures and form an important part of the overall Martha vein network.
The andesitic host rocks within proximity to veining have often undergone pervasive hydrothermal
alteration, sometimes with complete replacement of the primary mineralogy. Characteristic alteration
assemblages of the host rocks are dominated by argillic alteration closest to veining and propylitic
alteration extending over tens of metres laterally from major veins. The degree of alteration within the
Waihi District is variable and often dependent on the host rock lithology and the nearby veining. On rare
occasions, some host rocks at or near the contact of large veins appears only weakly altered, for example
the “hard bars” identified during the early historical mining of the Martha vein. Volcaniclastic units tend to
have increased clay alteration compared to the flow units.
Gold occurs mostly as small inclusions of electrum (averaging 38 % silver) occurring as both free grains
in the quartz and as inclusions in sulphides such as pyrite, galena, sphalerite and less commonly
chalcopyrite. Free gold is rarely observed. Acanthite associated with pyrite and galena is the main silver
mineral. Martha ore has silver to gold ratios of > 10:1, The Favona and Trio ores had silver to gold ratios
of ~ 4:1, and Correnso ore had a silver to gold ratio of less than 2:1.
The base metal sulphide content is low but is observed to increase in concentration with depth within all
the Waihi veins. Sphalerite and galena are the most abundant base metal sulphides while chalcopyrite is
less common and pyrrhotite is rare. Correnso ore has higher base metal content than other Waihi veins.
Oxidation extends down the vein margins to over 250 m below surface however, the andesite host rocks
can appear only weakly weathered at or near the surface.
Document ID: STU-063-REP-002-0 Released: 11th December 2024Page 50 of 244
OceanaGold Corporation | ||
NI 43-101 Technical Report – Waihi District Pre-feasibility Study, New Zealand | ||
Much of the Martha Vein System has been mined from underground historically between 1883 and 1952.
However, significant mineralized veined material remains intact adjacent to the historical workings that
was not recoverable historically.
7.2.2Gladstone Vein System
The Gladstone deposit is part of the greater Waihi epithermal vein system located approximately 2 km to
the east of MOP. It is situated along the southern strike extent of the Favona and Moonlight deposits.
Veining at GOP occurs within the upper 250 m below the surface, hosted within the upper andesite unit
(devoid of quartz phenocrysts) (Figure 7-3). The mineralization is characterized by shallow-level,
hydrothermal breccias and associated banded quartz veins interpreted to represent the top of the
epithermal system. The uppermost mineralized quartz veins flare up into hydrothermal explosion
breccias. The Gladstone veins are predominantly steeply dipping veins developed within the hanging wall
of the Favona Fault that dips moderately towards the southeast. Gladstone veining trends ENE to NNE
between 010° and 070° and dips steeply towards the southeast.
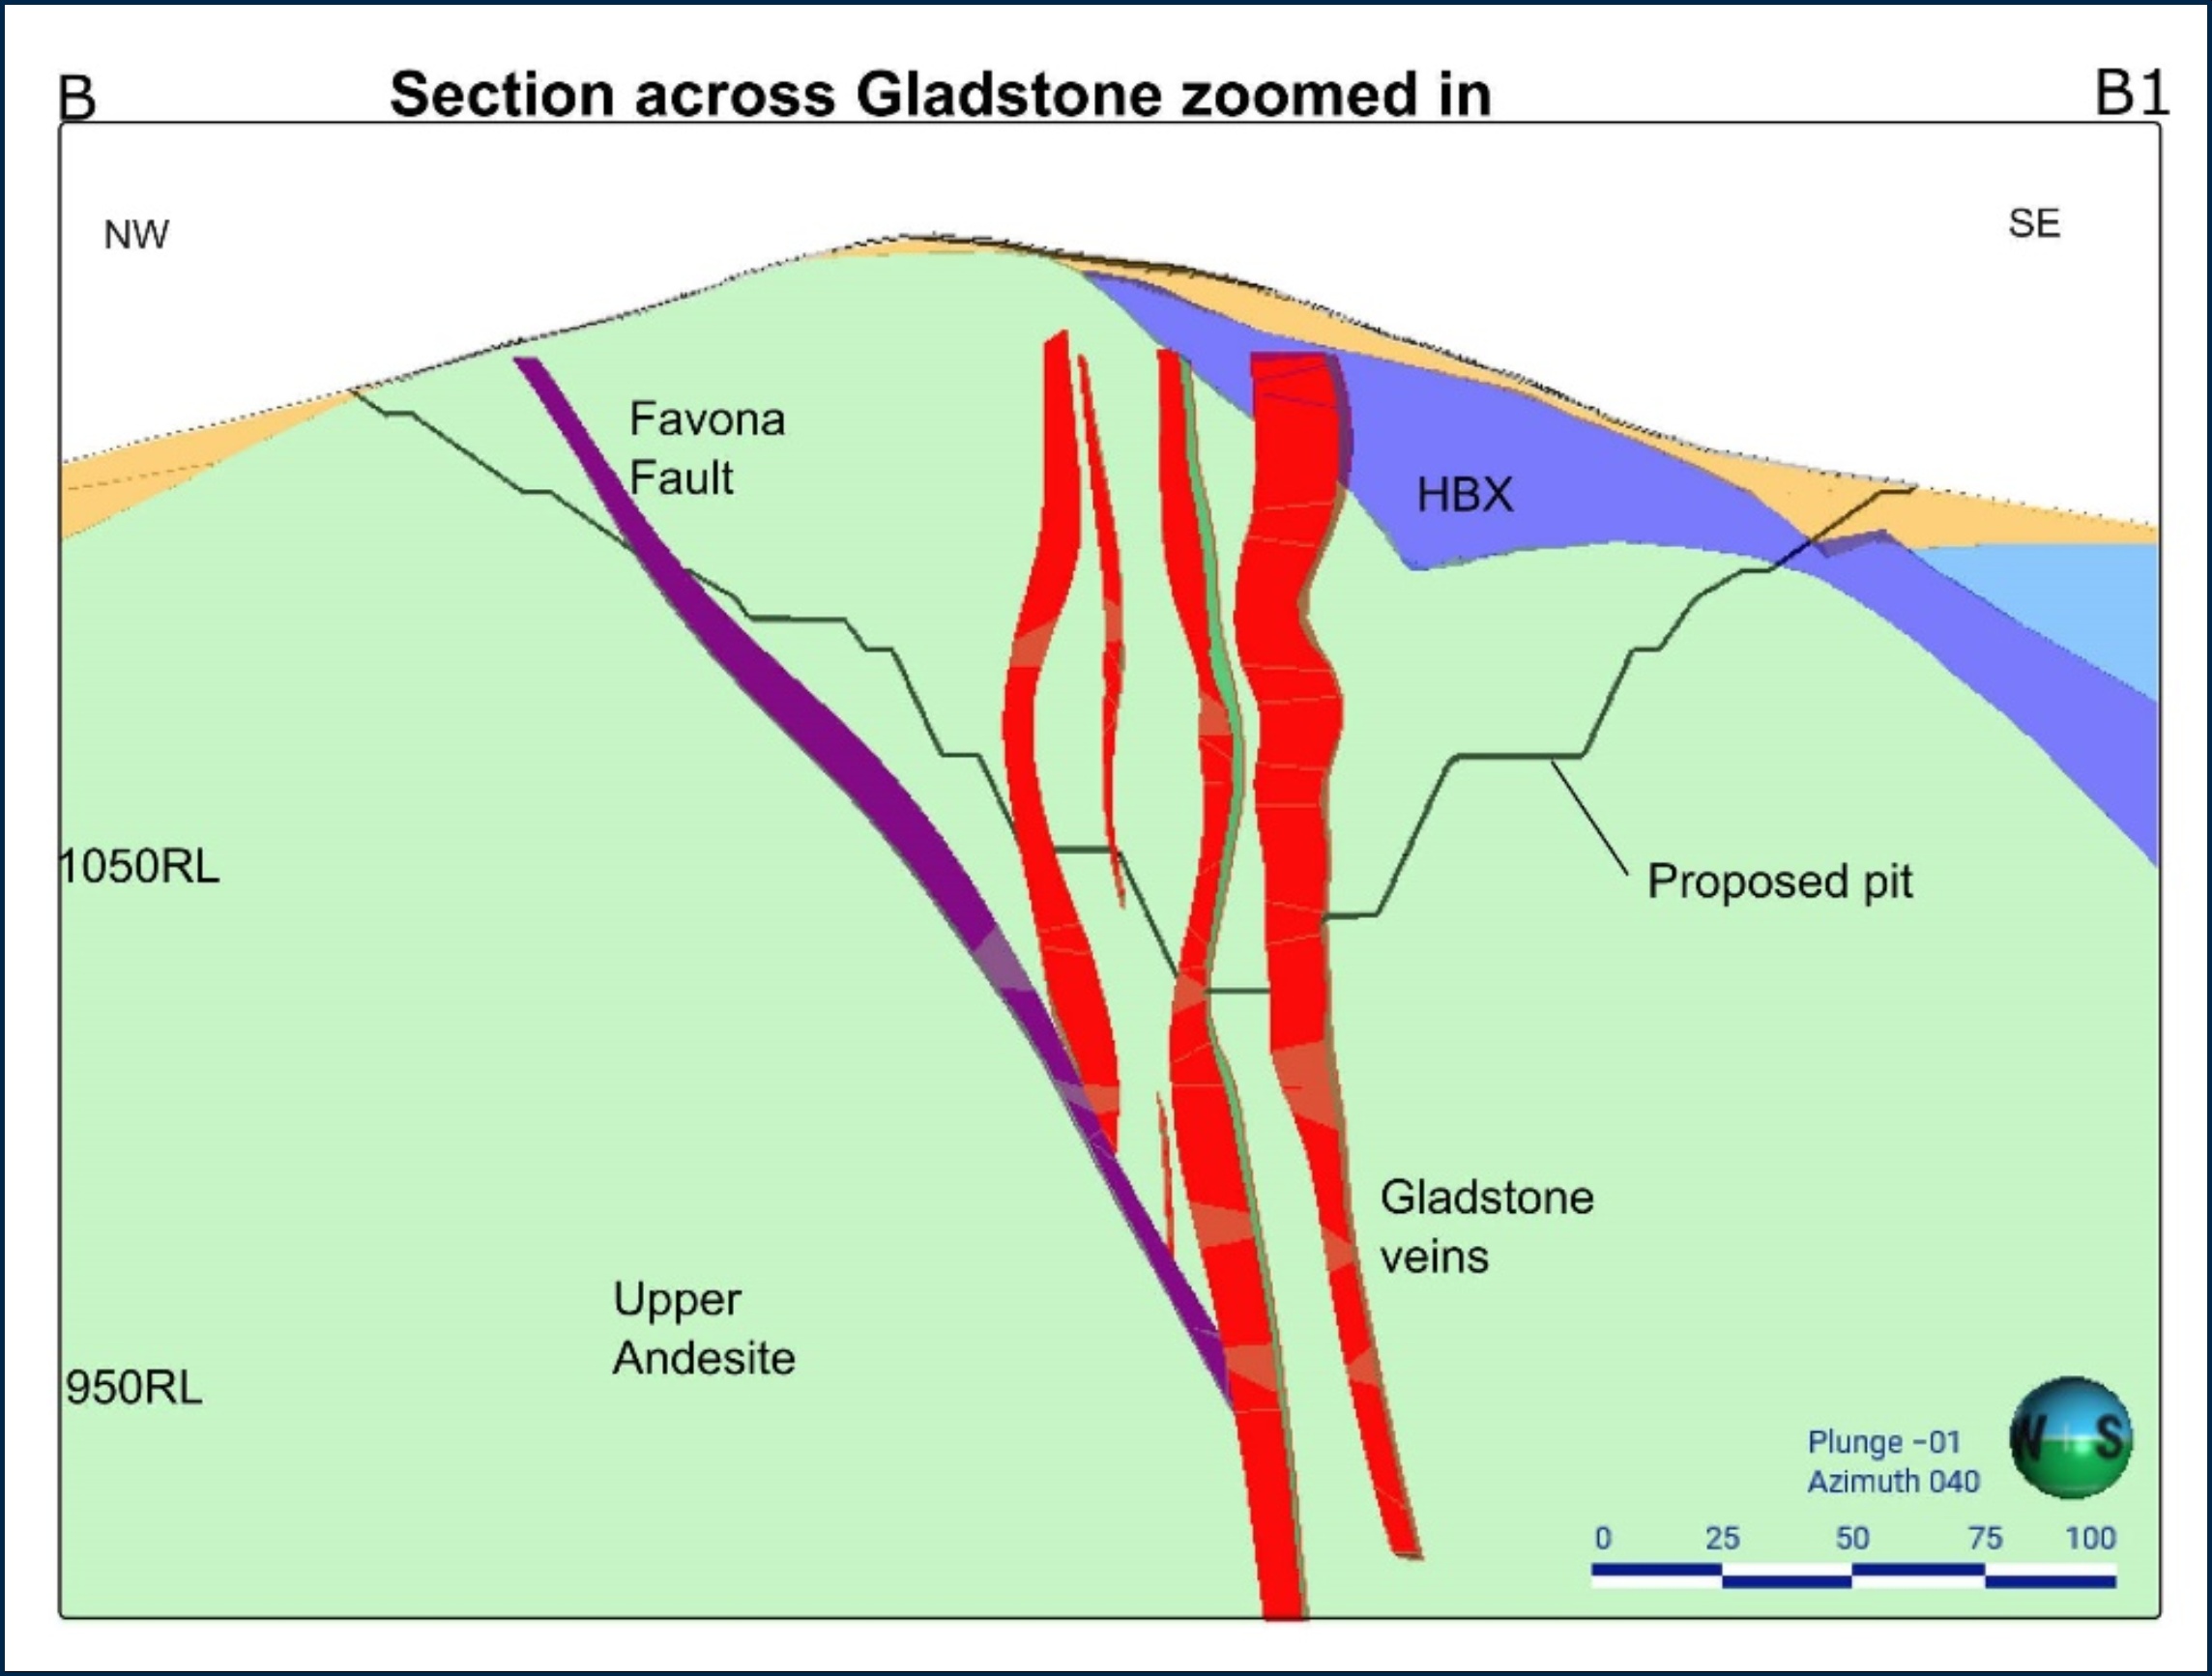
Figure 7-3: Geological Cross Section Through the Gladstone Vein System. The Location of this
Section Line is Shown as B-B1 in Plan View in Figure 7-2
7.3Wharekirauponga
Low-sulphidation epithermal quartz veins at Wharekirauponga are hosted in Whitianga Group rhyolites,
typically rhyolite flow domes to sub-volcanic intrusions within polymict lapilli tuffs. The geology observed in
outcrop mapping and diamond drilling indicates the rhyolitic host rocks are partially overlain by strongly
magnetic, fresh, andesitic flows, rhyolitic tuffs and recent ash deposits (Figure 7-4). Deep drilling to the
west suggests the rhyolites are underlain by Coromandel Group andesites.
Gold mineralization occurs in association with quartz veining developed along two types of structurally
controlled vein arrays. The principal veins, namely the EG, T-Stream and Western Veins occupy laterally
Document ID: STU-063-REP-002-0 Released: 11th December 2024Page 51 of 244
OceanaGold Corporation | ||
NI 43-101 Technical Report – Waihi District Pre-feasibility Study, New Zealand | ||
continuous, NE trending (025-47°), moderately dipping (60-65°) fault structures reaching up to 10 m in
width. More subsidiary, extensional veins (1-100 cm wide) are developed between or adjacent to the
principal fault hosted veins. These veins often form significant arrays that are moderate to steeply dipping
with a more northerly to NNE strike and appear to lack lateral and vertical continuity compared to the
principal veins.
The rhyolites have undergone pervasive hydrothermal alteration, often with complete replacement of
primary mineralogy by quartz and adularia with minor illite and/or smectite clay alteration. Figure 7-4
illustrates in plan the dominant veins at the Wharekirauponga deposit.
The EG Vein is the largest and most continuous mineralized structure drilled at Wharekirauponga to date.
The vein strikes approximately NE (020°) for over ~1000 m although the extent of veining to the north and
south remains open due to limited drill data.
Within the footwall of the EG Vein are a series of veins referred to as the East Graben footwall veins.
These veins show unique characteristics to other Wharekirauponga veins in that they appear more as
sulphide-rich (pyrite-marcasite) vein breccias with slightly elevated As, Hg and Sb. The brecciated nature
of these veins indicate they may be more fault controlled than extensional.
There are a series of sheeted hanging wall veins along the EG structure containing significant Au grade in
places. These veins appear to have a more northerly strike with sub-vertical dips. These veins outcrop at
Document ID: STU-063-REP-002-0 Released: 11th December 2024Page 52 of 244
OceanaGold Corporation | ||
NI 43-101 Technical Report – Waihi District Pre-feasibility Study, New Zealand | ||
surface and were the focus of minor historical workings (pre-1950’s) and early diamond drilling in the
1980’s.
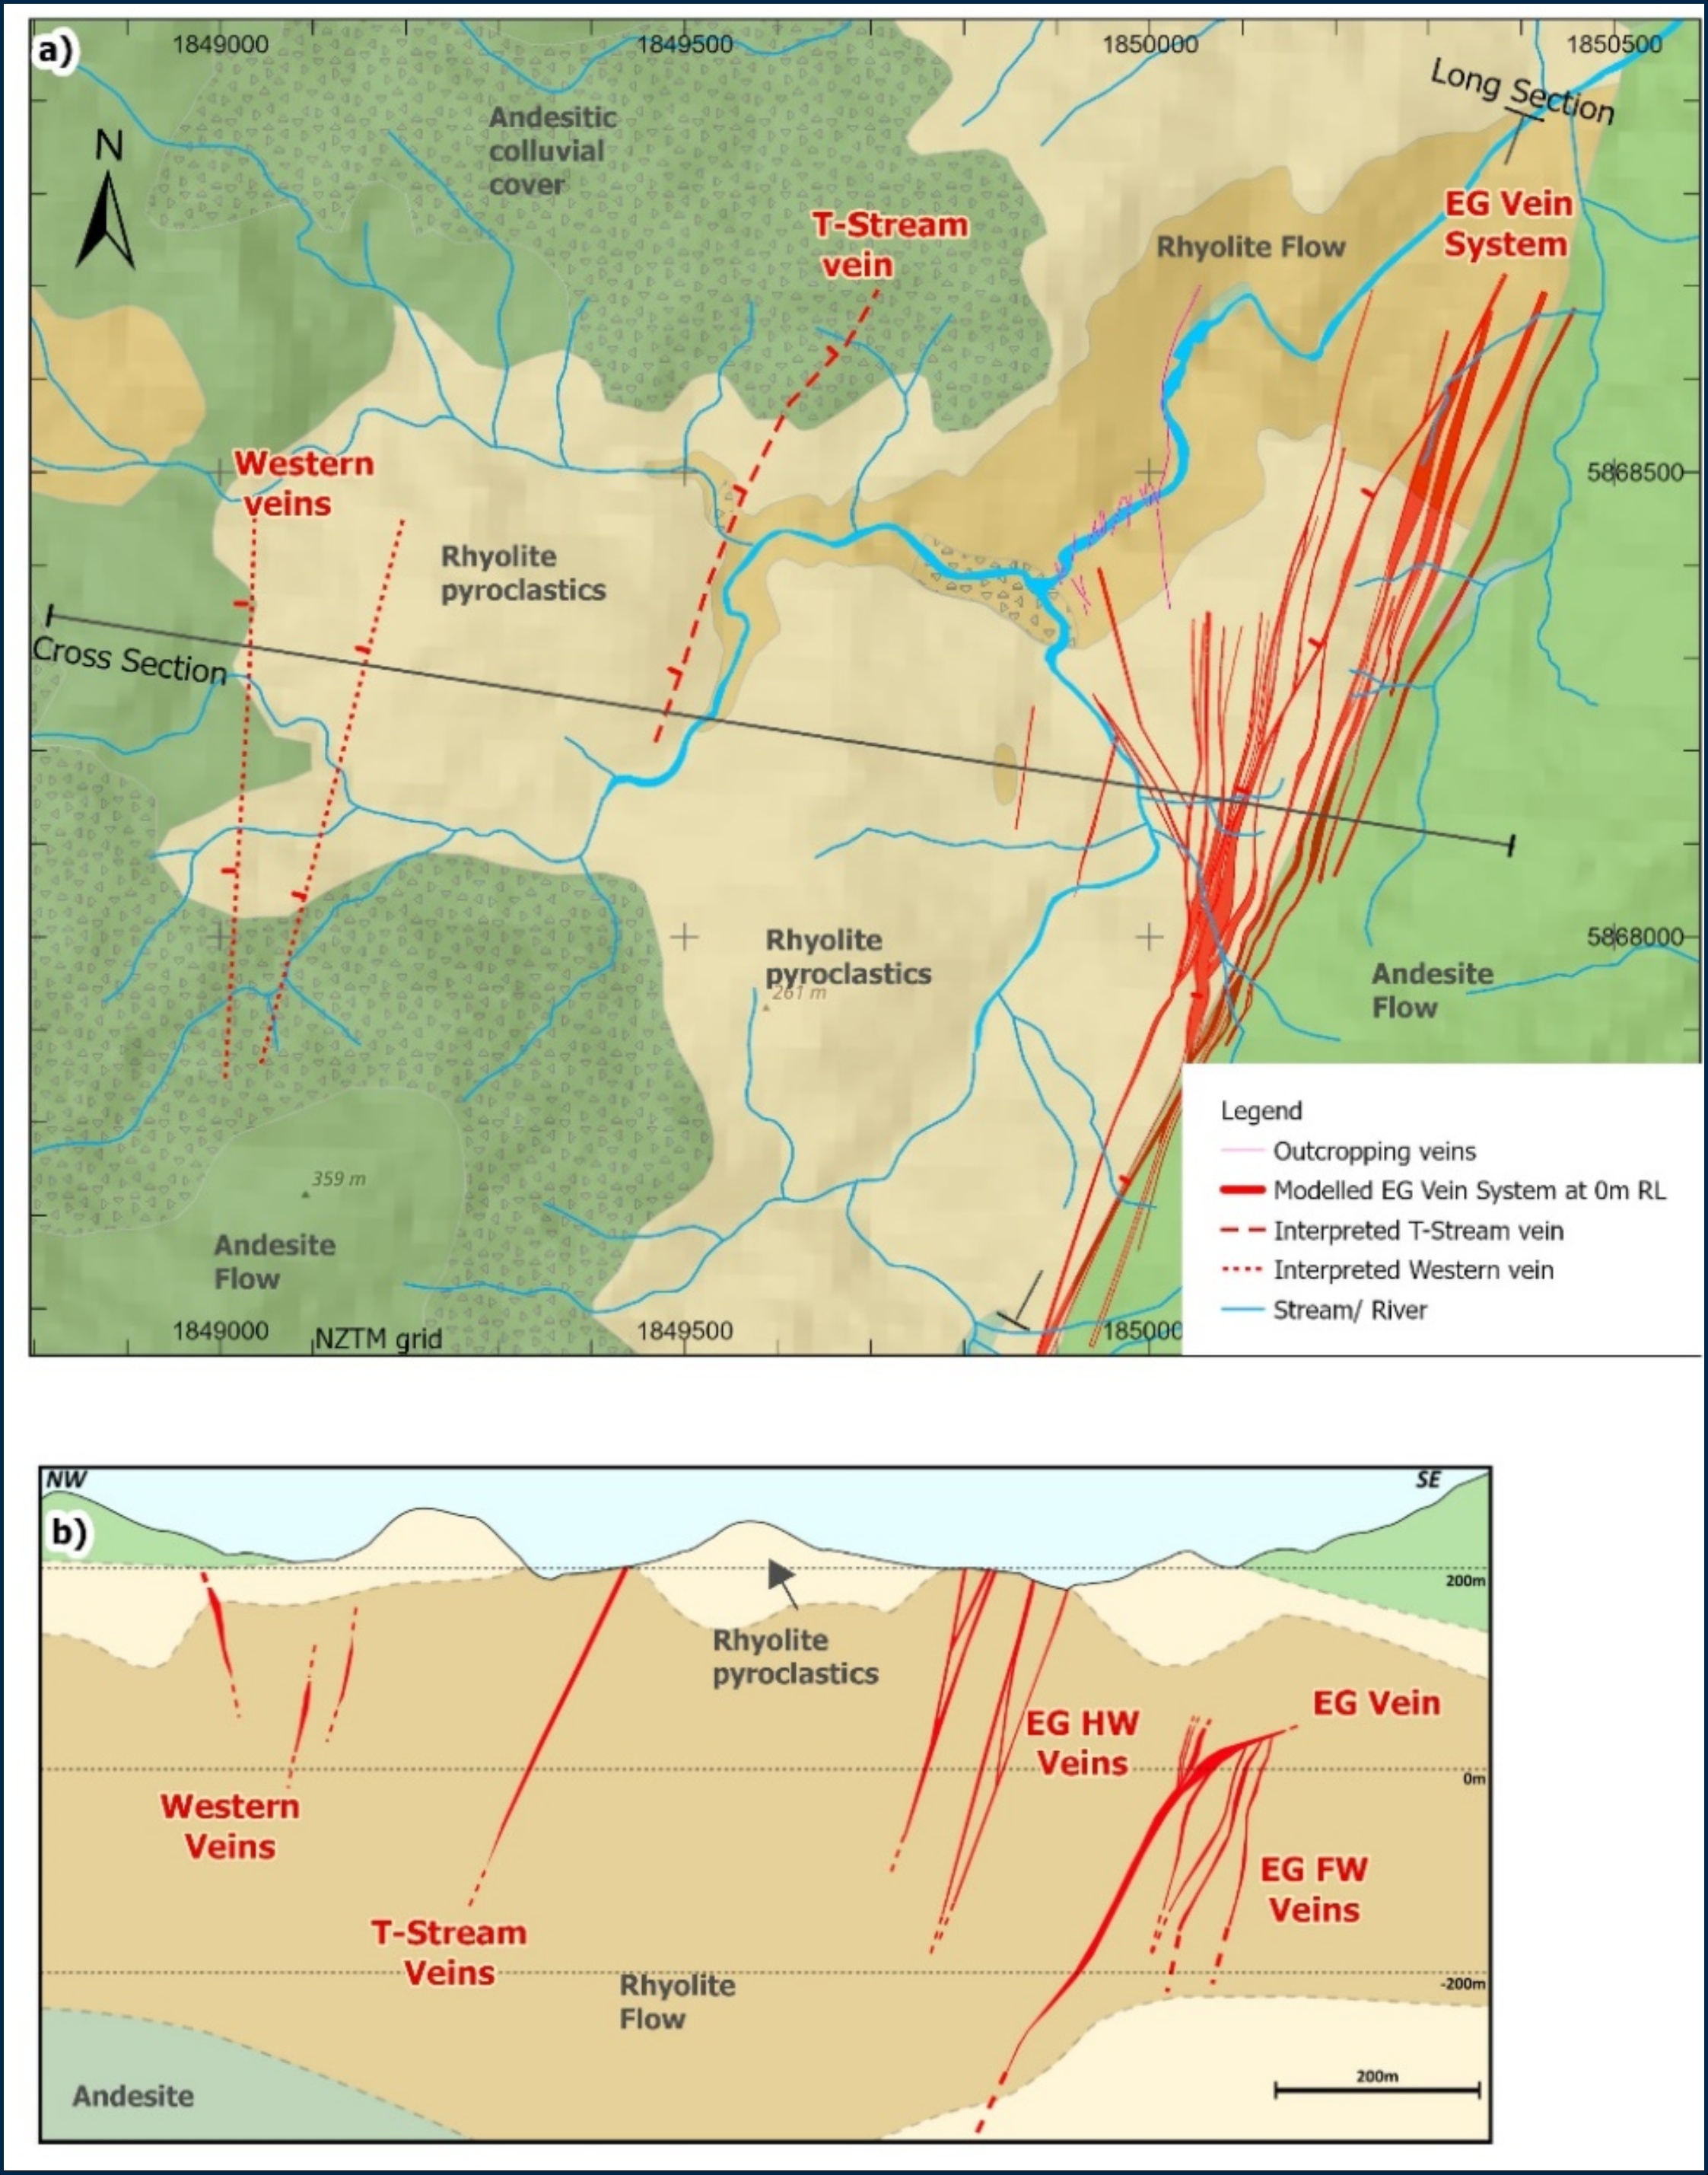
Modified from previous geological interpretation maps using mapping data, and internal OceanaGold reports (as at June 2024).
Figure 7-4: a) Geological Map Across the Wharekirauponga Vein Systems and b) A Cross Section
Facing NNE Showing the Architecture of Veining at Depth. Majority of the Au Mineralization
Occurs Along the EG Vein at the Intersection with the EG HW Veins
Document ID: STU-063-REP-002-0 Released: 11th December 2024Page 53 of 244
OceanaGold Corporation | ||
NI 43-101 Technical Report – Waihi District Pre-feasibility Study, New Zealand | ||
8DEPOSIT TYPES
All the gold deposits outlined by OceanaGold to date in this report are considered to be typical of
epithermal vein gold-silver deposits. The Waihi and Wharekirauponga deposits display the following
features that are typical of epithermal gold deposits elsewhere in the world:
•Gold-silver mineralization is predominantly confined to localized bands within multiphase quartz
veins
•Host lithologies for veins are volcanic units of andesitic and/or rhyolitic composition
•Sphalerite, galena, and chalcopyrite commonly occur with gold-silver Mineralization within the
MUG deposit. This base metal content increases at depth
•Host rock volcanics have undergone pervasive hydrothermal alteration, often with complete
replacement of primary mineralogy. Characteristic alteration minerals include quartz, adularia,
albite, carbonate, pyrite, illite, chlorite, interlayered illite-smectite and chlorite-smectite clays
extending over tens of metres laterally from major veins
•Mineralization is structurally controlled.
Document ID: STU-063-REP-002-0 Released: 11th December 2024Page 54 of 244
OceanaGold Corporation | ||
NI 43-101 Technical Report – Waihi District Pre-feasibility Study, New Zealand | ||
9EXPLORATION
Exploration work completed since the 1970’s in the Waihi District has been extensive and includes
geological mapping, geochemical sampling, airborne, ground and down-hole geophysical surveys,
surface and underground drilling, engineering studies and mine development.
9.1Pre-OceanaGold
Exploration drilling in Waihi between 1979 and 1984 by Waihi Mining and Development Ltd. and AMAX
Exploration Ltd. identified large open pit mineralization within the confines of the historic Martha mining
area. Following the granting of permits, the MOP operation commenced operation in 1988 as an
unincorporated joint venture between subsidiaries of Normandy Mining Limited Group and Otter Gold
Mines Ltd. The Otter Gold holding was acquired by Normandy in 2002 and the Newmont Mining
Corporation acquired full ownership of the Waihi operations in 2002 through the acquisition of the
Normandy Mining Group.
Early prospecting and mining took place at Wharekirauponga between 1893 and 1897, but only 19 oz of
gold bullion was recovered from a 14-ton test parcel and mining was soon abandoned. Modern
prospecting and exploration recommenced from 1978 to 1993 by Amoco, BP and others which included
5,500 m of drilling in 23 drill holes. Newmont acquired a controlling interest in the exploration permit in
2005 and started an exploration campaign that included reconnaissance geological mapping, rock, soil
and stream sediment sampling, geophysics including CSAMT, ground gravity and airborne EM, followed
by diamond drilling of targets with the potential to deliver a high-grade, underground minable gold deposit.
In 2010, drilling intersected a broad zone of anomalous gold in the vicinity of the T-Stream, including
156 m at 1.6 g/t Au. Wide spaced follow up drilling confirmed the presence of three prospective vein
zones each potentially striking more than 1 km in length, namely the Western Vein, the T-Stream Vein and
the EG Vein. Newmont completed 7 km of diamond drilling in 15 holes intersecting locally high-grade gold
Mineralization in each hole. Newmont ceased exploration in 2013.
9.2OceanaGold
Since 2015, OceanaGold has continued exploration activity within the Waihi and Wharekirauponga areas.
Work has included geological mapping and rock sampling for spectral and geochemical analysis, soil
surveys, structural analysis and ground resistivity in the form of CSAMT and magnetics. OceanaGold has
drilled 272 km of diamond core in Waihi (permit MP 41808) and 57 km at Wharekirauponga (permit MP
60541) since it acquired the operations and tenements from Newmont in 2015. Resource conversion
drilling is continuing with further drilling planned for Waihi and Wharekirauponga in 2025.
Document ID: STU-063-REP-002-0 Released: 11th December 2024Page 55 of 244
OceanaGold Corporation | ||
NI 43-101 Technical Report – Waihi District Pre-feasibility Study, New Zealand | ||
10DRILLING
Approximately 370 km of diamond core has been drilled within the MOP, MUG, and GOP since 1980.
WUG includes 64 km of diamond drilling.
Additionally, 86 km has been drilled in 4,500 Reverse Circulation Grade Control (RC) grade control holes
during the MOP operation between May 2007 and May 2015, using a 114 mm hole diameter and rig-
mounted cyclone sampler.
10.1Drill Methods
All surface exploration drill holes were drilled using triple tube wireline diamond methods. Surface holes
are collared using large-diameter PQ core, both as a means of improving core recovery and to provide
greater opportunity to case off and reduce diameter when drilling through broken ground and historic
stopes. Hole diameter is usually reduced to HQ which is the most common core diameter and preference
for target zones. Sometimes NQ core diameter is drilled, particularly where ground conditions have
required a reduction in core diameter prior to reaching the target zone. Drill core is routinely oriented to
allow for the calculation of downhole structural measurements in areas of interest such as veins.
10.2Geological Logging
Since October 2015, when OceanaGold took ownership of Waihi Gold all drill core has been logged into
Excel spreadsheets using validated templates. Log intervals are based on geological boundaries or
assigned a nominal length of 1 or 2 m. The geological log incorporates geotechnical parameters, lithology,
weathering, alteration and veining. A dropdown menu for each field allows the logging geologist to enter
data by selecting from the available codes. Once logging is complete, the log is validated and then
uploaded into an AcQuire database. A complete digital photographic record is maintained for all drill core.
10.2.1Lithology Fields
Primary lithological fields include rock composition, rock type and grain size. Other fields include textural
features and intensity and clast types.
Holes drilled around historic mine workings have logging codes to sufficiently characterise the material
associated with the workings for example stope fill, open stope, collapsed stope and open holes.
10.2.2Weathering Fields
Weathering is logged on a scale of one to five where five represents fresh rock and one represents
intensely weathered material.
10.2.3Alterations Fields
Logging of hydrothermal alteration uses a 1-5 scale to record the intensity of hydrothermal alteration
minerals within the host rock. This includes the intensity of adularia, silicification, clay, chlorite, carbonate
and hematite. A secondary field of “alteration style” is also inferred from the mineral assemblages and
associated temperature-pH charts from Corbett and Leach, 1998.
Document ID: STU-063-REP-002-0 Released: 11th December 2024Page 56 of 244
OceanaGold Corporation | ||
NI 43-101 Technical Report – Waihi District Pre-feasibility Study, New Zealand | ||
10.2.4Structural Fields
Structural fields are used to record information on veins and secondary breccias such as faults and
hydrothermal breccias. Veining is described using fields such as vein percentage, vein mineralogy, vein
texture, vein style and sulphide content. Fields describing secondary breccias include breccia percentage,
breccia type, matrix composition and clast composition.
Downhole orientation data in the form of alpha and beta angles are recorded to estimate the dip and dip
direction of geological structures of interest on the core. The calculations consider a ‘top of core’
reference line drawn on the core by the drillers along with the drilling direction and angle of the drillhole.
Structural data is validated during logging and uploaded into the AcQuire database.
10.2.5Geotechnical Logging
Logging geologists record standard geotechnical parameters including rock quality designation, fractures
per meter and hardness for most drill core. Geotechnical geologists may then select specific core to
undergo more detailed geotechnical logging and analysis.
10.3Drill Core Recovery
Diamond drill core ‘recovery’ is estimated by comparing the measured (recovered) core length against the
drilled length (obtained from the drilling rig). Recovery data has been captured for all sample intervals for
all diamond drill holes and there is no observed relationship between core recovery and grade. Core from
MUG is monitored for recovery daily to rationalise actual core loss against the intersection of historic
mining voids with re-drilling actioned if necessary.
Core recovery within veined material (>40 % vein in sample interval) varies and is summarized as follows:
•92.5 % within MUG
•92.5 % within MOP
•89-90 % for GOP
•96.2 % for WUG.
At MUG, core recovery from areas with historic mine workings is relatively low and therefore
methodologies have been trialled and adopted to best record recovery in these zones. Areas of core loss
are broken out where possible to avoid any smear of Au grade over disproportionate areas.
10.4Collar Surveys
All historic (pre-1952) underground mine data in Waihi was recorded using the local Mt Eden Old (MEO)
grid. This grid has continued to be utilized for all underground and exploration activity within 3 km of the
Waihi operations. The MEO grid is offset from New Zealand Transverse Mercator (NZTM) Grid by
5215389.166 (shift mN) and 1456198.997 (shift mE). Any work more than 3 km from the Martha mine
uses the national New Zealand Transverse Mercator (NZTM) Grid.
MOP has historically used a local mine grid, referred to as ‘Martha Mine Grid’, derived from MEO grid but
oriented perpendicular to the main veins. The grid origin is based at No.7 Shaft (1700 mE, 1600 mN) and
Document ID: STU-063-REP-002-0 Released: 11th December 2024Page 57 of 244
OceanaGold Corporation | ||
NI 43-101 Technical Report – Waihi District Pre-feasibility Study, New Zealand | ||
rotated 23.98° west of MEO North. All open pit channel and drilling data has been converted to MEO for
the Resource estimation of the MUG Resource. Relative level (mRL) is calculated as sea level + 1000 m.
The position of drill collars at WUG are located using a total station in NZGD2000 Mt Eden. These
coordinates are converted to New Zealand Transverse Mercator (NZTM) grid using an online Land
Information New Zealand (LINZ) coordinate convertor.
All underground and surface drill collars used in Resource and Reserve estimates are surveyed using a
total station by a registered professional land surveyor.
10.5Downhole Surveys
The method for lining up drill rigs and collecting downhole survey data to monitor down hole deviation has
improved over time as new techniques and technologies have developed.
To line up a drilling rig when commencing a drillhole, prior to 2023 surface holes used a sighting compass
and underground holes used a surveyed point painted on the ribs. Since 2023, all diamond drill rigs are
lined up prior to drilling using a Devi Azimuth Aligner.
Prior to 2023, downhole surveys were taken on all drillholes at approximately 20 to 30 m intervals using a
digital single shot camera. The azimuth recorded from these surveys was sometimes influenced by the
inherent magnetism in the country rock and/or underground infrastructure in proximity to the drillhole.
Downhole magnetic readings were therefore taken and recorded along with the azimuth and dip survey
data. Where surveys were deemed inaccurate or not able to be taken, they were replaced with an
estimated value. Where drillholes pass through old workings within the Martha vein system, surveys were
estimated and inserted on either side of the workings to improve the accuracy of the drill trace curvature.
All downhole surveys in the AcQuire database are validated by a geologist.
Since 2023 all downhole surveys have been taken using a Devi-gyroscope. This instrument is a true north
seeking gyroscope that is not influenced by magnetic surroundings and provides a more accurate,
continuous trace of drillholes with depth.
10.6Geotechnical Drilling
Geotechnical drilling has been carried out for GOP, MUG and WUG for the purposes of collecting
samples for triaxial, uniaxial strength testing and other laboratory test work. All Resource drilling has
some geotechnical components logged and are analysed by a site-based geotechnical engineer.
10.7Drill Spacings and Orientations
Mineral Resources have been adequately drilled to achieve an Indicated or Inferred Resource
classification (Table 10-1). Classification considers average spacing to the three closest drill holes. The
extensive mining history of MOP and MUG have developed significant experience in assessing the
continuity of Mineralization and mining the Martha vein system and the adjacent deposits. The vein style
Mineralization has a strong visual control, is well understood, and has demonstrated continuity over
significant ranges.
Document ID: STU-063-REP-002-0 Released: 11th December 2024Page 58 of 244
OceanaGold Corporation | ||
NI 43-101 Technical Report – Waihi District Pre-feasibility Study, New Zealand | ||
Table 10-1: Current Project Drill Spacings
Project | Drill Spacing | Drill Spacing |
Indicated Resource | Inferred Resource | |
MOP | 30-36 metres | <60 metres |
GOP | 22.5-35 metres | <60 metres |
MUG | 36 metres | <60 metres |
WUG | 36-42 metres | <67.5 metres |
WUG includes ~150 diamond drill holes (excluding re-drills and piezo holes) drilled up to April 2024. Much
of the recent drilling has targeted the EG Vein zone. The EG Vein zone has been intersected in drilling
over a strike length of ~1 km. This structure is larger than those typically encountered in the Waihi Project
area and on this basis the average drill hole spacing required for classification as an Inferred Resource
has been increased to 70 m average distance to the three closest drill holes.
Drill holes are designed to intersect known mineralized features in a nominally perpendicular orientation
as much as practicable given the length of drillholes (often 250 m+) and availability of drill platforms.
Document ID: STU-063-REP-002-0 Released: 11th December 2024Page 59 of 244
OceanaGold Corporation | ||
NI 43-101 Technical Report – Waihi District Pre-feasibility Study, New Zealand | ||
11SAMPLE PREPARATION, ANALYSES, AND SECURITY
11.1Sampling Methods and Preparation
Once the core is logged, photographed and sample intervals allocated, it is cut in half length ways. If a
vein is present, the cut line is preferentially aligned to intercept the downhole apex of the structure. Within
each sample interval, one half of the core is bagged for sampling and the other is kept in storage. Whole
core is sampled under the following conditions:
•Underground grade control drilling
•Exploration drilling on occasion where there was significant core loss coupled with visible
electrum
•Exploration drilling on all BQ core is whole core sampled due to reduced sample volumes. BQ
diameter core is only rarely drilled.
Labelled calico bags containing the cut core samples are routinely transported to the local Waihi SGS
Laboratory for crushing and sample preparation. Refer to the sample preparation flow sheet illustrated in
Figure 11-1.
Sample preparation has been carried out at the SGS Waihi laboratory since 2006. Prior to then the
sample preparation facility was located at the Martha Mine site and operated by trained site employees.
Some of the early WUG core (holes WKP40-45) were sent to the Westport SGS laboratory for crushing
and sample preparation.
RC drill chips were sampled as part of the grade control process during the MOP operation but also on a
minor scale for exploration purposes (approximately 4309 m used in MUG estimate). At the RC rig site,
samples were collected in a bag attached to the cyclone at 1.5 m intervals from which a 3 to 5 kg sample
was split using a cone splitter. Bags were then transported to the secure sample preparation facility.
Sample preparation of RC chips is the same as drill core.
Channel sampling in MOP was conducted as part of the grade control process prior to its transition to RC
drilling in 2007. Channel sampling was undertaken using 1 m long channel samples on 2.5 m benches
along North-South lines, spaced 7.5 m apart. A 3.6 kg sample was collected per interval with a maximum
of 50 mm dimension in longest direction. Similar to RC drill chips, samples were sent and prepared in the
onsite sample preparation facility and despatched to the SGS laboratory in Waihi for analysis.
11.2Quality Assurance and Quality Control
11.2.1Exploration Drilling Samples
Analyses of drill sample pulps from exploration core was undertaken predominantly at the SGS
Laboratory in Waihi but also at the ALS laboratory in Brisbane and Townsville. The quality of exploration
assay results has been monitored by:
•Sieving of the jaw crush and pulp products at the laboratory
•Monitoring of assay precision through routine generation of duplicate samples (one (1) every
batch of 17 samples) from a second split of the jaw crush and calculation of the fundamental error
Document ID: STU-063-REP-002-0 Released: 11th December 2024Page 60 of 244
OceanaGold Corporation | ||
NI 43-101 Technical Report – Waihi District Pre-feasibility Study, New Zealand | ||
•Monitoring of accuracy of the results through insertion of Certified Reference Material (CRM) and
blanks into each batch of 17 samples
•Blank, duplicate and CRM results are reviewed prior to uploading assay results in the AcQuire
database and again on a weekly basis. The Waihi protocol requires CRMs to be reported to within
two (2) standard deviations of the certified value. The criterion for preparation duplicates is that
they have a relative difference (R-R1/mean RR1) of no greater than 10 %. Blanks should not
exceed more than four times the lower detection method of the assay method. Failure in any of
these thresholds triggers an investigation and re-assay.
11.2.2Underground Face Samples
Routine grade control underground face channel sampling protocols ensure a CRM standard, a blank, a
crush and field duplicate were submitted within the sample sequence of every face. A blank sample was
entered into the sample sequence preferably after what appears to be the highest-grade sample in the
face. A field and crush duplicate of the sample preceding the blank, was entered at the end of the sample
sequence, followed by the CRM standard.
11.2.3RC Grade Control Data
Assay quality control procedures for grade control RC data are set out in the MOP grade control
procedures updated in 2015 (Table 11-1). These procedures were designed to detect any poor sampling
and sample preparation practices and ensure that results are within acceptable ranges of accuracy and
Document ID: STU-063-REP-002-0 Released: 11th December 2024Page 61 of 244
OceanaGold Corporation | ||
NI 43-101 Technical Report – Waihi District Pre-feasibility Study, New Zealand | ||
precision. The QAQC protocols implemented for RC grade control sampling in MOP are summarized in
Figure 11-1.
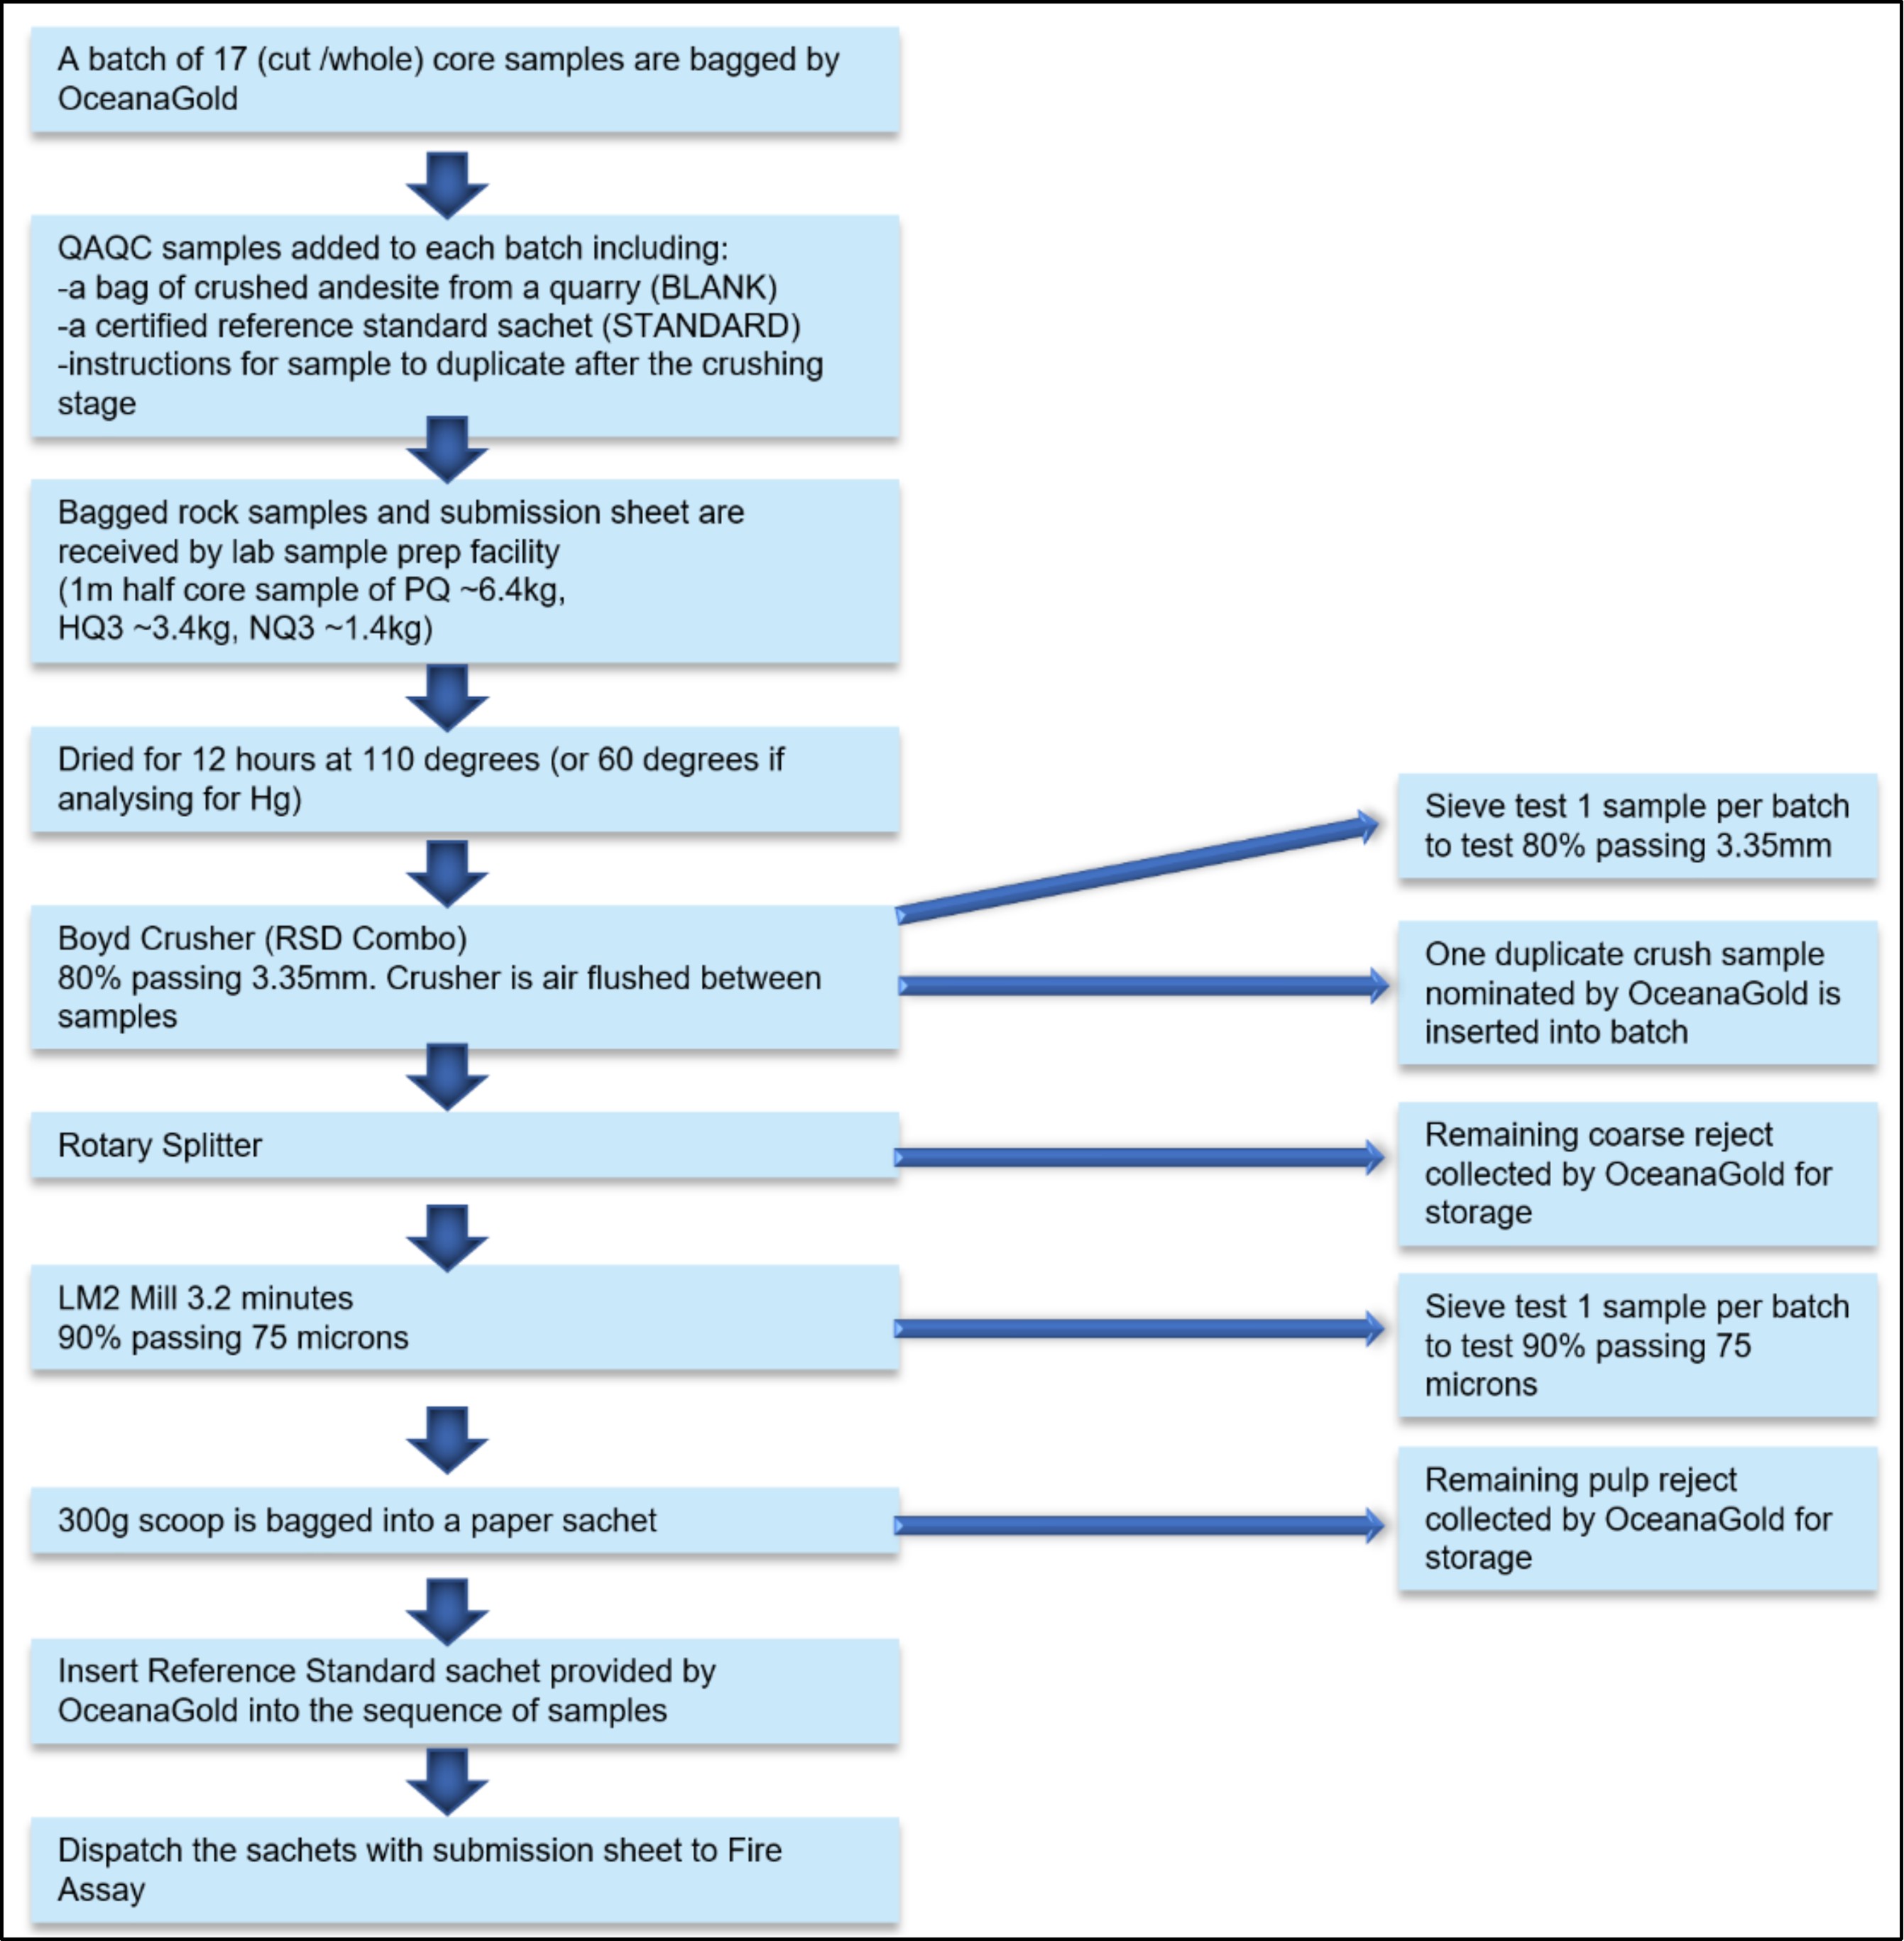
Figure 11-1: Sample Preparation Flow Sheet for SGS laboratory in Waihi
Table 11-1: Grade Control QAQC Samples for RC Sampling
Check | Description | Frequency |
Blanks | Coarse Post-Mineral Andesite (Tirohia Quarry); submitted blind to the lab | 1 per drillhole |
Standards | Currently using Rocklabs standards; submitted as pulp to the lab | 1 per drillhole |
Field Duplicates | Additional RC sample taken from reject material from drill rig split | 1 every fifth drillhole |
Crush Duplicates | Split of crush residue repeat assayed by 50 g Aqua Regia Assay | 1 every 50 samples |
Fire Assay | Repeat assay of pulp by 30 g Fire Assay | 30 per month |
Document ID: STU-063-REP-002-0 Released: 11th December 2024Page 62 of 244
OceanaGold Corporation | ||
NI 43-101 Technical Report – Waihi District Pre-feasibility Study, New Zealand | ||
11.2.4Open Pit Channel Samples
Assay quality control procedures for grade control data used in MOP were set out in the MOP grade
control procedure. All QC data were imported into AcQuire database and analysed. QAQC protocols
implemented are summarized in Table 11-2.
Table 11-2: Grade Control QAQC Samples for Open Pit Channels
Check | Description | Frequency |
Standards | Rocklabs standards; submitted as pulp to the lab | 1 per 30 samples |
Pulp Replicates | Sample pulps resubmitted blind to the lab | 30 per month |
Internal Lab Checks | Sample randomly selected by lab, per despatch, for repeat analysis | 1 per despatch |
11.3Laboratory Analyses
The standard suite of elements analysed at SGS in Waihi for all exploration drill and RC samples are gold
and silver, although a significant proportion of core is also analysed for copper, arsenic, lead, zinc, and
antimony. Gold is assayed using a 30 g charge for fire assay with AAS finish. Between May 2007 and
September 2014 pulps were assayed by SGS for gold and silver by 30g Aqua Regia digest. From
September 2014 fire assay analyses were conducted on gold only. Over range gold results of >100 g/t are
re-assayed using an increase in dilution for the acid digest prior to instrument finish. Silver is analysed
using a 0.3 g charge and AAS or ICP-MS instrument finish. For all other elements, the samples undergo a
0.3 g Aqua Regia digest followed by an ICP-MS instrument finish.
Generally, elements including mercury, arsenic, selenium, and antimony increase at shallow levels within
epithermal deposits. The presence of sinter and high-level quartz vein textures in the GOP area indicate
that the Resource is at the top of an epithermal system. As a result, multielement data with an extended
suite of elements has been undertaken at ALS Laboratories in Brisbane. Sample preparation was
conducted at SGS Waihi following standardized procedures with a variation to sample drying temperature.
A reduced temperature of 60 °C has been used to limit mercury volatilisation.
A selection of WUG and MUG holes have undergone additional 42 element ICP-MS geochemical
analyses at the ALS laboratory in Brisbane.
Comparison of the Ultratrace data with routine multielement data produced by SGS Laboratory in Waihi
showed good correlation between the parent (SGS) and umpire (Ultratrace) data sets for silver, lead, zinc,
and arsenic, which gives confidence in the accuracy of SGS data for these elements. For samples with
over range silver and lead, these elements are found to be extracted more efficiently by using a more
dilute Aqua Regia digest (one (1)g sample weight rather than the standard 10 g per 50 ml).
11.4Database
All QAQC data is managed in an AcQuire database. Blanks and CRM standards are reviewed on a
weekly basis using AcQuire QAQC objects. Any patterns or concerns regarding sample preparation or
assay quality are discussed directly with the laboratory.
Document ID: STU-063-REP-002-0 Released: 11th December 2024Page 63 of 244
OceanaGold Corporation | ||
NI 43-101 Technical Report – Waihi District Pre-feasibility Study, New Zealand | ||
11.5Sample Security
All drill core is logged at a facility owned by OceanaGold and access onto site is strictly controlled. Core
boxes consist of plastic which provides good protection to the core provided it is stored under cover. All
core is stored in secure designated core sheds in Waihi. OceanaGold employees transport sample bags
containing core samples to the Waihi SGS Laboratory on a daily basis. This laboratory is a secure facility.
11.6Density Determinations
11.6.1MUG
Weight measurements are routinely collected for representative core samples in air and in water during
the logging process. The AcQuire database is set-up to automatically calculate the density from the
measured weights using the formula:
Weight in Air | ||
Weight in Air – Weight in Water |
The density of the host rocks and vein structures in MUG are slightly variable (Table 11-3). The andesitic
host rocks average 2.55 g/cm3 with the maximum recorded at 2.8 g/cm3. Weathering and hydrothermal
clay alteration generally decreases the density while pyrite alteration increases the density. The density of
‘vein’ material in the MUG model is mostly influenced by weathering proximal to historical workings rather
than surface weathering. Minerals present in large percentages within veins are the main factors
contributing to variations in density of vein material, particularly base metals, calcite, and clay content. A
factor of -2 %, was applied to the vein’s density to factor the under calling of vugs and fractures in the
samples.
Table 11-3: Density Values Used in MUG
Domain | Sample Count | Mean Density |
Andesite | 2,321 | 2.43 |
Quartz Andesite | 18,348 | 2.53 |
Vein | 4,024 | 2.50 |
‘Stope fill’ is assigned a density of 1.8 within the Resource estimate. Collapse zones associated with the
‘Milking Cow’ subsidence zone and the MOP wall failure have been assigned a density of 1.9. Fill is
captured in the model via the ‘mined’ variable summarized in Table 11-4.
Document ID: STU-063-REP-002-0 Released: 11th December 2024Page 64 of 244
OceanaGold Corporation | ||
NI 43-101 Technical Report – Waihi District Pre-feasibility Study, New Zealand | ||
Table 11-4: Mined Variable Values Used Around Historical Workings
Mean Variable Value | Material Type | Modifying Factor |
0 | In-situ | As estimated |
1 | Backfilled Stopes | Density of 1.8 and grade modified |
2 | Subsidence or Collapsed Stopes | Density of 1.6 and grade modified |
5 | Open Stope | Density set to zero, grade removed |
6 | Open Development | Density set to zero, grade removed |
7 | Rill Stoping Fill | Density of 1.8 and grade modified |
11.6.2GOP
Applying the same density method from MUG, density samples were collected while being logged and
imported into an AcQuire database (Table 11-5).
Table 11-5: Density values Used in GOP
Domain | Sample Count | Mean SG |
Regolith | 26 | 1.7 |
Dacite | 38 | 1.8 |
Intercalated Volcaniclastics | 17 | 1.9 |
Rhyolitic Tuff | 97 | 1.7 |
Mineralized Domains | 355 | 2.47 |
11.6.3MOP
Dry bulk density testing is carried out in accordance with Water Displacement Method 4 as outlined by
Lipton and Horton in Monograph 30 - Mineral Resource and Ore Reserve Estimation - The AusIMM Guide
to Good Practice (2013). Density data suggests that while there is a relationship between weathering and
density, a stronger relationship is seen between density and relative elevation where density increases at
deeper elevation. Table 11-6 summarises the average of the density values by lithology and elevation.
Table 11-6: Bulk Density Values in MOP
Domain | Sample Count | Mean Bulk Density (g/cm3) |
Quartz Andesite | 332 | 2.45 |
Quartz Vein | 377 | 2.47 |
11.6.4WUG
Dry bulk density testing was completed on 156 samples. Samples were selected using the optimized
stopes shapes to focus on potential mill feed and designed to ensure reasonable geographic coverage of
potential ore domains. Sampled vein density has a minor survivorship bias with intact core being
preferentially sampled, and recovery in vein zones occasionally challenging. A factor of -0.4 % was
applied to the vein’s density to factor the under calling of vugs in the samples as determined by
Document ID: STU-063-REP-002-0 Released: 11th December 2024Page 65 of 244
OceanaGold Corporation | ||
NI 43-101 Technical Report – Waihi District Pre-feasibility Study, New Zealand | ||
comparison of total logged recovery vs. that of samples selected for analysis. Density data collected are
summarized in Table 11-7.
Table 11-7: Bulk Density Values Used in WUG
Domain | Sample Count | Mean Bulk Density (g/cm3) |
Rhyolitic intrusive/flow | 69 | 2.47 |
Hanging wall Veins | 68 | 2.47 |
Footwall Veins | 19 | 2.56 |
11.7Opinion on Adequacy (Security, Sample Preparation, Analysis)
Sample collection, preparation and analysis are according to industry standards. All labs used by
OceanaGold are certified to ISO-9001 standard or 17025 accredited for gold and silver through the
Standards Council of New Zealand. The primary external lab used for check assays at SGS, Waihi is both
ISO-9001 certified and 17025 accredited.
Core, pulp, and RC sample storage are considered secure. Sample transport is by company personnel
between secure facilities and by approved couriers to external labs. No significant risks have been
identified for sample contamination or sample exchange. No samples have been reported as missing
during transport or as tampered with upon receipt at the lab.
All Waihi drillhole data (assays, logs, surveys) are stored in the secure AcQuire database, which is
managed by the senior database specialist in New Zealand. The AcQuire database is an industry certified
database. Database changes are tracked and verified. Strict data importing and verification protocols
must be followed to avoid, for example, overlapping or missing intervals, mismatched hole depths in
different fields, duplicate hole IDs or sample numbers, and invalid logging codes.
In the opinion of the qualified person, the sample security, sample preparation and analyses are adequate
for the purposes of Resource estimation.
Document ID: STU-063-REP-002-0 Released: 11th December 2024Page 66 of 244
OceanaGold Corporation | ||
NI 43-101 Technical Report – Waihi District Pre-feasibility Study, New Zealand | ||
12DATA VERIFICATION
Drill hole data is entered into an AcQuire database interface which includes protocols for validation. All
drill collars, traces and surveys are checked for accuracy in 3D using Vulcan® and Leapfrog® while holes
are being drilled. Once the hole has completed drilling, the collar position is picked up by a qualified
surveyor and updated in AcQuire.
All geological logging is checked and validated by a second geologist on the core bench prior to core
cutting. Logging data is entered into AcQuire by a geologist and then checked for completeness and
errors once it is loaded into AcQuire. Laboratory results are uploaded into an AcQuire database using the
files emailed directly from the laboratory.
Assay results are only successfully uploaded to AcQuire if they pass the QAQC verification. If any of the
QAQC fail the verification, then further investigation is required by the geologist before the results can be
uploaded to the database. Each drillhole has a checklist that needs to be completed before the hole can
be classified as ‘closed out’ in the database.
Geology personnel are well trained and regularly monitored for consistency. Below level detection limit
assay results are stored in the database as (negative) half the detection limit. No other modification of the
assay results is undertaken. Monthly QAQC reporting and review is undertaken on all laboratory assay
results. CRMs performance is regularly scrutinized, and the database QAQC function thresholds are
reviewed bi-annually. CRMs are currently assigned to batches on a rotational roster in a ‘pigeon pair’
system.
A limited number of twinned holes were completed during the initial investigations for Correnso. These
indicated that there is some short-range variability in gold Mineralization. No twinned holes have been
drilled for the other projects. Geologists can recognise strong visual indicators for high-grade
Mineralization observed both in drill core and in underground development.
All intercepts are reviewed during the construction of the geological wireframes prior to grade estimation,
this review involves visual comparison of core photography, assay and logging data and spatial
relationships to adjacent data. Significant intercepts are reported internally on a weekly basis for peer
review purposes.
Data quality verification including check assay programs have been undertaken under the supervision of
the Qualified Person for all exploration and Resource development projects for the last 9 years. Data
quality is routinely assessed during Resource estimation workflows with external review conducted during
milestones such as feasibility level studies.
12.1Internal and External Reviews
A number of internal reviews have taken place to verify data collected for Mineral Resource purposes. A
list of some of these reviews are provided below:
12.1.1Geology and Wireframing
Rhys, DA. 2009 Observations, and exploration recommendations at Newmont exploration properties
Hauraki Goldfield. Unpublished Memo to Newmont Waihi Gold.
Document ID: STU-063-REP-002-0 Released: 11th December 2024Page 67 of 244
OceanaGold Corporation | ||
NI 43-101 Technical Report – Waihi District Pre-feasibility Study, New Zealand | ||
Rhys, DA. 2010 WKP prospect: review of exploration results with recommendations. Unpublished Memo
to Newmont Waihi Gold.
Rhys, DA. 2011 Observations of selected drill core from the WKP prospect (with WKP-30 information
added). Unpublished Memo to Newmont Waihi Gold.
Rhys, DA. 2011. Review of the Structural Setting of the Correnso Vein System, Waihi, New Zealand.
Unpublished Report to Newmont Waihi Gold.
Rhys, DA. 2017. Waihi District geology: continuing contributions to understanding structural setting and
zonation as applied to exploration and mining. Unpublished Memo to OceanaGold.
Rhys, DA. 2020. Review of the structural controls of the WKP prospect. Unpublished Memo to
OceanaGold.
Rhys, DA. 2020. Review of the core logging template for the Martha Underground Project. Unpublished
correspondence to OceanaGold.
Richards, SD. 2019. Review of the WKP vein model using orientation data. Unpublished internal
validation.
Richards, SD. 2023. Review of the WKP vein model. Unpublished internal review.
12.1.2Density
White, T. 2012 Correnso Dry Bulk Density Study. Unpublished Internal Report, Newmont Waihi Gold.
McArthur, F. 2019 WKP SG Data Memo. Unpublished Internal Report. OceanaGold.
Vigour-Brown, W. 2019 Martha Underground SG Memo, Unpublished Internal Report. OceanaGold.
Meyer, N. 2024 Dry Bulk Density Testing MOP5, Unpublished Internal Report, OceanaGold.
Meyer, N 2024 Dry Bulk Density Testing WKP, Unpublished Internal Report, OceanaGold.
12.1.3Assay QAQC and Multielement Geochemistry
Inglis R. 2013. Heterogeneity Study. Unpublished Internal Report, Newmont Waihi Gold.
Barker, S., Hood, S., Hughes, R., Richards, S. 2019. The Lithogeochemical signatures of hydrothermal
alteration in the Waihi epithermal District, New Zealand. New Zealand Journal of Geology and
Geophysics, Vol 62, Issue 4.
Biggalow, J. 2015. Review of multielement geochemistry of Waihi drill data. Unpublished Internal Review.
Newmont.
12.1.4Static and Kinetic Test work
Kirk, A. 2012. Geochemistry of Ore, Tailings and Waste Rock Assessment by URS New Zealand for the
Correnso Underground Mine (Newmont Waihi Gold).
12.1.5Mineralogy
Mauk J. 2009. Petrographic Examination of Samples from the Reptile North and Number Nine Veins,
Waihi. Unpublished Report to Newmont Waihi Gold.
Document ID: STU-063-REP-002-0 Released: 11th December 2024Page 68 of 244
OceanaGold Corporation | ||
NI 43-101 Technical Report – Waihi District Pre-feasibility Study, New Zealand | ||
Mauk, J.L., Hall, C.M., Barra, F., and Chesley, J.T., 2011, Punctuated evolution of a large epithermal
province: The Hauraki goldfield, New Zealand. Economic Geology, v. 106, p. 921–943.
Ross, KV. and Rhys, DA. 2011. Petrographic Study of Representative Samples from the Correnso Vein
System, Waihi District, New Zealand. Unpublished Report to Newmont Waihi Gold.
Menzies A. 2013 QEMSCAN Analysis of Samples from the Waihi District, New Zealand: Correnso.
Unpublished report. Universidad Catolica del Norte, Antofagasta, Chile.
Coote, A. 2011 Petrological Studies of Diamond Core from WKP029 and WKP030, of the WKP South
Project, Coromandel, New Zealand. Unpublished Report to Newmont Waihi Gold
Coote, A. 2012 Petrological Studies of Diamond Core from WKP024 and WKP031, of the WKP
Epithermal Deposit, Coromandel, New Zealand. Unpublished Report to Newmont Waihi Gold.
Simpson, M. 2012 SWIR report for drill holes WKP-24, WKP-27, and WKP-30, Wharekirauponga,
Southern Hauraki Goldfield. Unpublished Report to Newmont Waihi Gold.
12.1.6Hydrology
GWS Limited 2012. Proposed Underground Mining Extensions – Waihi. Assessment of Groundwater
Inflows and Throughflows. Prepared for Newmont Waihi Gold.
12.1.7Mineral Resource Estimation
Allwood, K. Geomodelling Limited 2024. Waihi MUG Resource Estimation Review. Unpublished Memo to
OceanaGold.
De Veth, A. AMC Limited 2022. Report Waihi North – Mining Pre-Feasibility Study (GOP Block Model
Review Final Report). Unpublished Memo to OceanaGold.
De Veth, A. AMC Limited 2022. Report Waihi North – Mining Pre-Feasibility Study (MOP Block Model
Review Final Report). Unpublished Memo to OceanaGold.
Van de Ven, M. and Sterk R. RSC Limited 2020. Data Quality Review: Waihi Martha Underground Project.
Unpublished Memo to OceanaGold.
Van de Ven, M. and Sterk R. RSC Limited 2024. Draft Independent Technical Review of Mineral
Resources, WNP, NZ. Unpublished Memo to OceanaGold.
12.2Opinion on Adequacy (Data Verification)
The QP has reviewed the appropriate reports and is of the opinion that the data verification programs
undertaken on the data collected from the Waihi operations and WNP adequately support the geological
interpretations, the analytical and database quality, and therefore support the use of the data in Mineral
Resource and Mineral Reserve estimation.
Database audits confirm the data are acceptable for use in estimation with no significant database errors
identified.
Document ID: STU-063-REP-002-0 Released: 11th December 2024Page 69 of 244
OceanaGold Corporation | ||
NI 43-101 Technical Report – Waihi District Pre-feasibility Study, New Zealand | ||
13MINERAL PROCESSING AND METALLURGICAL TESTING
The Waihi mill has treated ore sourced from the Martha open pit as well as several nearby underground
ore bodies over the last 35 years. Considerable data and operating experience have been accumulated
over this time and this information has been used to support the design of metallurgical testwork and
process flowsheets for new orebodies.
With the discovery of new orebodies, geometallurgical characterisation has been used to generate
recovery and throughput estimates for inclusion in technical and financial models. To support the
geometallurgical program, a geometallurgical matrix was developed in conjunction with the geology team.
This geometallurgical matrix identified the main gold bearing domains and the minimum number of
composites to be targeted for metallurgical testwork. The starting basis for the metallurgical testwork was
that the existing grind/leach process would be suitable for treatment of the new orebodies.
13.1MUG
The testwork programs completed in 2018, 2019 and 2020 are listed in Table 13-1, Table 13-2, and Table
13-3.
Table 13-1: Testwork Program 2018
Project | Testwork Program |
MUG | Metallurgical composites |
Flotation and Ultra-Fine Grind (FUFG) | Process Engineering Pre-feasibility Study |
Table 13-2: Testwork Program 2019
Project | Testwork Program |
MUG | Metallurgical variability Comminution and water treatment plant (WTP) testing |
Flotation and Ultra-Fine Grind | Variability Locked cycle Diagnostic leach testwork Signature plot testwork |
Table 13-3: Testwork Program 2020
Project | Testwork Program |
MUG | Metallurgical variability Comminution testing |
13.1.1Leach and Flotation Testwork
Prior to 2018, metallurgical test work was completed on 30 composite samples of intercepts from the
various vein structures in the MUG Resource. Twenty-four samples were submitted to the Newmont
Inverness testing facility. Six samples representing the Edward vein were submitted to Ammtec
Document ID: STU-063-REP-002-0 Released: 11th December 2024Page 70 of 244
OceanaGold Corporation | ||
NI 43-101 Technical Report – Waihi District Pre-feasibility Study, New Zealand | ||
Laboratory in Perth. Samples were mostly submitted both as quarter core and as jaw crush reject material
(95 % <7 mm), if both were available.
In 2019, 18 composites from intercepts were submitted to AMML Laboratories in Australia for testing
direct leach performance and 6 composites samples were sent to JKTech for comminution testing.
In 2020, 25 composites samples from intercepts were sent to the OceanaGold Macraes Metallurgical
Laboratory for testing direct leach performance, and 22 composites samples were sent to JKTech for
comminution testing.
Table 13-4 provides an overview of the composite samples used in the three rounds of metallurgical
testwork. Samples were selected to ensure spatial and geological representativeness and, as appropriate,
chemical representativeness.
Table 13-4: Summary of MUG Composite Samples Tested
Vein Structure | Historical (2011) | 2019 | 2020 | Total |
Edward | 18 | 3 | 9 | 30 |
Empire East | 2 | 4 | 10 | 16 |
Martha | 9 | 7 | - | 16 |
Grace | 1 | - | - | 1 |
Royal | - | 4 | 5 | 9 |
Rex | - | 4* | 1 | 5 |
Total | 30 | 22 | 25 | 77 |
*4 Rex samples tested at 75 µm
A review of the composite sample locations relative to the defined Resource and preliminary stope design
identified 50 of the total 77 composites lay in or within 20 m of expected mined areas. These samples
were used in the development of the recovery models for MUG and are summarized in Table 13-5. A total
of 13 historical samples and 16 samples selected in 2019, and 21 samples selected in 2021 have been
located based on the stopes (within a 20 m halo) to be mined over the LoM for the MUG deposit. Bottle
roll tests were completed at three different grinds (38 µm, 53 µm and 75 µm).
Table 13-5: Metallurgical Samples Contained within MUG Stopes
Vein Structure | Historical | 2019 | 2020 | Total |
Edward | 13 | 2 | 9 | 24 |
Empire | - | 4 | 8 | 12 |
Martha | - | 4 | - | 4 |
Grace | - | - | - | - |
Royal | - | 2 | 3 | 5 |
Rex | 4* | 1 | 5 | |
Total | 13 | 16 | 21 | 50 |
Document ID: STU-063-REP-002-0 Released: 11th December 2024Page 71 of 244
OceanaGold Corporation | ||
NI 43-101 Technical Report – Waihi District Pre-feasibility Study, New Zealand | ||
* 4 Rex samples tested at 75 µm
Bottle roll CIL test results for the historical samples are summarized in Table 13-6.
Table 13-6: Gold Extraction Results for Historical Composites
Domain | Hole ID | Calculated gold Grade, Au g/t | As, ppm | Au Extraction (%) | ||
38 µm | 53 µm | 75 µm | ||||
Edward | UW388-1000 | 3.75 | 42 | 96.50 | 95.57 | 94.98 |
Edward | UW388-1000 (Dup) | 4.14 | 50 | 96.52 | 96.20 | 95.17 |
Edward | UW388-1001 | 4.64 | 34 | 97.57 | 96.87 | 96.06 |
Edward | UW388-1001 (Dup) | 4.78 | 33 | 97.34 | 97.02 | 95.83 |
Edward | UW395-1000 | 20.47 | 112 | 97.73 | 97.46 | 96.26 |
Edward | UW395 1000/1001 | 14.83 | 95 | 97.05 | 96.49 | 95.37 |
Edward | UW395-1001 | 10.39 | 67 | 96.58 | 95.78 | 93.88 |
Edward | UW407-1000 | 5.54 | 30 | 97.20 | 95.60 | 94.70 |
Edward | UW407-1001 | 3.34 | 20 | 98.40 | 99.00 | 93.10 |
Edward | UW409-1000 | 12.30 | 60 | 98.00 | 95.50 | 93.40 |
Edward | UW409-1001 | 7.72 | 60 | 97.90 | 94.80 | 93.50 |
Edward | UW411-1001 | 4.95 | 40 | 97.90 | 97.70 | 97.80 |
Edward | UW412-1000 | 1.76 | 30 | 89.06 | 88.08 | 84.83 |
Table 13-7 summarizes gold recovery data at the grind sizes tested for the 2019 samples. The
metallurgical samples tested in 2019 were processed at AMML Laboratories in Australia. The Rex
samples were tested at 75 µm as part of the Variability Leach and Flotation and Ultra fined grind (FUFG)
testwork program.
Document ID: STU-063-REP-002-0 Released: 11th December 2024Page 72 of 244
OceanaGold Corporation | ||
NI 43-101 Technical Report – Waihi District Pre-feasibility Study, New Zealand | ||
Table 13-7: Gold Extraction Results for 2019 Composites
Domain | Hole ID | Assay Head Grade Au g/t | As ppm | Au Extraction (%) | ||
38 µm | 53 µm | 75 µm | ||||
Edward | 920SP9MR1318 | 6.54 | 11.9 | 98.9 | 98.5 | - |
Edward | 920SP9MR1264 920SP9MR1320 | 5.89 | 36.1 | 96.1 | 95.8 | - |
Empire | 920SP7MN1303 | 6.82 | 189 | 87.4 | 89.0 | - |
Empire | 920SP7MN1290 | 4.66 | 111.5 | 92.5 | 91.1 | - |
Empire | 800SP1MR1224 | 5.75 | 48.5 | 97.4 | 96.0 | - |
Empire | 800SP1MN1095 | 5.73 | 185 | 86.4 | 84.0 | - |
Martha | 800SP3MR1227 800SP3MN1188 800SP3MR1300 | 5.00 | 301 | 86.2 | 79.4 | - |
Martha | 800SP1MN1100 800SP1MN1109 800SP1MN1118 800SP1MN1100 800SP1MR1224 | 6.13 | 45.6 | 94.0 | 95.4 | - |
Martha | 800SP1MN1127 800SP1MR1214 | 5.09 | 139.5 | 83.9 | 80.5 | - |
Martha | 800SP1MR1317 800SP1MR1280 800SP2MN1191 800SP1MR1317 | 5.76 | 259 | 82.60 | 78.9 | - |
Royal | 920SP9MN1281 920SP9MN1297 920SP9MN1301 920SP9MN1276 | 5.45 | 178 | 91.9 | 89.5 | - |
Royal | 800DC1RN1246 800DC1RN1240 800DC1RN1255 | 4.35 | 79.2 | 91.3 | 88.5 | |
Rex | UW715 UW725 UW721 920RCCRN1256 920RCCRN1259 920RCCRN1266 UW671 | 3.18 | 10.5 | 93.5 | ||
Rex | UW718 UW712 UW706 | 3.13 | 14.9 | 92.7 | ||
Rex | UW719 UW717 UW679 | 4.79 | 15.9 | 93.6 | ||
Rex | UW667 UW708 UW711 | 4.84 | 46.3 | 91.6 | ||
Document ID: STU-063-REP-002-0 Released: 11th December 2024Page 73 of 244
OceanaGold Corporation | ||
NI 43-101 Technical Report – Waihi District Pre-feasibility Study, New Zealand | ||
Table 13-8 summarises gold recovery data at the grind sizes tested for the 2020 samples. The
metallurgical samples tested in 2020 were processed in-house at Macraes metallurgical laboratory in New
Zealand.
Table 13-8 Gold Extraction Results for 2020 Composites
Domain | Hole ID | Assay Head grade, Au g/t | As, ppm | Au Extraction (%) | ||
38 µm | 53 µm | 75 µm | ||||
Edward | 800DC8MR1476 | 2.09 | 62 | 93.8 | 92.7 | 91.7 |
Edward | 920SP8MR1363 | 3.48 | 75 | 96.1 | 95.8 | 95.4 |
Edward | 800PC2MR1453 | 3.41 | 33 | 96.3 | 95.9 | 94.2 |
Edward | 800DC8MR1436 | 4.34 | 35 | 93.8 | 93.8 | 93.7 |
Edward | 920SP9MR1366 | 4.35 | 70 | 93.0 | 92.2 | 91.0 |
Empire | 800DC7MN1337 | 3.50 | 39 | 95.6 | 93.3 | 90.3 |
Empire | 800DC5MN1345 | 3.80 | 79 | 90.1 | 89.4 | 86.8 |
Empire | 920SP6MN1432 | 3.38 | 51 | 94.6 | 92.2 | 88.7 |
Empire | 920SP4MR1413 | 3.79 | 76 | 91.0 | 90.9 | 92.3 |
Empire | 920SP2MR1326 | 5.55 | 176 | 86.2 | 86.2 | 83.3 |
Empire | 800DC2MR1477 | 3.93 | 95 | 92.8 | 92.8 | 90.2 |
Empire | 920SP7MN1396 | 2.74 | 76 | 91.4 | 91.7 | 87.1 |
Empire | 920SP6MN1446 | 4.61 | 201 | 88.2 | 87.2 | 84.2 |
Royal | 800DC3RN1375 | 3.68 | 91 | 87.1 | 88.3 | 86.5 |
Rex | UW722 | 4.06 | 8 | 97.1 | 96.2 | 95.1 |
Edward | 800RC3MR1442 | 3.6 | 19 | 99.4 | 99.3 | 99.1 |
Edward | 800DC8MR1503 | 3.71 | 22 | 97.4 | 96.9 | 95.6 |
Edward HW | 920SP8MR1315 | 4.51 | 31 | 95.2 | 95.6 | 93.3 |
Edward HW | 920SP9MR1358 | 3.53 | 16 | 96.5 | 95.8 | 94.0 |
Empire | 800DC4MN1540 | 6.19 | 140 | 93.9 | 92.2 | 89.8 |
Royal | 14EMPRN1576 | 4.52 | 223 | 91.7 | 85.3 | 79.7 |
Royal | 800RC3RN1438 | 4.18 | 125 | 89.7 | 88.2 | 83.2 |
Gold extraction results for historical, 2019 and 2020 samples at different grind sizes indicate that a 38 µm
grind size provides the best gold extraction in the laboratory. On average for all metallurgical samples,
gold recovery improvement between 38 µm and 53 µm is 0.70 % for Edward, 0.90 % for Empire, 3.10 %
for Martha, 2.4 % for Royal and 0.90 % for Rex. Plant operating experience has shown that an equivalent
Document ID: STU-063-REP-002-0 Released: 11th December 2024Page 74 of 244
OceanaGold Corporation | ||
NI 43-101 Technical Report – Waihi District Pre-feasibility Study, New Zealand | ||
laboratory gold recovery at a P80 of 38 µm is equivalent to a grind size P80 of 53 µm in the plant. This
relationship is due to the laboratory grind testwork being in open circuit, whereas in the plant the grinding
circuit is in closed-circuit. This results in the higher density sulphides being preferentially ground finer and
hence liberating more gold particles that are disseminated within the sulphides.
Figure 13-1 shows gold extraction (recovery) for the historical, 2019 and 2020 samples tested at a grind
size of 38 µm against calculated gold feed grades indicate a range of recoveries from 89 % to 99 % for
the Edward samples, 83 % to 94 % for Martha samples, 86 % to 97 % for Empire, 87 % to 92 % for
Royal, and 92 % to 94 % for Rex samples. Arsenic grades in the composites ranged from 11 ppm to
301 ppm whilst the grades in the mine schedule are generally in the 30 to 50 ppm range. The chart
highlights the composites tested above and below an 80 ppm grade. In general, gold recovery decreases
with increasing Arsenic grade, a product of fine gold locked in arsenopyrite grains.
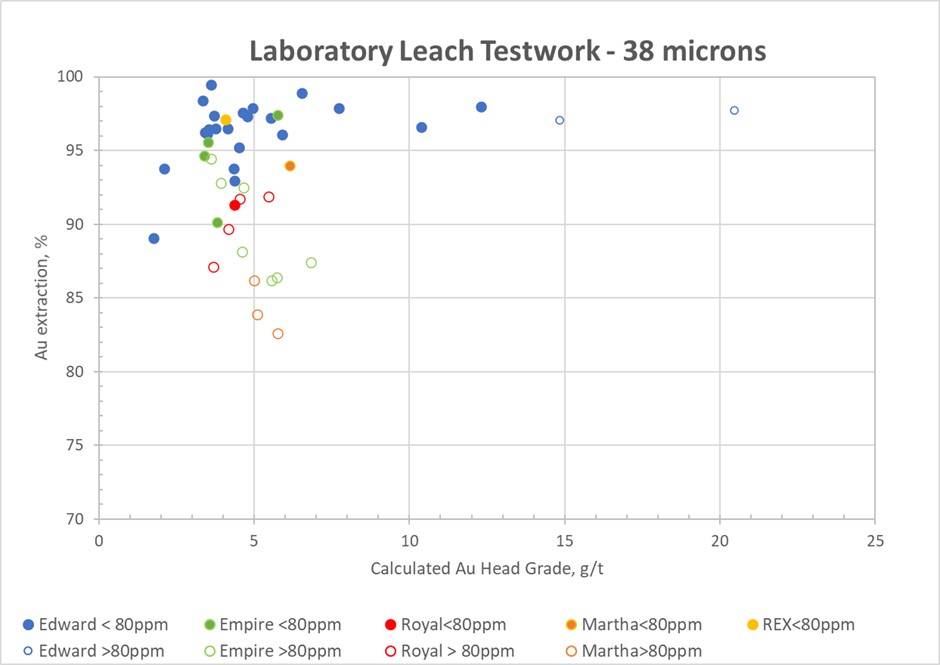
Figure 13-1: Gold Extraction as a Function of Feed Grade
In addition to the leach testwork, flotation testwork was done on 27 samples (Phase 1 - 9 samples, Phase
2 - 18 samples) at a grind size of 75 µm. Results from this testwork indicated that there is little to no
recovery benefit at 1 % sulphur grade. At an overall grade of 1.11 % sulphur recovery benefits is less than
1 %. Sensitivity analysis on the incremental financial model shows a 3.4 % improvement benefit is
needed to generate an economic return. At this recovery benefit the net present value (NPV) is neutral. To
generate an overall benefit of 3.4 % recovery the sulphur model indicates that the overall grade should be
1.7 % total sulphur. For MUG there is insufficient material from underground to make FUFG economically
beneficial as the overall average sulphur grade is only 1.1 %.
Document ID: STU-063-REP-002-0 Released: 11th December 2024Page 75 of 244
OceanaGold Corporation | ||
NI 43-101 Technical Report – Waihi District Pre-feasibility Study, New Zealand | ||
13.1.2Comminution Testwork
Ore characterisation on historical samples from MUG in 2011 indicated that the MUG ore is considered
medium competency for SAG milling with Axb of 41.9, and a high Bond Ball Work Index (BBWI) of
19.2 kWh/t. Table 13-9 shows historical results from testwork conducted in 2011.
Table 13-9: Historical Comminution Results on Ore from MUG -2011
Sample | Sample ID | DWI | Axb | SG | BBWI (kWh/t) |
Edward | UW240-1003 | 6.29 | 40.8 | 2.55 | 17.3 |
Edward | UW367-1000 | 5.35 | 48.4 | 2.60 | 17.0 |
Edward | UW407-1000 | 5.83 | 42.8 | 2.48 | 18.7 |
Edward | UW407-1001 | 5.31 | 47.1 | 2.49 | 19.5 |
Edward | UW409-1000 | 5.87 | 42.9 | 2.50 | 17.7 |
Edward | UW409-1001 | 5.66 | 44.3 | 2.50 | 19.2 |
Edward | UW411-1001 | 4.81 | 53.7 | 2.57 | 19.7 |
Edward | UW412-1000 | 7.36 | 33.9 | 2.46 | 18.8 |
Empire East | UW240 | 4.39 | 60.7 | 2.67 | 14.8 |
MUG | WHD188 | 6.03 | 41.9 | 2.54 | 17.7 |
Grace | UW210 | 4.81 | 55.8 | 2.67 | 16.4 |
75th percentile | 6.03 | 41.9 | 2.60 | 19.2 |
Six samples from MUG were submitted in 2019 for comminution testing to the JKTech testing facilities in
Brisbane, Australia. Comminution testing consisted of SMC, Bond Rod Mill and Bond Ball Mill work
indices, and bond abrasion index. The selected samples represent Mineralization to be mined from four
vein structures at MUG. Samples were submitted as quarter core (1/2 HQ).
The comminution test results are summarized in Table 13-10. The characterisation conducted on the
Waihi mill feed sources has indicated that MUG Mineralization is very competent for SAG milling (75th
percentile Axb 33.2) and hard to grind in ball mill (BBWI 21.0 - 25.2 kWh/t).
Document ID: STU-063-REP-002-0 Released: 11th December 2024Page 76 of 244
OceanaGold Corporation | ||
NI 43-101 Technical Report – Waihi District Pre-feasibility Study, New Zealand | ||
Table 13-10: Summary of Comminution Testing of 2019 MUG Mineralization Samples
Sample | DWI | Axb | SG | BBWI | BRWI | BAI |
Edward | 7.67 | 34.1 | 2.58 | 22.5 | 15.4 | 0.3966 |
Empire | 8.55 | 30.7 | 2.61 | 21.0 | 16.1 | 0.3458 |
Martha 1 | 6.70 | 37.1 | 2.51 | 23.5 | ||
Martha 2 | 6.75 | 38.2 | 2.59 | 25.2 | 14.0 | 0.3537 |
Royal 1 | 6.60 | 36.9 | 2.43 | 22.2 | ||
Royal 2 | 6.66 | 37.9 | 2.53 | 23.4 | 15.7 | 0.2418 |
75th percentile | 7.89 | 33.2 | 2.60 | 23.9 | 16.0 | 0.3859 |
Twenty-two samples were selected in 2020 from MUG for comminution variability testing. Samples
comprised of quartered HQ drill core from various domains of the MUG deposit. Samples were selected
based on the geometallurgical matrix in conjunction with the geology team to identify the main gold
bearing domains and to indicate the minimum number of composites to be targeted for metallurgical
testing. Sample selection was based on core availability for the MUG ore, spatial distribution within each
of the MUG vein structures, and representativeness of average gold grades over the LoM.
Table 13-11 presents ore characteristics for the 2020 comminution samples. The comminution results
from 2020 indicate that the MUG Mineralization is moderately competent for SAG milling (Axb 39.4 - 75th
percentile) and that the ore is hard with a BBWI of 17.2 kWh/t.
Document ID: STU-063-REP-002-0 Released: 11th December 2024Page 77 of 244
OceanaGold Corporation | ||
NI 43-101 Technical Report – Waihi District Pre-feasibility Study, New Zealand | ||
Table 13-11: Summary of Comminution Testing of 2020 MUG Mineralization Samples
Sample | DWI | Axb | SG | BBWI | BRWI | BAI |
Edward 1 | 4.45 | 57.5 | 2.56 | 16.6 | 12.9 | 0.5856 |
Edward 2 | 5.58 | 46.0 | 2.57 | 16.5 | 14.6 | 0.5353 |
Edward 3 | 5.51 | 46.6 | 2.58 | 15.7 | 14.0 | 0.7033 |
Edward 4 | 5.97 | 43.4 | 2.58 | 17.0 | 14.5 | 0.6846 |
Edward 5 | 6.17 | 41.7 | 2.57 | 15.6 | 15.3 | 0.6923 |
Edward 6 | 6.24 | 41.0 | 2.57 | 16.8 | 14.4 | 0.428 |
Edward 7 | 6.34 | 40.7 | 2.59 | 17.2 | 14.9 | 0.5585 |
Edward 8 | 4.99 | 51.2 | 2.55 | 16.4 | 12.7 | 0.6122 |
Edward 9 | 7.74 | 33.0 | 2.59 | 20.0 | 15.2 | 0.5234 |
Empire 1 | 5.69 | 45.1 | 2.55 | 17.1 | 14.2 | 0.6829 |
Empire 2 | 5.18 | 49.7 | 2.59 | 16.0 | 13.9 | 0.4983 |
Empire 3 | 6.63 | 39.1 | 2.6 | 17.0 | 14.4 | 0.5865 |
Empire 4 | 6.95 | 36.2 | 2.53 | 17.4 | 15.5 | 0.4159 |
Empire 5 | 5.81 | 44.3 | 2.59 | 17.5 | 14.3 | 0.5225 |
Empire 6 | 5.55 | 46.3 | 2.56 | 16.6 | 14.4 | 0.4056 |
Empire 7 | 7.29 | 35.7 | 2.6 | 16.2 | 14.8 | 0.626 |
Empire 8 | 8.40 | 34.9 | 2.92 | 16.7 | 15.3 | 0.6562 |
Empire 9 | 6.08 | 42.1 | 2.58 | 18.4 | 14.0 | 0.4833 |
Empire 10 | 6.30 | 41.4 | 2.6 | 20.3 | 14.6 | 0.3723 |
Empire 11 | 5.93 | 42.3 | 2.5 | 17.1 | 15.5 | 0.715 |
Rex 1 | 6.55 | 39.6 | 2.58 | 16.2 | 14.6 | 0.6149 |
Royal 1 | 6.38 | 39.7 | 2.52 | 17.2 | 13.3 | 0.5993 |
75th percentile | 6.57 | 39.4 | 2.59 | 17.2 | 15.0 | 0.6629 |
Table 13-12 shows the combined results from the 2019 and 2020 comminution testwork programs. These
results indicate that the MUG Mineralization is moderately competent (Axb 36.9) and hard for ball milling
with a bond ball work index of 20.2kWh/t. The tested samples also showed to be highly abrasive with a
Bond Abrasion index of 0.63.
2 The Au recovery model developed for Edward did not include results for samples with gold grades >7 g/t.
3 The Au recovery model developed for Rex was based on leach testwork data at a grind size P80 75 µm as there were no tests
conducted at 38 µm.
Document ID: STU-063-REP-002-0 Released: 11th December 2024Page 78 of 244
OceanaGold Corporation | ||
NI 43-101 Technical Report – Waihi District Pre-feasibility Study, New Zealand | ||
Table 13-12: Combined Comminution Testing results 2019 and 2020
Sample | DWI | Axb | SG | BBWI | BRWI | BAI |
75th percentile | 6.74 | 36.9 | 2.59 | 20.2 | 15.3 | 0.6336 |
The SMC test results can be used to estimate specific power requirements for the MUG ore using the
comminution parameters derived from these tests. Based on the power-based model developed by
Morrell, the SAG mill specific power is estimated at 10.4 kWh/t (75th percentile) and the ball mill specific
power is 22.1 kWh/t (75th percentile).
The 75th percentile comminution results from 2019 and 2020 were used in the Waihi comminution circuit,
a primary grind size of 80 % passing 53 µm was utilized for the primary grind for the MUG feed. The
existing grinding circuit is capable of processing MUG ores over the LoM.
13.1.3Recovery Estimates and Assumptions
The recovery models developed for each of the vein structures provided below are based on the leach
testwork results conducted on the historical, 2019 and 2020 samples. Multiple Linear Regression (MLR)
was used to predict gold recovery with the explanatory variables being gold head grade and arsenic
content in the feed. Table 13-13 provides the recovery models developed for Edward, Empire, Martha,
Royal and Rex domains.
Table 13-13: MUG Recovery Models
Domain | Recovery |
Edward2 | Recovery (%) = 97.14 + (0.40 * Au ppm) – (0.068 * As ppm), r2=0.38 |
Empire | Recovery (%) = 93.74 + (1.33 * Au ppm) – (0.081 * As ppm), r2=0.90 |
Martha | Recovery (%) = 76.41 + (2.68 * Au ppm) – (0.024 * As ppm), r2=0.55 |
Royal | Recovery (%) = 80.25 + (1.41 * Au ppm) + (0.023 * As ppm), r2=0.96 |
Rex 3 | Recovery (%) = 91.92 + (0.78 * Au ppm) - (0.092 * As ppm), r2=0.87 |
The gold recovery models developed for MUG deposit are used to forecast gold recovery in the mine
schedule on a yearly basis. Applying the recovery models to the mine schedule indicates the gold
recovery for MUG Mineral Reserve is 95 %.
Document ID: STU-063-REP-002-0 Released: 11th December 2024Page 79 of 244
OceanaGold Corporation | ||
NI 43-101 Technical Report – Waihi District Pre-feasibility Study, New Zealand | ||
Recovery is correlated to both gold and arsenic head grades with gold present in arsenopyrite identified
previously as being finer grain size than the majority present in ore. High arsenic levels yield a lower
recovery in the tested composites over the range from 8 to 301 ppm and highlighted in Figure 13-2.
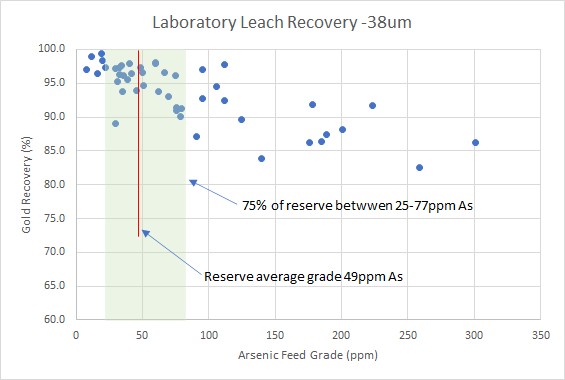
Figure 13-2: Arsenic Grade / Recovery Relationship
A review of the methodology used to estimate the metallurgical recoveries and testwork was undertaken
by G Butcher Consulting Pty Ltd which endorsed the laboratory testing and mathematical modelling
methods used to develop the recovery algorithms and that the selection of sampling locations and the
representivity of the ore domains appears to have been undertaken with diligence, although additional
sampling and testing of the Rex and Royal domains is recommended to improve the confidence of the
models developed to date.
13.2MOP
MOP metallurgical recovery of gold is estimated at 90% and silver recovery is estimated at 63 % based
on the process plant performance and reconciliations over the last 35 years of operation. Throughput and
gold recovery data from the last open pit campaign through the Martha mill in 2013-14 is shown below in
Document ID: STU-063-REP-002-0 Released: 11th December 2024Page 80 of 244
OceanaGold Corporation | ||
NI 43-101 Technical Report – Waihi District Pre-feasibility Study, New Zealand | ||
Figure 13-3 with the monthly reconciled recovery of 90% achieved or exceeded. The proposed cutback
will expose mineralization at similar or higher levels during the first five (5) years of open pit operation.
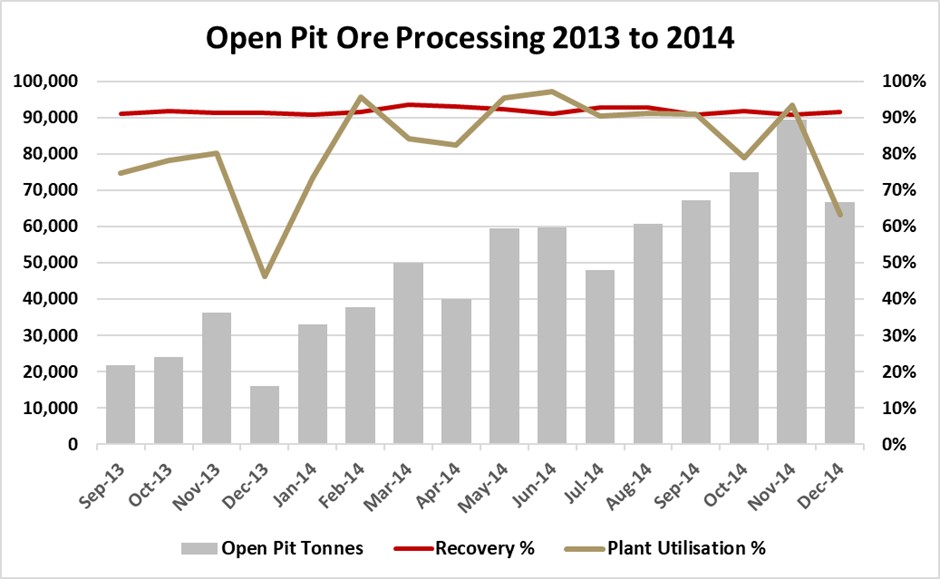
Figure 13-3: Historical Open Pit Performance
13.3GOP
Laboratory scale test work has been conducted on the drill hole samples obtained for the GOP Mineral
Resource. The key focus of the metallurgical work has been to derive gold recovery, throughput rates,
reagent consumption and to confirm the suitability of current plant configuration. This test work has shown
the GOP mineralization to be amenable for processing via the existing Waihi treatment plant flowsheet.
Recovery is shown to vary with the weathering extent of the GOP mineralization. The weathered domain
achieves higher recoveries than the primary un-weathered domain. Separate recovery relationships have
been defined for the weathered and un-weathered domains. A small separate metallurgical domain
characterized by the hydrothermal breccia host rock was also identified.
A grind size of P80 of 90 µm has been selected, as plant operating experience has shown that this is
equivalent to a laboratory gold recovery at a P80 of 75 µm. The gold and arsenic relationship identified in
Correnso Resource is not observed in the GOP Resource. The statistically significant drivers of recovery
within the GOP Resource are weathering and gold head grade. The recovery estimate from the testwork
is calculated at a P80 of 75 µm (see Table 13-14).
Document ID: STU-063-REP-002-0 Released: 11th December 2024Page 81 of 244
OceanaGold Corporation | ||
NI 43-101 Technical Report – Waihi District Pre-feasibility Study, New Zealand | ||
Table 13-14: Recovery Estimate
Testwork | Recovery |
Weathered | Recovery % = 100 * (0.902 – (0.049 / Head grade Au)) |
Un-weathered | Recovery % = 100 * (0.85 – (0.452 / Head grade Au)) |
Hydrothermal Breccia | Recovery % = 74% |
This relationship predicts an average recovery for the GOP Resource of 71 % based on the average
Mineral Resource grade of 1.49 g/t Au. An average process recovery of 71 % has been used for GOP
based on leaching testwork.
Four samples were submitted for comminution testing to the JKTech facilities in Brisbane, Australia.
Comminution testing consisted of SMC and Bond ball mill work index. The selected samples represent
mineralization to be mined from four domains in GOP. Samples were submitted as quarter core (1/2 HQ).
The comminution test results are summarized in Table 13-15. The characterisation conducted on the GOP
mineralization has indicated that the material is classified as ‘moderately soft’ to “medium” in terms of
SAG mill competency (average Axb 47.1). The weathered material had the softest BBWI of 17.2 kWh/t
and it is categorized as ‘hard’, the three remaining samples are considered very hard (BBWI 20.9 –
22.6 kWh/t).
Table 13-15: Comminution Testing of GOP Mineralization Samples
Parameter | HBX | Un-weathered A | Un-weathered B | Weathered | Average |
Axb | 56.6 | 47.8 | 41.2 | 42.9 | 47.1 |
SG | 2.49 | 2.69 | 2.58 | 2.54 | 2.58 |
DWI | 4.39 | 5.62 | 6.26 | 5.93 | 5.55 |
BBWI | 20.9 | 22.6 | 21.3 | 17.2 | 20.5 |
The comminution results provided in Table 13-15 were applied to a comminution circuit similar to the
current Waihi circuit, and for mill sizing. A primary grind size of 80 % passing 75 µm was utilized for the
primary grind design for GOP Mineralization.
The GOP orebody contains significant levels of mercury at levels higher than currently experienced in the
mill (up to 4 g/t Hg). Deportment surveys on laboratory leach tests and plant surveys on MUG feed have
been conducted to estimate the portion of mercury that is likely to report to the elution and gold room
circuits. Data from these surveys has been used to design a retort system to capture mercury in the gold
room and minimise occupational and environmental exposure.
13.4WUG
Economic gold Mineralization at WUG is hosted within quartz vein structures as either silica associated
free gold or with minor occurrences of sulphide minerals, notably pyrite and arsenopyrite. It is similar in
nature to that observed with other underground deposits at Waihi such as Favona, Correnso and MUG,
the main difference being hosted in Rhyolite rather than Andesite.
Document ID: STU-063-REP-002-0 Released: 11th December 2024Page 82 of 244
OceanaGold Corporation | ||
NI 43-101 Technical Report – Waihi District Pre-feasibility Study, New Zealand | ||
The silica associated gold is readily leached via conventional grinding and cyanide leaching flowsheets.
The sulphide associated gold appears to be leachable via similar flowsheets, but recovery is dependent
on grind size as the inclusion size of gold within the sulphides appears to be significantly finer than that in
silica based on response to the various flowsheet options and grind sizes tested. Higher levels of
arsenopyrite will lead to higher residue grades due to unliberated gold inclusions at economic grind sizes.
The geological interpretation of the Wharekirauponga deposit has developed over time as the drilling
program had progressed. Overall, the metallurgical program has classified the deposit into three main
geometallurgical domains mainly the main EG vein, the footwall veins, and the hanging wall veins.
Classification of metallurgical composites has identified the domain it resides in and in some cases the
domain has changed with reinterpretation.
13.4.1Leach Testwork
A total of 6 testwork programs have been undertaken on samples from the Wharekirauponga deposit
since 2017. The first three programs investigation various flowsheet options considering direct leach at
several grind sizes, production of a sulphide flotation concentrates for further processing, flotation and
ultrafine grinding followed by cyanide leach. A total of 10 composites were prepared in the 2018 programs
and a further 6 in the 2019 program with the source holes and domain structures (Table 13-16 and Table
13-17).
Table 13-16: 2018 Wharekirauponga Composite Locations
Composite # | Metallurgical Samples | ||
Hole ID | Sample No | Vein Structure | |
WKP-MET-001 | WKP40 | WKP40-0492-0500.8 | EG Vein |
WKP-MET-002 | WKP42 | WKP42-0430.5-0440 | EG Vein |
WKP-MET-003 | WKP50 | WKP50-0403-0406 | EG Vein |
WKP50-0413-0415 | |||
WKP-MET-004 | WKP52 | WKP52-0550 | FW Vein |
WKP55 | WKP55-0363-0364 | FW Vein | |
WKP55 | WKP55-0307 | FW Vein | |
WKP-MET-005 | WKP50 | WKP0087, WKP50-0093,0094 | HW Vein |
WKP-MET-006 | WKP35 | WKP35-576.4-587.2 | EG Vein |
WKP-MET-0077 | WKP44 | WKP44-0410-0422 | EG Vein |
WKP-MET-008 | WKP53 | WKP53-0677-0689 | EG Vein |
WKP-MET-009 | WKP56 | WKP56-0348-0356 | EG Vein |
WKP-MET-010 | WKP57 | WKP57-0341-0349 | EG Vein |
Document ID: STU-063-REP-002-0 Released: 11th December 2024Page 83 of 244
OceanaGold Corporation | ||
NI 43-101 Technical Report – Waihi District Pre-feasibility Study, New Zealand | ||
Table 13-17: 2019 Wharekirauponga Composite Locations
Composite # | Metallurgical Samples | ||
Hole ID | Sample No | Vein Structure | |
WKP-MET-010 | WKP54 | WKP054-0582-0596 | EG Vein |
WKP-MET-010 | WKP60-1 | WKP60-0465-0475 | EG Vein |
WKP-MET-010 | WKP60-2 | WKP60-0570-0577 | FW Vein |
WKP-MET-010 | WKP61 | WKP61-0387-0394 | EG Vein |
WKP-MET-010 | WKP63 | WKP63-0527-0545 | FW Vein |
WKP-MET-010 | WKP65 | WKP65-0491-0505 | EG Vein |
Testing on the 2018 composites was completed by ALS Metallurgy in Perth, Australia and included:
•Head assay and screen fire assay
•Gravity gold recovery at 106 µm grind size
•Cyanide leach of both gravity concentrate and gravity tails
•Sulphide flotation and leaching of flotation products.
Head Grade analysis is outlined in Table 13-18 below and indicate a gold head grade ranging from 4.2 g/t
to 50.6 g/t for the main EG Vein samples. Total sulphur head grades range up to 1.82 % sulphur and
arsenic grades range up to 580 ppm, similar ranges to the Correnso north deposit processed at Waihi.
Document ID: STU-063-REP-002-0 Released: 11th December 2024Page 84 of 244
OceanaGold Corporation | ||
NI 43-101 Technical Report – Waihi District Pre-feasibility Study, New Zealand | ||
Table 13-18: Wharekirauponga Composite Head Assay Results
Composite # | Au g/t FA | Ag g/t | As ppm | Hg ppm | SiO2, % | S Total, % |
WKP-MET-001 | 7.53 | 10 | 15 | <0.1 | - | - |
WKP-MET-002 | 26.0 | 35 | 325 | 0.8 | - | - |
WKP-MET-003 | 9.47 | 8 | 100 | <0.1 | 88.4 | 0.42 |
WKP-MET-004 | 4.83 | 4 | 270 | 2.9 | 82.0 | 1.34 |
WKP-MET-005 | 4.54 | 16 | 30 | 0.1 | 89.2 | <0.02 |
WKP-MET-006 | 4.20 | 11.4 | 580 | 0.4 | 80.8 | 1.82 |
WKP-MET-007 | 4.60 | 5.4 | 350 | 0.1 | 84.6 | 0.52 |
WKP-MET-008 | 7.00 | 4.5 | 80 | <0.1 | 89.0 | 0.26 |
WKP-MET-009 | 5.21 | 6.9 | 390 | 0.5 | 80.4 | 1.74 |
WKP-MET-010 | 7.67 | 12.9 | 110 | 0.2 | 81.6 | 0.86 |
WKP-MET-011 | 50.6 | 98 | 230 | <0.1 | 82.0 | 0.36 |
WKP-MET-012 | 19.4 | 26 | 80 | <0.1 | 90.2 | 0.28 |
WKP-MET-013 | 13.1 | 24 | 540 | 1 | 86.4 | 2.06 |
WKP-MET-014 | 17.7 | 62 | 140 | 0 | 82.8 | 0.74 |
WKP-MET-015 | 62.8 | 88 | 30 | <0.1 | 87.6 | 0.04 |
WKP-MET-016 | 22.6 | 24 | 170 | <0.1 | 84.8 | 0.62 |
Gravity concentrates were produced using a laboratory gravity concentrate with the concentrate subject to
intensive cyanide leach conditions and the gravity tail subject to standard leach conditions. The combined
leach recoveries are indicative of that expected from a conventional gold processing flowsheet.
Table 13-19 shows results from the 2018 composites indicating that gravity gold recovery ranged from
8.1 % to 41 % averaging 18.4 % for the EG Vein samples at either 53 µm or 106 µm grind size. The
relatively low gravity recovery results and screen fire assay results suggest the majority of the gold is
present as fine particles.
The average gold recovery from leaching on the main EG Vein samples (composites 1, 2, 3, 7, 8, 9, and
10) averages 90.7 % and suggests the majority of the EG Vein material can be regarded as free milling.
The lower recovery experienced in composites 4 and 6 may be attributable to the higher sulphur feed
grade and likely partially refractory locked in sulphides.
Document ID: STU-063-REP-002-0 Released: 11th December 2024Page 85 of 244
OceanaGold Corporation | ||
NI 43-101 Technical Report – Waihi District Pre-feasibility Study, New Zealand | ||
Table 13-19: 2018 Composite Gold Recovery Results
Composite # | Calculated Au Grade, g/t | Au/Ag ratio | P80, µm | Gravity Au Recovery, % | Total Au Recovery (%) | |
53 µm | 106 µm | |||||
WKP-MET-001 | 7.96 | 1.0/1.2 | 106 | 35.1 | 95.5 | |
WKP-MET-002 | 28.7 | 1.0/1.2 | 53 | 15.1 | 89.5 | |
WKP-MET-003 | 9.78 | 1.0/1.4 | 53 | 25.0 | 89.3 | |
WKP-MET-004 | 5.08 | 1.0/1.6 | 53 | 8.1 | 66.4 | |
WKP-MET-005 | 4.46 | 1.0/1.4 | 53 | 12.5 | 80.9 | |
WKP-MET-006 | 3.78 | 1.0/2.7 | 106 | 11.5 | 68.8 | |
WKP-MET-007 | 5.35 | 1.0/1.2 | 106 | 10.9 | 91.2 | |
WKP-MET-008 | 6.65 | 1.0/0.6 | 106 | 41.0 | 95.8 | |
WKP-MET-009 | 5.72 | 1.0/1.3 | 106 | 9.7 | 84.3 | |
WKP-MET-010 | 7.58 | 1.0/1.7 | 106 | 15.5 | 89.1 | |
Average | 90.7 | |||||
The 2019 composites examined the effect of grind size on overall recovery with average recovery
increasing to 94.3 % at a 38 µm grind in the laboratory. In Waihi ores typically higher recoveries are
achieved with decreasing grind size from liberation of fine gold present in sulphide particles. The recovery
results for these composites are shown below in Table 13-20 indicating a 1.4 % improvement in overall
gold recovery from grinding from 53 µm down to 38 µm.
Table 13-20: 2019 Composite Gold Recovery Results
Composite # | Calculated Au Grade, g/t | Au/Ag ratio | Total Au Recovery (%) | ||||
38 µm | 53 µm | 75 µm | 90 µm | 106 µm | |||
WKP-MET-011 | 50.7 | 1.0/1.9 | 95.3 | 92.6 | 91.1 | ||
WKP-MET-012 | 19.1 | 1.0/1.3 | 96.6 | 94.7 | 93.6 | 91.8 | 90.6 |
WKP-MET-013 | 13.2 | 1.0/1.8 | 85.9 | 86.1 | |||
WKP-MET-014 | 18.9 | 1.0/2.8 | 96.1 | 96.2 | 96.5 | 95.0 | |
WKP-MET-015 | 59.7 | 1.0/1.5 | 95.5 | 93.4 | 93.4 | 91.6 | |
WKP-MET-016 | 23.1 | 1.0/1.0 | 96.2 | 94.6 | 92.3 | 91.0 | |
Process Plant operating experience has shown that an equivalent laboratory gold recovery at a P80 of
38 µm is equivalent to a grind size P80 of 53 µm in the plant. This relationship is due to the laboratory
grind test work being in open circuit, whereas in the plant the grinding circuit is in closed circuit. This
results in the higher density sulphides being preferentially ground finer from the cyclone classification and
hence liberating more gold particles that are disseminated within the sulphides.
Document ID: STU-063-REP-002-0 Released: 11th December 2024Page 86 of 244
OceanaGold Corporation | ||
NI 43-101 Technical Report – Waihi District Pre-feasibility Study, New Zealand | ||
Diagnostic leach tests were completed on direct leach tailings samples for 10 of the composites from the
EG Vein. The results show there is little free milling gold remaining in the tails (6 %) that would be
recoverable with longer leach residence time. Up to 32 % of the gold in tailings appears to be silica locked
and given the high silica head grade is unlikely to be recoverable via leaching or flotation without further
grinding to liberate the locked gold. Unleached gold locked with sulphide minerals represents 61 % of the
total gold lost to tailings. The sulphide minerals may be recovered through sulphide flotation. Preliminary
flotation testwork conducted at 75 µm on the EG Vein has indicated no significant recovery benefits when
compared to direct cyanidation at a grind size of 38 µm (i.e., 92 % (flotation) vs 96 % (direct cyanidation)).
A geometallurgical matrix was prepared based on the three main structures (the EG Vein, hanging wall
and footwall) and for low, medium, and high-grade bins to allow selection of 16 composites for the fourth
program in 2020 focusing on direct leach performance from 38 to 75 µm (Table 13-21, Table 13-22, and
Table 13-23). This program was undertaken in house by OceanaGold utilising the Macraes metallurgical
laboratory facilities and Waihi metallurgical resources.
Table 13-21: 2020 WUG Au Geometallurgical Matrix – Mass Balance
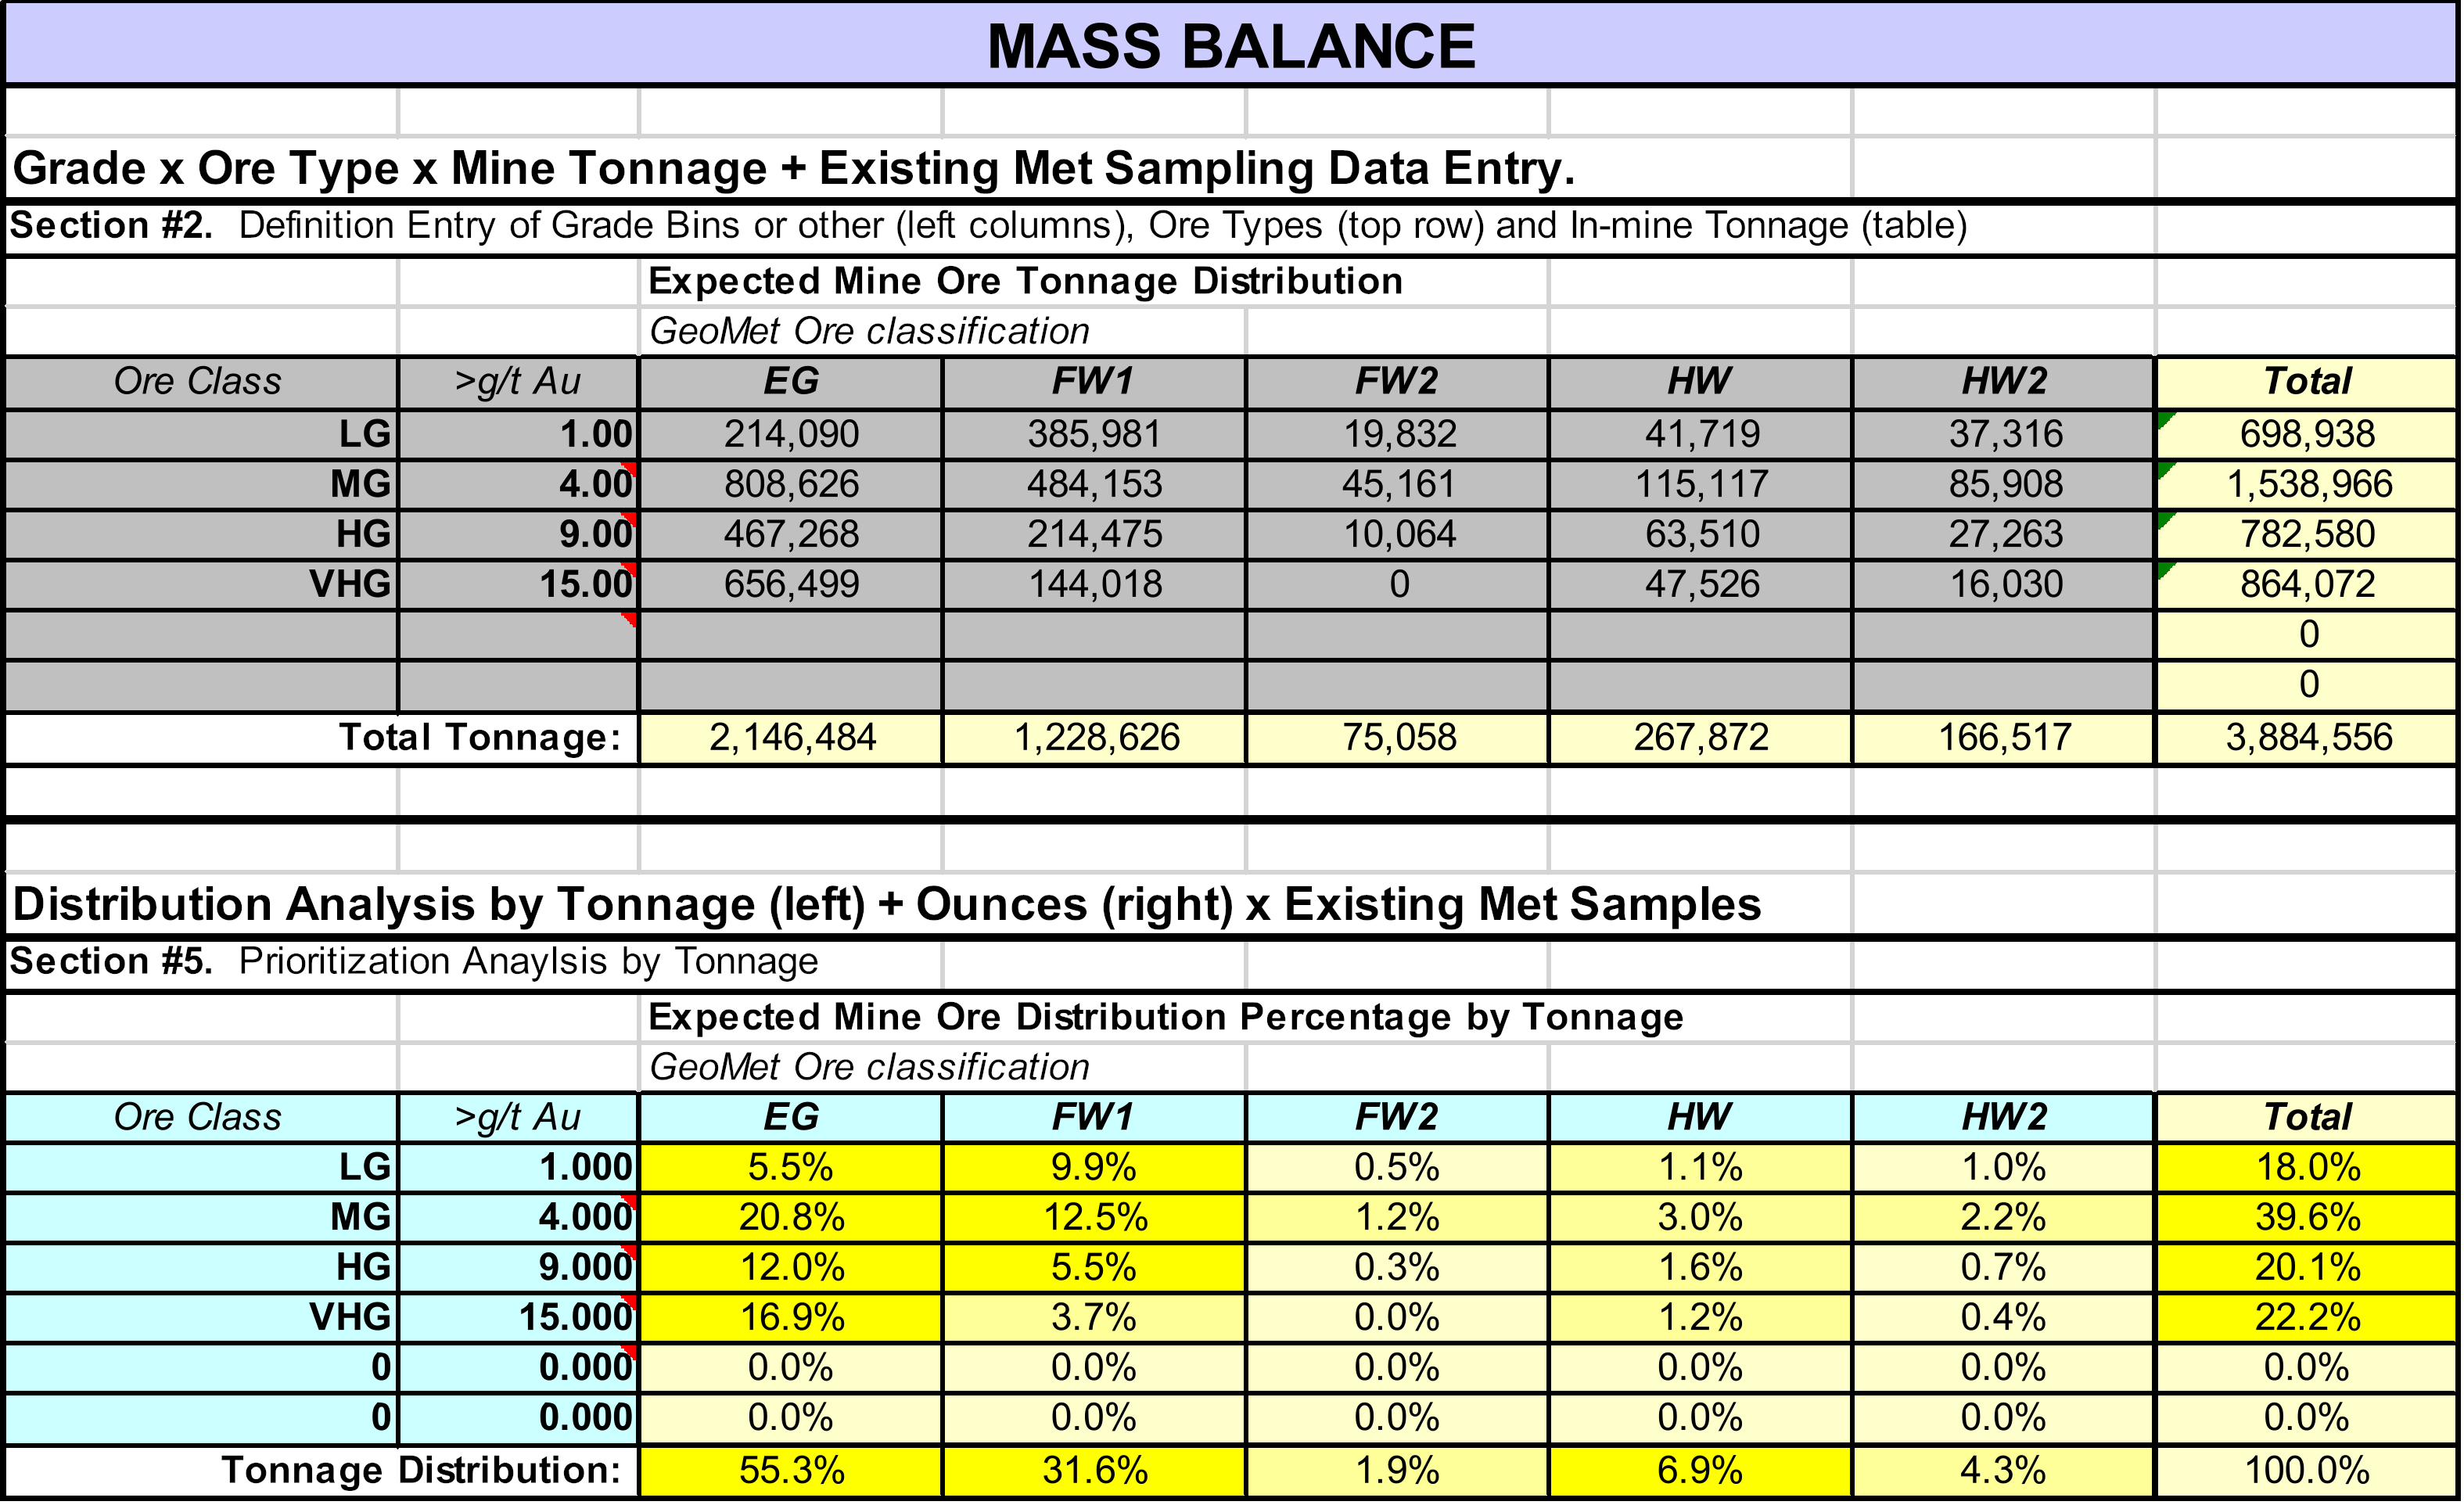
Document ID: STU-063-REP-002-0 Released: 11th December 2024Page 87 of 244
OceanaGold Corporation | ||
NI 43-101 Technical Report – Waihi District Pre-feasibility Study, New Zealand | ||
Table 13-22: 2020 WUG Au Geometallurgical Matrix – Gold Balance
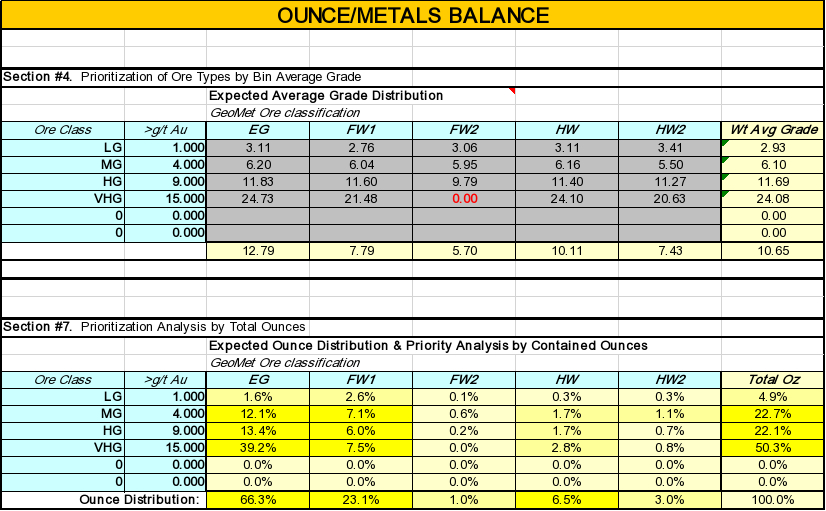
Document ID: STU-063-REP-002-0 Released: 11th December 2024Page 88 of 244
OceanaGold Corporation | ||
NI 43-101 Technical Report – Waihi District Pre-feasibility Study, New Zealand | ||
Table 13-23: 2020 WUG Au Geometallurgical Matrix
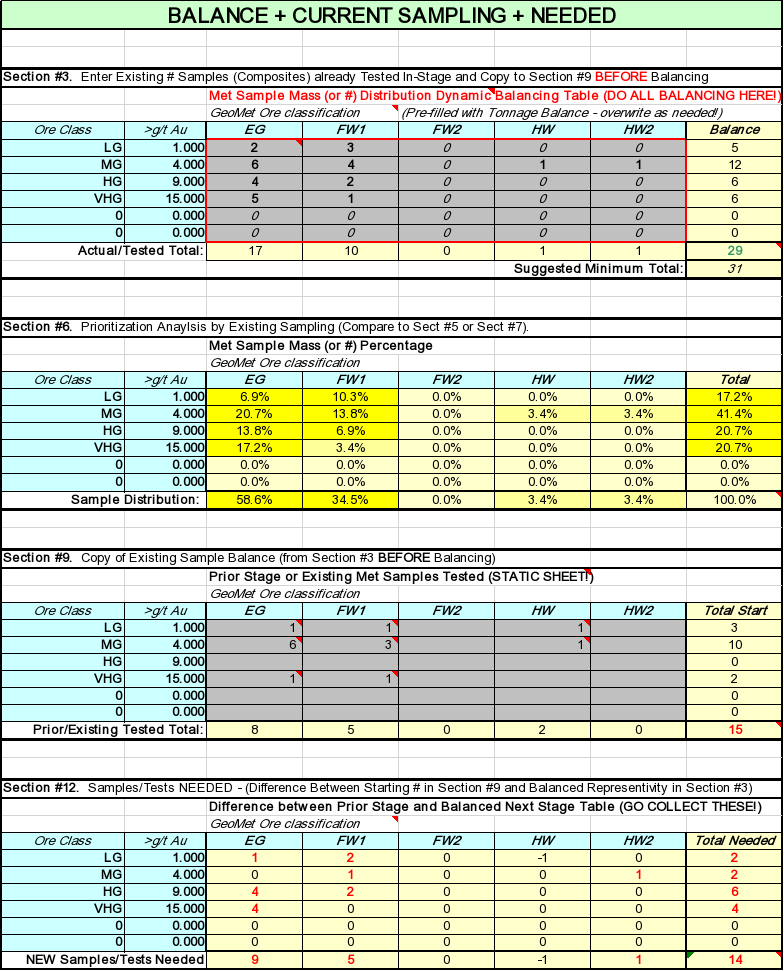
The results of the 2020 direct leach testwork are shown below in Table 13-24 for the 38 µm grind which
provided the highest leach recovery relative to the 53 and 75 µm grind sizes.
Document ID: STU-063-REP-002-0 Released: 11th December 2024Page 89 of 244
OceanaGold Corporation | ||
NI 43-101 Technical Report – Waihi District Pre-feasibility Study, New Zealand | ||
Table 13-24: 2020 Composite Gold Recovery Results
Composite ID | Structure | Au | Ag | As | Au Recovery | Au Residue | Ag Recovery |
ID | g/t | g/t | g/t | % | g/t | % | |
WKP-MET-032 | EG Vein | 6.7 | 5.8 | 69 | 93.2 | 0.42 | 85.2 |
WKP-MET-033 | EG Vein | 7.6 | 31 | 59 | 92.9 | 0.48 | 79.3 |
WKP-MET-034 | EG Vein | 3.1 | 10.2 | 252 | 73.8 | 0.73 | 59.4 |
WKP-MET-035 | EG Vein | 4.1 | 7.7 | 245 | 93.6 | 0.26 | 83.4 |
WKP-MET-036 | EG Vein | 6.4 | 31.8 | 96 | 92.4 | 0.46 | 69.5 |
WKP-MET-037 | EG Vein | 5.7 | 24.3 | 594 | 85.6 | 0.75 | 59 |
WKP-MET-038 | EG Vein | 16.2 | 25.1 | 146 | 95.3 | 0.69 | 80.3 |
WKP-MET-039 | EG Vein | 16.6 | 33 | 287 | 91.8 | 1.12 | 77.7 |
WKP-MET-040 | EG Vein | 5.5 | 12.8 | 7 | 98 | 0.11 | 82.5 |
WKP-MET-041 | EG Vein | 3.3 | 8.2 | 272 | 81 | 0.66 | 60.7 |
WKP-MET-042 | FW Vein | 5.1 | 18 | 752 | 68.1 | 1.62 | 34.7 |
WKP-MET-043 | FW Vein | 8.3 | 14.3 | 204 | 91 | 0.87 | 71.1 |
WKP-MET-044 | FW Vein | 8.3 | 27.2 | 1010 | 66.4 | 2.79 | 32 |
WKP-MET-045 | T Stream | 1.7 | 3.5 | 73 | 97.1 | 0.06 | 88.3 |
WKP-MET-046 | HW Vein | 3.4 | 4.3 | 370 | 98.2 | 0.06 | 89.4 |
WKP-MET-047 | HW vein | 4.5 | 21.7 | 1970 | 51 | 2.26 | 39.5 |
In 2022 the fifth round of testing continued with 16 additional composites from the infill drilling program
focusing on the higher grade EG vein structure to improve confidence and meet the requirements of the
geometallurgical matrix for a prefeasibility level of study,(Table 13-25, Table 13-26, and Table 13-27).
These samples were submitted to AMML in Australia for testing to the Round 4 flowsheet.
Document ID: STU-063-REP-002-0 Released: 11th December 2024Page 90 of 244
OceanaGold Corporation | ||
NI 43-101 Technical Report – Waihi District Pre-feasibility Study, New Zealand | ||
Table 13-25: 2022 WUG Au Geometallurgical Matrix – Mass Balance
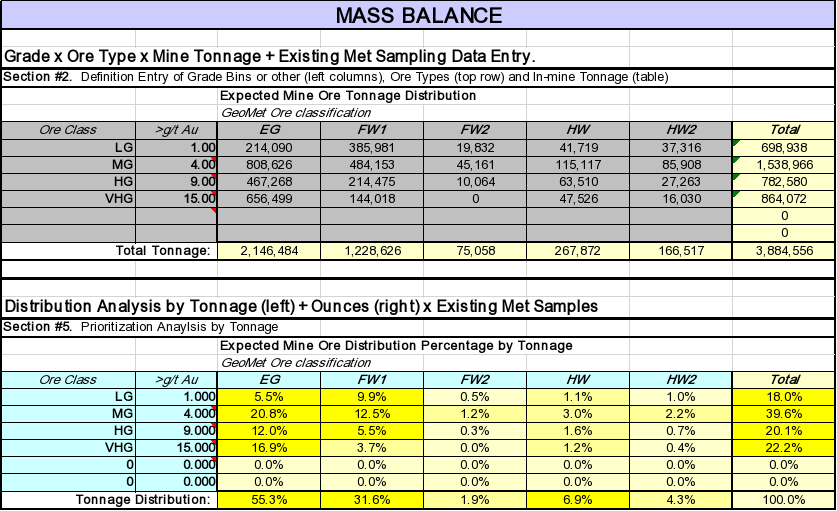
Table 13-26: 2022 WUG Au Geometallurgical Matrix – Gold Balance

Document ID: STU-063-REP-002-0 Released: 11th December 2024Page 91 of 244
OceanaGold Corporation | ||
NI 43-101 Technical Report – Waihi District Pre-feasibility Study, New Zealand | ||
Table 13-27: 2022 WUG Au Geometallurgical Matrix
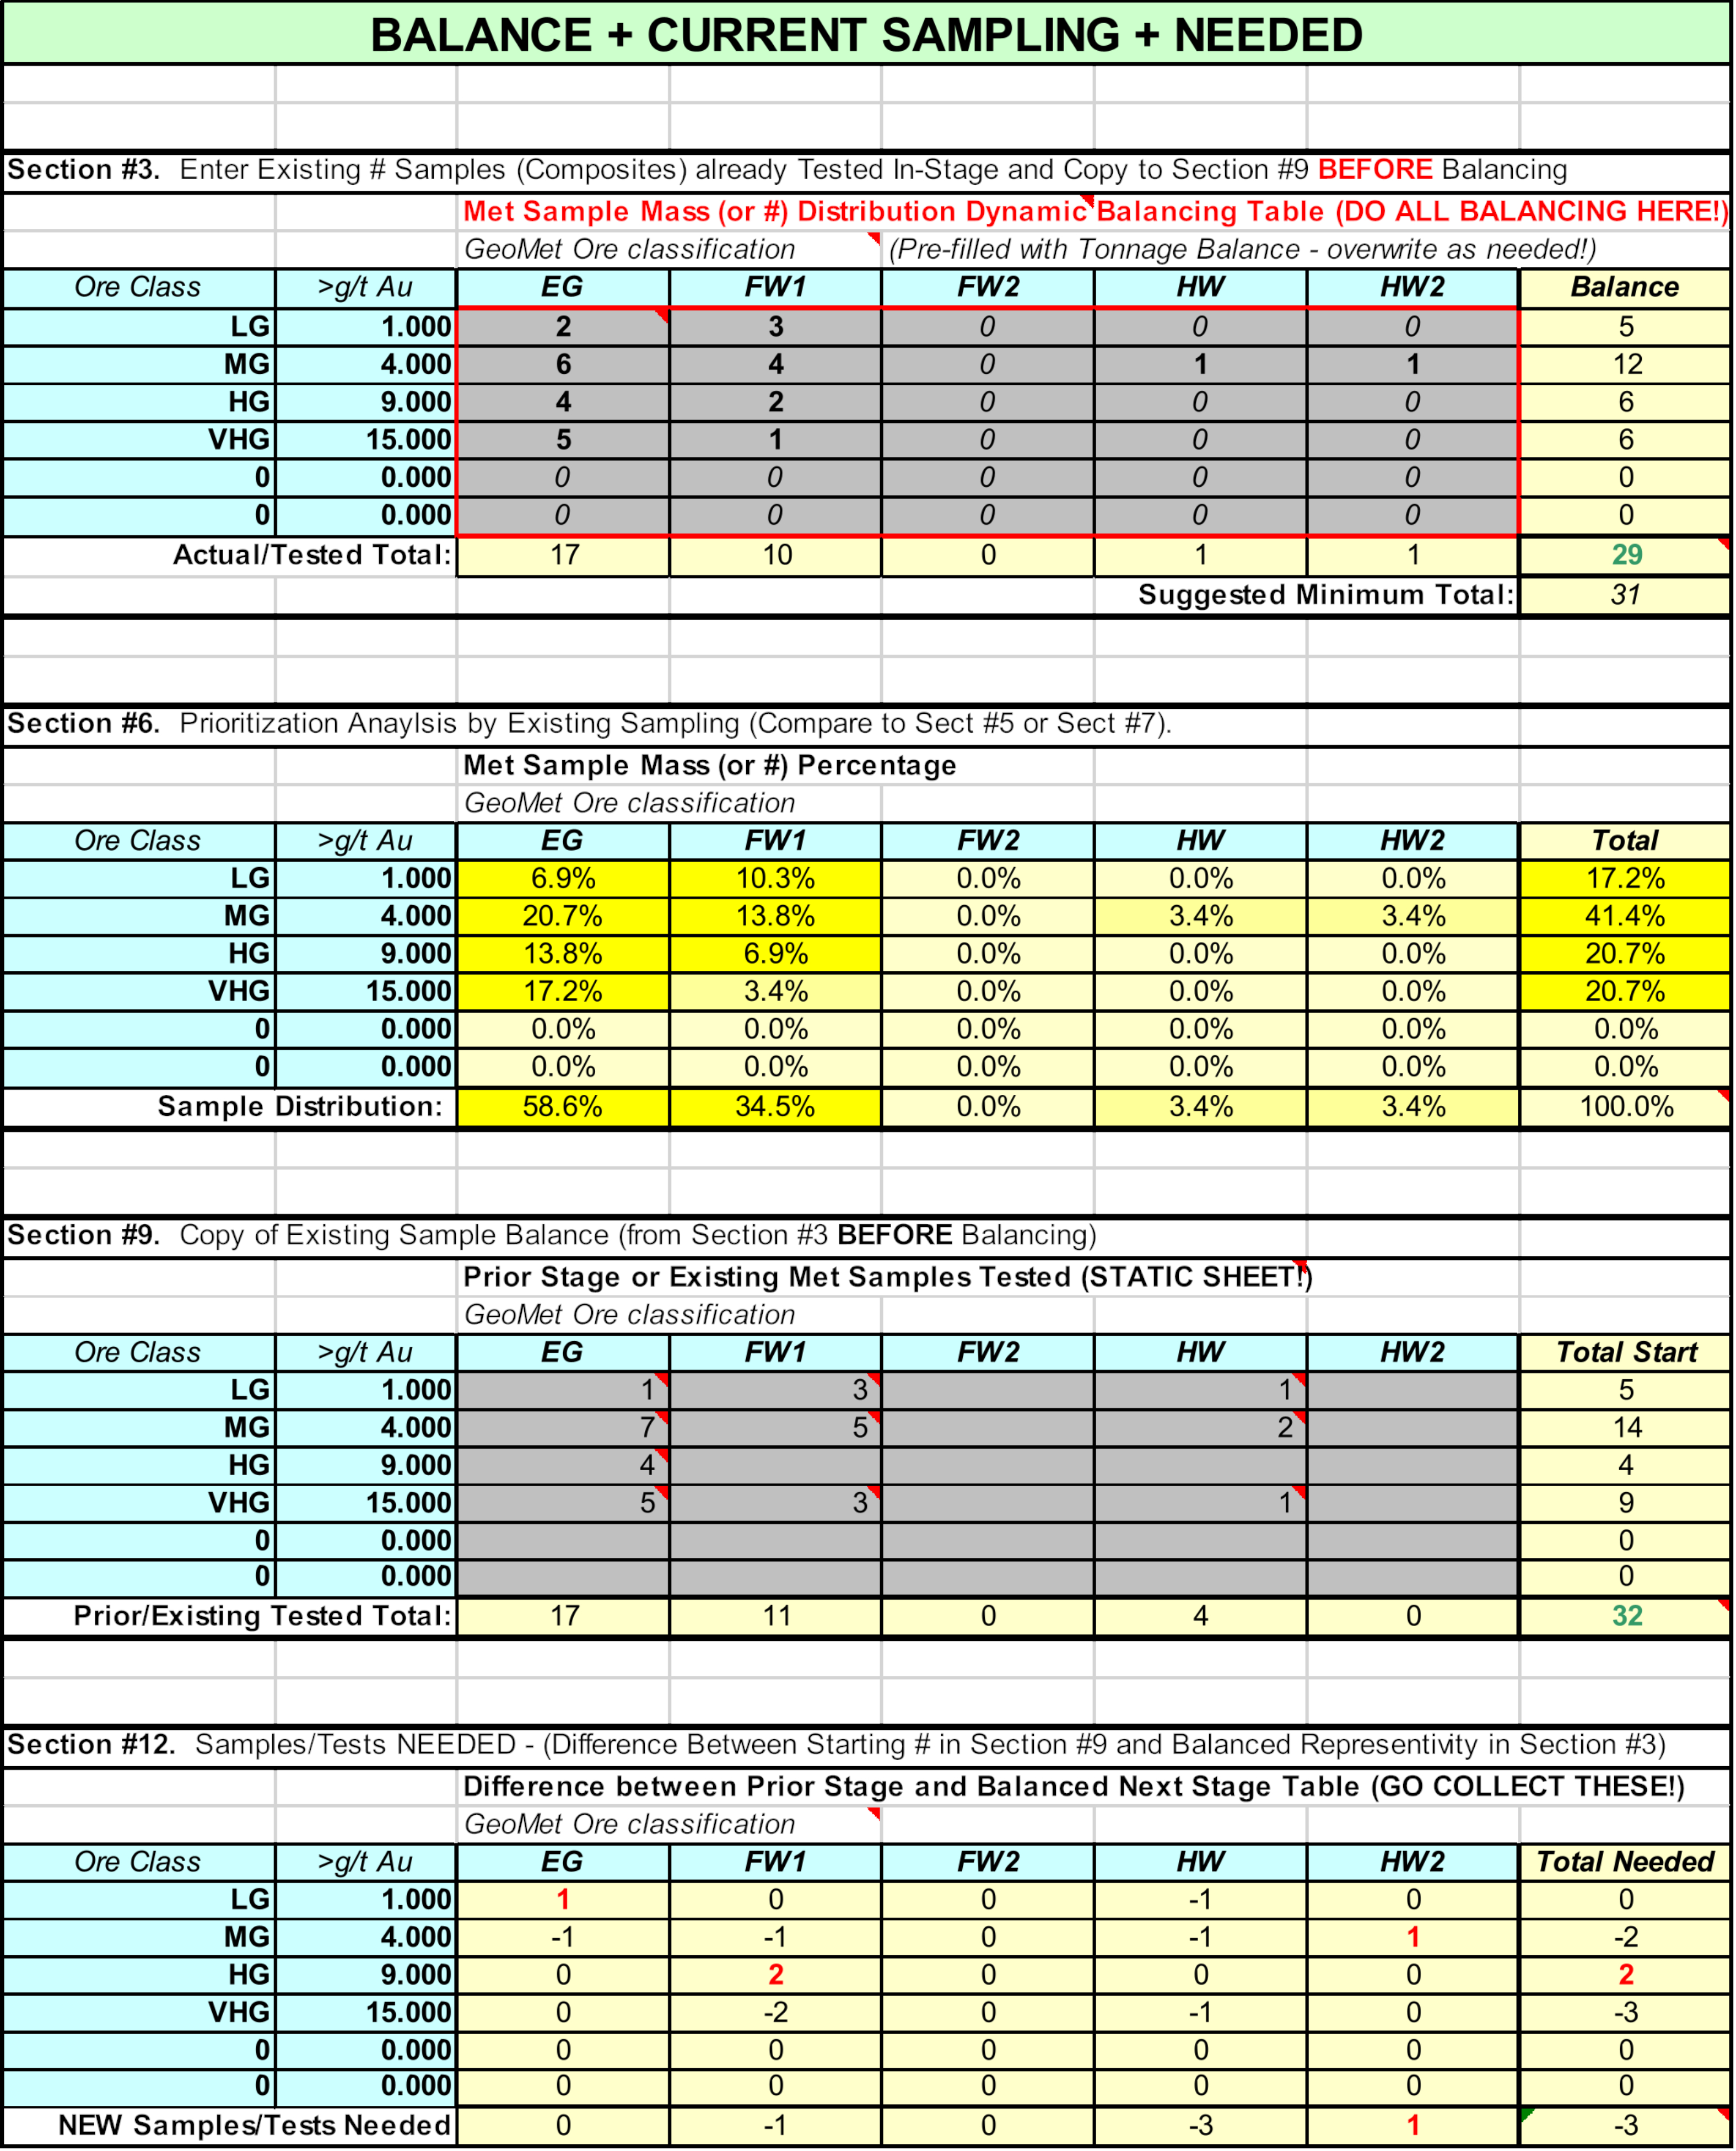
The results of the 2022 direct leach testwork is shown below in Table 13-28 for the 38 µm grind which
provided the highest leach recovery relative to the 53 and 75 µm grind sizes.
Document ID: STU-063-REP-002-0 Released: 11th December 2024Page 92 of 244
OceanaGold Corporation | ||
NI 43-101 Technical Report – Waihi District Pre-feasibility Study, New Zealand | ||
Table 13-28: 2022 Composite Gold Recovery Results
Composite ID | Structure | Au | Ag | As | Au Recovery | Au Residue | Ag Recovery |
ID | g/t | g/t | g/t | % | g/t | % | |
WKP-MET-048 | FW Vein | 2.4 | 9.8 | 280 | 83.1 | 0.49 | 47.6 |
WKP-MET-049 | FW Vein | 1.2 | 6.2 | 857 | 43.3 | 0.73 | 41.1 |
WKP-MET-050 | HW Vein | 15.9 | 42.2 | 118 | 93.2 | 1.01 | 53.3 |
WKP-MET-051 | HW Vein | 3.9 | 7.5 | 116 | 93.6 | 0.29 | 62 |
WKP-MET-052 | EG Vein | 9.6 | 15.8 | 241 | 93 | 0.6 | 67.2 |
WKP-MET-053 | EG Vein | 29 | 49.7 | 70 | 92.2 | 1.91 | 53.9 |
WKP-MET-054 | EG Vein | 2.3 | 13 | 279 | 76.9 | 0.72 | 41.1 |
WKP-MET-055 | EG Vein | 18.9 | 29.9 | 165 | 95.5 | 0.52 | 73.6 |
WKP-MET-056 | EG Vein | 6.5 | 11.8 | 303 | 90.8 | 0.36 | 58.3 |
WKP-MET-057 | EG Vein | 22.5 | 91.9 | 38 | 98.5 | 0.73 | 40.5 |
WKP-MET-058 | FW Vein | 34.4 | 73.2 | 442 | 95.5 | 2.39 | 57 |
WKP-MET-059 | FW Vein | 23.9 | 44.6 | 156 | 94.6 | 1.06 | 56.9 |
WKP-MET-060 | EG Vein | 11.7 | 14.7 | 170 | 97.4 | 0.66 | 73.3 |
WKP-MET-061 | EG Vein | 9.9 | 18.6 | 61 | 92 | 0.35 | 56.4 |
WKP-MET-062 | FW Vein | 4.6 | 5.7 | 347 | 90.4 | 0.48 | 61.2 |
WKP-MET-063 | FW Vein | 6.3 | 21.7 | 402 | 78.1 | 1.4 | 60.2 |
Generally good recoveries were recorded for the EG Vein samples however in the footwall and hanging
wall veins lower recoveries were encountered, particularly with lower gold head grades and elevated
arsenic head grades. This has been observed in both Correnso and MUG test programs and milling
practice with gold present in arsenopyrite being much finer than in other forms. In the 2020 program a
whole of ore leach was conducted at 10 µm to check the effect of potential finer grinding of the sulphides
but generally lead to recovery improvements of less than 2 % and would not pay for the power required.
A recovery modelling process based on the 31 composites related to the three main vein structures
showed a significant correlation in gold recovery and residue to both gold and arsenic grades.
The geological block model in 2022 was updated with an independent arsenic model allowing such a
regression model for recovery to be used to forecast recovery in the mine planning phase. The
distribution of arsenic grades across the structures was reviewed and an updated geometallurgical matrix
prepared that focused on grade bins of arsenic (<150 ppm, 150-300 ppm, 300-500 ppm and >500 ppm)
and against the gold grade bins (1-4 g/t, 4-9g /t, 9-15 g/t and >15 g/t). The mass balance portion of the
matrix is shown below in Table 13-29 showing 59 % of the tonnage is below 300 ppm arsenic and 84 %
below 500 ppm.
Document ID: STU-063-REP-002-0 Released: 11th December 2024Page 93 of 244
OceanaGold Corporation | ||
NI 43-101 Technical Report – Waihi District Pre-feasibility Study, New Zealand | ||
Table 13-29: 2022 WUG As Geometallurgical Matrix – Mass Balance
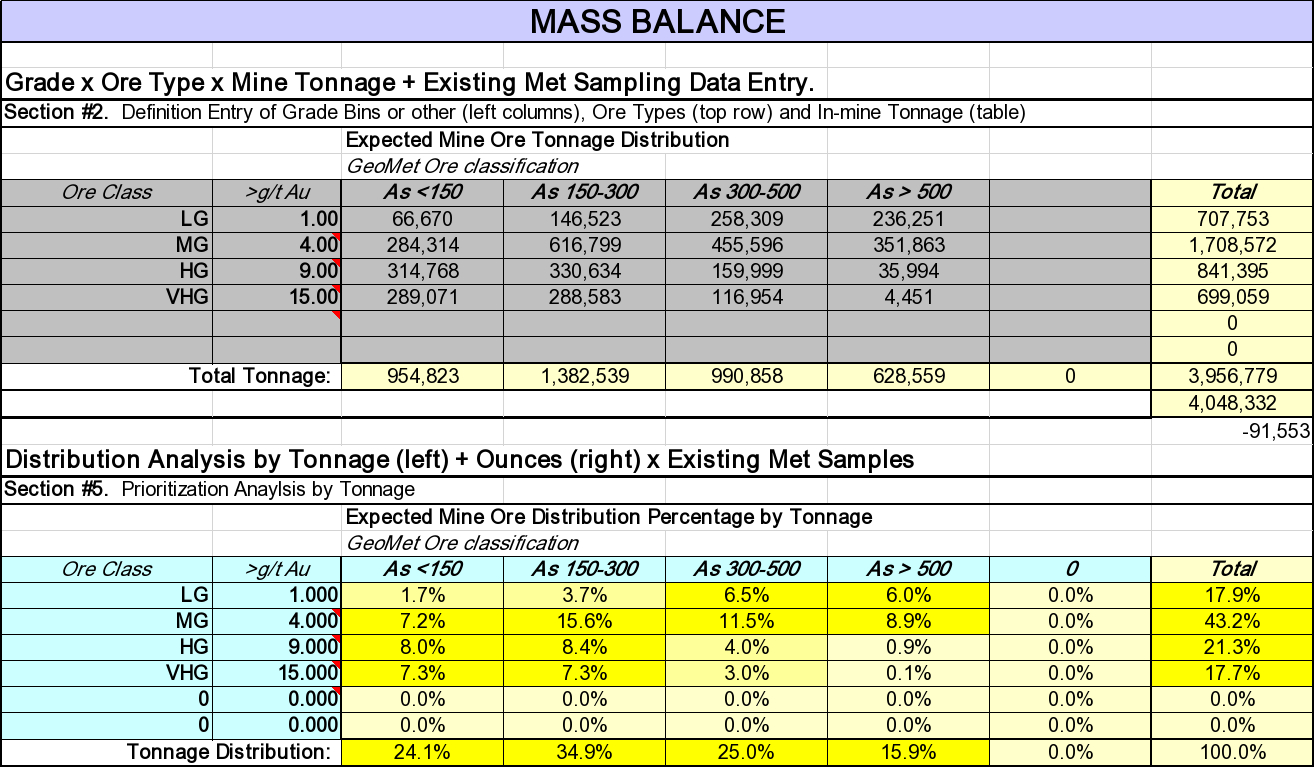
The gold balance portion of the matrix is shown below in Table 13-30 and the gold distribution is more
skewed to the lower arsenic domains with 70 % of gold below 300 ppm arsenic and 92 % below 500 ppm.
Arsenic grades above 300 ppm As and below 9 g/t Au are expected to show recoveries below 88 % and
represent 16.5 % of the metal.
Table 13-30: 2022 WUG As Geometallurgical Matrix – Gold Balance
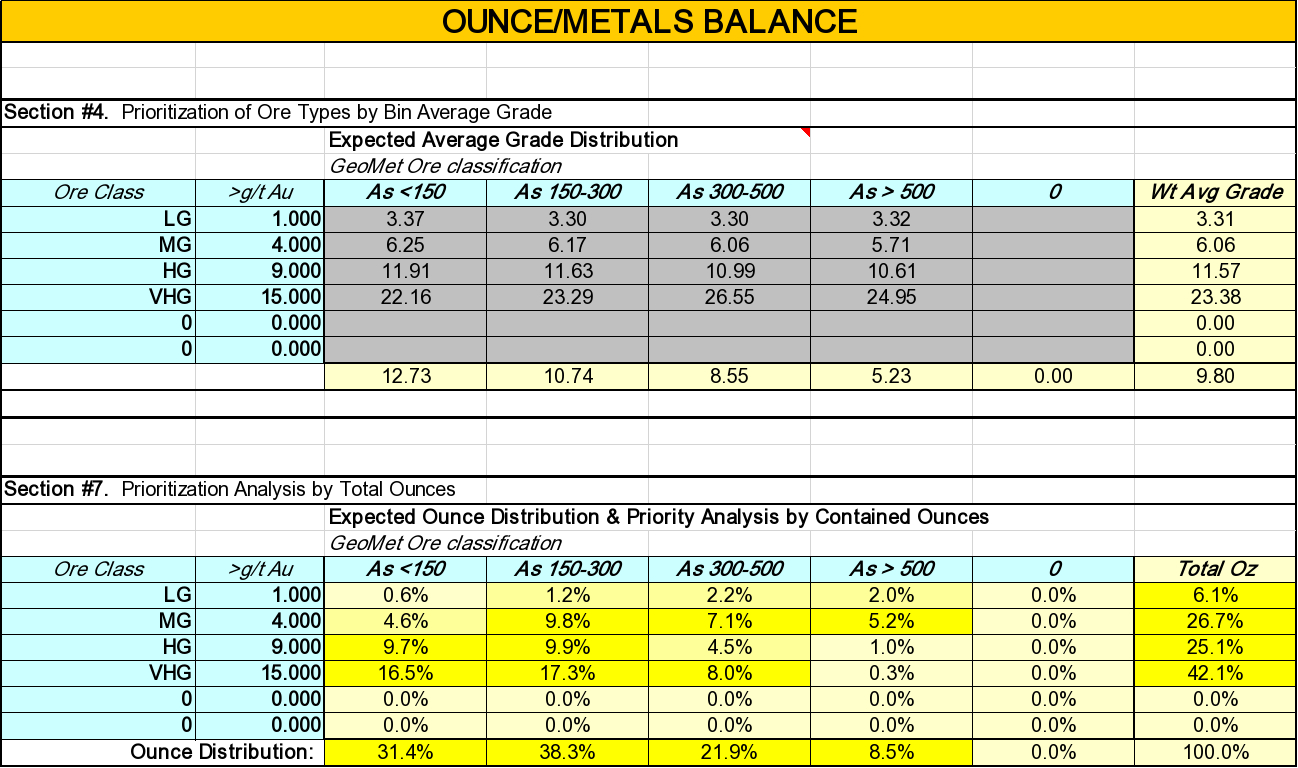
Document ID: STU-063-REP-002-0 Released: 11th December 2024Page 94 of 244
OceanaGold Corporation | ||
NI 43-101 Technical Report – Waihi District Pre-feasibility Study, New Zealand | ||
An additional 6 composites were identified to increase the sample count in the 4-9 g/t gold grade and
150-500 ppm arsenic grade bins. These samples were submitted to AMML in Australia for testing to the
previous laboratory flowsheet. Results for these 6 composites are presented below in Table 13-31.
Table 13-31: 2022 Composite Results (Geomet Domain 4-9 g/t Au and 150-500 ppm As)
Composite ID | Structure | Au | Ag | As | Au Recovery | Au Residue | Ag Recovery |
ID | g/t | g/t | g/t | % | g/t | % | |
WKP-MET-064 | HW Vein | 8.5 | 15.4 | 242 | 92.5 | 0.57 | 67.7 |
WKP-MET-065 | HW Vein | 5.3 | 7.6 | 344 | 93.7 | 0.34 | 77 |
WKP-MET-066 | FW Vein | 12.7 | 36 | 168 | 93.5 | 0.83 | 55.1 |
WKP-MET-067 | FW Vein | 9.5 | 12.4 | 293 | 91.6 | 0.88 | 56.6 |
WKP-MET-068 | EG Vein | 8.8 | 20.1 | 681 | 78.9 | 1.74 | 44.3 |
WKP-MET-069 | EG Vein | 4.7 | 9 | 350 | 81.5 | 0.79 | 53.4 |
A cross-section of all geometallurgical samples is illustrated in Figure 13-4. This indicates good sample
coverage in the south-west of the orebody where the bulk of the ore tonnes are located and where there
Document ID: STU-063-REP-002-0 Released: 11th December 2024Page 95 of 244
OceanaGold Corporation | ||
NI 43-101 Technical Report – Waihi District Pre-feasibility Study, New Zealand | ||
is an abundance of drill core. Additional geometallurgical samples from the north-east of the orebody will
be collected for testwork as drilling in the north-east of the orebody progresses.
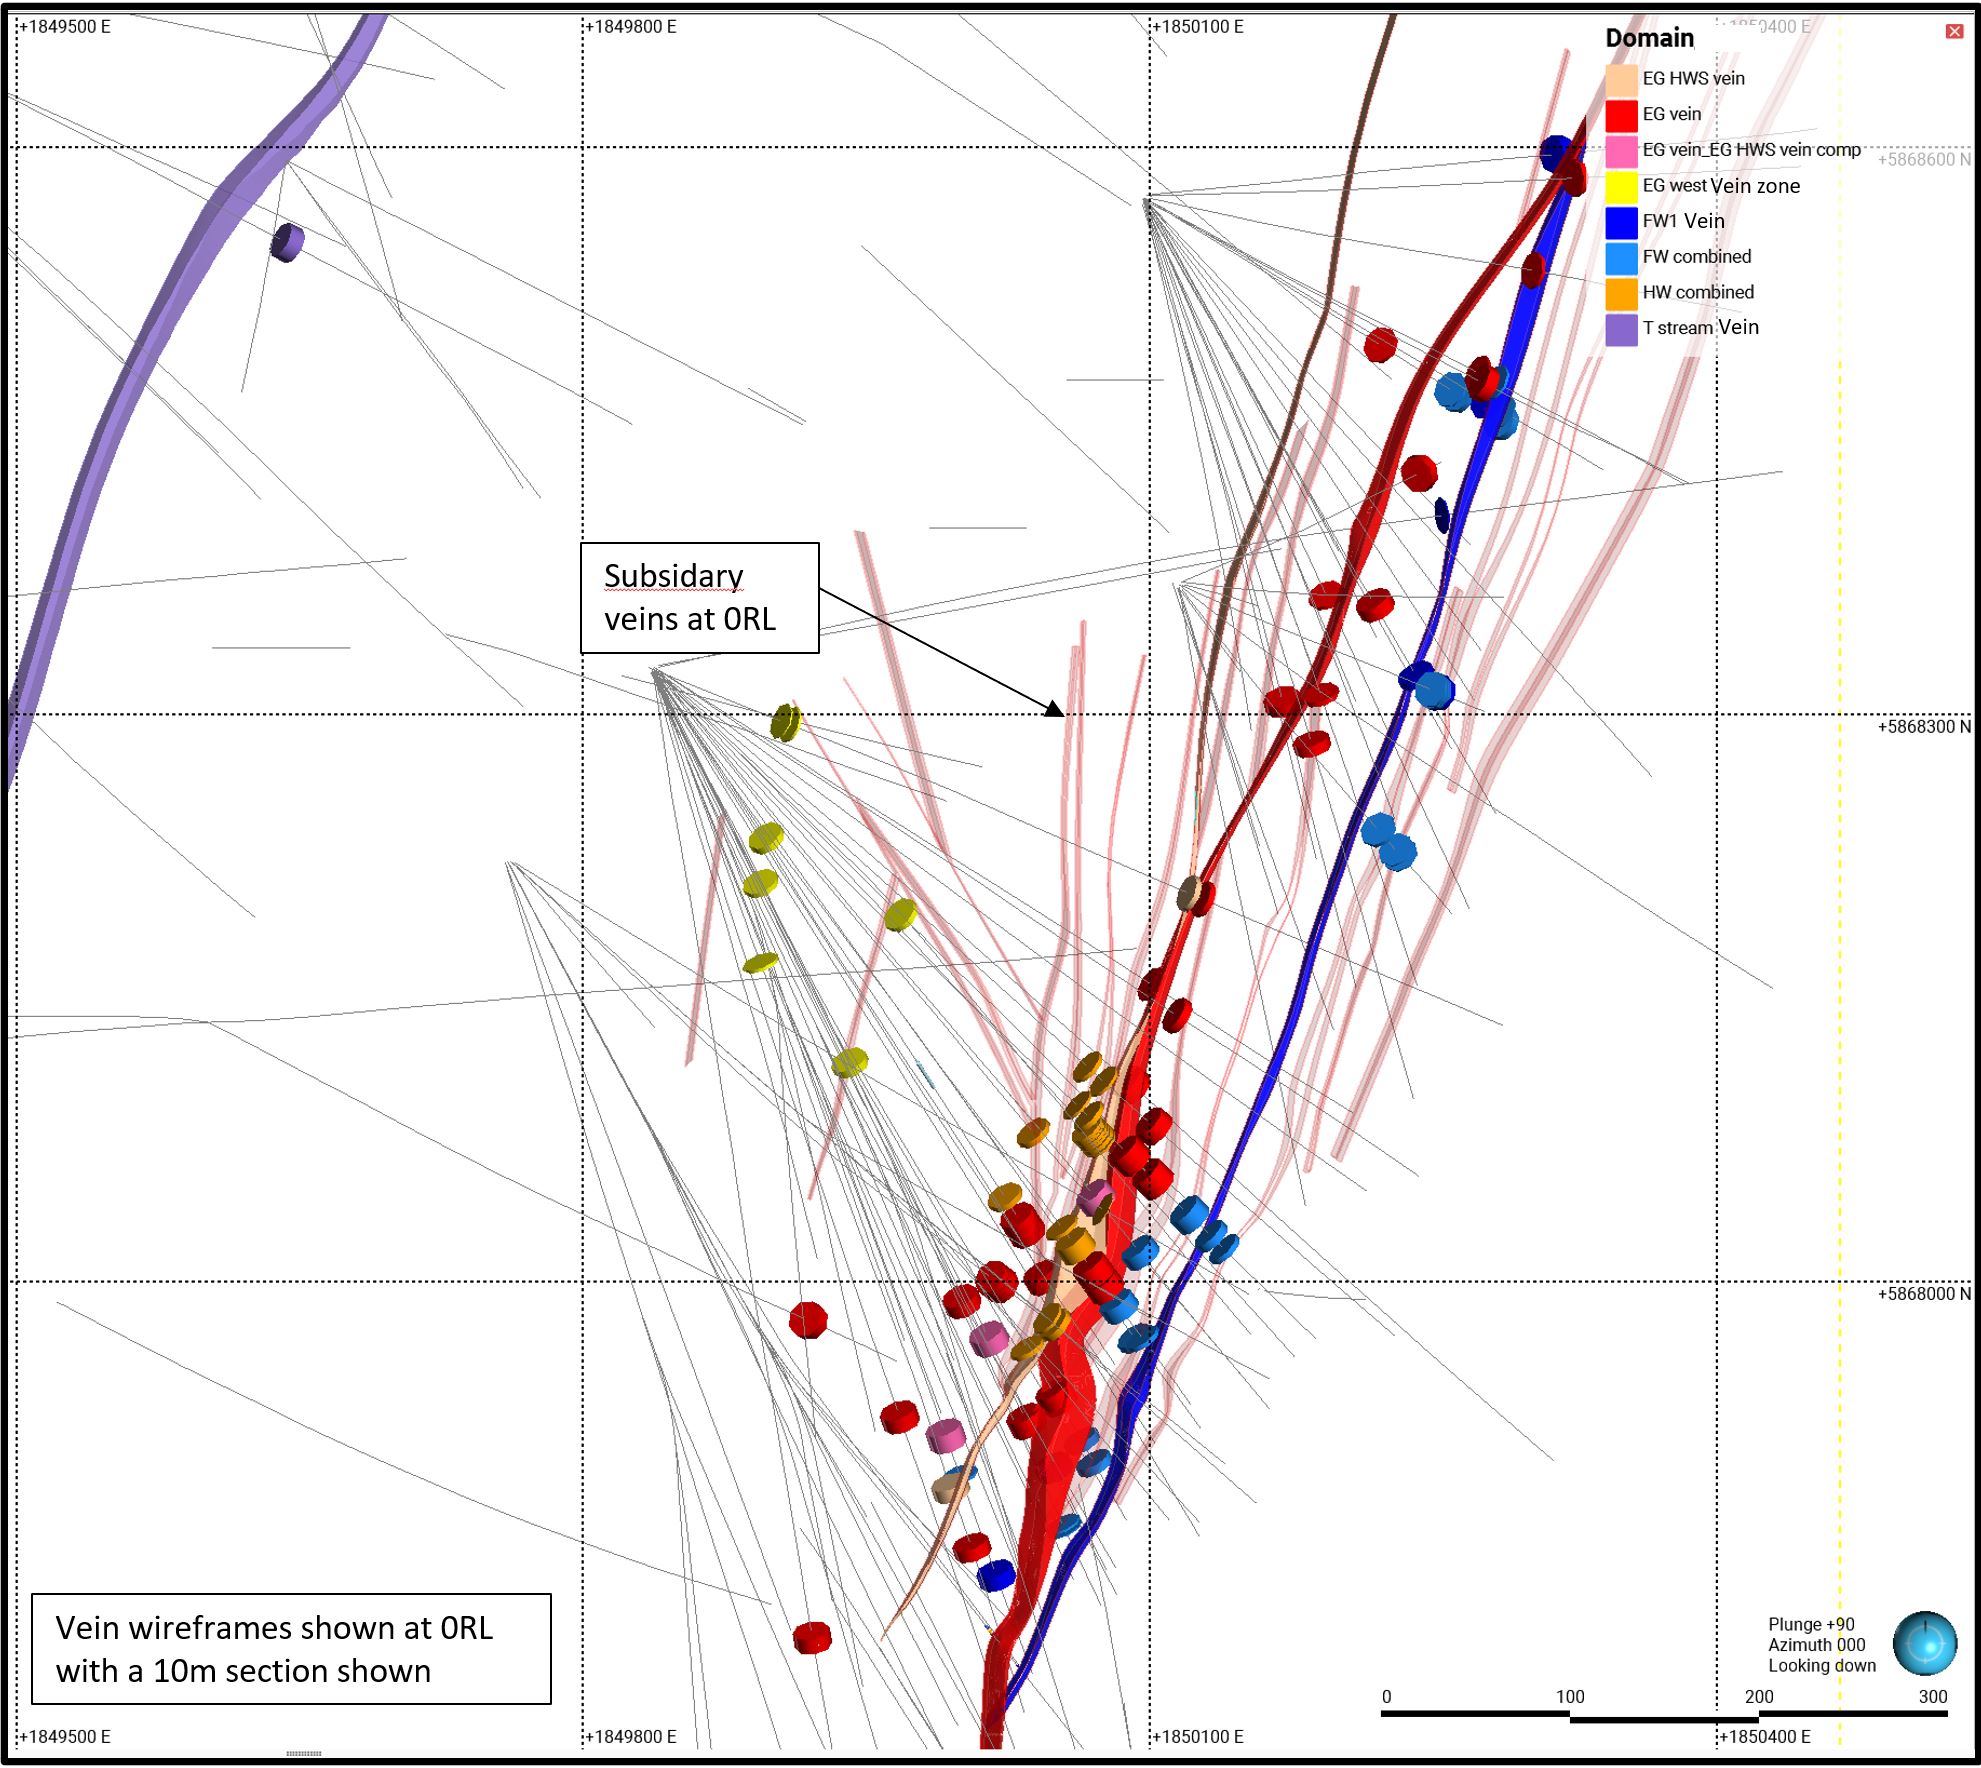
Figure 13-4: Cross-Section of WUG Geometallurgical Samples
13.4.2Comminution Testwork
Due to the quartz vein nature of the gold host rock, it generally is regarded as competent and hard from a
milling perspective. Ore hardness characterisation has been undertaken on composites by JKTech with
SMC and Bond hardness tests to allow for prediction of anticipated milling rates. In 2019 a total of 6
composites were submitted for comminution characterisation and results are summarized in Table 13-32.
Document ID: STU-063-REP-002-0 Released: 11th December 2024Page 96 of 244
OceanaGold Corporation | ||
NI 43-101 Technical Report – Waihi District Pre-feasibility Study, New Zealand | ||
Table 13-32: 2019 WUG Comminution Testwork
Composite | Structure | Axb | SG | DWI | BRWI | BBWI | BAi |
ID | t/m3 | kwh/t | kwh/t | ||||
WKP-MET-017 | EG | 38.8 | 2.49 | 6.43 | 16.1 | 18.7 | 0.7016 |
WKP-MET-018 | EG | 34 | 2.53 | 7.51 | 22.1 | ||
WKP-MET-019 | EG | 39.2 | 2.53 | 6.45 | 19.1 | ||
WKP-MET-020 | FW | 39.4 | 2.59 | 6.55 | 16 | 19.3 | 0.7053 |
WKP-MET-021 | FW | 36.8 | 2.62 | 7.07 | 20 | ||
WKP-MET-022 | FW | 34.7 | 2.59 | 7.38 | 20.3 |
In 2020 a follow-up program tested a further 9 composites across the deposit. The Axb values obtained in
both programs were consistent and in line with that observed with other Waihi deposits. The Bond ball mill
work index measured in the 2020 program was about 10 % higher than the 2019 program. A summary of
the results from the 2020 program is shown in Table 13-33.
Table 13-33: 2020 WUG Comminution Testwork
Composite | Structure | Axb | SG | DWI | BRWI | BBWI | BAi |
ID | t/m3 | kwh/t | kwh/t | ||||
WKP-MET-023 | EG | 35.8 | 2.54 | 7.19 | 16.5 | 24.8 | 0.7682 |
WKP-MET-024 | EG | 37.5 | 2.53 | 6.75 | 15.9 | 23.5 | 0.8225 |
WKP-MET-025 | EG | 39.6 | 2.56 | 6.52 | 17.4 | 24.1 | 0.9219 |
WKP-MET-026 | EG | 37 | 2.58 | 6.94 | 16.6 | 20.6 | 0.8873 |
WKP-MET-027 | EG | 39.6 | 2.57 | 6.54 | 16.4 | 21.7 | 0.7608 |
WKP-MET-028 | EG | 37 | 2.5 | 6.76 | 17.5 | 21.1 | 1.0086 |
WKP-MET-029 | HW Vein | 38.4 | 2.54 | 6.68 | 15.6 | 21.6 | 0.7657 |
WKP-MET-030 | FW Vein | 33 | 2.53 | 7.7 | 17.6 | 23.1 | 0.8634 |
WKP-MET-031 | FW Vein | 33 | 2.57 | 7.72 | 18.9 | 26.1 | 0.7827 |
Given the consistent results between the programs over the 15 composites the values were used in
establishing specific energy requirements and milling rate predictions. A primary grind size of 80 %
passing 53 µm was utilized for the primary grind design for the WUG feed.
13.4.3Recovery Estimates and Assumptions
With the completion of the 2023 samples the recovery analysis was updated and considered the
individual structures and all samples for the combined structures. For the Wharekirauponga deposit for
the prefeasibility study based on the sample ground to 38 µm in the lab the following regressions are
provided:
•Gold Recovery (%) = 93.835 + (0.2312 * Au ppm) – (0.02313 * As ppm), r2 = 0.85
•Gold residue grade (g/t) = -0.06849 + (0.049631 * Au ppm) + 0.001356 * As ppm), r2 = 0.69
•Silver Recovery (%) = 79.283 – (0.27413 * Ag ppm) – (0.03932 * As ppm), r2 = 0.48
These models should be suitable for use over the gold grade range over 2.8 g/t Au and for a plant
flowsheet targeting a 53 µm cyclone overflow grind size target.
Document ID: STU-063-REP-002-0 Released: 11th December 2024Page 97 of 244
OceanaGold Corporation | ||
NI 43-101 Technical Report – Waihi District Pre-feasibility Study, New Zealand | ||
13.5Comments on Adequacy (Processing and Metallurgy)
In the opinion of the QP, the following conclusions are appropriate:
•Metallurgical test work and associated analytical procedures were performed by recognized
testing facilities, and inhouse facilities and the tests performed were appropriate to the
Mineralization type
•Samples selected for testing were representative of the various types and styles of Mineralization
within the Waihi and Wharekirauponga areas. Samples were selected from a range of depths
within the deposit. Sufficient samples were taken so that tests were performed on adequate
sample mass
•Average weighted recoveries have been assumed based on test work completed and source
proportion in the inventory. These recoveries are appropriate to be used in support of Mineral
Resource and Mineral Reserve estimation, based on the drill hole spacing and sample selection
•Metallurgical testwork conducted on the composites from the MUG deposit supports an expected
gold recovery assumption of 95 % for treatment through the existing process plant flowsheet
based on targeting a primary grind size of 53 µm used in the mine optimization
•Historical metallurgical results on the MOP deposit supports an expected gold recovery
assumption of 90 % for treatment through the existing process plant flowsheet based on a 90 µm
grind size
•Metallurgical testwork on the GOP deposit supports an expected gold recovery assumption of
71 % for treatment through the existing process plant flowsheet based on a 75 µm grind size
•Metallurgical testwork on the WUG deposit supports an expected gold recovery assumption of
90 % for treatment through the existing process plant flowsheet based on a 53 µm grind size.
13.6Future Work Program
Infill drilling presents the opportunity to continue test work on available core samples to confirm
metallurgical estimates for any new Reserves that are defined. This should occur as material becomes
available to de-risk the use of existing forecasting inputs.
As the Resource size grows, the geometallurgical matrix should be updated with the increased inventory
and parameters. This will support the feasibility study and ensure coverage of the extended Resource
area and range of grades expected. Increased sample count should provide improved confidence in the
recovery relationship as a function of gold and arsenic head grades, and test if a global recovery for all
the deposit continues to be valid or if separate models for the hanging wall and footwall structures is
warranted.
Document ID: STU-063-REP-002-0 Released: 11th December 2024Page 98 of 244
OceanaGold Corporation | ||
NI 43-101 Technical Report – Waihi District Pre-feasibility Study, New Zealand | ||
14MINERAL RESOURCE ESTIMATES
Mineral Resource Estimates for four areas have been prepared with close out dates for the databases
used in estimation as shown in Table 14-1. Data used to support the estimates include surface and
underground diamond drill core, RC chips and underground grade control channel sample chips.
Table 14-1: Model Closeout Dates
Project | Closeout Date |
MUG | 11 June 2024 |
MOP | 01 February 2024 |
WUG | 24 April 2024 |
GOP | 01 September 2022 |
All geological models and geological concepts have been routinely reviewed by internal and external
reviewers. Open pit and underground mining since 1988 have provided a large database of mapping and
grade control sampling, which has confirmed the geological interpretations to date.
The modelling process employed in the grade estimation for all the Waihi projects is performed using
numerous Vulcan® and Leapfrog® processes and summarized in the steps outlined below:
•Validation of input data
•Update geologic models including lithological, mineralized, structural, and oxide domains
•Data selection – drill hole data selection from the site AcQuire database, RC, and channel data
from the AcQuire production databases
•Exclusion of unwanted drill holes by data type
•Flag data files by domains
•Composite drill holes using length weighting
•Exploratory data analysis by domain and data type
•Assign top cuts by domain to input data files
•Review of variography and variogram modelling
•Block Model construction based upon modelled domains and surfaces
•Run estimation for all domains for gold, silver, and arsenic
•Run estimation for confidence classification and apply ringfencing
•Assign density, mining depletions, back fill grade, stripping of negative values from non-estimated
blocks, assignment of grade to dilution domains, and assignment of recovery to all domains
•Resource classification.
Document ID: STU-063-REP-002-0 Released: 11th December 2024Page 99 of 244
OceanaGold Corporation | ||
NI 43-101 Technical Report – Waihi District Pre-feasibility Study, New Zealand | ||
Estimations were performed in individual geological domains using length weighted downhole
composites. Estimation is undertaken via Ordinary Kriging for Au and Ag, and inverse distance squared
for other elements.
Models are rotated in bearing to align with the dominant strike of the veins. Sub-blocking is used to define
narrow veins and to maintain volume integrity with the geology solids. The grade estimation for all models
is controlled by hard domain boundaries, with both sample selection and estimation of blocks limited to
domains defined by the interpretation solids. Multi-pass estimation is used to control sample selection
criteria at a local and long-range scales.
14.1MUG
14.1.1Geological Model
The comprehensive MUG dataset includes diamond drilling, modern face sampling and backs mapping,
in-pit mapping, grade control channel and RC data, historic crosscuts, historic mapping, digitized historic
mining wireframes. Wireframe inputs to contributing models include:
•125 Vein domains
•10 Dilution domains
•17 Lithology units
•5 Oxide surfaces.
MUG models are built with underground mining economics in mind, and delineation of consistently narrow
or low-grade structures not deemed necessary for estimation. 58 veins feature in production planning.
Wireframes were created using Leapfrog Geo® software. Geological logging fields of drilling data such
vein textures, vein mineralogy, vein percentage, breccia type and historical voids were initially used to
create representative wireframes of vein structures. These initial wireframes were then modified on a
vein-by-vein basis and compared to gold and silver grade, core photography and structural
measurements to establish geological consistency between veins. Veins defined by pit grade control data
but without supporting drilling information to substantiate vein extrapolation beyond the pit boundary were
not included in the wireframes.
Individual veins were validated at various stages throughout the modelling process. Upon completion of
the modelling process, additional validation includes:
•A visual review in three axis sliced planes viewing gold grade, historical voids, and logged
geology
•Drill hole review following domain flagging and filtering for gold immediately outside of vein
boundaries
•Peer review within the Waihi geology team
•Review against historic mining. Note that in instances where mined voids had no drill data,
relative position of stoping panels was determined using vein wireframes. This ensures a
conservative approach was taken to depletion.
Document ID: STU-063-REP-002-0 Released: 11th December 2024Page 100 of 244
OceanaGold Corporation | ||
NI 43-101 Technical Report – Waihi District Pre-feasibility Study, New Zealand | ||
The accurate treatment of historic mine workings is recognized as being of high importance to both the
MUG and MOP mines.
A 3D model of historic workings is maintained for Resource depletion, mine engineering and geotechnical
and safety consideration. This 3D model was initially digitized from linen plans and captures the extent of
known stopes, drives, passes, and shafts within historic mine. It is considered largely complete and is
updated and manipulated to adhere to modern points of observation including diamond drilling, probes,
void scans, and mining breakthroughs.
All the workings are separated into individual wireframes and regularly assessed for position, orientation,
and width against all available data.
Stope shapes and levels are validated for closure, consistency and crossing triangles to ensure they
could be evaluated for volume, then re-merged into a complete set of development levels, filled stopes
and open stopes. All remodelled historical workings are peer reviewed and validated against previous
models. All updates are recorded in a ‘stope adjustment register’. The updated model contains wireframes
for development levels, open stopes, filled stopes, shafts, passes and the Milking Cow caved zone.
14.1.2Exploratory Data Analysis
Exploratory data analysis (EDA) was completed on gold grades by logged drillhole features to identify
mineralization controls. EDA was performed using Isatis Neo and Vulcan data analysis tools. Weighted
statistics of raw and composited Au values were reviewed using Isatis Neo. Tabulated in Table 14-2 is the
statistics for major domains comprising >70 % of MUG metal content.
Table 14-2: Summary Statistics of Composite Au Values for MUG
Count | Mean | Variance | Std Dev | CV | Minimum | Maximum | |
1100 | 43154 | 4.19 | 57.18 | 7.56 | 1.804 | 0.01 | 507 |
1220 | 7370 | 3.85 | 58.99 | 7.68 | 1.997 | 0 | 190.68 |
1304 | 1877 | 2.57 | 29.26 | 5.41 | 2.104 | 0.01 | 114.06 |
1400 | 4792 | 4.05 | 73.02 | 8.55 | 2.111 | 0 | 209.48 |
1500 | 2208 | 4.16 | 42.91 | 6.55 | 1.576 | 0 | 108.81 |
14.1.3Compositing, Grade Capping and Outlier Restrictions
Statistical assessment of the input data is undertaken by domain. Typical top-cut selection is based on the
assessment of the population distribution characteristics.
Domain specific assessment of Au capping strategy was conducted from spatial review of data, its
distribution on raw histograms, lognormal probability plots, review of uncut vs cut percentiles, coefficient
of variance, and metal loss. Top-cut assessment for Au for each domain is undertaken independently for
exploration drill holes and grade control channels. A global top-cut values were assigned to Silver and
Arsenic. Values of 400 ppm for Silver and 1300 ppm for Arsenic were assigned to each element. Table
14-3 below shows is the top-cut statistics for the major domains.
Document ID: STU-063-REP-002-0 Released: 11th December 2024Page 101 of 244
OceanaGold Corporation | ||
NI 43-101 Technical Report – Waihi District Pre-feasibility Study, New Zealand | ||
Table 14-3: Summary Statistics of Cut Au Values for MUG
Count | Mean | Variance | Std Dev | CV | Minimum | Maximum | |
1100 | 43154 | 4.11 | 38.46 | 6.2 | 1.507 | 0.01 | 66 |
1220 | 7370 | 3.68 | 37.88 | 6.15 | 1.673 | 0 | 50 |
1304 | 1877 | 2.45 | 18 | 4.24 | 1.729 | 0.01 | 40 |
1400 | 4792 | 3.87 | 42.66 | 6.53 | 1.689 | 0 | 50 |
1500 | 2208 | 4.07 | 33.02 | 5.75 | 1.411 | 0 | 48 |
Reconciliation history for the Waihi Project has demonstrated that some level of high-grade restriction is
necessary to limit the influence of outliers on grade estimates for the epithermal veins that have been
mined during the operations history. This was applied on a by-domain basis following the spatial
assessment high-grade sample distribution and observation of local short-range variance.
14.1.4Variography
Variograms were modelled using Vulcan and Leapfrog EDGE’s® data analysis tools. In domains where
there are significant number of grade control (GC) channel samples, variograms analysed by mine
production using Leapfrog EDGE® are used. Variograms for the rest of the domains were analysed using
Vulcan and Isatis. For domains that do not have sufficient data to produce reasonable variograms, a
general variogram is applied. Orientations of the omni direction variogram are defined by the orientation
of each vein.
Spherical variogram models were fit for most of the domains with few domains where exponential models
were used. The variograms are characterized by moderate to high nuggets (25-60 % of the sill), with
ranges of 15 – 120 m in the primary direction.
14.1.5Block Modelling and Validation
The MUG block model dimensions, origin and cell size are provided in Table 14-4. Gold (Au) grade was
estimated in Vulcan using Ordinary Kriging (OK) and Nearest Neighbour (NN) with Mineral Resources
reported from OK. Silver (Ag) grade was also estimated using OK and because correlation between Au
and Ag was evident, the Au variograms were applied to the Ag estimate. Arsenic was estimated using
Inverse Distance squared (ID2) with orientations being informed by a local varying anisotropy (LVA).
Estimations were performed in individual mineralized domains using length weighted down hole
composites; 1 m in narrow (<10 m width) veins, 2 m composites in the broader veins. Gold grade is
estimated into parent cells of 10 m x 10 m x 10 m, with minimum sub-block dimensions of 1 m in each
direction. All estimates utilized LVA to address complex local geometries and appropriate sample selection
strategies.
Generally, Au grade was estimated using a 2-pass grade estimation scheme. First pass will include all
input data with higher number of sample requirement and shorter search distance. Un-estimated blocks
are then reprocessed with diamond drillholes only in the input data set. A 3-pass estimation scheme was
used where there is sufficient GC UG channel data. A factor of 93 % was applied to cut Au values of all
Document ID: STU-063-REP-002-0 Released: 11th December 2024Page 102 of 244
OceanaGold Corporation | ||
NI 43-101 Technical Report – Waihi District Pre-feasibility Study, New Zealand | ||
GC UG channel samples to address potential bias in channel sampling. Table 14-4 shows the search
neighbourhood parameters.
Table 14-4: MUG Block Model Dimensions
Variable | X | Y | Z |
Origin | 395200 | 642200 | 450 |
Extents (m) | 1600 | 1200 | 700 |
Block Size (Parent) | 10 | 10 | 10 |
No. of Blocks (Parent) | 340 | 190 | 140 |
Sub-Block Size | 1.0 | 1.0 | 1.0 |
Orientation | +65 degrees | X-axis around Z | |
For this model, the vein domains were estimated using OK, and variable search orientation was employed
for all domains to improve estimation locally in areas with complex vein geometries and to aid in the
resolution of the sample selection for the estimation.
Models are created using a standard block variable schema to enable the capture of all relevant grade
fields, Resource Classification evaluation data and geologic information. Parent block model variables
captured are presented in Table 14-5. Mining evaluations are performed on a stripped-down version of the
parent model, with all non-essential variables removed from the engineering model edition to assist in
processing requirements.
Dilution domains were created based on a 7.5 m halo around the veins and grade locally estimated using
short ranges. An octant search was applied to all domains. Example estimation parameters used for the
major domains are presented Table 14-6.
Table 14-5: Fields in the MUG Model
Model Field | Type | Default Value | Description |
ag | float | -99 | Ag estimate |
as | float | -99 | As estimate |
au_lva | float | -99 | Au estimate; Kriged LVA |
au_nn_c1 | float | -99 | Au nearest neighbour estimate cut |
au_ok_ke | float | -99 | kriging efficiency |
au_ok_kvar | float | -99 | kriging variance |
au_ok_nholes | float | -99 | Au OK no of holes |
au_ok_nsamples | float | -99 | Au OK no of samples |
Document ID: STU-063-REP-002-0 Released: 11th December 2024Page 103 of 244
OceanaGold Corporation | ||
NI 43-101 Technical Report – Waihi District Pre-feasibility Study, New Zealand | ||
Model Field | Type | Default Value | Description |
au_ok_sor | float | -99 | kriging slope of regression |
au_pref | float | -99 | preferred Au |
bearing | float | -99 | bearing LVA |
code | short | -99 | vein code |
dip | float | -99 | dip LVA |
est_id_lva | float | -99 | estimation ID LVA kriged |
geol | nam e | none | lithology |
met_rec | float | -99 | estimated recovery |
mined | byte | 0 | 0= Insitu,1=STF, 2 =STC and MC, 5=STO, 6=Lvls and Passes, 7=STR |
oxide | byte | 2 | 1=totally ox; 2=>50 % ox; 3=<50 % ox; 4=along fractures; 5=fresh |
pit | byte | -99 | 1=air, 2=MOP Ph4, 3=MOP Ph5, 4=below MOP Ph5 |
plunge | float | -99 | plunge LVA |
rescat | byte | 6 | 6=unestimated unclassified; 4=estimated unclassified and dilution; 3=inferred; 2=indicated; 1=measured |
rescat_avedist | float | -99 | resource classification average distance |
rescat_avedist_drl | float | -99 | average distance from OK |
rescat_id | float | 4 | rescat pass |
rescat_nholes | short | -99 | resource classification no of holes |
rescat_nsamps | short | 0 | resource classification no of samples |
risk | float | -99 | risk rating final |
risk_dq | float | -99 | data quality risk |
risk_ecn | float | -99 | economic risk: 1=STC_MC 3 m buffer |
risk_est | float | -99 | 1 = veins in LOMP |
risk_geo | float | -99 | 1= GC dvt, 2=GC IND, 3=RES IND, 4=RES 16 m, 6=AQF, 7=LOMP vns, 9=INF vns |
Document ID: STU-063-REP-002-0 Released: 11th December 2024Page 104 of 244
OceanaGold Corporation | ||
NI 43-101 Technical Report – Waihi District Pre-feasibility Study, New Zealand | ||
Model Field | Type | Default Value | Description |
sg | float | 2.5 | density |
sg_pre | float | -99 | density pre-mine |
Table 14-6: MUG Summary of Search Neighbourhood Parameters for Au Estimate
Pass Number | Orientation (VULCAN) | Search Directions | Maximum Samples per Drillhole | Minimum Samples per Estimate | Maximum Samples per Estimate |
1 (with GC UG channel) | LVA | 60/40/15 | 4 | 5 | 18 |
2 | LVA | 120/100/40 | 4 | 5 | 18 |
3 | LVA | 120/100/40 | 4 | 1 | 18 |
14.1.6Reconciliation
Table 14-7 summarises the annual reconciliation for the MUG Resource estimate vs mill reconciled stope
and development. 2024 year-to-date includes mining up to and including October 2024. Since 2021 MUG
has been the predominant ore source, replacing the Correnso vein. Mining during 2022 and 2023 has
resulted in significantly more contained gold than estimated, albeit at lower grade. Whilst the MUG
Resource estimates have over-stated grade by approximately 10 %, mining dilution has been the major
cause of poor grade reconciliation. More recently, in areas of remnant mining, where higher grades
commonly occur along the margins of stopes, under-break has also contributed to lower than expected
grades.
Document ID: STU-063-REP-002-0 Released: 11th December 2024Page 105 of 244
OceanaGold Corporation | ||
NI 43-101 Technical Report – Waihi District Pre-feasibility Study, New Zealand | ||
Table 14-7. MUG Resource Estimate vs Mill-Reconciled Stope and Development
Resource Model | Mine (Mill-Reconciled) | Mine / Model Factor (%) | |||||||
Mt | Au g/t | Moz | Mt | Au g/t | Moz | Mt | Au g/t | Moz | |
2024 YTD* | 0.23 | 4.23 | 0.03 | 0.45 | 3.01 | 0.04 | 199% | 71% | 141% |
2023 | 0.26 | 4.55 | 0.04 | 0.47 | 3.49 | 0.05 | 184% | 77% | 141% |
2022 | 0.30 | 4.88 | 0.05 | 0.36 | 3.67 | 0.04 | 121% | 75% | 91% |
2021 | 0.22 | 4.19 | 0.03 | 0.29 | 3.24 | 0.03 | 132% | 77% | 100% |
2020 | 0.13 | 5.80 | 0.02 | 0.13 | 5.30 | 0.02 | 100% | 91% | 92% |
2019 | 0.43 | 5.52 | 0.08 | 0.43 | 5.60 | 0.08 | 100% | 101% | 101% |
2018 | 0.40 | 6.20 | 0.08 | 0.43 | 6.80 | 0.09 | 108% | 110% | 119% |
TOTAL | 1.96 | 5.15 | 0.33 | 2.56 | 4.40 | 0.36 | 131% | 85% | 112% |
*YTD Oct (Planning model within GC Design)
14.2MOP
14.2.1Geological Model
The MOP model shares a common architecture and inputs with the MUG model. Open pit mining
selectivity and cut-off grade is considered in estimation domaining, with smaller veins grouped into “bulk
domains” of common characteristic and orientation, intersected by major vein domains. A 0.1 g/t grade
shell is applied to constrain the grades within these bulk domains. The 0.1 g/t grade shell was constructed
using an indicator interpolant in Leapfrog Geo® with structural trend following the major vein trends.
Lithological and oxide modelling is common to both the MOP and MUG mines.
•20 veins
•7 bulk domains.
14.2.2Exploratory data Analysis
Summary statistics for the major MOP5 domains and the bulk domains are presented in Table 14-8. The
open pit channel and RC data has been utilized in the construction of the Martha model, these datasets
are spatially distinct from each other and cover those portions of the deposit that have already been
mined or are immediately adjacent to the mined portion of the deposit whereas the exploration drilling
data covers the full extent of the area being modelled. Data analysis is completed for each domain and
each data type as a routine process in the construction of the Martha grade estimates. Differing
composite lengths are utilized for differing styles of Mineralization within the Martha deposit. To this end
data analysis is also conducted on 2 m for veins and 3 m composites for bulk domains.
Document ID: STU-063-REP-002-0 Released: 11th December 2024Page 106 of 244
OceanaGold Corporation | ||
NI 43-101 Technical Report – Waihi District Pre-feasibility Study, New Zealand | ||
Table 14-8: Summary Statistics of Composite Au Values for MOP
Comp Length | Domain | Count | Length | Mean | Std Dev | CV | Variance | Minimum | Lower Quartile | Median | Upper Quartile | Maximum |
2m | 1100 | 7985 | 15,534.54 | 3.61 | 6.76 | 1.88 | 45.71 | 0.00 | 0.47 | 1.40 | 3.88 | 186.55 |
2m | 1110 | 113 | 202.85 | 2.59 | 6.37 | 2.46 | 40.54 | 0.00 | 0.09 | 0.52 | 2.69 | 48.70 |
2m | 1120 | 141 | 269.50 | 1.92 | 3.53 | 1.84 | 12.46 | 0.01 | 0.04 | 0.63 | 2.10 | 30.80 |
2m | 1131 | 424 | 751.40 | 3.21 | 4.56 | 1.42 | 20.8 | 0.01 | 0.42 | 1.62 | 4.15 | 44.00 |
2m | 1140 | 69 | 116.40 | 1.77 | 2.97 | 1.68 | 8.82 | 0.00 | 0.15 | 0.49 | 2.31 | 14.82 |
2m | 1141 | 74 | 103.35 | 1.85 | 3.28 | 1.77 | 10.75 | 0.02 | 0.18 | 0.51 | 1.98 | 13.56 |
2m | 1201 | 634 | 1,202.70 | 3.04 | 5.57 | 1.83 | 31.03 | 0.00 | 0.17 | 0.91 | 3.32 | 48.96 |
2m | 1220 | 2210 | 4,286.48 | 5.02 | 9.95 | 1.98 | 99.07 | 0.00 | 0.5 | 2.04 | 5.69 | 243.20 |
2m | 1221 | 89 | 152.20 | 5.24 | 5.42 | 1.03 | 29.37 | 0.01 | 1.11 | 3.91 | 7.71 | 21.96 |
2m | 1302 | 940 | 1,754.58 | 3.19 | 4.82 | 1.51 | 23.2 | 0.00 | 0.63 | 1.60 | 4.10 | 80.01 |
2m | 1304 | 769 | 1,500.90 | 2.74 | 6.53 | 2.38 | 42.59 | 0.01 | 0.32 | 1.03 | 3.09 | 139.73 |
2m | 1305 | 3375 | 6,484.89 | 4.14 | 5.79 | 1.4 | 33.47 | 0.00 | 0.73 | 2.08 | 5.13 | 88.66 |
2m | 1306 | 133 | 205.75 | 3.46 | 4.21 | 1.22 | 17.71 | 0.00 | 0.26 | 2.03 | 4.94 | 22.00 |
2m | 1307 | 104 | 155.20 | 1.73 | 2.71 | 1.56 | 7.35 | 0.00 | 0.17 | 0.65 | 2.25 | 13.97 |
2m | 1308 | 811 | 1,521.00 | 4.48 | 7.54 | 1.68 | 56.82 | 0.00 | 0.52 | 1.91 | 5.34 | 98.80 |
2m | 1309 | 145 | 272.23 | 4.18 | 9.34 | 2.23 | 87.15 | 0.01 | 0.26 | 1.07 | 3.35 | 82.10 |
2m | 1400 | 2160 | 4,227.91 | 5.23 | 10.83 | 2.07 | 117.39 | 0.00 | 0.60 | 2.00 | 5.81 | 209.50 |
2m | 1500 | 935 | 1,811.67 | 4.16 | 6.78 | 1.63 | 46 | 0.01 | 0.55 | 2.01 | 5.11 | 101.58 |
2m | 1510 | 83 | 166.51 | 8.95 | 12.17 | 1.36 | 148.05 | 0.02 | 0.55 | 2.85 | 12.82 | 49.80 |
2m | 1511 | 30 | 58.50 | 1.51 | 2.41 | 1.6 | 5.83 | 0.01 | 0.07 | 0.61 | 1.98 | 9.03 |
3m | 1900 | 163 | 485.79 | 4.58 | 10.62 | 2.32 | 112.87 | 0.01 | 0.23 | 0.80 | 4.15 | 70.81 |
3m | 1901 | 3859 | 11,396.14 | 1.36 | 3.33 | 2.44 | 11.06 | 0.00 | 0.15 | 0.38 | 1.21 | 87.13 |
3m | 1902 | 5550 | 16,197.67 | 1.29 | 2.8 | 2.18 | 7.84 | 0.00 | 0.15 | 0.40 | 1.24 | 60.50 |
3m | 1903 | 10400 | 30,230.31 | 1.66 | 4.42 | 2.66 | 19.5 | 0.00 | 0.17 | 0.47 | 1.48 | 173.84 |
3m | 1904 | 6752 | 19,997.63 | 1.28 | 3.06 | 2.4 | 9.36 | 0.00 | 0.20 | 0.47 | 1.27 | 106.42 |
3m | 1905 | 13230 | 39,622.25 | 1.44 | 2.78 | 1.93 | 7.75 | 0.00 | 0.26 | 0.63 | 1.58 | 123.08 |
3m | 1906 | 465 | 1,371.06 | 1.72 | 4.23 | 2.47 | 17.9 | 0.01 | 0.14 | 0.35 | 1.14 | 49.52 |
Document ID: STU-063-REP-002-0 Released: 11th December 2024Page 107 of 244
OceanaGold Corporation | ||
NI 43-101 Technical Report – Waihi District Pre-feasibility Study, New Zealand | ||
14.2.3Compositing, Grade Capping and Outlier Restrictions
Domain specific assessment of Au capping strategy was conducted from spatial review of data, its
distribution on raw histograms, lognormal probability plots, review of uncut vs cut percentiles, coefficient
of variance, and metal loss. Top-cut assessment for Au for each domain is undertaken independently for
exploration drill holes and grade control channels. A global top-cut values were assigned to silver and
Document ID: STU-063-REP-002-0 Released: 11th December 2024Page 108 of 244
OceanaGold Corporation | ||
NI 43-101 Technical Report – Waihi District Pre-feasibility Study, New Zealand | ||
arsenic. Values of 400 ppm for silver and 1300 ppm for arsenic were assigned to each element. Table
14-9 shows the top cut statistics for Au for all domains.
Table 14-9: Summary Statistics of Cut Au for MOP
Domain | Count | Length | Mean | Std Dev | CV | Variance | Minimum | Lower Quartile | Median | Upper Quartile | Maximum |
1100 | 7985 | 15534.54 | 3.54 | 5.92 | 1.67 | 35.04 | 0.00 | 0.47 | 1.40 | 3.88 | 56 |
1110 | 113 | 202.85 | 1.93 | 2.72 | 1.41 | 7.39 | 0.00 | 0.09 | 0.52 | 2.69 | 10 |
1120 | 141 | 269.50 | 1.69 | 2.46 | 1.45 | 6.05 | 0.01 | 0.04 | 0.63 | 2.00 | 11 |
1131 | 424 | 751.40 | 3.04 | 3.72 | 1.22 | 13.85 | 0.01 | 0.42 | 1.62 | 4.15 | 20 |
1140 | 69 | 116.40 | 1.77 | 2.97 | 1.68 | 8.82 | 0.00 | 0.15 | 0.49 | 2.31 | 14.82 |
1141 | 74 | 103.35 | 1.27 | 1.59 | 1.25 | 2.52 | 0.02 | 0.18 | 0.51 | 1.98 | 5 |
1201 | 634 | 1202.70 | 2.82 | 4.70 | 1.67 | 22.06 | 0.00 | 0.17 | 0.91 | 3.32 | 32.5 |
1220 | 2210 | 4286.48 | 4.76 | 7.36 | 1.55 | 54.11 | 0.00 | 0.5 | 2.04 | 5.69 | 50 |
1221 | 89 | 152.20 | 4.97 | 5.10 | 1.03 | 26.03 | 0.01 | 1.11 | 3.91 | 7.71 | 21.96 |
1302 | 940 | 1754.58 | 3.10 | 3.91 | 1.26 | 15.28 | 0.00 | 0.63 | 1.60 | 4.10 | 26 |
1304 | 769 | 1500.90 | 2.49 | 3.73 | 1.49 | 13.88 | 0.01 | 0.32 | 1.03 | 3.09 | 23 |
1305 | 3375 | 6484.89 | 4.06 | 5.31 | 1.31 | 28.15 | 0.00 | 0.73 | 2.08 | 5.13 | 32 |
1306 | 133 | 205.75 | 3.36 | 3.88 | 1.15 | 15.08 | 0.00 | 0.26 | 2.03 | 4.94 | 16 |
1307 | 104 | 155.20 | 1.50 | 1.91 | 1.28 | 3.67 | 0.00 | 0.17 | 0.65 | 2.25 | 6.5 |
1308 | 811 | 1521.00 | 4.30 | 6.36 | 1.48 | 40.47 | 0.00 | 0.52 | 1.91 | 5.34 | 42 |
1309 | 145 | 272.23 | 3.11 | 4.59 | 1.47 | 21.04 | 0.01 | 0.26 | 1.07 | 3.35 | 16 |
1400 | 2160 | 4227.91 | 4.88 | 7.78 | 1.59 | 60.45 | 0.00 | 0.6 | 2.00 | 5.81 | 50 |
1500 | 935 | 1811.67 | 4.06 | 5.80 | 1.43 | 33.63 | 0.01 | 0.55 | 2.01 | 5.11 | 42 |
1510 | 83 | 166.51 | 8.50 | 10.96 | 1.29 | 120.18 | 0.02 | 0.55 | 2.85 | 12.82 | 32.5 |
1511 | 30 | 58.50 | 1.17 | 1.46 | 1.25 | 2.13 | 0.01 | 0.07 | 0.61 | 1.98 | 4.5 |
1900 | 163 | 485.79 | 3.06 | 4.45 | 1.45 | 19.79 | 0.01 | 0.23 | 0.80 | 4.15 | 15 |
1901 | 3859 | 11396.14 | 1.31 | 2.57 | 1.97 | 6.61 | 0.00 | 0.15 | 0.38 | 1.21 | 28.5 |
1902 | 5550 | 16197.67 | 1.25 | 2.41 | 1.92 | 5.79 | 0.00 | 0.15 | 0.40 | 1.24 | 29.88 |
1903 | 10400 | 30230.31 | 1.59 | 3.36 | 2.12 | 11.31 | 0.00 | 0.17 | 0.47 | 1.48 | 47 |
1904 | 6752 | 19997.63 | 1.24 | 2.49 | 2.01 | 6.18 | 0.00 | 0.2 | 0.47 | 1.27 | 55 |
1905 | 13230 | 39622.25 | 1.43 | 2.48 | 1.74 | 6.16 | 0.00 | 0.26 | 0.63 | 1.58 | 55 |
1906 | 465 | 1371.06 | 1.45 | 2.64 | 1.82 | 6.99 | 0.01 | 0.14 | 0.35 | 1.14 | 12 |
14.2.4Variography
Variograms are modelled using Leapfrog EDGE’s® data analysis tools. For domains that don’t have
sufficient data to produce reasonable variograms, a general variogram is applied. Orientations of the omni
Document ID: STU-063-REP-002-0 Released: 11th December 2024Page 109 of 244
OceanaGold Corporation | ||
NI 43-101 Technical Report – Waihi District Pre-feasibility Study, New Zealand | ||
direction variogram are defined by the orientation of each vein. While vein orientations of all major and
minor veins were used for bulk domains.
Spherical variogram models were fit for the domains. The variograms are characterized by moderately
high nuggets (20-40 % of the sill), with ranges of 35 – 80 m in the primary direction.
14.2.5Block Modelling and Validation
MOP5 deposit is estimated in Leapfrog EDGE®, the model is constructed using a sub-blocked model of
1.25 m dimensions in all directions. The model is however, regularized into a 5 m cell size prior to pit
optimisation assessment. Octant search is applied to all domains. The grade is estimated in a 10 m x
10 m x 10 m parent cell using OK with LVA applied to address complex geometries. Tabulation of
dimensions, parameters, and field codes used in the model are presented in Table 14-10, Table 14-11,
and Table 14-12.
Estimations were performed in individual domains using 2 m length weighted downhole composites for all
vein-based domains and 3 m length weighted composites for the lithological (bulk) domains. Domain
boundaries are treated as hard contacts in compositing, model construction and in grade estimation.
Table 14-10: MOP5 Block Model Dimensions
Variable | X | Y | Z |
Origin | 395150 | 642330 | 750 |
Extents (m) | 1500 | 1050 | 450 |
Block Size (Parent) | 10 | 10 | 10 |
Sub-Block Size | 1.25 | 1.25 | 1.25 |
Orientation | +65 degrees | X-axis around Z |
Table 14-11: MOP Estimation Parameters used in Estimate
Pass Number | Orientation (EDGE®) | Search Directions | Maximum Samples per Drillhole | Minimum Samples per Estimate | Maximum Samples per Estimate |
1 | LVA | 35-80/15- 70/5-30 | 4 | 6 | 20 |
2 | LVA | 120/100/30 | 4 | 6 | 20 |
Document ID: STU-063-REP-002-0 Released: 11th December 2024Page 110 of 244
OceanaGold Corporation | ||
NI 43-101 Technical Report – Waihi District Pre-feasibility Study, New Zealand | ||
Table 14-12: List of Fields in MOP Model
Model Field | Type | Default Value | Description |
ag_pref | float | -99 | preferred Ag |
au_ok | float | -99 | Au estimate; Ordinary kriged LVA |
au_id2 | float | -99 | Au estimate; inverse distance |
au_pref | float | -99 | preferred Au |
code | short | -99 | domain code |
pass | float | -99 | estimation pass number |
geol | name | none | lithology |
mined | byte | 0 | 0= Insitu,1=STF, 2 =STC and MC, 5=STO, 6=Lvls and Passes, 7=STR |
oxide | byte | 2 | 1=totally ox; 2=>50% ox; 3=<50% ox; 4=along fractures; 5=fresh |
pit | byte | -99 | 1=air, 2=MOP Ph4, 3=MOP Ph5, 4=below MOP Ph5 |
rescat | byte | 6 | 6=unestimated unclassified; 4=estimated unclassified and dilution; 3=inferred; 2=indicated; 1=measured |
rescat_prelim | byte | -99 | resource classification prior to post-processing |
sg | float | 2.5 | density |
sg_pre | float | -99 | density pre-mine |
Document ID: STU-063-REP-002-0 Released: 11th December 2024Page 111 of 244
OceanaGold Corporation | ||
NI 43-101 Technical Report – Waihi District Pre-feasibility Study, New Zealand | ||
14.3Gladstone Pit
14.3.1Geological Model
Gladstone Open Pit is based on Mineralization around the Gladstone Hill and Winner Hill area. The
Resource model describes the Mineralization within Gladstone and Winner Hills and includes part of the
Moonlight orebody, depleted for underground mining.
GOP mineralization is characterized by shallow-level, hydrothermal breccias and associated banded
quartz veins interpreted to represent the top of the epithermal system. The uppermost mineralized quartz
veins flare up into hydrothermal explosion breccias. The GOP veins are predominantly steeply dipping
veins developed within the hanging wall of the Favona Fault that dips moderately towards the SE. The
vein trend ENE to NE between 035° and 075° and dips steeply towards the SE.
Relatively high vein density at GOP is amenable to grouping of non-primary veins of similar structural and
geochemical characteristic, for open pit modelling. Estimation domains consist of:
•6 veins
•8 grouped minor vein/splay domains
•5 lithology units.
14.3.2Exploratory data Analysis
Weighted statistics of raw and cut Au values were reviewed using Isatis and Leapfrog®. Tabulated below
in Table 14-13.
Document ID: STU-063-REP-002-0 Released: 11th December 2024Page 112 of 244
OceanaGold Corporation | ||
NI 43-101 Technical Report – Waihi District Pre-feasibility Study, New Zealand | ||
Table 14-13: Summary Statistics for Composite Au Values for GOP
Domain | Total Count | Defined Count | Minimum | Maximum | Mean | Standard Deviation | Variance | Coefficient of Variation |
N/A | 884 | 884 | 0.01 | 22.8 | 0.25 | 1.52 | 2.3160 | 6.004 |
6000 | 557 | 557 | 0.01 | 6.4 | 0.44 | 0.77 | 0.5971 | 1.747 |
6101 | 324 | 324 | 0.04 | 66.2 | 3.29 | 5.88 | 34.6000 | 1.785 |
6102 | 183 | 183 | 0.02 | 9.88 | 1.64 | 1.67 | 2.7900 | 1.017 |
6109 | 124 | 124 | 0.04 | 10.7 | 1.51 | 1.55 | 2.3920 | 1.022 |
6115 | 83 | 83 | 0.07 | 5.82 | 1.12 | 1.05 | 1.0950 | 0.9319 |
6116 | 108 | 108 | 0.14 | 13.83 | 1.56 | 1.85 | 3.4270 | 1.185 |
6200 | 127 | 127 | 0.01 | 0.37 | 0.07 | 0.08 | 6.012E-03 | 1.08 |
6201 | 1039 | 1039 | 0.01 | 10.64 | 0.41 | 0.65 | 0.4166 | 1.585 |
6203 | 95 | 95 | 0.02 | 0.47 | 0.05 | 0.06 | 3.908E-03 | 1.187 |
6205 | 47 | 47 | 0.01 | 2.18 | 0.06 | 0.27 | 0.07358 | 4.254 |
6206 | 154 | 154 | 0.01 | 1.61 | 0.19 | 0.28 | 0.07939 | 1.469 |
6901 | 580 | 580 | 0.01 | 7.26 | 0.15 | 0.41 | 0.1649 | 2.635 |
6902 | 1051 | 1051 | 0.01 | 2.97 | 0.12 | 0.23 | 0.05371 | 1.923 |
6903 | 3169 | 3169 | 0.00 | 52.9 | 0.10 | 0.97 | 0.9397 | 9.256 |
6904 | 2986 | 2986 | 0.01 | 27.42 | 0.51 | 1.07 | 1.1400 | 2.081 |
6905 | 2176 | 2176 | 0.01 | 11.11 | 0.30 | 0.6 | 0.3600 | 1.997 |
6906 | 955 | 955 | 0.00 | 13.29 | 0.63 | 1.09 | 1.1800 | 1.735 |
6907 | 3128 | 3128 | 0.01 | 80.81 | 1.42 | 3.7 | 13.72 | 2.606 |
6908 | 1387 | 1387 | 0.01 | 15.44 | 0.15 | 0.59 | 0.3426 | 3.895 |
14.3.3Compositing, Grade Capping and Outlier Restrictions
Domain specific assessment of Au capping strategy was conducted in Isatis Neo from spatial review of
data, its distribution on raw histograms, lognormal probability plots, review of uncut vs cut percentiles,
coefficient of variance, and metal loss.
14.3.4Variography
Variogram modelling was undertaken for five representative domains – three structural domains and two
bulk domains. Domain search characteristics and statistics were compared in determining the application
of these variograms to neighbouring domains.
The nugget effect was obtained from the down hole variograms of the 3 m composites. The nuggets were
in the range 20-60 %.
14.3.5Block Modelling and Validation
The GOP Resource model is constructed in Vulcan 2022.2.1 using input wireframes created in Leapfrog
Geo® 2021.2.5. The estimation uses domain-constrained ordinary kriging and 3 m length weighted
downhole composites with equal residual distribution. Estimation domains consist of major veins, grouped
splay veins and hydrothermal breccia.
Document ID: STU-063-REP-002-0 Released: 11th December 2024Page 113 of 244
OceanaGold Corporation | ||
NI 43-101 Technical Report – Waihi District Pre-feasibility Study, New Zealand | ||
Gold and silver are estimated using Ordinary Kriging and underlying search strategy. For vein domains,
bearing plunge and dip are assigned to block variables using the anisotropy workflow and hanging wall
surfaces. These LVA orientations are then used to inform search orientation. Estimation is for the parent
block with assignment to the sub-block. Table 14-14 shows the GOP estimation parameters.
Table 14-14: GOP Estimation Parameters
Domain | Orientation (VULCAN) | Search Dimensions | Min Samples | Max samples | Octant search | Discretisation | Max No of Samples per hole |
6000 | LVA | 150/140/26 | 6 | 9 | No | 4/8/8 | 3 |
6101 | LVA | 130/80/25 | 6 | 9 | No | 4/8/8 | 3 |
6102 | LVA | 130/80/25 | 6 | 9 | No | 4/8/8 | 3 |
6109 | LVA | 130/80/25 | 6 | 9 | No | 4/8/8 | 3 |
6115 | LVA | 130/80/25 | 6 | 9 | No | 4/8/8 | 3 |
6116 | LVA | 130/80/25 | 6 | 9 | No | 4/8/8 | 3 |
6201 | 110/0/-24 | 100/90/20 | 6 | 12 | No | 4/8/8 | 3 |
6901 | 145/-60/0 | 160/130/60 | 6 | 12 | No | 4/8/8 | 3 |
6902 | 50/0/-50 | 140/60/40 | 6 | 12 | No | 4/8/8 | 3 |
6903 | 45/0/-70 | 140/60/40 | 6 | 12 | No | 4/8/8 | 3 |
6904 | 37/0/-85 | 160/130/60 | 6 | 12 | No | 4/8/8 | 3 |
6905 | 45/0/85 | 140/90/20 | 6 | 12 | No | 4/8/8 | 3 |
6906 | 65/0/-80 | 140/90/20 | 6 | 12 | No | 4/8/8 | 3 |
6907 | 30/0/75 | 160/130/60 | 6 | 12 | No | 4/8/8 | 3 |
6908 | 30/0/75 | 140/90/20 | 6 | 12 | No | 4/8/8 | 3 |
Document ID: STU-063-REP-002-0 Released: 11th December 2024Page 114 of 244
OceanaGold Corporation | ||
NI 43-101 Technical Report – Waihi District Pre-feasibility Study, New Zealand | ||
The block model dimensions, origin and cell size have been selected based on global change of support
assessment. The model was extended to the NW relative to previous versions to populate slackened wall
designs associated with a TSF concept. Block rotation was chosen as the mean of the two dominant
structural orientations, with cross-strike width set at 5 m to reflect reduced geological continuity in this
orientation. Sub-blocking to 2.5 m was enabled to honour anastomosing vein geometries. Table 14-15
shows the GOP block model dimensions and Figure 14-1 shows a list of fields used in the GOP model.
Table 14-15: GOP Block Model Dimensions
Variable | X | Y | Z |
Origin | 396600 | 642250 | 900 |
Extents (m) | 450 | 800 | 300 |
Block Size (Parent) | 5 | 10 | 10 |
Sub-Block Size | 2.5 | 2.5 | 2.5 |
Orientation | +135 degrees | X axis around Z |
Document ID: STU-063-REP-002-0 Released: 11th December 2024Page 115 of 244
OceanaGold Corporation | ||
NI 43-101 Technical Report – Waihi District Pre-feasibility Study, New Zealand | ||
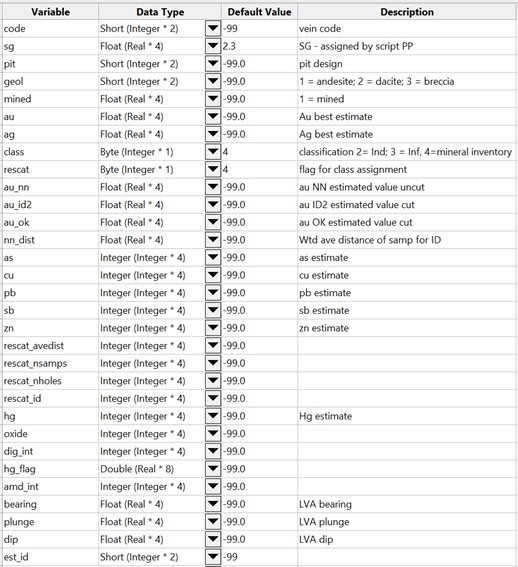
Figure 14-1: List of Fields in GOP Model
14.4Wharekirauponga
14.4.1Geological Model
Veins were modelled using Leapfrog Geo® 2023.2.1. Geological logging of drill core such as vein
textures, vein mineralogy, vein percentage and breccia type were initially used to create representative
wireframes of vein structures. These initial wireframes were then modified on a vein-by-vein basis and
compared to Au and Ag grade, core photography and structural measurements to establish geological
consistency between veins. Some narrow, discontinuous high-gold grade intercepts that cannot be
corelated with neighbouring drillholes have been excluded from the vein modelling.
Document ID: STU-063-REP-002-0 Released: 11th December 2024Page 116 of 244
OceanaGold Corporation | ||
NI 43-101 Technical Report – Waihi District Pre-feasibility Study, New Zealand | ||
14.4.2Exploratory Data Analysis
Outputs from the analysis are presented in Table 14-16.
Table 14-16: Summary Statistics of Composite Au Values for WUG
Domain | Count | Length | Mean | Std Dev | CV | Variance | Minimum | Lower Quartile | Median | Upper Quartile | Maximum |
410 | 297 | 293.85 | 20.19 | 54.17 | 2.68 | 2934.12 | 0.01 | 1.22 | 6.57 | 20.38 | 805.34 |
425 | 622 | 622.6 | 22.88 | 36.10 | 1.58 | 1,303.45 | 0.09 | 2.38 | 8.58 | 28.07 | 361.40 |
430 | 319 | 311.05 | 6.39 | 20.36 | 3.18 | 414.48 | 0.10 | 0.81 | 1.49 | 4.65 | 285.00 |
431 | 198 | 192.6 | 2.14 | 3.61 | 1.69 | 13.04 | 0.16 | 0.67 | 1.17 | 2.13 | 38.70 |
432 | 112 | 105.7 | 2.96 | 4.58 | 1.55 | 21.01 | 0.15 | 0.63 | 1.25 | 2.92 | 25.32 |
433 | 147 | 142.9 | 2.04 | 5.52 | 2.71 | 30.45 | 0.01 | 0.44 | 0.81 | 1.47 | 70.70 |
434 | 58 | 57.25 | 0.84 | 1.07 | 1.26 | 1.14 | 0.01 | 0.18 | 0.48 | 1.03 | 5.22 |
435 | 47 | 46 | 3.19 | 9.75 | 3.06 | 94.98 | 0.01 | 0.24 | 0.88 | 2.09 | 58.20 |
436 | 129 | 126.7 | 7.24 | 12.02 | 1.66 | 144.52 | 0.22 | 0.79 | 2.56 | 7.93 | 81.66 |
510 | 38 | 36.3 | 6.98 | 8.92 | 1.28 | 79.54 | 0.36 | 1.46 | 2.75 | 7.54 | 37.50 |
511 | 122 | 117.42 | 13.32 | 24.39 | 183 | 595.07 | 0.02 | 1.11 | 3.42 | 18.44 | 206.00 |
512 | 48 | 49.1 | 7.48 | 9.00 | 1.20 | 81.09 | 0.01 | 1.02 | 4.84 | 10.55 | 46.45 |
513 | 37 | 33.9 | 2.27 | 5.11 | 2.25 | 26.09 | 0.01 | 0.32 | 0.87 | 2.02 | 41.80 |
514 | 41 | 38.93 | 2.57 | 5.21 | 2.03 | 27.20 | 0.16 | 0.62 | 1.42 | 3.19 | 44.14 |
515 | 33 | 32.35 | 3.75 | 4.11 | 1.09 | 16.86 | 0.29 | 0.95 | 2.50 | 4.27 | 19.83 |
516 | 7 | 7 | 6.79 | 8.11 | 1.19 | 65.70 | 0.82 | 2.00 | 3.18 | 8.92 | 24.02 |
560 | 51 | 49.18 | 3.26 | 3.18 | 0.98 | 10.11 | 0.13 | 0.75 | 2.45 | 4.76 | 17.70 |
561 | 33 | 30.2 | 6.30 | 8.94 | 1.42 | 79.91 | 0.20 | 1.05 | 2.92 | 6.46 | 44.60 |
562 | 50 | 46.45 | 5.62 | 8.51 | 1.51 | 72.45 | 0.17 | 0.78 | 2.22 | 7.19 | 50.60 |
563 | 58 | 58.3 | 3.56 | 4.18 | 1.17 | 17.45 | 0.18 | 1.07 | 2.06 | 5.06 | 23.70 |
564 | 52 | 51.16 | 2.14 | 1.61 | 0.75 | 2.60 | 0.15 | 0.74 | 1.85 | 2.94 | 7.43 |
565 | 37 | 32.52 | 3.15 | 4.77 | 1.52 | 22.80 | 0.18 | 0.60 | 1.23 | 3.08 | 20.40 |
566 | 52 | 51.1 | 6.09 | 9.21 | 1.51 | 84.76 | 0.10 | 2.06 | 3.34 | 6.61 | 58.40 |
567 | 21 | 18 | 20.68 | 34.36 | 1.66 | 1,180.73 | 0.25 | 2.26 | 11.60 | 21.60 | 157.00 |
590 | 17 | 16.18 | 8.37 | 15.19 | 1.81 | 230.85 | 0.02 | 0.07 | 3.50 | 6.02 | 55.10 |
591 | 17 | 17.45 | 11.17 | 20.10 | 1.80 | 403.96 | 0.03 | 0.50 | 2.49 | 10.86 | 75.62 |
592 | 7 | 6.7 | 2.87 | 3.54 | 1.24 | 12.54 | 0.13 | 0.20 | 1.67 | 4.63 | 9.70 |
593 | 11 | 10.6 | 4.57 | 5.13 | 1.12 | 26.34 | 1.03 | 1.07 | 2.43 | 6.21 | 17.50 |
600 | 162 | 160.59 | 2.63 | 6.49 | 2.47 | 42.18 | 0.03 | 0.34 | 0.60 | 1.65 | 52.20 |
700 | 12098 | 12,068.40 | 0.56 | 1.23 | 2.19 | 1.51 | 0.01 | 0.17 | 0.31 | 0.58 | 40.08 |
14.4.3Compositing, Grade Capping and Outlier Restrictions
One-metre composites using codes backflagged from the geological model as a control. Residual lengths
are added to previous interval and minimum coverage is at 30 %, allowing a sample at the minimum
Document ID: STU-063-REP-002-0 Released: 11th December 2024Page 117 of 244
OceanaGold Corporation | ||
NI 43-101 Technical Report – Waihi District Pre-feasibility Study, New Zealand | ||
sample length of 30 cm to create a composite in single-sample width intersects. The composite length
was based on the mean sampling length used in core sampling. Two-meter composites were examined,
as part of geostatistical review, to test sensitivity.
Domain specific assessment of Au capping strategy was conducted from spatial review of data, its
distribution on raw histograms, lognormal probability plots, review of uncut vs cut percentiles, coefficient
of variance, and metal loss using Isatis Neo.
Clamping is applied to domains 425 and 410, whereby a secondary cap is applied beyond a percentage
of the search distance, limiting the influence of the observed localized high-grade populations.
The clamping values of 72 g/t for 425 and 58 g/t for 410 were determined by grade vs x/y/z cross-plots,
and visual assessment of grade distribution within the domains’ histogram and normal-probability breaks.
Subdomaining the high-grade population was undertaken as part of sensitivity analysis. Hard boundaries
were investigated but not introduced, with review of geological and geochemical data failing to determine
physical characteristics distinguishing high-grade samples from the rest of the domain population.
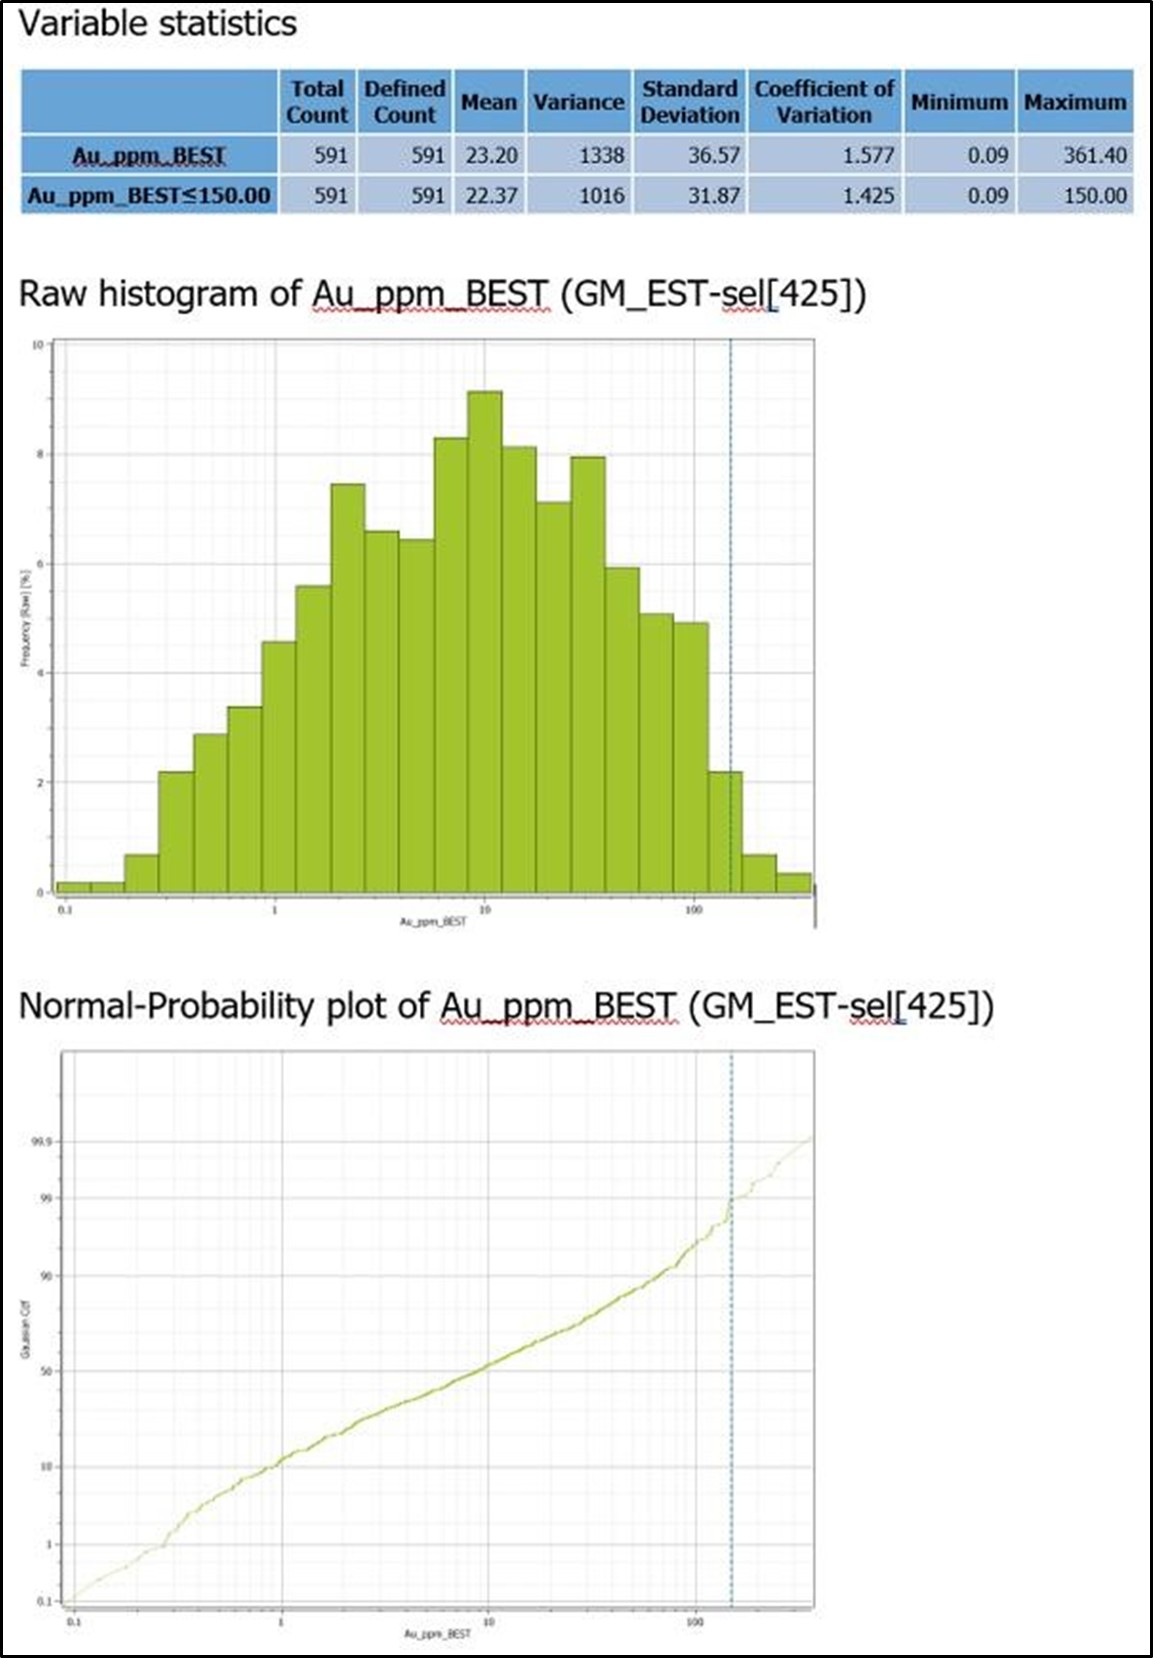
Figure 14-2: Vein 425 uncapped – (top) plot of Au ppm in histogram / (bottom) probability plot
of Au
Document ID: STU-063-REP-002-0 Released: 11th December 2024Page 118 of 244
OceanaGold Corporation | ||
NI 43-101 Technical Report – Waihi District Pre-feasibility Study, New Zealand | ||
14.4.4Variography
Variograms for the veins 410 and 425 of the estimated Au variable were constructed from the 1 m topcut
composite data within each of the respective estimation domains, using Isatis™ (Geovariances) software.
The traditional semi-variograms did not exhibit robust structures and to improve the variogram, the data
was transformed into Normal Score in Leapfrog EDGE® and back transformed.
Initially, down hole experimental variograms were calculated to establish the nugget for modelling the
directional variograms for grade. The geology and geometry of Mineralization controls were also
considered in selecting the orientations. Two-structured spherical models were fitted to the variograms
produced. Variogram orientations reflected obvious trends in the data. Variography results for vein 410
and 425 for Au ppm is summarized Figure 14-3 and Figure 14-4 respectively.
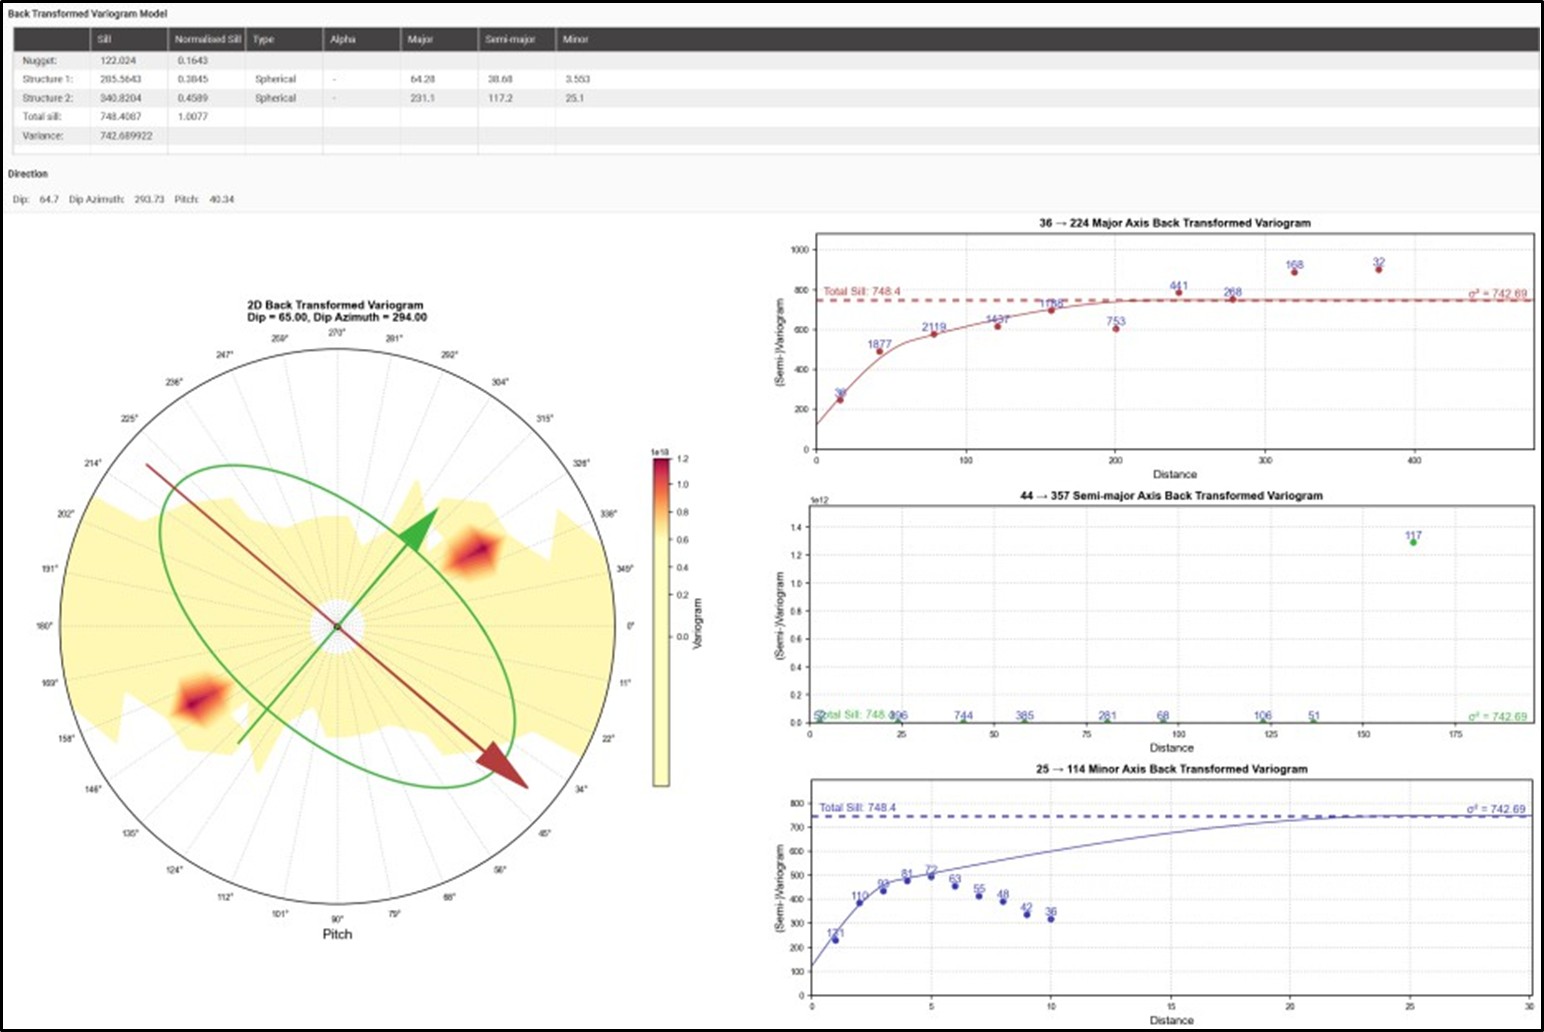
Figure 14-3: Summary of Back-Transformed Variogram Parameters (Vein = 410)
Document ID: STU-063-REP-002-0 Released: 11th December 2024Page 119 of 244
OceanaGold Corporation | ||
NI 43-101 Technical Report – Waihi District Pre-feasibility Study, New Zealand | ||
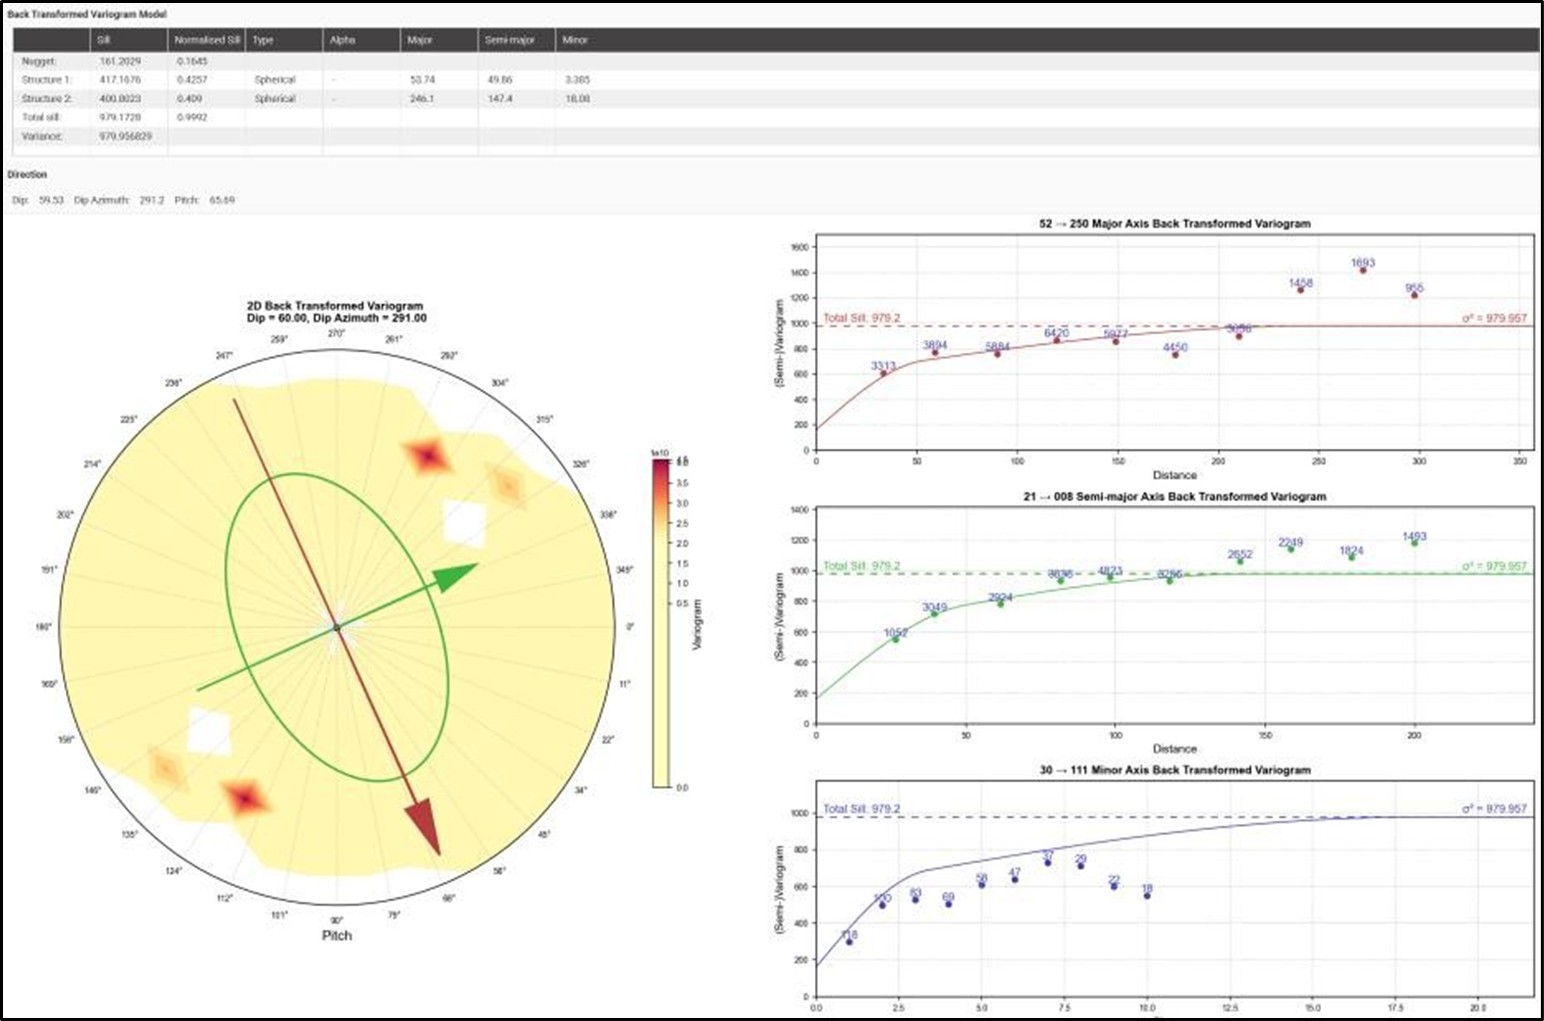
Figure 14-4: Summary of Back-Transformed Variogram Parameters (Vein = 425)
14.4.5Block Modelling and Validation
Gold and silver grades for all domains are estimated using Ordinary Kriging (OK) while all other elements
(As, Hg, S, and Sb) are estimated using Inverse Distance Squared (ID2) methodology. A local varying
anisotropy (LVA) rotation was applied for all estimations. No octant-based search strategy was employed.
A two-pass search strategy was established to interpolate grade for each of the estimation domains within
the mineralized domains.
The relevant veins were estimated using OK on the 1 m composite, grade capped samples. Domain
control (hard boundaries for Mineralization) were used for both composite and block selection. Grade
estimates were interpolated into parent cells and all sub-cells were assigned the parent cell grades. A
block discretisation of 2 (X points) x 5 (Y points) x 5 (Z points) was used.
The WUG block model is rotated in bearing to align with the dominant strike of the veins. Sub-blocking is
used to define narrow veins and to maintain volume integrity with the geology solids. A second estimation
was run for the classification, where the distance to the closest 3 drillholes is recorded. The estimation
parameters for WUG are summarized Table 14-17. A 7.5 m buffer surrounding the vein is estimated using
a local 50 m search and kriged estimate with a 2 g/t topcut. Table 14-18: shows the WUG block model
dimensions and Table 14-9 lists the fields in the WUG model.
Document ID: STU-063-REP-002-0 Released: 11th December 2024Page 120 of 244
OceanaGold Corporation | ||
NI 43-101 Technical Report – Waihi District Pre-feasibility Study, New Zealand | ||
Table 14-17: WUG Estimation Parameters
Pass Number | Orientation (EDGE®) | Maximum Search Directions | Intermediate Search Directions | Minimum Search Directions | Maximum Samples per Drillhole | Minimum Samples per Estimate | Maximum Samples per Estimate |
1 | Variable Orientation | 200 / 110 | 150 / 80 | 40 / 30 | 6 / 4 | 8 / 6 | 22 / 18 |
2 | Variable Orientation | 400 / 220 | 300 / 160 | 100 / 80 | 6 / 4 | 4 | 22 / 18 |
*Major Domain / Minor Domain parameter
Table 14-18: WUG Block Model Dimensions
Description | Data |
Number of parent blocks: | 235 × 99 × 41 = 953,865 |
Base point: | 1849150.00, 5867740.00, 345 |
Parent block size: | 4, 16, 16 |
Minimum sub-block size: | 1, 1, 1 |
Leapfrog Rotation: | |
Azimuth: | 25° |
Dip: | 0° |
Pitch: | 0° |
Boundary size: | 940, 1584, 656 |
Document ID: STU-063-REP-002-0 Released: 11th December 2024Page 121 of 244
OceanaGold Corporation | ||
NI 43-101 Technical Report – Waihi District Pre-feasibility Study, New Zealand | ||
Table 14-19: List of Fields in WUG Model
Model Field | Sub-field | Description |
Au_OK | Combined estimator using OK. Hierarchy P1> P2> Dilution | |
NS | Number of samples | |
AvgD | Average Euclidean distance to sample | |
KM | Kriging mean | |
KV | Kriging variance | |
SoR | Slope of regression | |
KE | Kriging efficiency | |
Dom | Domain code | |
Est | Estimator used to inform block | |
RESCAT | Resource Category Estimator | |
NS | Number of samples | |
AveD | Average Euclidean distance to sample | |
Dom | Domain code | |
Est | Estimator used to inform block | |
RES_CAT | Final Resource Category | |
Au_ID2 | Inverse distance Au estimate | |
Au_NN | Nearest Neighbour Au estimate | |
Ag_OK | Ordinary kriged Ag estimate | |
As_ID | Inverse distance As estimate | |
Hg_ID | Inverse distance Hg estimate | |
Sb_ID | Inverse distance Sb estimate | |
DENSITY | Density assigned by lithology | |
GM_EST | Estimation domain flagged from geology model | |
Manual_RESCAT | Classification domain flagged during classification workflow | |
GM_LITHOLOGY | Lithology flagged from geology model |
Document ID: STU-063-REP-002-0 Released: 11th December 2024Page 122 of 244
OceanaGold Corporation | ||
NI 43-101 Technical Report – Waihi District Pre-feasibility Study, New Zealand | ||
14.5Classification of Mineral Resources
The Resource Classification is based on an assessment of average drilling density. An estimation run is
undertaken utilising the three closest drill holes intersecting the domain of interest, the average distance
to the three closest drill holes used to estimate the block is then stored to form the basis for classification.
MUG uses an average spacing to three drill holes of 60 m for Inferred and 40 m for Indicated Resources.
Any mineralized backfill is not classified or inclusion within the Mineral Resource due to uncertainty in
both the continuity and the distribution of grade within the back filled stopes. The Measured material is
classified based on proximity to drilling and sill drive development. Blocks are classified as Measured if
they are within an average distance of 10 m of three separate sampled locations, either drill holes or
lateral ore drive development channel sample locations.
The EG vein of WUG has been intersected in drilling over a strike length of 1 km, this structure is larger
than those typically encountered in the Waihi area and on this basis the average drill hole spacing
required for classification as an Inferred Resource on the EG vein structure has been increased to 67.5 m
average distance to the three closest drill holes. An average drill spacing of three holes within 42 m was
used as the basis for classification as Indicated Resource for the EG structure. All other WUG
Mineralization has been classified using a distance threshold of 36 m to the three closest drill holes for
classification as Indicated.
For MOP, an average drill hole spacing of 60 m to the three closest drillholes on the major mineralized
veins for classification as Inferred and a spacing of 36 m for classification as Indicated Resource. A tighter
spacing of 30 m has been implemented for classification as Indicated Resource and 40 m for Inferred
Resource for the bulk domains, usually are more complicated zones of strong brecciation and/or
stockwork veining. As with MUG any mineralized backfill is not classified or inclusion within the Mineral
Resource due to uncertainty.
The Gladstone deposit is classified using an average drill hole spacing of 60 m to the three closest
drillholes on the major mineralized veins for classification as Inferred Resource and a spacing of 35 m for
classification as Indicated Resource. A tighter spacing of 22.5 m has been implemented for classification
as Indicated Resource for the non-vein-based domains, typically these are more complicated zones
exhibiting strong brecciation and/or stockwork veining.
The classification criteria are summarized in Table 14-20.
Table 14-20: Classification Criteria
Project | Drill Spacing for Measured Resource | Drill Spacing for Indicated Resource | Drill Spacing for Inferred Resource |
MOP | - | 30 - 36 metres | <60 metres |
GOP | 15 metres | 22.5 - 35 metres | <60 metres |
MUG | 10 metres | 36 metres | < 60 metres |
WUG | - | 36 – 42 metres | <67.5 metres |
Document ID: STU-063-REP-002-0 Released: 11th December 2024Page 123 of 244
OceanaGold Corporation | ||
NI 43-101 Technical Report – Waihi District Pre-feasibility Study, New Zealand | ||
14.6Cut–off Grade Estimates
Mineral Resource cut-off grades have been estimated using a long-term gold price of $1,950 and silver
price of $20 /oz at an exchange rate of $0.61: NZ$. Estimated cut-off grades for the various Mineral
Resources are shown below in Table 14-21.
Table 14-21: Resource Cut-off Grade Estimates
Price $/ oz | Metal Recovery | Process Cost $/t | G&A $/t | Sustaining Capex $/t | Mining $/t | Royalty % | Cut-off Grade g/t | |
MOP | 1,950 | 90 % | 20 | 7 | 0 | -3 | 2 % | 0.50 |
MUG | 1,950 | 94 % | 24 | 15 | 7 | 66 | 2 % | 2.15 |
GOP | 1,950 | 74 % | 18 | 7 | 0 | -3 | 2 % | 0.56 |
WUG | 1,950 | 90 % | 24 | 7 | 6 | 79 | 4 % | 2.10 |
14.7Mining Factors or Assumptions
The classification of open pit Mineral Resources considers geologic, mining, processing, and economic
considerations, and have been confined within appropriate LG pit shells, and therefore are classified in
accordance with the 2014 CIM Definition Standards for Mineral Resources.
MUG and WUG Resource reporting is constrained by conceptual stopes however reporting is only on
material above cut-off. This constrains the tonnes and grade reporting to the mineralized or vein
interpretation as shown in Figure 14-5.
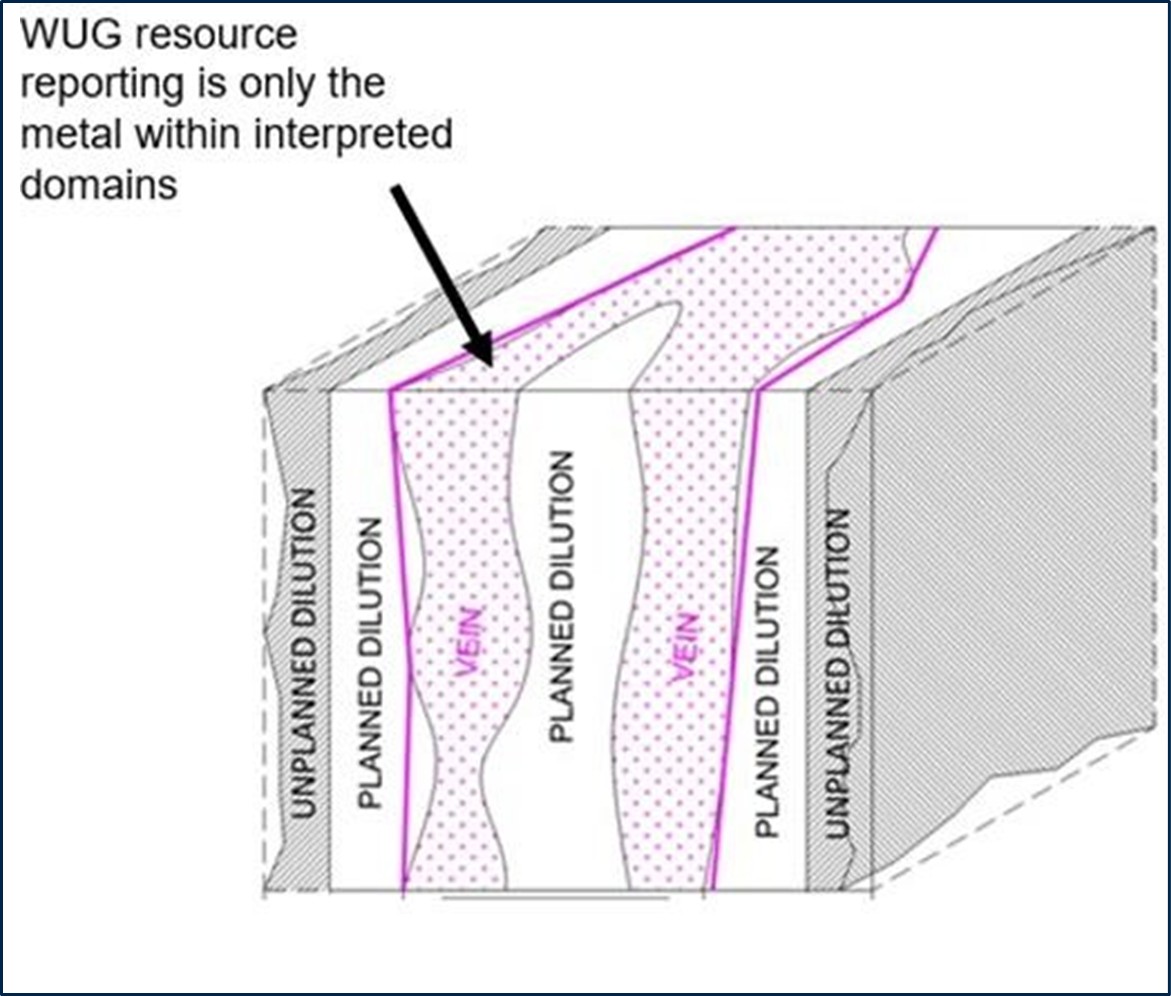
Figure 14-5: Resource Versus Reserve Conceptual Schematic for Martha Pit
The MOP5 cutback was developed by OceanaGold from a Whittle optimisation carried out in 2016 and
further validated in 2017. Inputs comprised a maximum 7 Mt per annum operation and 1.5 Mt per annum
processing throughput. Open pit slopes were generated for separate rectangular sub-regions based on
Document ID: STU-063-REP-002-0 Released: 11th December 2024Page 124 of 244
OceanaGold Corporation | ||
NI 43-101 Technical Report – Waihi District Pre-feasibility Study, New Zealand | ||
different rock units calibrated with existing pit slopes and with allowance for haul roads. Mining costs were
based on actual mining costs from 2006 to 2007 when the Martha pit was operating at moderate
production rates escalated by the Consumer Price Index, recent contractor quotes, and confirmed under
the current pricing guidance.
The Whittle optimisation and the optimum pit selected considered the proximity of the pit to the Waihi
township, social and environmental constraints, and the need for high geotechnical factors of safety and
limits on encroachment.
The design slopes for the MOP5 cutback are based on current pit slopes and berm intervals are generally
20 m below 1090 mRL and 15 m above 1090 mRL. Pit slopes to the south and south-west have been
conservative due to effect of historic workings on the rock mass quality, the proximity of the town and
presence of argillic andesite and slopes to the east are the shallowest slopes due to presence of the post-
mineral sediments comprising tuffs and alluvial layers as well as a weaker andesite unit. The pit
configuration is shown in Figure 14-6.
The pit encroaches towards the town centre, residential and low-density residential zones, and for this
reason a plan change to the Hauraki District Plan will be required to provide for this component of the
WNP, for allowing Resource consents to be sought for this element of WNP. The plan change goes to a
hearing before Council-appointed Commissioners in December 2024.
Key points of note are:
•A constraint has been placed on the cutback of the western pit wall so as not to encroach into the
Moresby Avenue reserve and the Central School grounds
•The pit requires relocation of the existing crusher and belt conveyors from the existing crusher
slot to a new crusher slot, 70 m to the east and installation of a new crushing facility
•Relocation and enlargement of the noise bund beyond Grey Street into Slevin Park, construction
of a noise bund along the remaining MOP5 pit rim, relocation of the historical Cornish pumphouse
and partial realignment of the Eastern Stream is required
•Relocation and re-establishment of the open pit office block, fuel bowser, substation, workshop,
wheel wash and magazine are required.
The final dimensions of MOP5 are:
•Pit area - approximately 66 Ha
•Pit depth - approximately 316 m
•Pit floor level - approximately 840 mRL
•Pit length x breadth - approximately 1,115 x 830 m
•Total volume - approximately 59 Mm3.
Document ID: STU-063-REP-002-0 Released: 11th December 2024Page 125 of 244
OceanaGold Corporation | ||
NI 43-101 Technical Report – Waihi District Pre-feasibility Study, New Zealand | ||
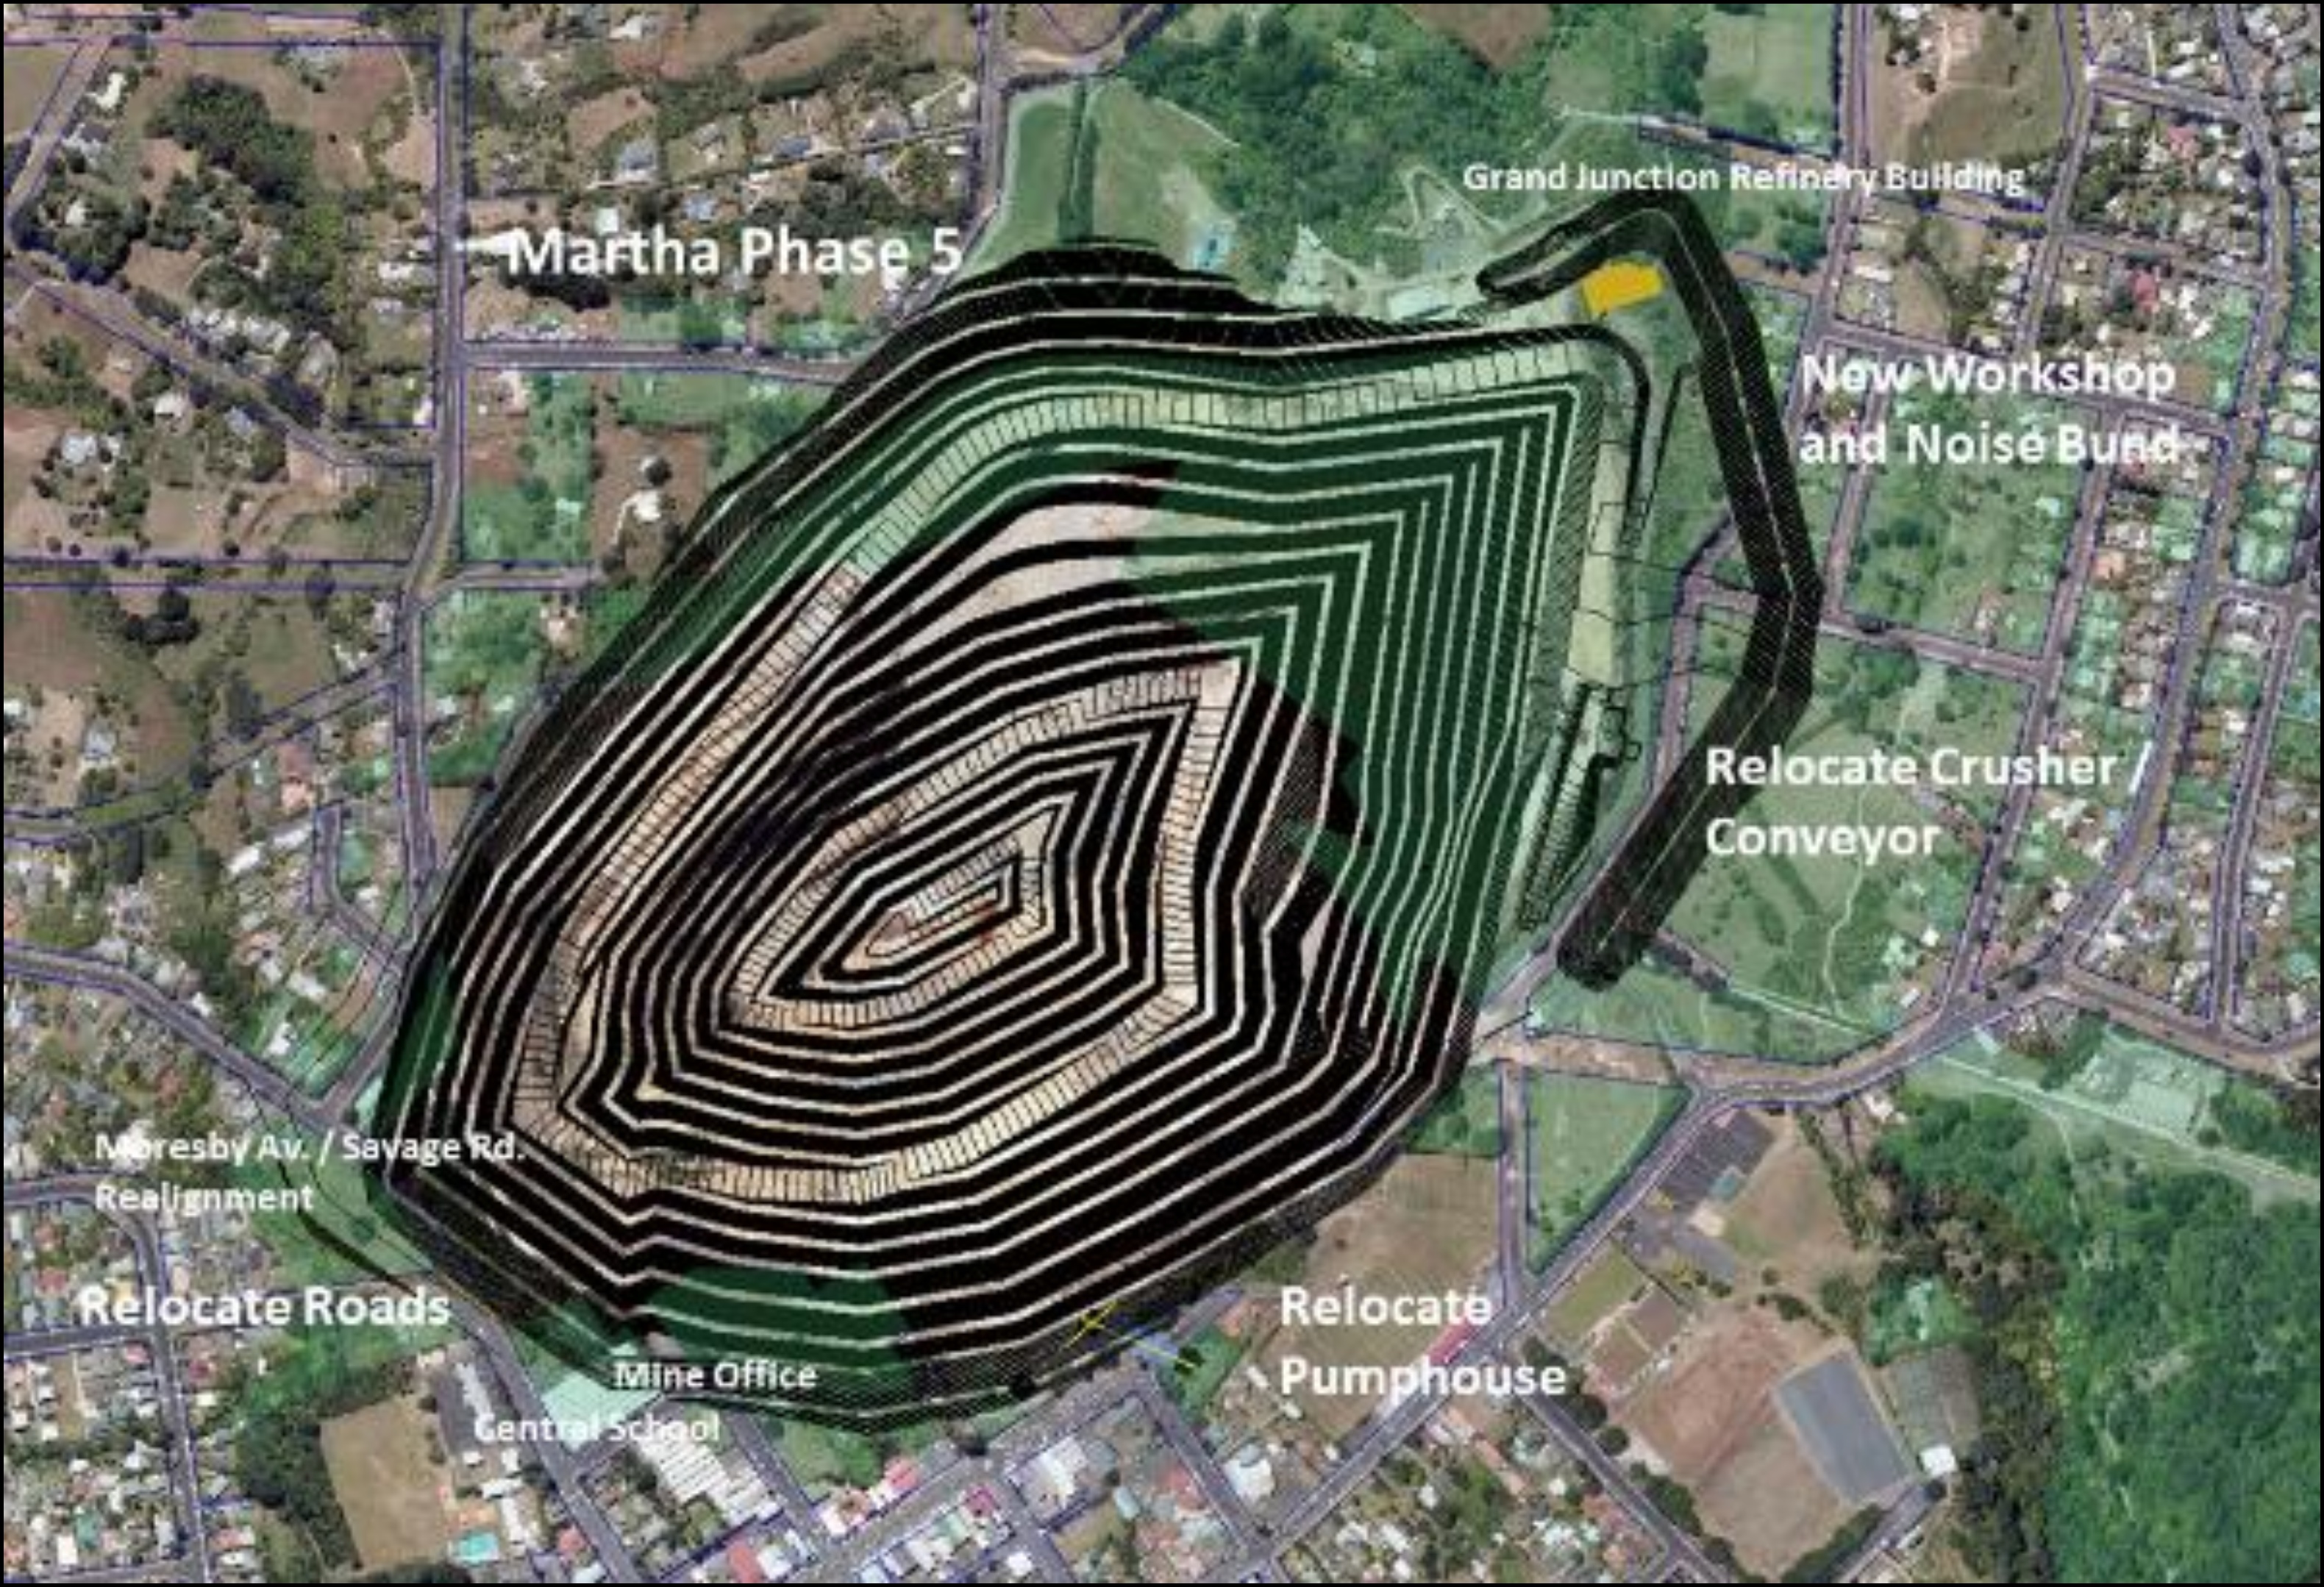
Figure 14-6: Plan of Martha Phase 5 Pit
14.7.1MUG
The Mineral Resource is reported within conceptual designs, created using Deswik.SO®. Stope widths
vary, depending on the thickness of the Mineralization. A minimum mining width of 1.3 m was used, and
0.3 m of dilution was applied to both the footwall and hanging wall. A maximum stope width of 15 m was
used with a minimum pillar width between stopes of 8 m. Nominal stope dimensions of 15 m high by 10 m
in length. The method of specifying the strike and dip angles for the initial stope-seed-shapes in SO was
to apply a stope control surface wireframe over the full extent of the orebody where stope shapes are to
be generated. The following stope shapes were manually excluded from the Mineral Resource estimate:
•Isolated stope shapes either showing lack of continuity or distant from the main concentrations of
shapes
•Stopes closer than 50 m from the surface
•Within a solid created as an exclusion solid around the historical “Milking Cow” zone by projecting
the cave zone outwards by 20 m
•All stopes intersecting the base of the Martha Phase 5 pit.
Document ID: STU-063-REP-002-0 Released: 11th December 2024Page 126 of 244
OceanaGold Corporation | ||
NI 43-101 Technical Report – Waihi District Pre-feasibility Study, New Zealand | ||
The Mineral Resource is reported within the SO shapes above a 2.15 g/t cut-off grade. No unclassified
material contained within the SO shapes is reported. Figure 14-7 presents the SO shapes after exclusion
based on geotechnical and economic assessment.
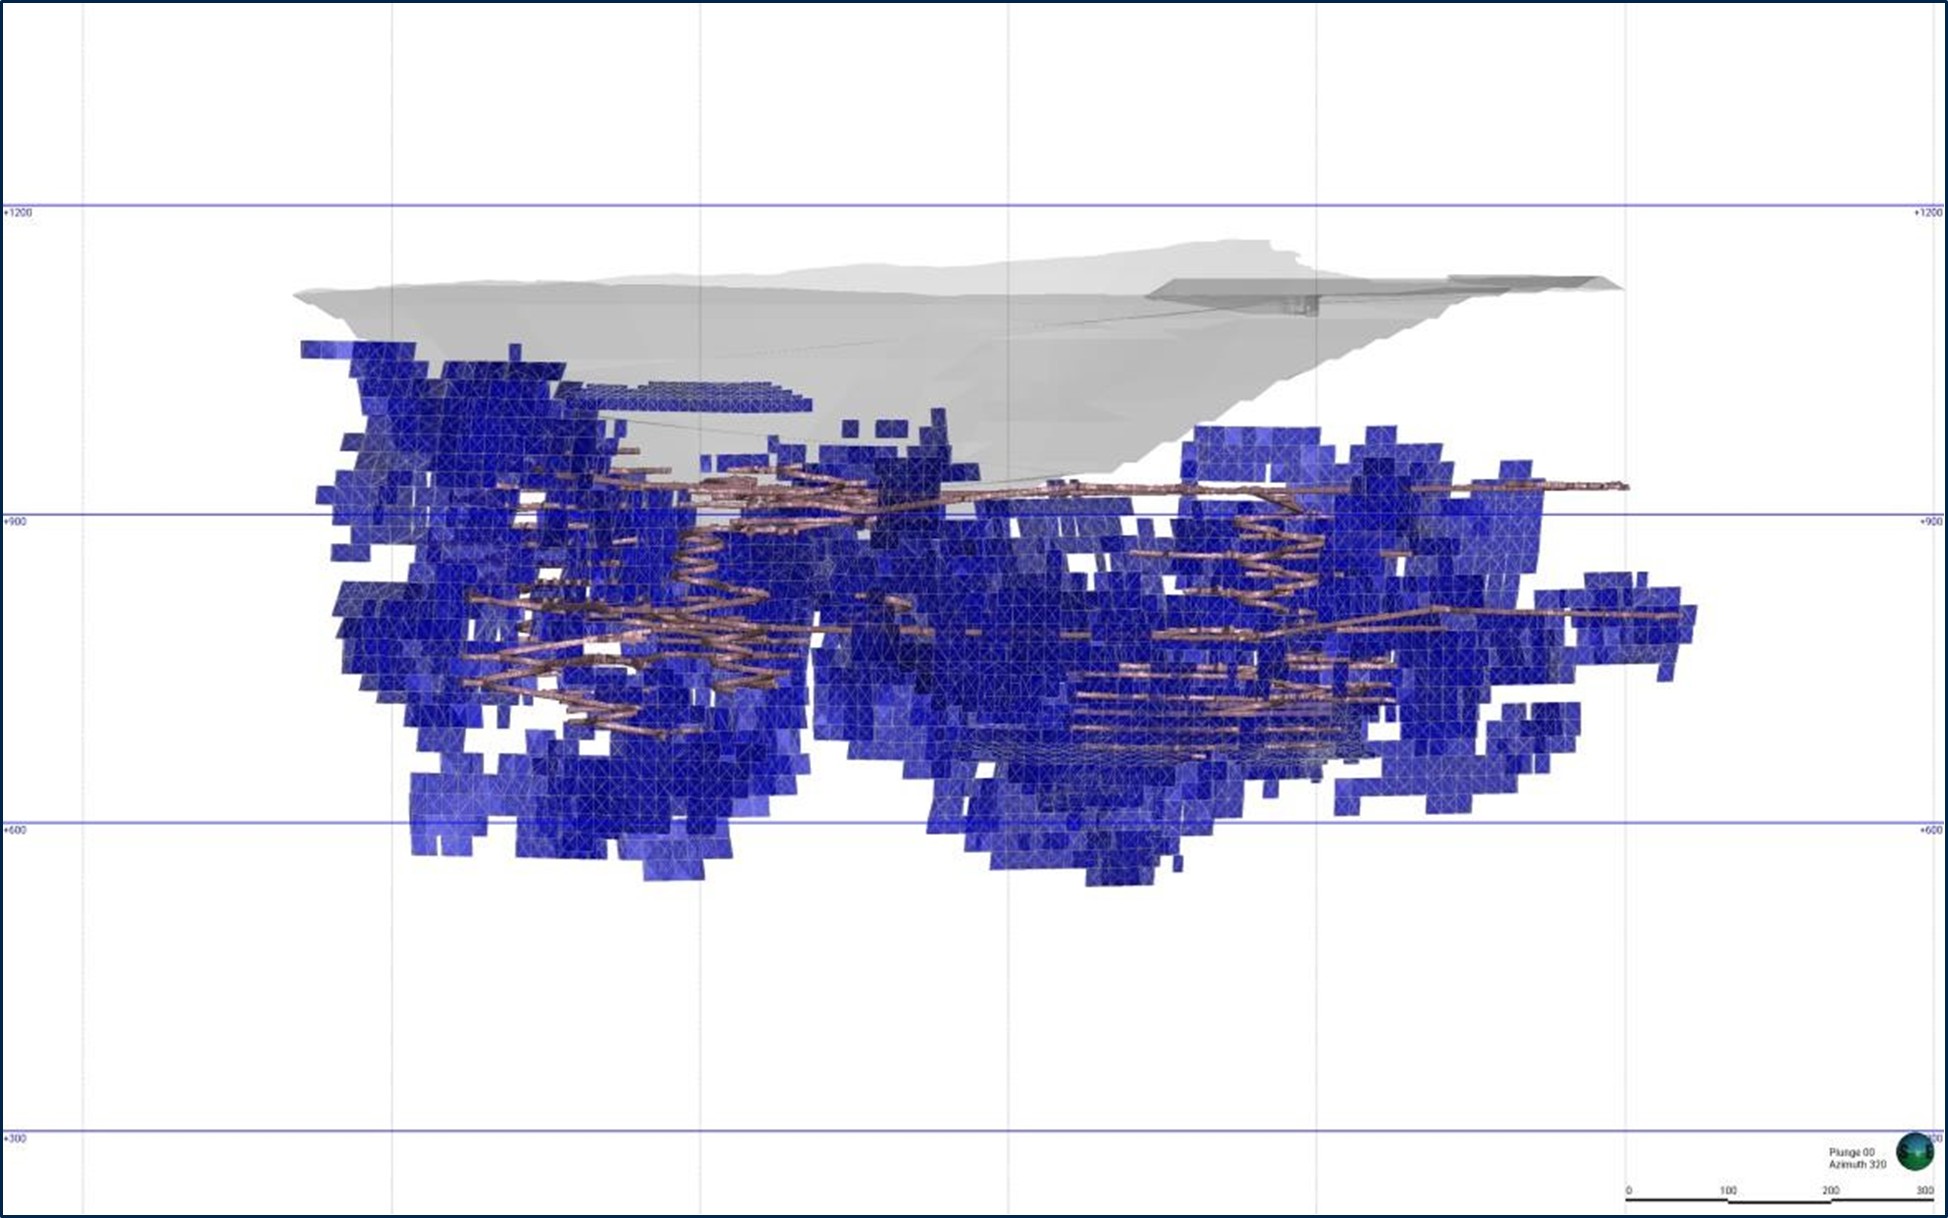
Figure 14-7: MUG Mineral Resource Long Section
14.7.2Gladstone Pit
Geotechnical studies during 2017 and 2023 on preliminary design concepts including geotechnical
drilling, rock/ soil testing and detailed core logging showed that the slopes in the Winner Hill pit and the
northern slopes in Gladstone Hill were generally satisfactory under unsaturated or partially drained
conditions. However, the southern and eastern upper slopes were shown to be marginally stable under
fully or partially saturated conditions particularly where there was a significant depth of the surficial
deposits.
Design pit slopes were modified based on a geotechnical study completed by PSM in early 2018 including
three additional geotechnical holes and geotechnical modelling to achieve satisfactory factors of safety.
Geotechnical domains were re-defined based on drilling. The geotechnical domains are presented in
Figure 14-8.
Document ID: STU-063-REP-002-0 Released: 11th December 2024Page 127 of 244
OceanaGold Corporation | ||
NI 43-101 Technical Report – Waihi District Pre-feasibility Study, New Zealand | ||
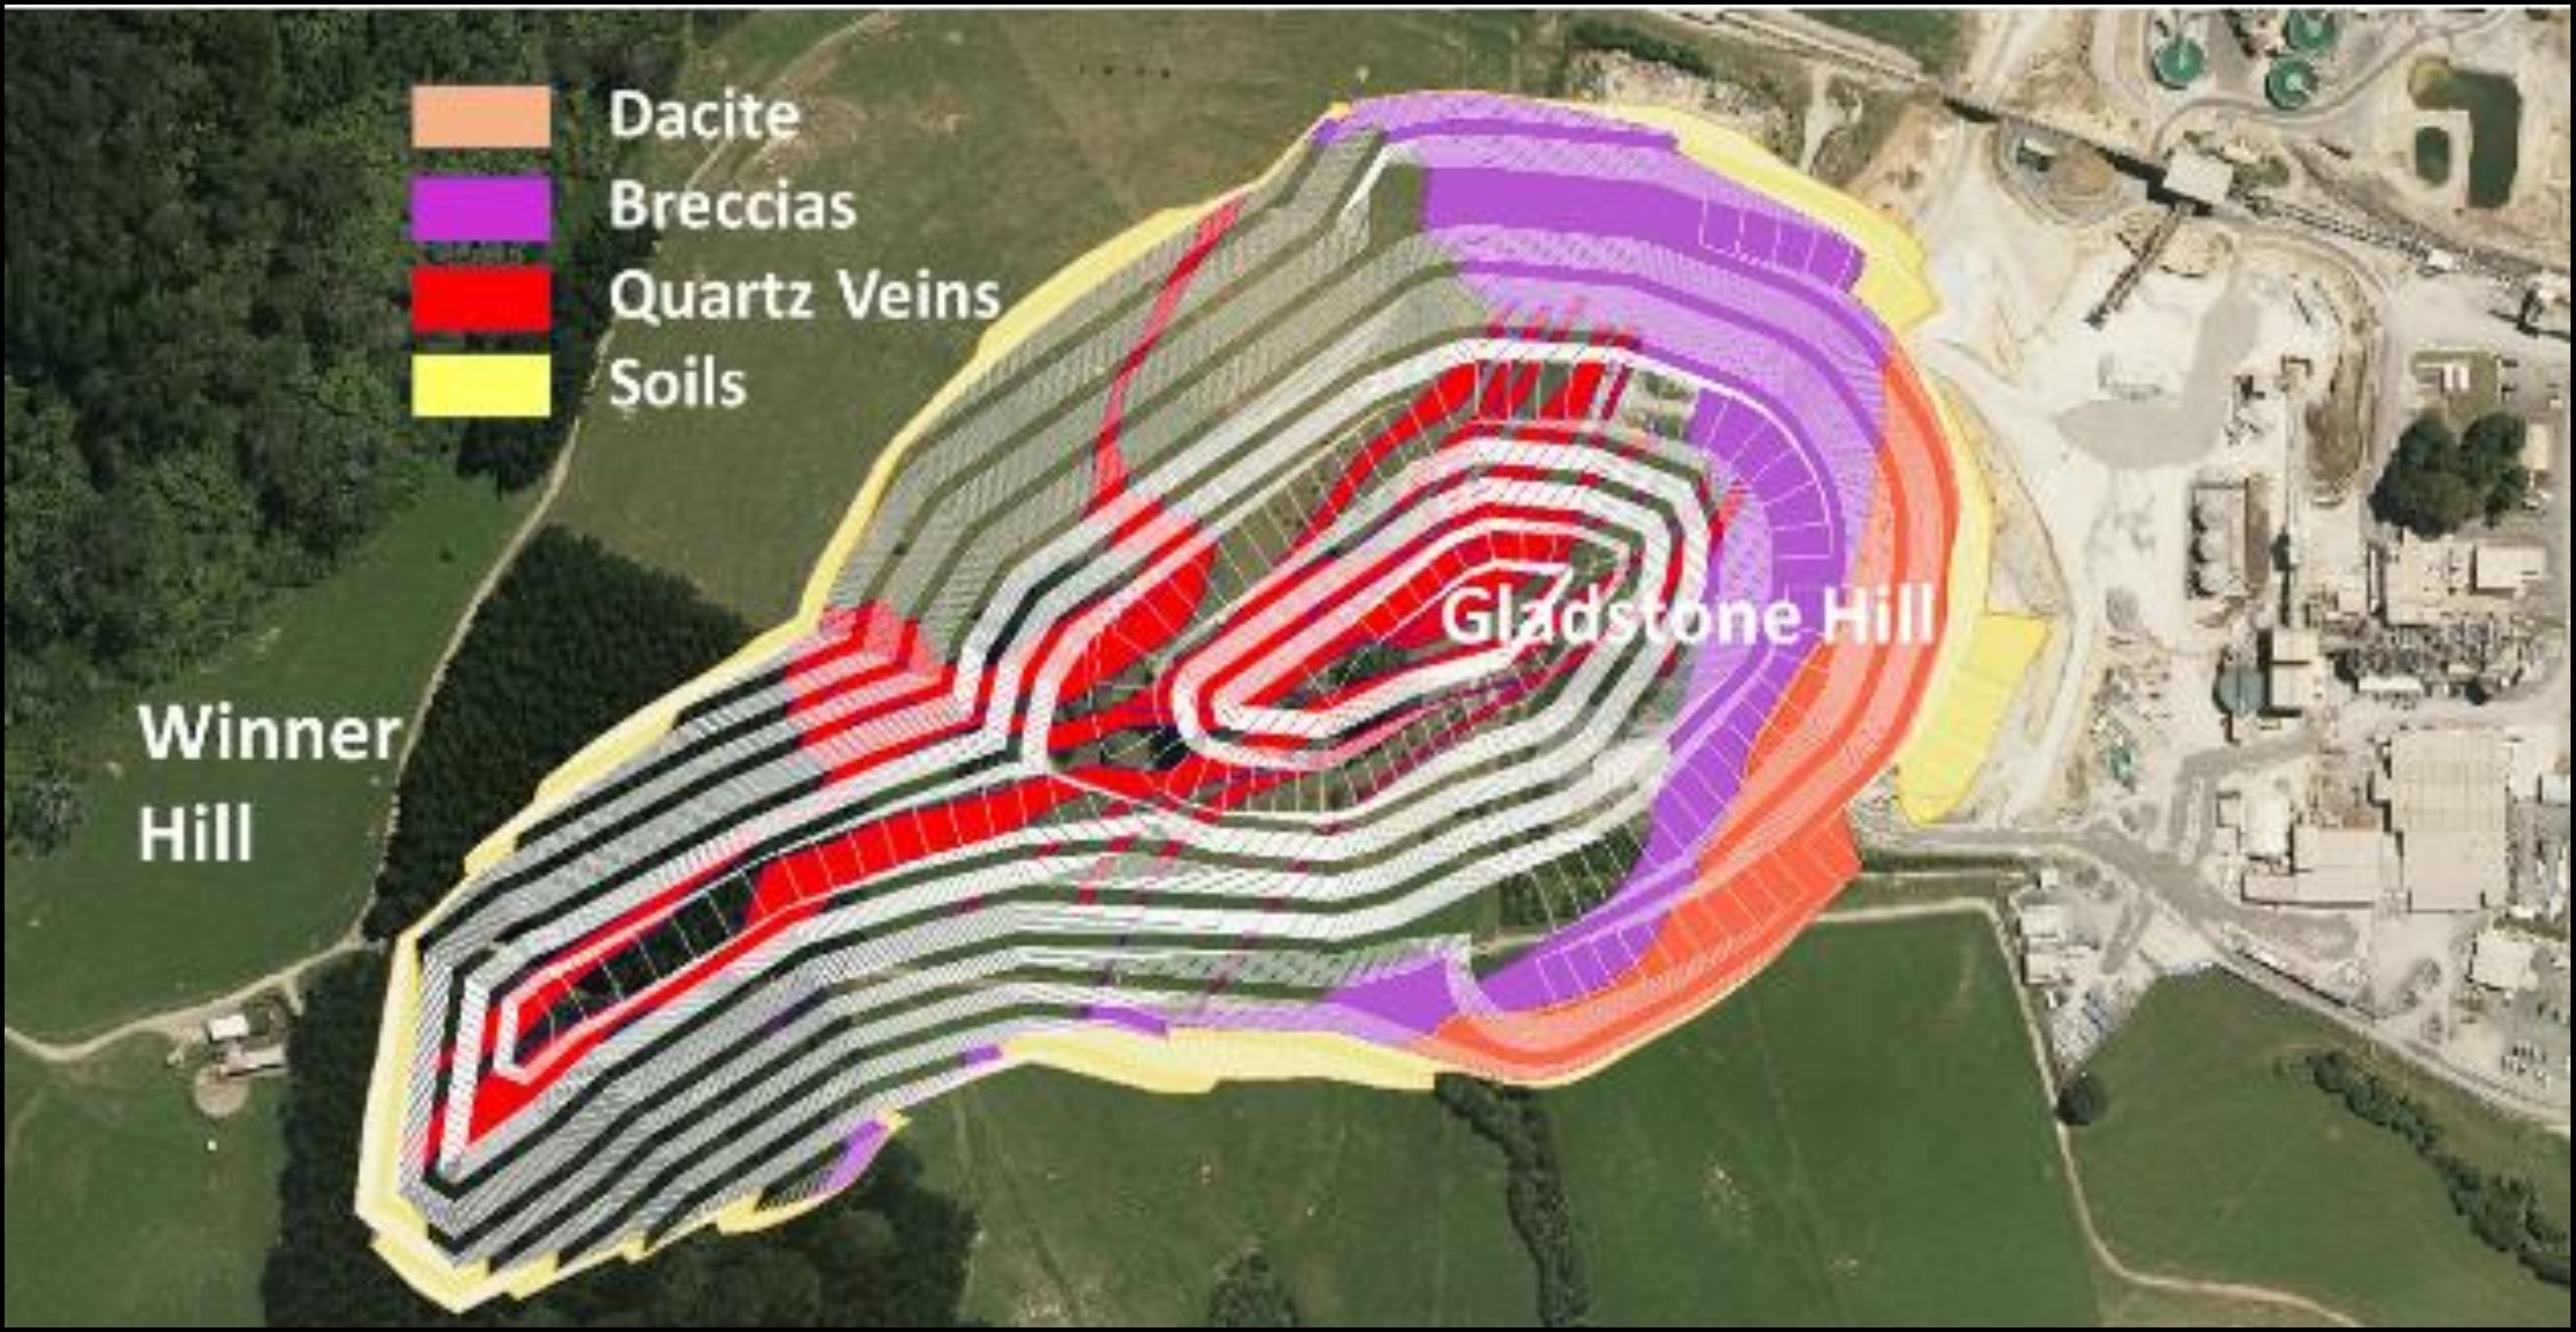
Figure 14-8: Gladstone Pit Geotechnical Domains
14.7.3WUG
OceanaGold has reported the Mineral Resource within conceptual designs which were created using the
Deswik.SO®. Stope widths vary, depending on the thickness of the Mineralization. A minimum economic
mining width of 2.0 m was used. A maximum stope width of 15 m was used with a minimum pillar width
between stopes of 8 m. Nominal stope dimensions of 15 m high by 15 m in length. The method of
specifying the strike and dip angles for the initial stope-seed-shapes in SO was to apply a stope control
surface wireframe over the full extent of the orebody where stope shapes are to be generated. All shapes
within 50 m of the surface topography were excluded from the estimate.
The Mineral Resource is reported within the SO shapes above a 2.10 g/t cut-off grade. No unclassified
material contained within the SO shapes is reported. Figure 14-9 and Figure 14-10 present the SO
shapes. No mining recovery or dilution were applied to the Mineral Resource estimate.
Document ID: STU-063-REP-002-0 Released: 11th December 2024Page 128 of 244
OceanaGold Corporation | ||
NI 43-101 Technical Report – Waihi District Pre-feasibility Study, New Zealand | ||
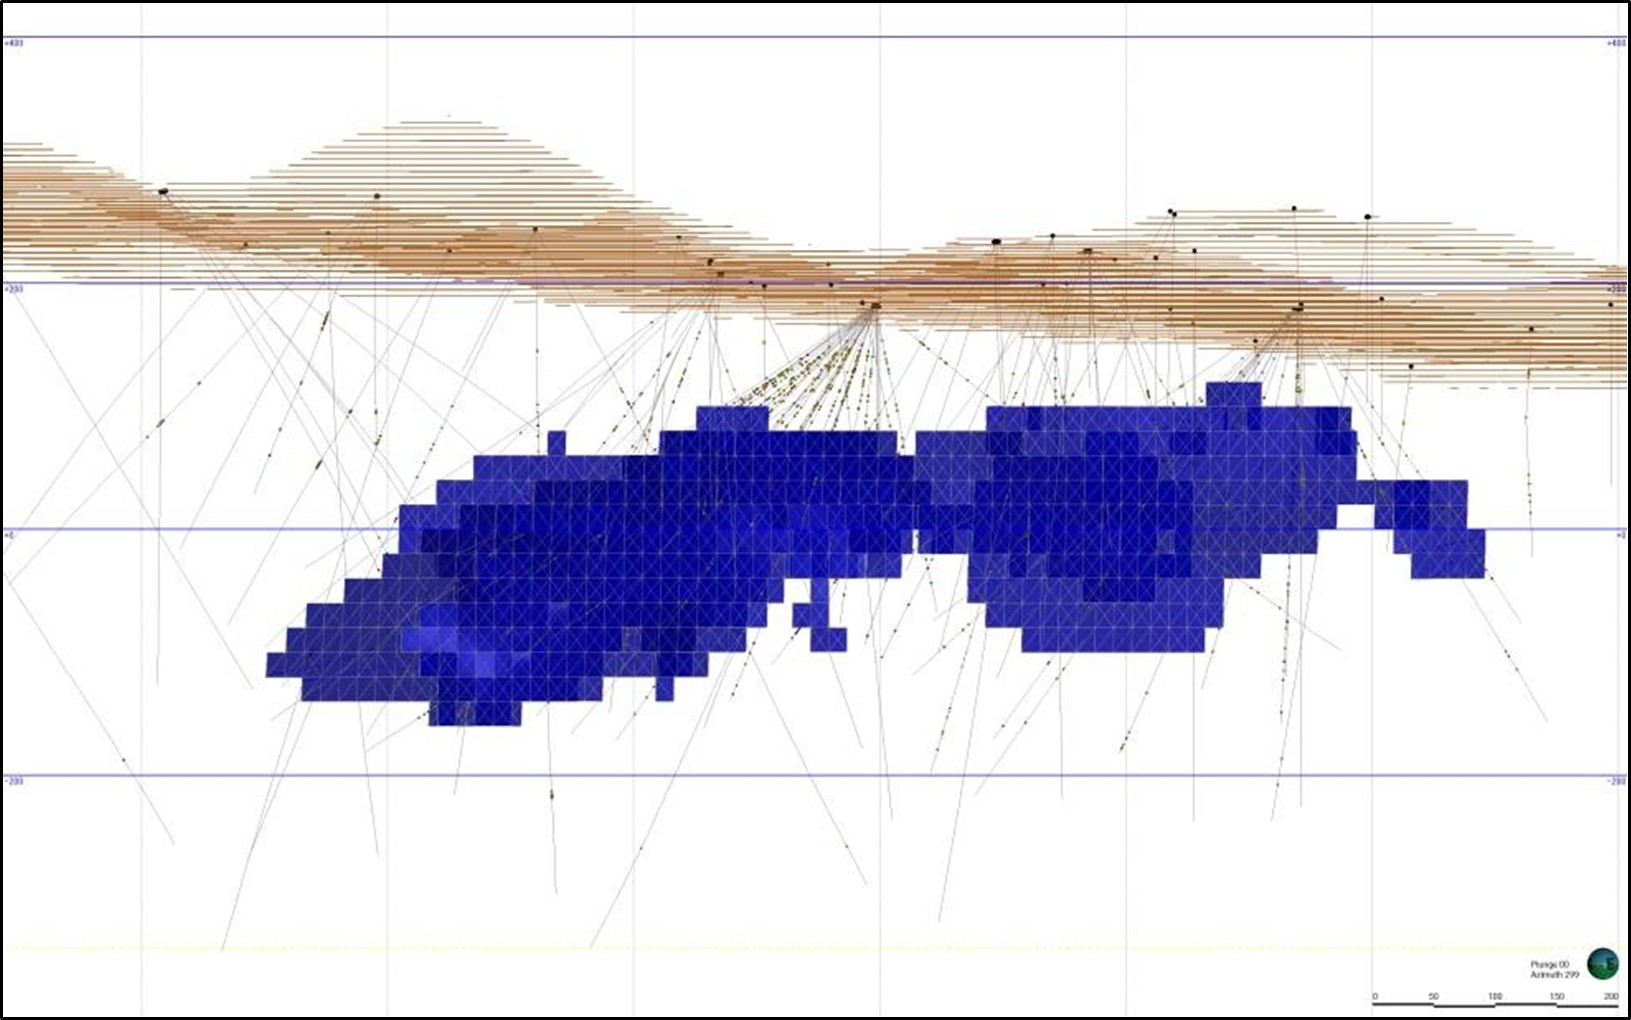
Figure 14-9: WUG Mineral Resource Long Section
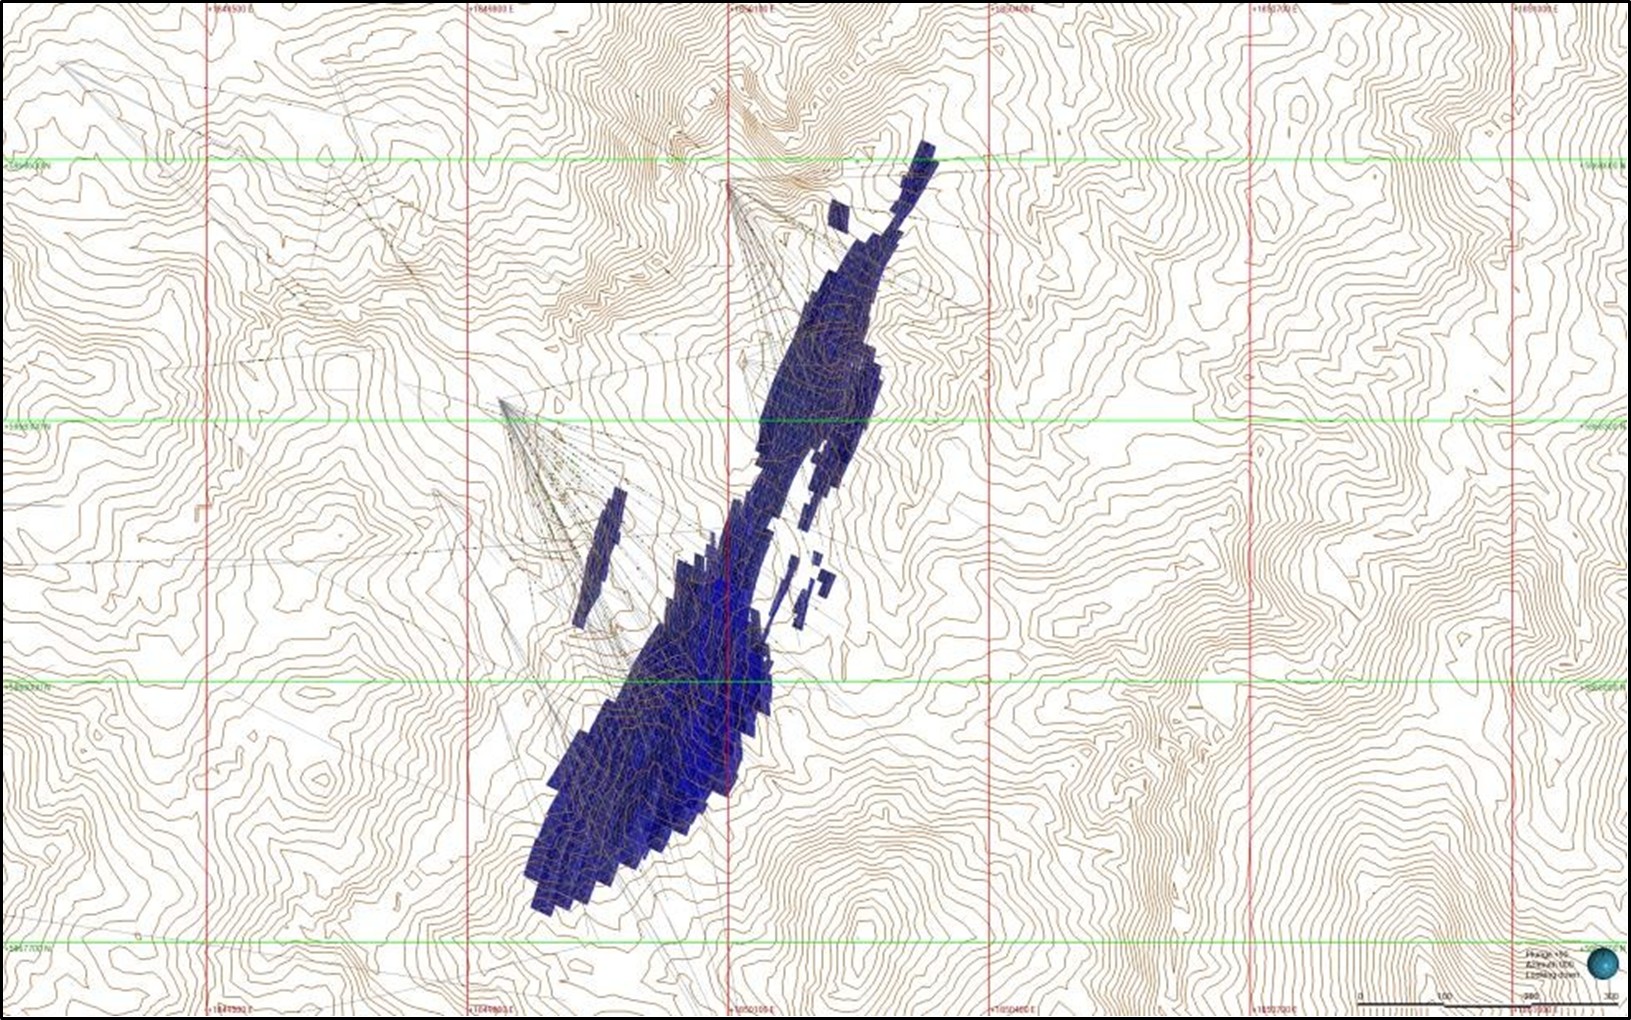
Figure 14-10: WUG Mineral Resource Plan View
14.8Risks
The Mineral Resource Estimates that form the basis of this report are based on assumptions that are
subject to a variety of risks and uncertainties which could cause actual results to differ from those
reflected in this report. Potential geologic risks include unusual or unexpected geological complexities,
variation in estimation and modelling of grade, tonnes, geologic continuity of mineral deposits, the
possibility that future exploration, development, or mining results will not be consistent with expectations
and the potential for historic mine workings to be materially different to that assumed in these studies.
Many of these risks are reflected in the classification of the resources.
Document ID: STU-063-REP-002-0 Released: 11th December 2024Page 129 of 244
OceanaGold Corporation | ||
NI 43-101 Technical Report – Waihi District Pre-feasibility Study, New Zealand | ||
Indicated and Inferred Mineral Resources both have inherent risk, The term "Inferred Mineral Resource"
refers to that part of a Mineral Resource for which quantity and grade or quality can be estimated on the
basis of geological evidence and limited sampling and reasonably assumed, but not verified, geological
and grade continuity.
The term "Indicated Mineral Resource" refers to that part of a Mineral Resource for which quantity, grade
or quality, densities, shape, and physical characteristics can be estimated with a level of confidence
sufficient to allow the appropriate application of technical and economic parameters, to support mine
planning and evaluation of the economic viability of the deposit. The geological and grade continuity to be
reasonably assumed.
The vein systems within the project areas are geologically complex and in some instances are difficult to
fully drill test. WUG has limited consented drill platforms, deeper portions of the MUG system are at
challenging drill intersection angles and the town infrastructure and pit highwalls overlying the Martha pit,
placed limitations upon the ability to fully drill test the deposit. Notwithstanding this, Waihi has a strong
operational history and the risks are considered to be in line with those dealt with throughout the
operations past history, these risks are thought to be well understood and actively managed.
14.9Mineral Resource Statement
Mineral Resource estimates, as of 30 June 2024, are presented in Table 14-22 and are classified in
accordance with CIM. Mineral Resources are inclusive of Mineral Reserves and are reported at a
commodity price of $1,950 /oz gold.
Information relating to geology, sampling, data verification and Mineral Resources in this document was
prepared by or under the supervision of Leroy Crawford-Flett. Mr. Crawford-Flett is a Chartered
Professional Member of the Australasian Institute of Mining and Metallurgy and is the Qualified Person for
those topics. Mr Crawford-Flett is a full-time employee of OceanaGold Limited and has sufficient
experience that is relevant to the style of Mineralization and type of deposit under consideration and to
the activity being undertaken to qualify as a Qualified Person. A summary of the Mineral Resource
estimate is provided in Table 14-22.
Document ID: STU-063-REP-002-0 Released: 11th December 2024Page 130 of 244
OceanaGold Corporation | ||
NI 43-101 Technical Report – Waihi District Pre-feasibility Study, New Zealand | ||
Table 14-22: Summary of Mineral Resources Estimate as of June 30, 2024
Area | Indicated | Inferred | ||||||||
Tonnes | Grade | Grade | Au | Ag | Tonnes | Grade | Grade | Au | Ag | |
(Mt) | (g/t Au) | (g/t Ag) | (Moz) | (Moz) | (Mt) | (g/t Au) | (g/t Ag) | (Moz) | (Moz) | |
MOP | 6.50 | 1.95 | 13.44 | 0.41 | 2.81 | 2.3 | 2.1 | 12.1 | 0.2 | 0.9 |
GOP | 3.22 | 1.44 | 3.76 | 0.15 | 0.39 | 0.8 | 1.0 | 2.6 | 0.03 | 0.1 |
MUG | 6.42 | 5.29 | 25.51 | 1.09 | 5.27 | 2.7 | 4.7 | 27.1 | 0.4 | 2.4 |
WUG | 2.39 | 17.88 | 28.02 | 1.37 | 2.15 | 1.3 | 9.6 | 17.1 | 0.4 | 0.7 |
Total Mineral Resources | 18.53 | 5.07 | 17.82 | 3.02 | 10.62 | 7.1 | 4.3 | 17.6 | 1.0 | 4.0 |
Notes:
Mineral Resources are reported inclusive of Mineral Reserves. Mineral Resources that are not Mineral
Reserves do not have demonstrated economic viability.
Mineral Resources estimate was reviewed and approved by, or is based on information prepared by or
under the supervision of, Leroy Crawford-Flett, MAusIMM CP (Geology), the Company’s Exploration and
Geology Manager and a qualified person under NI 43-101.
Mineral Resources are reported at a gold price of $1,950/oz.
Mineral Resources estimate for MUG is reported below the MOP5 design and are constrained to within a
conceptual underground design based upon the incremental cut-off grade of 2.15 g/t Au.
Mineral Resources estimate for WUG is reported within a conceptual underground design at a 2.10 g/t Au
cut-off grade.
Mineral Resources estimates for MOP and GOP are reported within conceptual pit designs and incremental
cut-off grades of 0.50 g/t Au and 0.56g/t Au, respectively. The MOP conceptual pit design is limited by
infrastructural considerations.
Tonnage and grade measurements are in metric units. Gold ounces are reported as troy ounces and "g/t"
represents grams per tonne.
No dilution is included in the reported figures and no allowances for processing or mining recoveries have
been made.
§All figures have been rounded; totals may therefore not sum exactly.
Document ID: STU-063-REP-002-0 Released: 11th December 2024Page 131 of 244
OceanaGold Corporation | ||
NI 43-101 Technical Report – Waihi District Pre-feasibility Study, New Zealand | ||
15MINERAL RESERVE ESTIMATES
There are no open pit Mineral Reserve estimates. Mineral Reserves were generated for the MUG and
WUG. The underground mining areas are located on land owned by Crown and OceanaGold. Royalties
are applicable to both mines. MUG design is completed using the site coordinate system using Mt Eden
Old Cadastral mine grid plus 1,000 m. WUG design is completed using NZTM grid.
Note the inclusion of modifying factors (dilution and recovery) to the Mineral Resources results in a net
increase in tonnes (due to the inclusion of dilution factors), a reduction in ounces (due to the inclusion of
recovery factors) and a reduction in grade (due to a combination of dilution and recovery factors).
15.1MUG
MUG is in operation and mining Mineral Resources extending below and outside of the existing MOP. The
Martha Mineral Reserves are excluded from the MOP Mineral Resource.
15.1.1Conversion Assumptions, Parameters and Methods
Measured and Indicated Mineral Resources were converted to Proven and Probable Mineral Reserves by
applying the appropriate modifying factors, as described herein, to potential mining block shapes created
during the mine design process.
Based on the orientation, depth, and geotechnical characteristics of the mineralization, a combination of
Avoca and transverse sublevel open stoping method (longhole) with ramp access is used. The stopes are
of variable dimensions and stope length will vary based on mineralization grade and geotechnical
considerations. A spacing of 18 m between levels is used. Cemented rock fill (CRF) will be used to backfill
selected stopes. The CRF will have sufficient strength to allow for mining adjacent to backfilled stopes.
A detailed design was completed including re-mucks, passing bays, etc. All Mineral Reserve tonnages are
expressed as "dry” tonnes (i.e., no moisture) and are based on the density values stored in the block
model. Inferred Mineral Resources are not included in the mine plan. Mining dilution and recovery have
been applied to the Reserves using the methodologies described below.
Dilution
The mining dilution estimate is based on the Equivalent Linear Overbreak Slough (ELOS) methodology
(Clark, 1997) and summarized in Table 15-1. ELOS is an empirical design method used to estimate the
amount of overbreak / slough that will occur in an underground opening based on rock quality and the HR
of the opening. A 0.5 % additional dilution allowance was used to account for other potential sources of
dilution (e.g., dilution from the floor when mucking a stope).
Table 15-1: Underground Mining Dilution Factors
Activity | ELOS m |
Sidewalls (rock) | 0.3 m |
Bottom (backfill) | 0.05 m |
Document ID: STU-063-REP-002-0 Released: 11th December 2024Page 132 of 244
OceanaGold Corporation | ||
NI 43-101 Technical Report – Waihi District Pre-feasibility Study, New Zealand | ||
Recovery
A development recovery factor of 100 % was used for all horizontal development. A development
overbreak factor of 15 % is applied to capital and operating lateral waste development dimensions. A
development overbreak factor of 10 % is assumed for operating lateral ore development.
The mining recovery factors applied for MUG are summarized in Table 15-2. The stope recovery factor
was varied as a function of mining method and considered wall and rill dilutions, and underbreak from
stope firings.
Table 15-2: MUG Underground Mining Dilution and Recovery Factors
Mining Method - Modifying Factors | Wall / Rill Dilution | Under- break | Bogging Recovery | Modifying factors | Comments |
Intact Avoca | |||||
Tonnes | 9 % | 96 % | 1.05 | Based on MUG | |
oz Au | 6 % | 96 % | 0.90 | ||
Mining against Cemented Fill | |||||
Tonnes | 7 % | 93 % | 1.0 | Based on MUG | |
oz Au | 13 % | 93 % | 0.8 | ||
Proximal to Collapse (+3 m pillar) | |||||
Tonnes | 20 % | 93 % | 1.13 | Increase – shorter panels | |
oz Au | 3 % | 93 % | 0.83 | Allow some panel failure | |
Adjacent to Collapse or Historic Fill | |||||
Tonnes | 25 % | 70 % | 1.10 | Corners cannot be bogged out | |
oz Au | 20 % | 70 % | 0.50 | High dilution in historic fill | |
15.2WUG
15.2.1Conversion Assumptions, Parameters and Methods
A development overbreak of 12 % is applied for waste development and 0 % for ore development.
Minable stopes are developed using Deswik.SO® which include a 0.5 m applied to both footwall and
hanging wall. These SO shapes are then applied further modifying factors as summarized in Table 15-3.
The stope recovery and dilution are applied as a function of mining method and stope width.
Document ID: STU-063-REP-002-0 Released: 11th December 2024Page 133 of 244
OceanaGold Corporation | ||
NI 43-101 Technical Report – Waihi District Pre-feasibility Study, New Zealand | ||
Table 15-3: WUG Mining Dilution and Recovery Factors
Width | |||||
<8 m | 10 | 12 - 15+ | |||
Transverse | Primary | Dilution | 15 % | 5 % | 0 % |
Recovery | 90 % | 90 % | 85 % | ||
Secondary/Avoca | Dilution | 15 % | 10 % | 20 % | |
Recovery | 90 % | 90 % | 85 % | ||
Longitudinal | Primary | Dilution | 5 % | 5 % | 10 % |
Recovery | 93 % | 90 % | 85 % | ||
Avoca | Dilution | 5 % | 5 % | 20 % | |
Recovery | 93 % | 90 % | 85 % | ||
Secondary | Dilution | 5 % | 10 % | 20 % | |
Recovery | 93 % | 90 % | 80 % | ||
15.3Mineral Reserve Statement
Mineral Reserves were classified using the 2014 CIM Definition standards. Measured Mineral Resources
were converted to Proven Mineral Reserves, and Indicated Mineral Resources were converted to
Probable Mineral Reserves by applying the appropriate modifying factors, as described herein, to
potential mining shapes created during the mine design process. MUG Mineral Reserves of 4.4 Mt
(diluted) with an average grade of 3.8 g/t Au and WUG Mineral Reserves of are 4.1 Mt (diluted) with an
average grade of 9.2 g/t Au presented in Table 15-4.
Table 15-4: MUG and WUG Reserve Estimate as of 30 June 2024
Reserve Area | Class | Tonnes (Mt) | Au (g/t) | Ag (g/t) | Au (Moz) | Ag (Moz) |
MUG | Proven | - | - | - | - | - |
Probable | 4.4 | 3.8 | 16.1 | 0.5 | 2.3 | |
Total MUG | 4.4 | 3.8 | 16.1 | 0.5 | 2.3 | |
WUG | Proven | - | - | - | - | - |
Probable | 4.1 | 9.2 | 16.1 | 1.2 | 2.1 | |
Total WUG | 4.1 | 9.2 | 16.1 | 1.2 | 2.1 | |
Total Mineral Reserve | 8.5 | 6.4 | 16.1 | 1.7 | 4.4 | |
Document ID: STU-063-REP-002-0 Released: 11th December 2024Page 134 of 244
OceanaGold Corporation | ||
NI 43-101 Technical Report – Waihi District Pre-feasibility Study, New Zealand | ||
Notes:
The WUG Mineral Reserves estimate was reviewed and approved by, or is based on information prepared
by or under the supervision of, Euan Leslie, MAusIMM (CP), the Company’s Group Mining Engineer and a
qualified person under NI 43-101.
The MUG Mineral Reserves estimate was reviewed and approved by, or is based on information prepared
by or under the supervision of, David Townsend, MAusIMM (CP), the Company’s Mining Manager and a
qualified person under NI 43-101.
Mineral Reserves are reported based on OceanaGold’s mine design, mine plan, mine schedule and cash
flow model at a gold price of US$1,750/oz Au.
Tonnages include allowances for losses resulting from mining methods. Tonnages are rounded to the
nearest 100,000 tonnes.
Ounces are estimates of metal contained in the Mineral Reserves and do not include allowances for
processing losses. Ounces are rounded to the nearest hundred thousand ounces.
All figures have been rounded; totals may therefore not sum exactly.
Tonnage and grade measurements are in metric units. Gold ounces are reported as troy ounces
and "g/t" represents grams per tonne.
Document ID: STU-063-REP-002-0 Released: 11th December 2024Page 135 of 244
OceanaGold Corporation | ||
NI 43-101 Technical Report – Waihi District Pre-feasibility Study, New Zealand | ||
16MINING METHODS
16.1Status of Current Mine Development
MUG mining consent was granted in 2019 with mine development commencing 2020. The feasibility
study for MUG was completed in March 2021 with initial mine development targeted in-situ hosted
material in REX, Edward and Royal West to deliver a base load run of mine ore while the method and
technique for extraction of remnant material was trialled and refined. Current mine development and
extraction continues from Edward, Empire West, Empire, Royal East and Rex mine areas. Figure 16-1
below shows a cross section of the MUG’s LoM Plan.
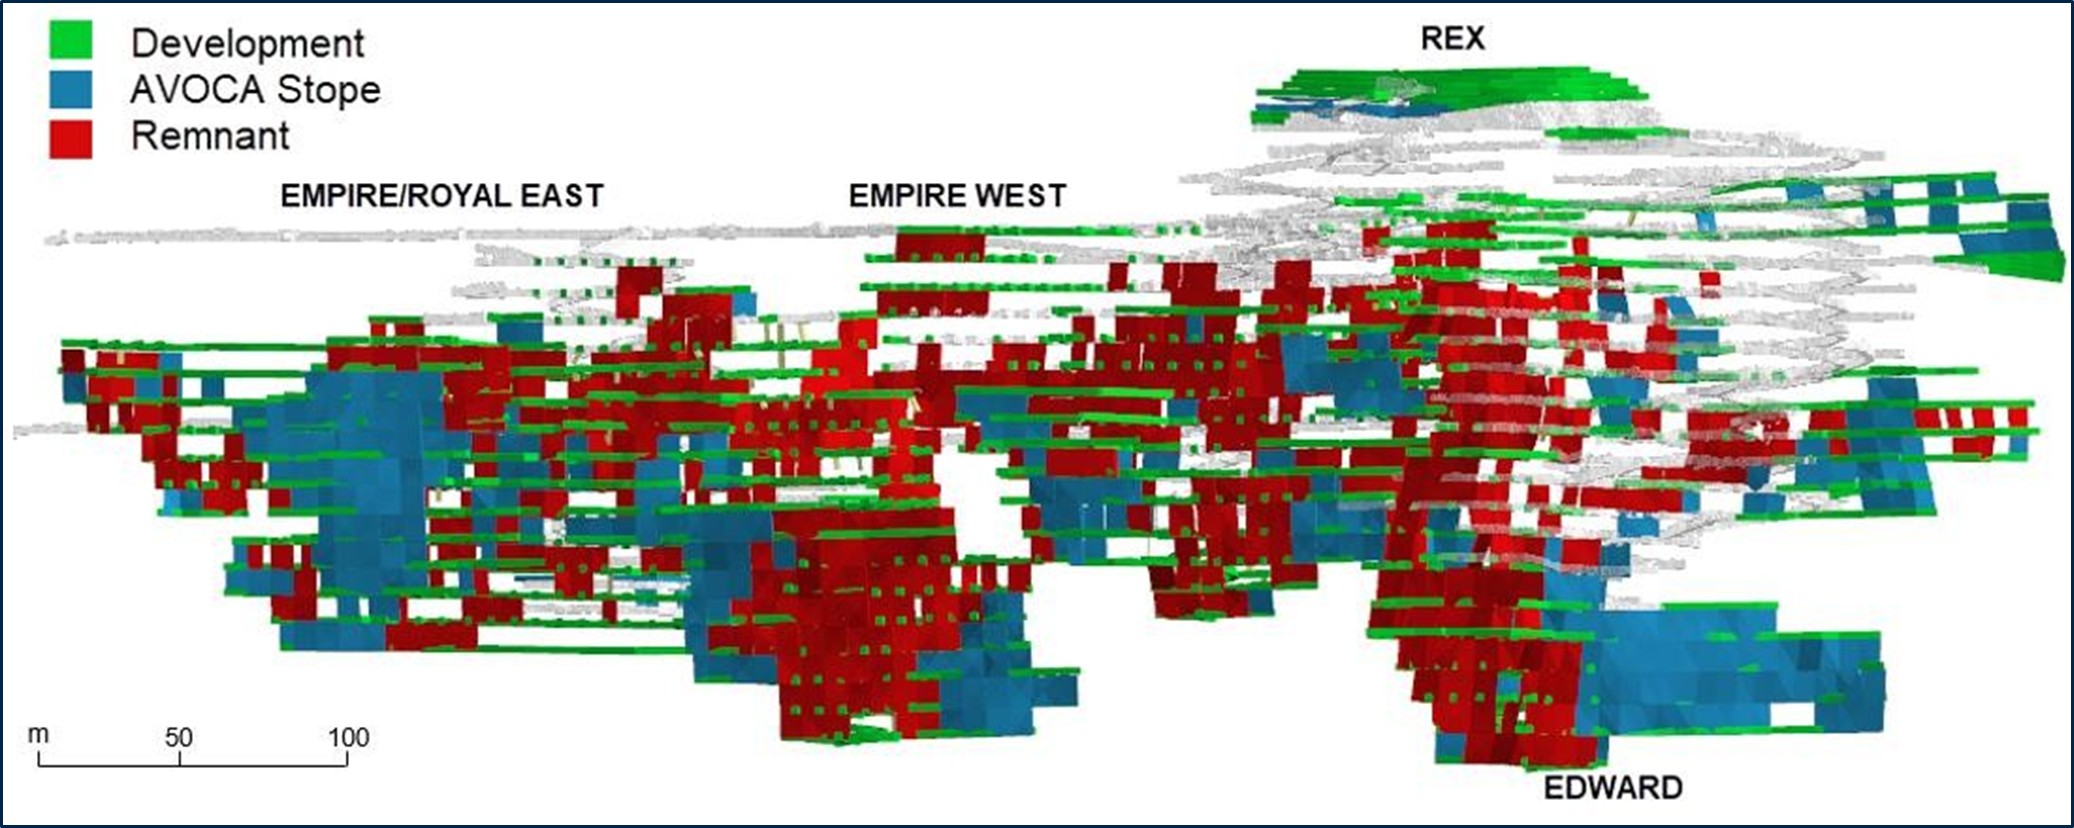
Figure 16-1: MUG Mining Cross Section Looking South East from Hanging Wall
16.2MUG
16.2.1Cut-off Grade Calculations
Previous mining costs for the Favona, Trio Correnso and MUG mines have been reviewed from 2009 to
2023. Operating costs per tonne of ore mined is shown in Figure 16-2 as the CPI adjusted unit costs
(NZ$ / tonne ore mined) and the mined ore tonnes over time. Costs vary depending on:
•the ore tonnage mined
•the proportion of lateral development to stoping
•the average width of stoping
•any floor benching or overhand cut and fill, and
•the operating development in waste.
At an FX of $0.61 / NZ$, MUG mine operating costs range from $61 to $91.5 / tonne ore mined.
Document ID: STU-063-REP-002-0 Released: 11th December 2024Page 136 of 244
OceanaGold Corporation | ||
NI 43-101 Technical Report – Waihi District Pre-feasibility Study, New Zealand | ||
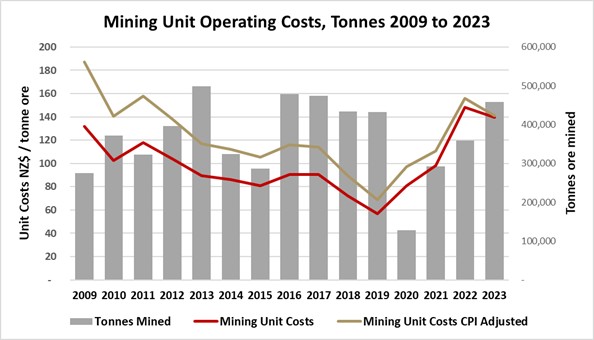
Figure 16-2: Underground Mining Operating Costs 2009 to 2023
Current estimated costs and the calculated Au cut-off grades (CoG) are shown in Table 16-1. Incremental
material is included in the Reserves based on an incremental stope cut-off grade of 2.6 g/t Au and an
incremental development cut-off grade of 0.9 g/t Au.
Table 16-1: MUG Cut-off Grade Calculation
Parameter | Unit | Operating CoG | Incremental Stoping CoG | Marginal Development CoG |
Mining cost | $/t | 110.8 | 87.6 | 0.0 |
Process cost | $/t | 26.3 | 26.3 | 26.3 |
G&A | $/t | 22.6 | 22.6 | 22.6 |
Total Cost | $/t | 160 | 137 | 49 |
Gold price | $/oz | 1,750 | 1,750 | 1,750 |
Average Au mill Recovery | 94 % | 94 % | 94 % | |
CoG | g/t | 3.0 | 2.6 | 0.9 |
16.2.2Geotechnical
A total of 84 km of drill core was geotechnically assessed in MUG during initial studies (Figure 16-3). No
structural data was collected directly from core for joints, geologists only record structural measurements
for veining and faults.
Document ID: STU-063-REP-002-0 Released: 11th December 2024Page 137 of 244
OceanaGold Corporation | ||
NI 43-101 Technical Report – Waihi District Pre-feasibility Study, New Zealand | ||
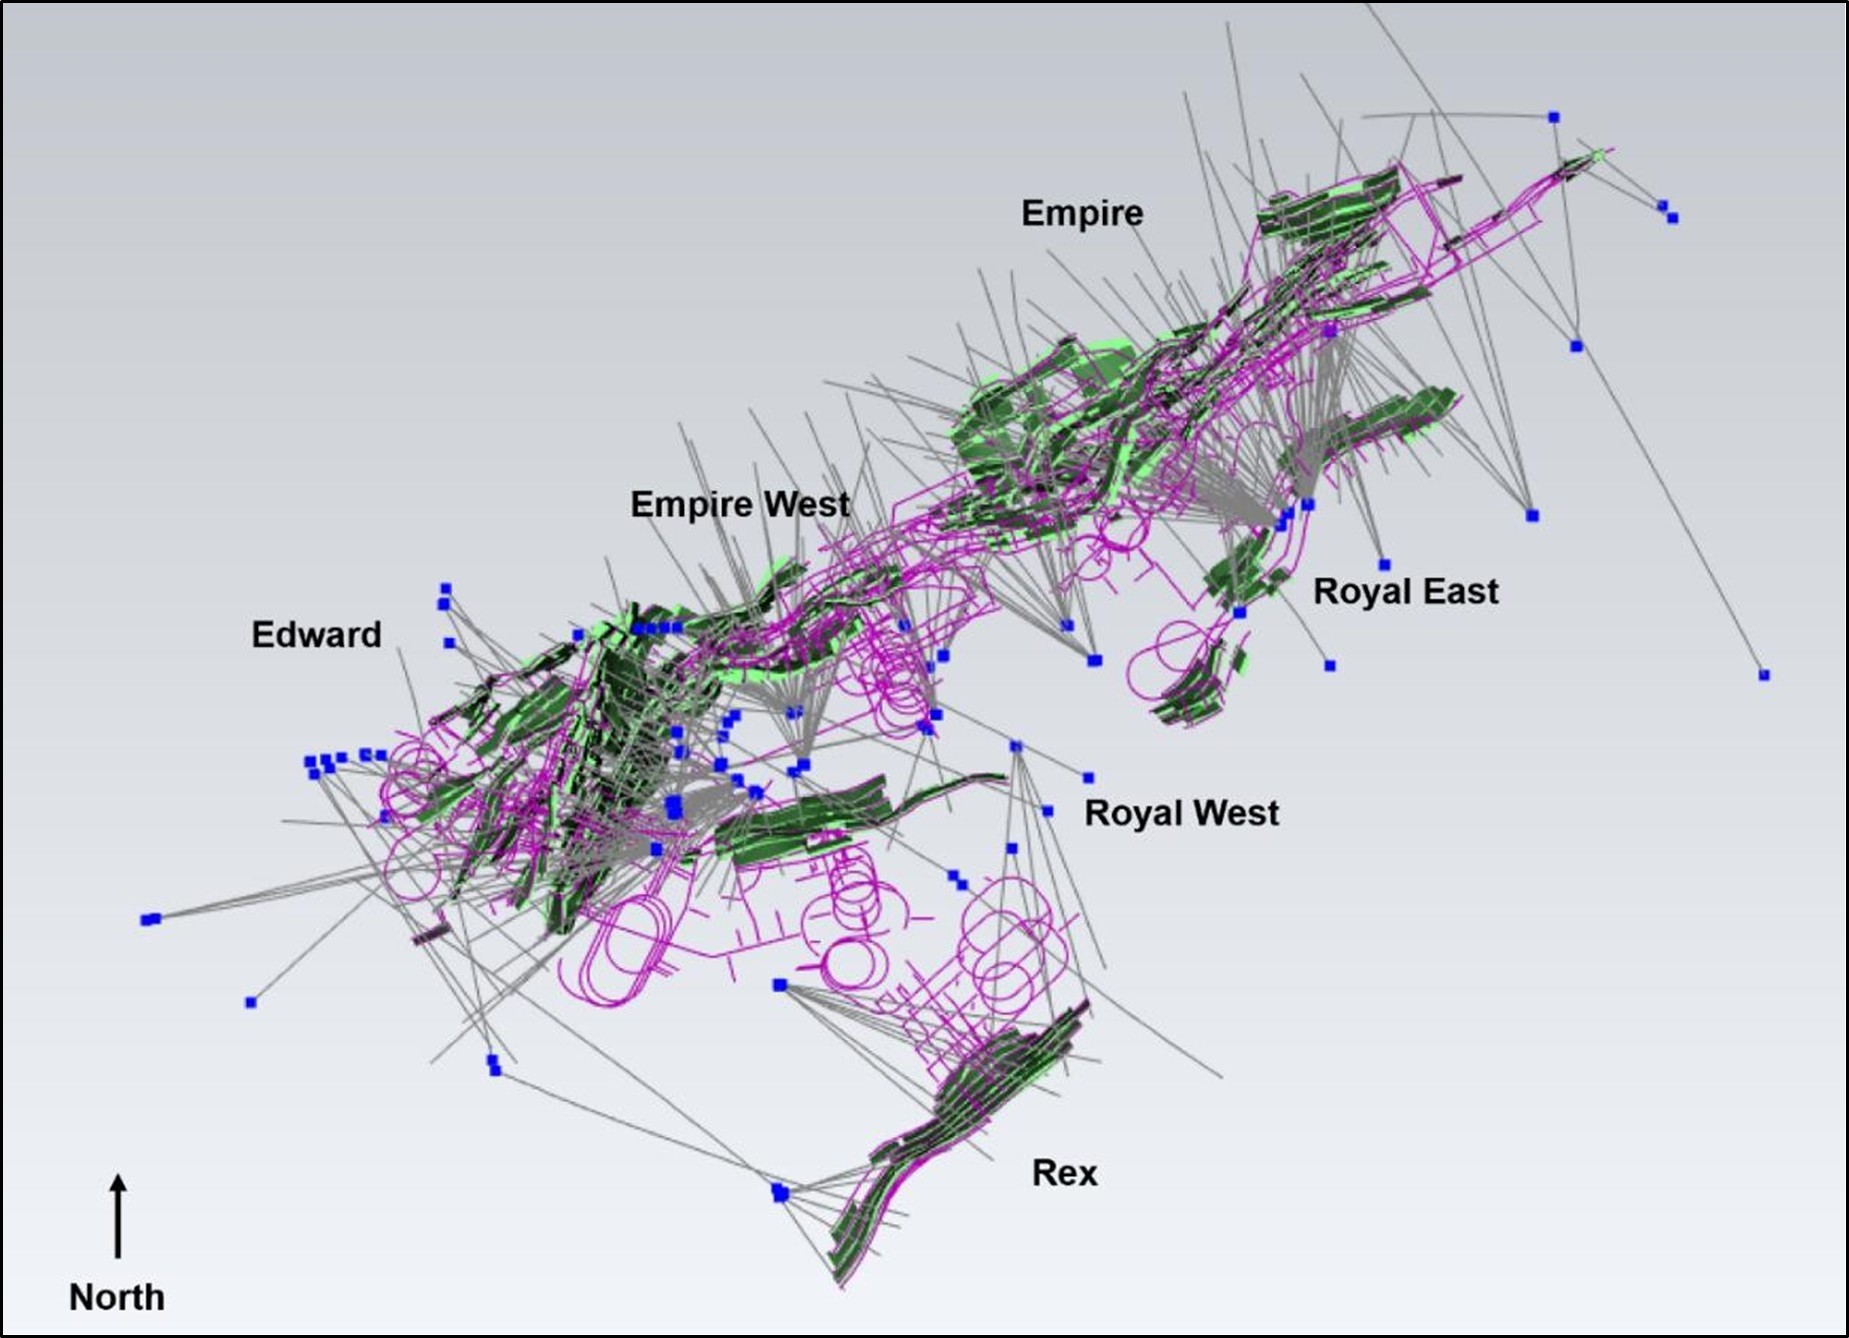
Figure 16-3: Plan and Long Section of Geotechnically Logged Drill Holes
A total of 807 orientation measurements were recorded during the underground data collection campaign
from scanline mapping. Mapping of development headings and key structures within MUG is also
recorded by the site geotechnical engineers. Key structures are steeply dipping oriented, predominantly
north-east-east. A stereonet plot of the structures recorded is given in Figure 16-4.
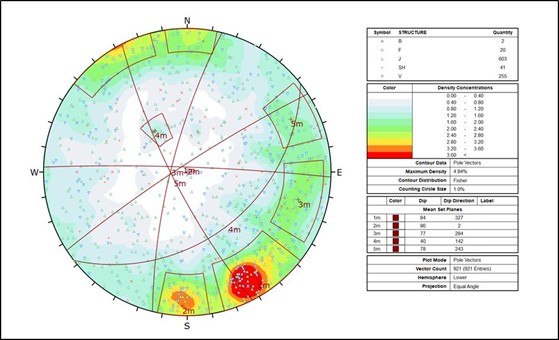
Figure 16-4: Plot of Structure Data for MUG
Document ID: STU-063-REP-002-0 Released: 11th December 2024Page 138 of 244
OceanaGold Corporation | ||
NI 43-101 Technical Report – Waihi District Pre-feasibility Study, New Zealand | ||
A number of rock properties testing has been undertaken since 2006 with a specific testing program from
MUG undertaken in 2020. The types and number of tests conducted are shown in Table 16-2 and a
summary of results.
Table 16-2. Summary of Laboratory Tests
UCS (MPa) | UTS (MPa) | Modulus (Gpa) | Poisons Ratio | |
Mean | 106 | 8 | 36 | 106 |
Max | 255 | 20.6 | 47 | 255 |
Min | 9 | 1.9 | 19 | 9 |
Sample Size | 36 | 45 | 24 | 36 |
Historical mining took place at Martha over a period of almost 70 years from the 1880’s and the issue of
void interaction is considered the single biggest challenge to the current mine. Historical stopes (unfilled
and filled), development and raises / shafts are present throughout the mines and need to be carefully
monitored and managed.
Operations presently maintain a void management document specific to the MUG area which is based
upon set rules, standoff distances, and guidelines around managing the interaction with historical voids.
The approach is risk-based, data driven and controlled by collaboration between operations, survey,
mining and geotechnical engineers.
Rock mass characterisation has used the Q system, and shows:
•Edward is expected to be poor in most areas and very poor around the historic fill and collapsed
stopes
•Empire is expected to be poor in most areas
•Empire West is a mix of good and poor ground conditions.
Stress measurement tests were conducted at Waihi for the Trio Underground Mine Project by the West
Australian School of Mines in 2010 using the Acoustic Emission (AE) method which indicated:
•Horizontal: vertical stress ratio ranges from 2.1 – 2.4
•The major principal stress orientation (sigma 1 = 02/019°) is shallow dipping and near horizontal
in nature so will have differing effects on each of the orebodies at MUG.
Empirical methods of stope design have been employed to evaluate stability conditions and was
separated by orebody (i.e., Martha, Empire, Edward, Rex) and then by domains (immediate hanging wall,
immediate footwall, and ore zones) for each of the mining areas. The hydraulic radius (HR) was then
determined for each mining area, based on 18 m height (Table 16-3).
•Allowable spans around the historic collapsed and filled stopes are slightly less than the virgin
areas as expected
•Poor ground conditions resulting from features such as closely spaced fractures, oxidized quartz
calcite, and faulting and clay filled structures around the veins dominate stope wall and crown
behaviour, with these zones being a main source of any overbreak/unravelling issues
Document ID: STU-063-REP-002-0 Released: 11th December 2024Page 139 of 244
OceanaGold Corporation | ||
NI 43-101 Technical Report – Waihi District Pre-feasibility Study, New Zealand | ||
•The rock mass conditions in the Rex stoping areas are expected to be very poor and this is
currently restricting the allowable strike length
•There is variation within the rock mass across the domains which needs to be given consideration
when planning stoping on a level-by-level basis.
Table 16-3. Summary of Allowable Strike Lengths
Mining Area | Hanging wall | Ore Zone | Footwall |
Edward - All | 11 m | 9 m | 11 m |
Edward - Upper | 13 m | 8 m | 13 m |
Edward - Lower | 11 m | 9 m | 11 m |
Empire - All | 11 m | 9 m | 11 m |
Empire | 14 m | 13 m | 21 m |
Martha | 26 m | 18 m | 23 m |
Empire West | 9 m | 5 m | 8 m |
Royal East | 13 m | 8 m | 16 m |
Royal West | 13 m | 11 m | 18 m |
Rex | 9 m | 2 m | 16 m |
16.2.3Hydrogeology and Mine Dewatering
Dewatering of the veins and workings will be required to reach the targeted depth. Inflows will be from
storage within the workings, veins, and the rock mass. In addition, rainfall infiltrating the base of the pit will
report to MUG during mining. Small pockets of perched groundwater may also be encountered in the
historical workings. Below 550 mRL previously unmined veins are expected, so only water from the veins,
rock mass and MOP will be removed.
Modelled groundwater inflows to MUG used an analytical model that is based on the historical dewatering
data set for the historical MOP. Discharge from the historical mine was sourced from storage in
interconnected vein systems and groundwater inflow from the surrounding rock mass. Vein water storage
was greatest where the veins were widest. These were also the areas of maximum gold yield.
Groundwater sourced from the rock mass was considered to be a minor contributor to the historical
discharge. Previous mining took place to a depth of approximately 541 mRL. Backfilling of stopes was
variable, and collapse and compression of stopes will have modified the void space following historical
mining. It is assumed that the sum of these void increases and decreases has not substantially altered
the original groundwater storage capacity.
Groundwater recharge from the open pit is significant during high rainfall events. The current average
daily dewatering rate is approximately 14,000 m3/d which is satisfactory for lowering the ground water
table within the mining schedule.
16.2.4Geochemical
Waste rock excavated from the MUG comprises similar geologies to that mined from the MOP over the
previous three decades. Where possible, waste rock remains underground and is used to backfill
Document ID: STU-063-REP-002-0 Released: 11th December 2024Page 140 of 244
OceanaGold Corporation | ||
NI 43-101 Technical Report – Waihi District Pre-feasibility Study, New Zealand | ||
excavated voids. During the initial stages of mining, waste rock was stored temporarily in the vicinity of
the Favona portal or in the Polishing Pond Stockpile which are designed to collect and manage seepage
and runoff before being returned later as underground backfill. Ore is stored at the existing Run of Mine
(ROM) stockpile to await processing.
Waste rock used as backfill will be permanently stored within the underground workings, limiting the
potential for oxidation of the overburden prior to future flooding of the workings The potential for ongoing
oxidation of waste rock once the materials are at their final destinations is considered to be negligible.
The current oversaturation of groundwater in respect to sulphate and a likely high degree of attenuation
on trace elements via the sorption to ion-hydroxide minerals will ensure that any impacts of groundwater
quality within the vicinity of the workings as a result of oxidized overburden should be minimal.
Within temporary stockpiles, appropriate mitigation measures in the form of limestone amendment will be
required to limit oxidation and/or limit the effects of already oxidized material. The limestone amendment
required for waste rock placed within the temporary stockpiles is dependent upon the exposure period
and the calculated sulphate oxidation rate. Waste rock placed in temporary storage structures and left
exposed for a period of no more than 30 weeks is blended with crushed limestone at a rate 12 kg CaCO3
per tonne of waste rock or at an amendment rate of approximately 1.2 %. Monitoring of placed rock
ensures these dosing rates are appropriate and enable refinement as part of ongoing operations.
16.2.5Mine Design
MUG is accessed via the existing Favona portal through the existing Trio and Correnso workings and
shares the ventilation development and shafts as well as the underground workshop, crib room and
dewatering systems.
Exploration drives were completed on 800 mRL and 920 mRL in 2018. Development of MUG commenced
in mid-2019 and 2,169 m of lateral development and a 120 m ventilation raise were completed by the end
of 2019 and a further 35,125 m of lateral development completed up to the end of 2023. Development has
focussed on ramp access for Edward, Empire, Rex and Royal mine areas, footwall, fill and ore drive
development, ventilation and secondary egress connections, and drilling platforms.
Two portal breakthroughs have been completed in the southwestern corner of the MOP and are being
used for ventilation and secondary egress purposes and dumping of underground waste into the bottom
of the pit.
Based on the proposed mining method and equipment, historical experience and orebody geometries, the
development strategy for MUG operations involves mining of declines for access to five main stoping
blocks. Access drives will be mined to develop drilling and loading levels, generally intersecting the
orebodies centrally. Access drives will be spaced generally at 14 m to 18 m vertically over the height of
the mine. Ore drives will be developed in both directions along strike from the access drives. Stockpiles
will be mined off the decline and in levels for truck loading.
Key differences with recent operating practices involve the development of footwall drives and crosscuts
in selected locations mainly confined to Edward, Empire east and west to backfill the historical workings
with cemented rock fill (CRF) or rockfill (RF). Crosscut spacing is generally at 15 m spacing. Historical
stopes are backfilled to provide both regional and local stability.
Document ID: STU-063-REP-002-0 Released: 11th December 2024Page 141 of 244
OceanaGold Corporation | ||
NI 43-101 Technical Report – Waihi District Pre-feasibility Study, New Zealand | ||
Mining method selection work for MUG was undertaken by SRK in 2011, 2016 and 2017 and confirmed
by Entech in 2018 and 2020 and by OceanaGold in 2020. Backfill studies were conducted by Outotec and
AMC in 2019 and 2020. Five mining methods are proposed for the mine:
•Modified Avoca with RF in virgin (previously unmined) areas
•Modified Avoca with RF in remnant areas adjacent to collapsed stopes separated by an
intermediate pillar
•Modified Avoca with RF in remnant areas adjacent historical stopes filled with engineered fill, CRF
•Bottom up, side ring method with CRF/RF where skins adjacent to historical backfill are extracted
•Bottom up or top down, transverse stoping with CRF/RF where skins adjacent to historical
backfill, open or collapsed stopes are extracted.
Mining options available for MUG are limited because of the blasting and backfill constraints and modified
Avoca and transverse mining was selected as the preferred mining methods. MUG has been designed
with a 14 m to 18 m level spacing, floor to floor primarily to limit blast vibration but this also assists
hanging wall and footwall stability.
A reasonable proportion of the Mineral Reserves will involve the extraction of remnant skins in the footwall
or hanging wall of previously mined (historical) stopes, or the extraction of both remnant skins. Historical
backfill may also be mined and experience with open pit mining shows this material may be above the
cut-off. However, as it is currently classified as Inferred Mineral Resource it is not included as Mineral
Reserve.
Following detailed studies over the last nine years, the following methods are proposed for the extraction
of remnant areas, adjacent to historic workings:
•Modified Avoca method whereby the historic stope is backfilled with CRF prior to stoping and the
remnant skin is extracted by conventional modified Avoca using RF in a bottom-up sequence that
exposes the CRF
•Modified Avoca method adjacent the collapsed historic stope where backfill with CRF is not
feasible and a stand off from the historic wall of 3.0 m maintained with lower estimated
recoveries, higher dilutions
•Remote, side ring method where the historic backfill is extracted together with remnant wall rock
in a top-down sequence with CRF backfill. The side ring method is described in detail below
•Transverse stoping method where the historic backfill is extracted together with remnant wall rock
in a top down or bottom-up sequence with CRF/RF backfill.
The side ring and transverse mining method for the extraction of remnant skins and historic backfill will
use conventional drilling and remote loading methods. This method involves additional waste
development adjacent to the remnant stopes, which increases overall development quantities and mining
costs. The permit and mining method requires all stopes and selected development to be backfilled.
Mine design was prepared using Deswik® software, that allows for mine physicals to be scheduled. The
design software incorporates functionality to export all design and block model interrogation data to the
scheduler, including volumes, tonnes, grades, and segment lengths. Furthermore, graphical sequencing
is exported for the critical links between all development and production activities.
Document ID: STU-063-REP-002-0 Released: 11th December 2024Page 142 of 244
OceanaGold Corporation | ||
NI 43-101 Technical Report – Waihi District Pre-feasibility Study, New Zealand | ||
16.2.6Productivities and Mine Production Schedule
MUG mine production criteria were calculated from benchmarked rates. Table 16-4 lists the productivity
rates and activity durations used in the mine development and production schedule.
Table 16-4: Underground Mining Rates
Activity | MUG Rate |
Critical access and ventilation development | 18 m/week max |
General rate level waste development | 9-12 m/week |
High priority ore drive development | 15 m/week |
General rate ore drive development | 9 m/week |
Stope production – peak individual stope | 650 t/day - 800 t/day |
Stope production – total mine peak | 2,000 t/day |
Standard backfilling rate | 850 t/day |
Long hole drilling rate per rig | 120 m/day |
Checks were made to ensure development and stopes were sequenced correctly, development
completed on the level prior to stoping commencing and adequate separation between the stoping fronts
on the various levels. Checks were also made to ensure stoping, drilling, and backfilling activities on a
single level could be carried out independently of each other.
The MUG schedule allows for a dewatering rate of 40 vertical metres per year. Crown pillars have been
located at strategic horizons to enable production targets to be met and to ensure that a tail of low
production towards the end of the mine schedule could be minimized. The mining schedule was split into
the following working areas:
•Rex
•Edward upper levels
•Empire east and Martha
•Empire west
•Royal east
•Royal west.
Each working area had independent decline access and independent escape and ventilation
development.
Document ID: STU-063-REP-002-0 Released: 11th December 2024Page 143 of 244
OceanaGold Corporation | ||
NI 43-101 Technical Report – Waihi District Pre-feasibility Study, New Zealand | ||
The mine is planned to produce at a rate of 500,000 tpa. To ensure overall mine production rates are
achievable, activities associated with the mining works were scheduled in a logical sequence using the
rates discussed above.
The major constraints on the underground scheduling were as follows:
•Minimize variations in development rates and production to avoid additional costs due to under-
utilisation of the mobile equipment
•Maintain capital development approximately one full stope block ahead of production to enable
capital infrastructure to be established
•Stope production can only commence once the main return airway and second egress is
established.
The schedule comprises six independent ramp accesses each with separate escape and return air
systems which are gathered at the key 800 L and 920 L haulage drives. From each decline a crosscut is
developed into the orebody and sill dives developed along the orebody, each level also includes minor
infrastructure for stockpiling, loading, electrical and pumping. On some levels additional development
including footwall drives, crosscuts and passes are developed for backfilling the historical stopes.
16.2.7Ventilation
MUG primary ventilation plan is shown in Figure 16-5. Fresh air enters MUG’s south western district via
the northern haulage portal and the pit intake above the Edward lode area and also from the Correnso
mine via the 920 mRL and 800 mRL drives. Return air exits the mine via the pit exhaust drive and the
existing 4.5 m diameter 920 to 800 mRL raisebored shaft. The existing Trio primary fans only need run
when accessing remnant areas in the north otherwise they can be switched off. The secondary means of
egress is via the pit intake.
The current primary fan arrangement for south-west MUG is comprised of two 700 kW MTV axial flow
fans in parallel located underground in the pit exhaust airway.
Document ID: STU-063-REP-002-0 Released: 11th December 2024Page 144 of 244
OceanaGold Corporation | ||
NI 43-101 Technical Report – Waihi District Pre-feasibility Study, New Zealand | ||
Having a complex system of connecting airways between ventilation districts, with multiple mining fronts
running concurrently, requires a good understanding of the ventilation circuit. Opening and closing louvred
regulators as well as ventilation gates in strategic places assists in managing airflow distribution.
Figure 16-5: MUG Primary Ventilation Layout
Table 16-5 lists the mobile equipment and shows the number of vehicles along with their subsequent
airflow requirements for dilution of diesel exhaust.
Document ID: STU-063-REP-002-0 Released: 11th December 2024Page 145 of 244
OceanaGold Corporation | ||
NI 43-101 Technical Report – Waihi District Pre-feasibility Study, New Zealand | ||
Table 16-5: Mobile Diesel Fleet Ventilation Requirements
Full Diesel Fleet | Model | Engine power rating (kW) | Airflow requirement | Qty | Total Airflow (m³/s) |
Truck | Sandvik TH551 | 515 | 26 | 6 | 156 |
Loader | Sandvik LH517i | 310 | 16 | 4 | 64 |
Loader | R2900G | 320 | 16 | 2 | 32 |
Grader | Cat 12H | 120 | 6 | 1 | 6 |
Charge-up | Charmec 1610B | 110 | 6 | 2 | 12 |
Agitator | LF700 | 170 | 9 | 2 | 18 |
Development Drill | Sandvik DL421-7C | 120 | 6 | 5 | 30 |
Production Drill | Solo DD330, Sandvik DL421-7C | 55 110 | 3 6 | 3 2 | 9 12 |
IT | L120G | 200 | 10 | 4 | 40 |
LV | Toyota Landcruiser | 110 | 6 | 5 | 30 |
Total (m³/s) | 410 | ||||
16.2.8Mine Services
The mine primary pump station is installed in the lower levels of Correnso at 794 mRL and consists of two
trains of four Wier 6/4 AHPP-08 centrifugal multi-flow pumps, horizontal shaft type, and mounted on a 2.4
x 6 m skid. The pumps are each powered by Teco 132 kW motors with independent variable speed
drives. The pump chamber includes two modified sea containers equipped with level float switches and
sparging for temporary storage of water. The general layout is shown in Figure 16-6.
Document ID: STU-063-REP-002-0 Released: 11th December 2024Page 146 of 244
OceanaGold Corporation | ||
NI 43-101 Technical Report – Waihi District Pre-feasibility Study, New Zealand | ||
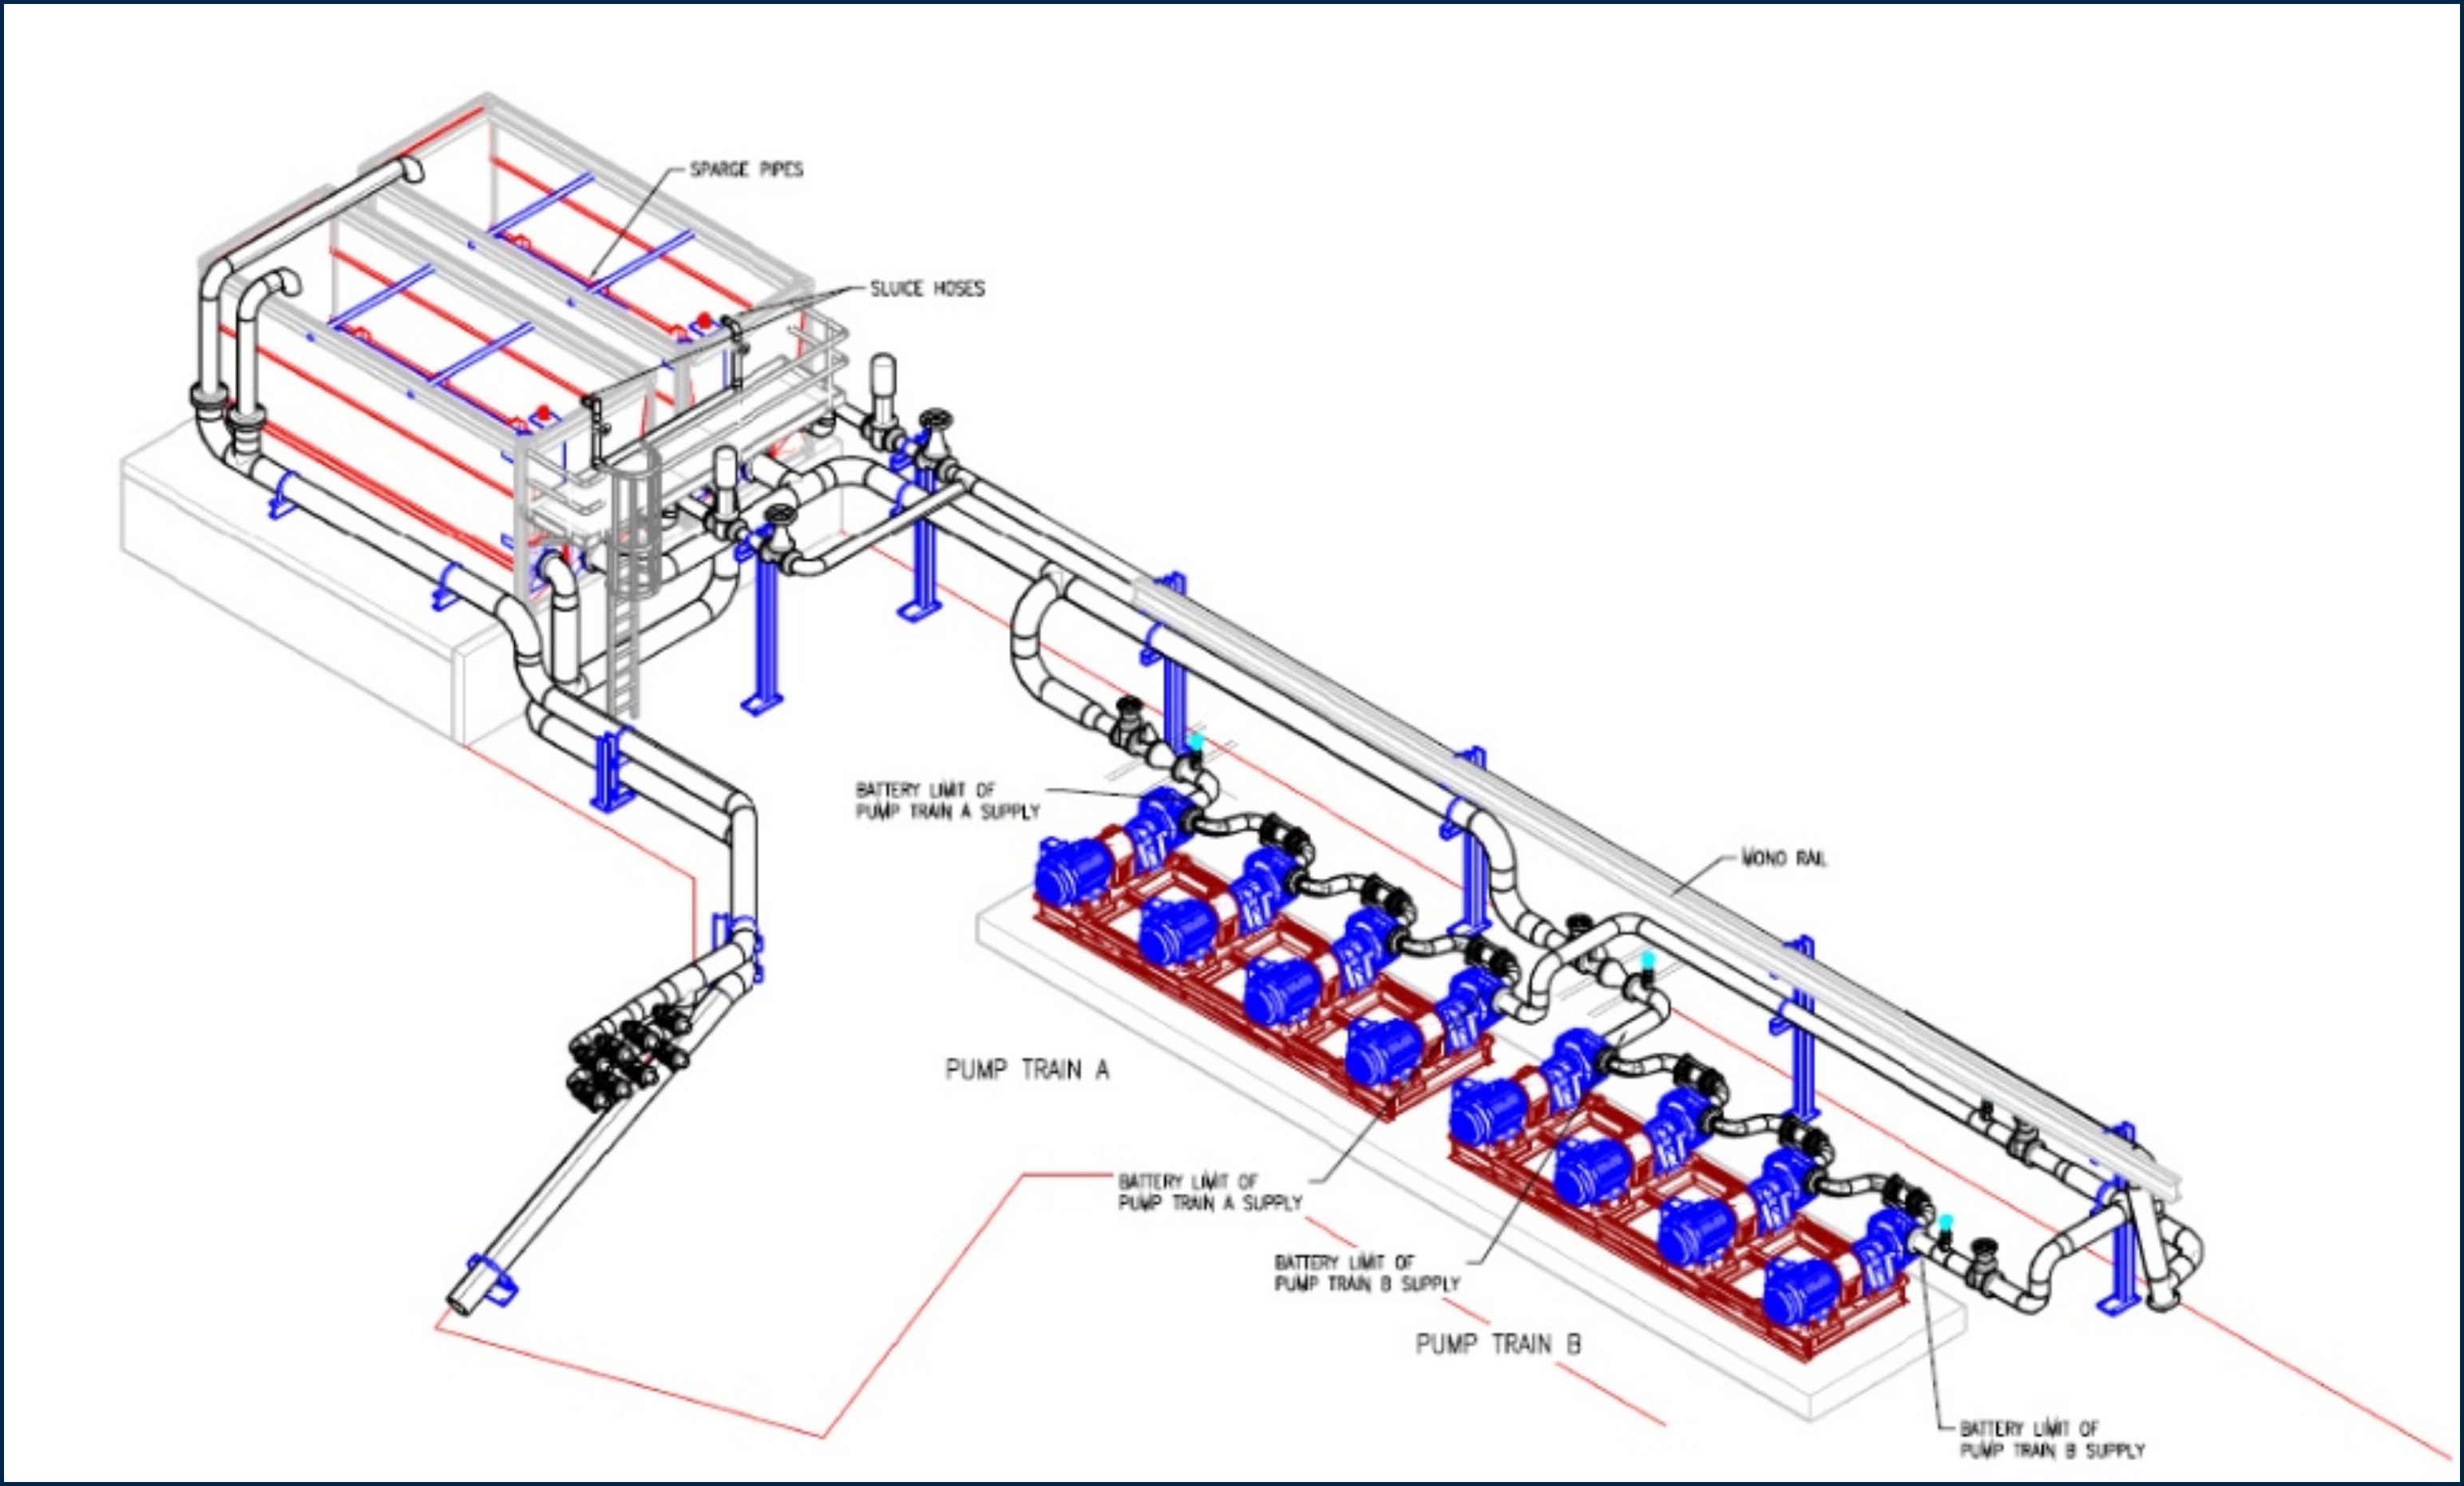
Figure 16-6: Martha Primary Pumping Station Layout
Four dewatering bores were commissioned in 2020, targeting old mine workings and were drilled from 2
access cuddies along the 800 m drill drive which dewatered the groundwater levels from the original
730 mRL down to 620 mRL (110 m head).
The preferred approach to dewater levels from 620 to 560 mRL, will be a combination of active and
passive dewatering. When high inflows are intersected, diamond drilled holes are drilled into the area to
dewatering the area faster and allow dryer working conditions in developments going forward. The water
from the drill holes is dropped onto the floor, directed through drains to dedicated sumps and pump
stations.
The secondary pumping strategy for will be to pump or gravity flow to sumps located in the level access
development. This water is then gravity fed through drain holes linking level sumps and pumped or
directed to the primary pumping station.
16.3WUG
16.3.1Cut-off Grade Calculations
Stopes are assessed individually to determine if they meet the relevant cut-off grade. In addition, the
profitability of stoping areas is assessed to ensure profits cover the costs of any additional development
requirements.
Two cut-off grades are used at WUG:
•minimum grade to warrant stoping including new ore drive development
•minimum grade to warrant processing of any development material including haulage to mill.
4 MUG and WUG royalties are payable to the NZ government at the greater of a 1 % royalty on net sales
revenue from gold and silver or 5 % of accounting profits. Parts of the Wharekirauponga Mining
Permit, MP 60541, are subject to an additional 2 % of sales royalty payable to Osisko (acquired from
Geoinformatics)
Document ID: STU-063-REP-002-0 Released: 11th December 2024Page 147 of 244
OceanaGold Corporation | ||
NI 43-101 Technical Report – Waihi District Pre-feasibility Study, New Zealand | ||
These cut-off grade scenarios are shown in Table 16-6.
Table 16-6: WUG Cut-off Calculation
Parameter | Unit | Operating CoG | Development CoG |
Mining cost | $/t | 65.2 | 19.2 |
Process cost | $/t | 26.3 | 26.3 |
G&A | $/t | 22.6 | 22.6 |
Total Cost | $/t | 114.6 | 68.7 |
Gold price | $/oz | 1,750 | 1,750 |
Average Au mill Recovery | 90% | ||
Royalty4 | 4% | ||
Cut-off grade | g/t | 2.4 | 1.4 |
Document ID: STU-063-REP-002-0 Released: 11th December 2024Page 148 of 244
OceanaGold Corporation | ||
NI 43-101 Technical Report – Waihi District Pre-feasibility Study, New Zealand | ||
16.3.2Geotechnical
Geotechnical studies were undertaken by several external consultants and the OceanaGold studies team
and has entailed the establishment of the geotechnical characterization and geotechnical design
elements for the relevant areas. Key investigation and independent review have centred around:
•Drill hole logging, sampling and geotechnical testwork on samples
•Willows area and portal
•WUG access tunnel, process plant to Willows access tunnel
•WUG.
The drilling program was highly limited by restricted access conditions (within the DOC boundary). More
than 130 diamond drillholes have been completed at WUG. Of this drilling 102 holes have had
geotechnical logging for RQD and 44 for Q.
Rock property testing was conducted for the major rock types in WUG. A total of 54 uniaxial compressive
strength (UCS) tests and a total of 7 Brazilian tests were completed to infer strength and elastic properties
of the rock mass.
Stress measurements are not available for WUG. However, tests have been conducted for the Trio
underground mine (some 10 km to the south), as reported by Golder (2021).
The rock mass quality estimates combined with the laboratory testwork show a wide range. The results
indicate that there is significant variance in the rock mass quality of the region ranging between ‘very
poor’ to ‘good’ averaging ‘fair’ in the main stoping regions. Rock quality can impact on the stability of
workings and in terms of the Avoca mining method is managed by the sublevel interval and the maximum
length of hanging wall exposed prior to backfilling. Because of the variability in estimates this would need
to be managed on an operational basis once conditions are confirmed in the sill drive.
The orebody is narrow in most regions and the driving property limiting stope strike is the hanging wall
span. Consequently, back widths are not expected to exceed 15 m in most areas of the mine. However, in
localized areas of the EG Veins there is opportunity for large sized stope widths up to 15 mL x 20 mW in
span. Empirical assessment suggests that approximately 50 % of these stopes will require ground
support.
Although empirical methods have gained wide acceptance in estimating preliminary design spans, it is
important to consider their limitations where the effects of large-scale persistent structures are generally
not adequately represented and it is quite possible that the hanging wall will fail back to a structural
feature such as a contact, fault, or fault splay as the stope span is increased and the zone of the hanging
wall relaxation or de-stressing extends. These issues could be overcome or better managed with the
installation of support, strategic placement of pillars, or changes in stope design so that the stope
boundaries coincide with structures.
The extraction sequence can be broken into two different types:
•Avoca: bottom-up longitudinal access retreat along strike using modified Avoca
•Transverse: within the wider EG sections this is bottom-up transverse primary/secondary
extraction with consolidated fill (CRF). Transverse access is from the footwall.
Document ID: STU-063-REP-002-0 Released: 11th December 2024Page 149 of 244
OceanaGold Corporation | ||
NI 43-101 Technical Report – Waihi District Pre-feasibility Study, New Zealand | ||
Figure 16-7 illustrates a typical sequence within the wider southern decline section.
Figure 16-7: WUG Mining Method and Extraction Sequence
16.3.3Hydrogeology and Mine Dewatering
The catchment area for the Wharekirauponga Stream is approximately 15 km2 and with 2.17 m/year
rainfall, the average daily rainfall volume reporting to the catchment is in the order of 89,200 m3/d, with
most rainfall in winter although sub-tropical storms can produce heavy events in summer. The general site
location is interpreted to be within a groundwater discharge zone within the headwaters of the
Wharekirauponga Stream that flows to the north-east and ultimately joins the Otahu River. Surface water
flow rates have been monitored since 2019. Figure 16-8 shows WUG mine and access tunnels in relation
to the Wharekirauponga catchment.
Document ID: STU-063-REP-002-0 Released: 11th December 2024Page 150 of 244
OceanaGold Corporation | ||
NI 43-101 Technical Report – Waihi District Pre-feasibility Study, New Zealand | ||
Figure 16-8: Wharekirauponga Catchment Drainage
WUG is located in a sensitive region in relation to groundwater with several minor streams in the area as
illustrated in Figure 16-8. Hydrogeological investigations to date have been made by a number of
consultants including a three-dimensional hydrogeological model (3D Model) of the Wharekirauponga
catchment with uncertainty analysis. Flow monitoring, radon testing and 3D modelling has indicated the
Wharekirauponga catchment streams have potential for a portion of their baseflow to be attributable to
discharge from the EG ore vein system.
Studies to date have shown that unlike MUG there is potential for some connection between the deeper
and shallow aquifer units. The degree of the connectivity is key to understanding any risk of impacts to
the streams above the mine and will be controlled by permeable structures and the stream bed
characteristics. A three-dimensional groundwater model was built that has had reasonable calibration to
field data to replicate some but not all characteristics of the sub-catchment.
The area of potential effect from mine dewatering is expected to be constrained to (Figure 16-9):
1.Downstream drainage point: Studies have shown a drainage point lower in the catchment
corresponding with the strike of the EG vein is likely
2.Rhyolite exposure: Although modelling is indicating impact outside of the outcrop, expert opinion
is that this is due to the lack of information (due to limited drill sites and ability to test) on the post-
colluvium units. Any impacts from dewatering are expected to be concentrated on any structures
that intersect through where the rhyolite outcrop area
3.Warm spring reduction/cessation: This is a unique feature which was unable to be re-created in
the modelling. The suspected mechanism is a pipe-type structure and expected to cease during
dewatering. Impacts are minor and water quality is poor with no unique ecological characteristics.
Document ID: STU-063-REP-002-0 Released: 11th December 2024Page 151 of 244
OceanaGold Corporation | ||
NI 43-101 Technical Report – Waihi District Pre-feasibility Study, New Zealand | ||
Figure 16-9: WUG Potential Groundwater Impact Areas
Uncertainty analysis has been conducted on the model results with a conservative combination (lowest
flow of streams with hydrogeological characteristics of the highest impact) showing that minimal impacts
are expected on both the streams and the ecology. The modelling construction and results have been
independently peer reviewed by reputable industry experts.
The bulk of the formation through which the WUG access tunnels is constructed consists of low-
permeability, low-storativity andesite with any groundwater being stored and transmitted in fractures.
Dewatering is therefore largely limited to management of the groundwater contained in fault and vein
systems. Control of underground groundwater inflow through an appropriate grouting or resin injection
method may be employed in these structures to ensure minimal impacts to surface bodies are
maintained. Estimates for the total ground water inflows have been made and are illustrated in Table 16-7.
Document ID: STU-063-REP-002-0 Released: 11th December 2024Page 152 of 244
OceanaGold Corporation | ||
NI 43-101 Technical Report – Waihi District Pre-feasibility Study, New Zealand | ||
Table 16-7: Dewatering Estimates for WUG
Area | Go Forward Case (m3/d) |
Access Tunnel Processing Plant to Willows | 2,400 |
Dual Tunnels Willows to WUG | 7,000 |
WUG (Intera results) | 2,600 |
Total mine dewatering | 12,000 |
16.3.4Geochemical
Column leach tests have been conducted with a representative sample of the expected WUG material.
Results have shown similar potential for acid forming material (PAF) as the existing MUG operation.
Waste rock stored on surface is expected to require lime amendment to limit oxidation and/or limit the
effects of already oxidized material. Any contact water with this PAF material is contained and transported
to the upgraded water treatment facility for treatment (see sections 0 and 18.5).
An assessment for WUG closure was conducted including particle tracking to understand potential
impacts on streams. Results have shown that with lime amendment, trace elements are unlikely to be
measurably different to existing conditions.
16.3.5Mine Design
The proposed access to WUG is via a 6.5 km underground tunnel from OceanaGold owned land at the
end of Willow Road just north of Waihi. Access to surface installations within the Forest Park is limited.
Surface infrastructure will be located at Willows to support the mining operation, including ventilation
raises and fans, with additional life-of-mine ventilation installations near the orebody within the Forest
Park.
A 4.7 km tunnel is also proposed from the Willows to the process plant at Waihi to complete the transport
route from the mine to the plant (Figure 16-10). This tunnel will be developed from both ends meeting in
the middle and is timed to provide access as late as possible to the processing plant end.
Document ID: STU-063-REP-002-0 Released: 11th December 2024Page 153 of 244
OceanaGold Corporation | ||
NI 43-101 Technical Report – Waihi District Pre-feasibility Study, New Zealand | ||
Figure 16-10: Waihi North Project Configuration
Studies showed that a dual access option provided an economic advantage over a single decline access
when the risk of production delays is considered, while also assisting with primary ventilation
management. The dual access option negates the need for an additional ventilation raise within the
Forest Park.
The development of the access tunnels from the Willows portal will be ventilated by a primary return air
raise close to the portal within the Willows boundary. The dual tunnel design allows for the second tunnel
to be used as a primary return airway to the return air raise, thus negating the need for long secondary
ventilation circuits over the 6.7 km tunnel distance.
The dual incline to the top of the orebody, allowing early access for construction of the primary ventilation
raises to the surface. The portal raise then becomes a fresh air raise, providing a fresh air intake for each
access decline.
Two other declines split from the main access decline (Figure 16-11), one of which accesses -40 mRL,
which is the base of the upper mining area, above the sill pillar. The second decline accesses the bottom
of the orebody. This system of three decline accesses allows for production from both the upper and lower
mining areas at the same time, as well as providing for multiple contingent faces for development into the
orebody, effectively decreasing the production ramp-up time. They also facilitate air flow through the mine.
Document ID: STU-063-REP-002-0 Released: 11th December 2024Page 154 of 244
OceanaGold Corporation | ||
NI 43-101 Technical Report – Waihi District Pre-feasibility Study, New Zealand | ||
Figure 16-11: WUG Long Section looking NW from Footwall
A second fresh air intake will be mined to the surface near the orebody to assist with ventilation flows to
the extremities of the orebody. An emergency egress raise will be incorporated within this air intake. Due
to air speeds and pressures a control system will need to be in place to turn fans off for use of this
emergency egress. The ventilation raise locations will be restricted by the need to minimise impacts on
the surface.
A large portion of the orebody is steeply dipping and amenable to Avoca style selective mining. A portion
of the orebody is massive where ore veins coalesce, and this zone is amenable to a transverse long hole
open stoping with engineered backfill.
The interpretation and definition of the geological model has been improving due to successful conversion
drilling. Over a certain region (highlighted in dashed white in Figure 16-11), the EG vein is variably
dipping, and the footwall veins coalesce. Low-grade mineralization has been identified between the
numerous footwall veins, therefore suggesting selective mining in this region is not the preferred
approach, as it could leave significant high-grade pillars behind. 80 % of the deposit is in the southern
zone, and approximately 50 % of the total WUG value is from the area highlighted by the dashed polygon.
An optimized transverse bulk mining method has been applied to this region to recover more
mineralization and provide flexibility in the event of geological interpretation and geotechnical changes.
Where the veins coalesce into a more massive (bulk) zone with narrow spacing between veins, a
benching method with cemented rock fill (CRF) will be employed. Stope widths will be limited to 15 to
20 m wide to address the crown stability risk.
Bulk mining will provide higher ore tonnes and contained gold ounces (at the cost of reduced grades).
Figure 16-12 compares the bulk mine design (left) to the Avoca only mining (right). Bulk mining requires
additional development for crosscuts and footwall drives. Where the veins are narrow and spread further
apart, Avoca and modified Avoca methods will continue to be the predominant methods employed.
Document ID: STU-063-REP-002-0 Released: 11th December 2024Page 155 of 244
OceanaGold Corporation | ||
NI 43-101 Technical Report – Waihi District Pre-feasibility Study, New Zealand | ||
Figure 16-12: Bulk Mining (left) vs Avoca Only Mining (Right)
Vertical stoping limits are 20 m floor to floor, and mining is scheduled in an overhand style, retreating
horizontally from strike extremity towards two accesses per level, and centre outward towards the
accesses. The production rate is scheduled at 800 kt ore per annum.
A decline system was designed to connect to the level accesses, and other infrastructure required for the
life of the mine was designed from these openings. Two level access locations per level are provided in
the PFS design. These locations satisfy the following criteria:
•Secondary ventilation – Accesses are located to ensure that secondary ventilation circuits for
development and stoping on levels are reasonable, without pressure losses that would result in
inadequate airflow. This requires limiting strike distances between primary ventilation access
points
•Production efficiency – The orebody geometry is narrow with a long strike distance. This limits the
options for sequencing of multiple mining fronts, as each level must retreat to the access from
either direction, limiting the level to two production fronts at a time. The provision of twin accesses
allows for up to four mining fronts per level, providing greater flexibility in production scheduling to
decrease production risk over the life of the mine.
A sill pillar is located at -60 mRL, splitting the mine into two areas allowing for multiple mining fronts.
Stopes above the sill bench will be bench mined and backfilled with cemented rock fill to allow for
recovery of the pillar towards the end of the mine life.
Mine waste will be stockpiled at Willows and the polishing pond during the development phase of WUG
and then returned underground as stope backfill. Mining rates assume major access capital development
will be mined by a specialized mining contractor.
16.3.6Productivities and Mine Production Schedule
Mining of the WUG orebody consists of the following phases:
1.Construction of the portal and surface infrastructure, which includes the waste rock stack
foundation, crib rooms and offices, electrical substation, water management facilities, fuel
storage, explosive magazines, compressed air supply, workshops, stores, parking areas, and
other ancillary facilities required for the mining operation. The facility area and portal will be
located at the Willows
Document ID: STU-063-REP-002-0 Released: 11th December 2024Page 156 of 244
OceanaGold Corporation | ||
NI 43-101 Technical Report – Waihi District Pre-feasibility Study, New Zealand | ||
2.Preparation for the portal at the Polishing Pond near the processing plant for the additional
haulage tunnel will also be required
3.Development of the Willows decline from surface to the initial primary ventilation raise (VS1). This
is a single heading development using secondary ventilation from the portal
4.Mining of the primary return air shaft and installation of primary fans, and establishment of an
underground pumping station
5.Development of dual inclines to the WUG orebody. This development will utilize primary
ventilation airflows between the portal and the return air raise
6.Concurrent development of an incline from the Willows return air raise location and decline from
the Polishing Pond
7.Develop declines (off the dual incline) to access the orebody, initially using secondary ventilation.
Develop surface air raises, then transfer the primary ventilation fans to the WUG orebody return
air raise
8.Develop the orebody infrastructure and production accesses, including ore drives
9.Commence stope production upon completion and commissioning critical path capital
development and associated infrastructure
10.Production ramp-up to steady-state production to closure
11.Mine rehabilitation.
The rate at which nameplate production is achieved is determined by access to the WUG from the
Willows box cut portal, and then by the rate of vertical advance possible once primary ventilation is
established.
The orebody is divided into three production zones 'A', 'B' and 'C (Figure 16-13). There are also separate
production zones above and below the sill pillar at -60 mRL in zones 'A'. Zone 'Z' is the main access
capital development.
Zone 'A' is the most significant production zone and the first to commence production due to its proximity
to the main access tunnels.
Figure 16-13: Isometric View of WUG Underground Layout (Looking from Hanging Wall)
Document ID: STU-063-REP-002-0 Released: 11th December 2024Page 157 of 244
OceanaGold Corporation | ||
NI 43-101 Technical Report – Waihi District Pre-feasibility Study, New Zealand | ||
Underground mine scheduling is undertaken with Deswik® Interactive Scheduler and Deswik® Sched
software. After establishing task dependencies, mining priorities, task rates, and capacity constraints the
schedule is generated using the software’s auto-scheduler. Equipment productivity rates are built from a
combination of existing MUG benchmarking, first principles and benchmarking to similar projects.
Key schedule assumptions are noted in Table 16-8.
Table 16-8: WUG Mining Rates
Activity | Resource | Rate |
Production Loader | LHD | 450 -1,000 t/day depending on width of stope |
Backfill Loader | LHD | 850 t/day for Rack fill, 600 t/day for CRF |
Surface Fresh/Return Air Raise | Strip and Line | 4 m/d |
Stope Drilling | LH Drill | 180 m/d |
Decline - Single heading | Jumbo | 28 m/week per heading |
Incline - Dual | Jumbo | 36 m/week per heading |
Decline - orebody access | Jumbo | 28 m/week per heading |
Access Drive | Jumbo | 28 m/week per heading |
All other remaining development | Jumbo | 9 m/week |
The mine mobile equipment requirements summarized in Table 16-9 are based on the production
schedule.
Table 16-9: WUG Mobile Equipment Fleet
Category | Make and Model (Indicative) | 2026 | 2027 | 2028 | 2029 | 2030 | 2031 | 2032 | 2033 | 2034 | 2035 | 2036 | 2037 | 2038 |
Development Drills | Sandvik DD422i | 1 | 1 | 3 | 2 | 2 | 2 | 2 | 3 | 3 | 1 | 1 | 1 | 1 |
Production Drills | Sandvik DL431 | 1 | 1 | 1 | 1 | 1 | 2 | 2 | 3 | 4 | 4 | 3 | 3 | 2 |
Loaders | Sandvik LH517 | 1 | 1 | 2 | 2 | 2 | 2 | 2 | 6 | 8 | 7 | 7 | 5 | 2 |
Trucks | Sandvik TH551 | 1 | 1 | 2 | 2 | 2 | 4 | 4 | 9 | 11 | 8 | 8 | 7 | 3 |
Charge-up | Charmec MF 605D | - | - | - | - | - | - | 1 | 1 | 2 | 2 | 2 | 1 | 1 |
Shotcreter | Spraymec SF 050 | 1 | 1 | 1 | 1 | 1 | 1 | 1 | 1 | 1 | - | - | - | - |
Transmixer | Agi LF700 | 1 | 1 | 1 | 1 | 1 | 1 | 1 | 1 | 2 | 2 | 2 | 2 | 1 |
Service Truck | MacLean BT3 | 1 | 1 | 1 | 1 | 1 | 1 | 1 | 1 | 1 | 1 | 1 | 1 | 1 |
Water Truck | Elphinstone WF810 | 1 | 1 | 1 | 1 | 1 | 1 | 1 | 1 | 1 | 1 | 1 | 1 | 1 |
Grader | Cat 12H | 1 | 1 | 1 | 1 | 1 | 1 | 1 | 1 | 1 | 1 | 1 | 1 | 1 |
Light Vehicle | Landcruiser | 2 | 3 | 10 | 10 | 10 | 9 | 9 | 12 | 12 | 12 | 12 | 11 | 5 |
IT | Volvo L120 | 1 | 1 | 2 | 2 | 2 | 2 | 2 | 3 | 3 | 1 | 1 | 1 | 1 |
Document ID: STU-063-REP-002-0 Released: 11th December 2024Page 158 of 244
OceanaGold Corporation | ||
NI 43-101 Technical Report – Waihi District Pre-feasibility Study, New Zealand | ||
16.3.7Ventilation
The development phase of the mine during the building of access tunnels from the Willows portal will be
ventilated by a primary return air raise close to the portal within the Willows. The dual tunnel design
allows for the second tunnel to be used as a primary return airway to the return air raise, thus negating
the need for extensive secondary ventilation circuits over the 6.7 km tunnel distance.
At the orebody two additional return air raises will be mined to surface, one for return air and one as a
fresh air intake. An emergency egress system is included within the fresh air intake shaft.
It is assumed that consents will enable ventilation shafts to be located in favourable geotechnical ground
and give the ability to conduct the required investigative drilling and testing to find suitable ground prior to
construction. In addition, the surface expression will be increased to up to 900 m2, to allow for the
construction requirements.
Due to access restriction to finalise a ventilation construction methodology a conservative approach has
been made by shortening the shaft lengths to 60 m and increasing the lateral development. Final
methodology will be dependent on ground conditions encountered and is part of the forward work
program when access is given to investigate. Figure 16-4 illustrates the potential construction
methodology.
Figure 16-14: WUG Ventilation Shaft Construction Methodology
Ventilation requirements are determined from the diesel fleet requirements of the mining schedule.
460 m3/s is required at maximum demand which includes leakage. A 2 MW fan is required to provide this
quantity and is to be constructed underground.
16.3.8Mine Services
Mine dewatering from WUG is estimated to be 12,000 m3/day. Due to some uncertainty, especially with
the dual tunnel section, infrastructure has been sized for 350 L/s or 30,240 m3/day. This size is
considered appropriate and allows for potential higher permeabilities in sections of the tunnel.
Document ID: STU-063-REP-002-0 Released: 11th December 2024Page 159 of 244
OceanaGold Corporation | ||
NI 43-101 Technical Report – Waihi District Pre-feasibility Study, New Zealand | ||
The main primary dewatering infrastructure will be staged as the mine progresses. Costs and
development are included to accommodate the following pump stations:
•PS1: 2 x Warman 12/10 AHPP Centrifugal Pumps (2 duty)
•PS2: 2 x Warman 12/10 AHPP Centrifugal Pumps (2 duty)
•PS3: 2 x Warman 12/10 AHPP Centrifugal Pumps (2 duty)
•PS4: 3 x Warman 12/10 AHPP Centrifugal Pumps (3 duty)
•Interim PS1: 3 x Flygt BS2640 90kW
•Interim PS2: 3 x Flygt BS2640 37kW
Mine designs have appropriate drainage and drain lines included in the design to facilitate all water to the
main pump stations.
16.4Production Schedule
Figure 16-15 and Figure 16-16 show the annual mine and mill production schedule respectfully for MUG
and WUG. Table 16-10 shows the combined production schedules. Note figures show H2 only for 2024
with full year production expected to be 48-52 koz.
Figure 16-15. Annual Mine Production
Document ID: STU-063-REP-002-0 Released: 11th December 2024Page 160 of 244
OceanaGold Corporation | ||
NI 43-101 Technical Report – Waihi District Pre-feasibility Study, New Zealand | ||
Figure 16-16: Annual Processing Profile
Document ID: STU-063-REP-002-0 Released: 11th December 2024Page 161 of 244
OceanaGold Corporation | ||
NI 43-101 Technical Report – Waihi District Pre-feasibility Study, New Zealand | ||
Table 16-10: Annual Production Profile
Description | Units | 2024 (H2) | 2025 | 2026 | 2027 | 2028 | 2029 | 2030 | 2031 | 2032 | 2033 | 2034 | 2035 | 2036 | 2037 | 2038 |
MUG Production Schedule | ||||||||||||||||
Ore Tonnes | 000's t | 275 | 453 | 493 | 516 | 503 | 485 | 472 | 492 | 356 | 365 | - | - | - | - | - |
Gold Grade g/t | g/t | 3.0 | 3.4 | 3.5 | 3.6 | 3.7 | 3.8 | 4.0 | 3.8 | 5.2 | 4.0 | - | - | - | - | - |
Silver Grade g/t | g/t | 13 | 16 | 18 | 13 | 13 | 14 | 13 | 9 | 39 | 18 | - | - | - | - | - |
Contained Au oz | 000's oz | 26 | 50 | 55 | 60 | 60 | 60 | 60 | 60 | 60 | 47 | - | - | - | - | - |
Contained Ag oz | 000's oz | 118 | 233 | 290 | 215 | 206 | 216 | 194 | 143 | 451 | 216 | - | - | - | - | - |
Waste Mined Tonnes | 000's t | 227 | 520 | 436 | 361 | 328 | 129 | 44 | 44 | 4 | 1 | - | - | - | - | - |
WUG Production Schedule | ||||||||||||||||
Ore Tonnes | 000's t | - | - | - | - | - | - | - | 3 | 139 | 620 | 798 | 799 | 795 | 662 | 240 |
Gold Grade g/t | g/t | - | - | - | - | - | - | - | 5.5 | 11.4 | 10.1 | 9.6 | 10.7 | 8.2 | 7.8 | 7.4 |
Silver Grade g/t | g/t | - | - | - | - | - | - | - | 6 | 18 | 18 | 17 | 18 | 14 | 13 | 16 |
Contained Au oz | 000's oz | - | - | - | - | - | - | - | 1 | 51 | 201 | 245 | 276 | 209 | 165 | 57 |
Contained Ag oz | 000's oz | - | - | - | - | - | - | - | 1 | 79 | 356 | 428 | 463 | 368 | 277 | 123 |
Waste Mined Tonnes | 000's t | - | - | 50 | 176 | 477 | 477 | 469 | 428 | 317 | 357 | 416 | 57 | 31 | 5 | 3 |
Combined Underground Production Schedule | ||||||||||||||||
Ore Tonnes | 000's t | 275 | 453 | 493 | 516 | 503 | 485 | 472 | 495 | 496 | 985 | 798 | 799 | 795 | 662 | 240 |
Gold Grade g/t | g/t | 3.0 | 3.4 | 3.5 | 3.6 | 3.7 | 3.8 | 4.0 | 3.8 | 6.9 | 7.8 | 9.6 | 10.7 | 8.2 | 7.8 | 7.4 |
Silver Grade g/t | g/t | 13 | 16 | 18 | 13 | 13 | 14 | 13 | 9 | 33 | 18 | 17 | 18 | 14 | 13 | 16 |
Contained Au oz | 000's oz | 26 | 50 | 55 | 60 | 60 | 60 | 60 | 60 | 111 | 248 | 245 | 276 | 209 | 165 | 57 |
Contained Ag oz | 000's oz | 118 | 233 | 290 | 215 | 206 | 216 | 194 | 144 | 530 | 572 | 428 | 463 | 368 | 277 | 123 |
Waste Mined Tonnes | 000's t | 227 | 520 | 486 | 537 | 805 | 606 | 513 | 473 | 321 | 357 | 416 | 57 | 31 | 5 | 3 |
Combined Processing Production Schedule | ||||||||||||||||
Ore Tonnes | 000's t | 275 | 453 | 493 | 516 | 503 | 485 | 472 | 495 | 496 | 800 | 800 | 800 | 800 | 800 | 279 |
Gold Grade g/t | g/t | 3.0 | 3.4 | 3.5 | 3.6 | 3.7 | 3.8 | 4.0 | 3.8 | 6.9 | 8.7 | 9.5 | 10.7 | 8.2 | 7.1 | 6.9 |
Silver Grade g/t | g/t | 13 | 16 | 18 | 13 | 13 | 14 | 13 | 9 | 33 | 18 | 17 | 18 | 15 | 18 | 19 |
Recovered Au oz | 000's oz | 25 | 47 | 52 | 57 | 57 | 57 | 56 | 56 | 101 | 204 | 223 | 253 | 188 | 165 | 57 |
Recovered Ag oz | 000's oz | 80 | 147 | 183 | 135 | 130 | 136 | 122 | 91 | 334 | 293 | 271 | 293 | 235 | 287 | 110 |
Document ID: STU-063-REP-002-0 Released: 11th December 2024Page 162 of 244
OceanaGold Corporation | ||
NI 43-101 Technical Report – Waihi District Pre-feasibility Study, New Zealand | ||
17RECOVERY METHODS
The metallurgical process at Waihi is proven technology and well suited to regional geo-metallurgy,
having been in continuous operation for 35 years. Metallurgical testwork on WNP orebodies supports
ongoing use of the existing flowsheet with plant expansions to enable higher throughput rates. These
expansions will be timed to align with the development of new orebodies. Open-pit and underground ores
will continue to be treated on a campaign basis to meet their respective grind size and recovery targets.
17.1Ore Processing
The existing process flowsheet consists of five stages: comminution, leaching/adsorption, elution, electro-
winning and smelting as shown in Figure 17-1. It has the capacity to treat either 1.25 Mt of open pit or
0.66 Mt of underground ore per annum.
Figure 17-1: Process Flow Sheet
17.1.1Comminution
The existing circuit is designed to treat open-pit ore at 150 tph to produce a target grind size (P80) of
75 µm or treat underground ore at 80 tph to produce a target grind size (P80) of 53 µm. Normally, the
SAG mil is set-up as a closed-circuit, but it can be operated in open circuit if required. The ball mill is
always operated in closed circuit.
Stockpiled ore is reclaimed by front end loader and fed onto a static grizzly with an aperture of 150 mm.
The final conveyor from the ore handling circuit transports the ore into the grinding circuit.
Prior to entry into the feed chute of the semi-autogenous (SAG) mill, the ore is further reduced in feed
size via a jaw crusher to a P80 of 110 – 130 mm. The SAG mill-ball size is 125 mm, and the mill will
operate typically with a 10 % ball load. The SAG mill draws between 2.1 and 2.5 MW of power.
Document ID: STU-063-REP-002-0 Released: 11th December 2024Page 163 of 244
OceanaGold Corporation | ||
NI 43-101 Technical Report – Waihi District Pre-feasibility Study, New Zealand | ||
The SAG mill discharge is sized using a trommel attached to the SAG. The +12 mm oversize material is
conveyed to a 30 kW cone crusher and is recycled back to the SAG mill. The undersize slurry from the
SAG trommel is pumped to two 500 mm diameter inclined Weir Warman Cavex cyclones. The cyclone
underflow reports to the SAG mill feed chute. The cyclone overflow gravitates to the ball mill discharge
hopper, whereby the slurry is pumped to a cyclone distributor, which consists of fourteen 250 mm
diameter Weir Warman Cavex cyclones. The cyclone underflow reports back to the ball mill for further
grinding and the cyclone overflow reports to the pre-leach thickener.
17.1.2Leaching and Adsorption
The pre-leach thickener increases slurry density from approximately 15 % solids to approximately 37 to
40 % solids prior to the leach/adsorption circuit, which comprises five leach and seven carbon in pulp
(CIP) adsorption tanks. The leaching tanks capacity are 700 m3 and the adsorption tanks have 300 m3,
providing a total residence leach/adsorption time of 24 hours for open-pit ore and 48 hours for
underground ore. Wedge wire cylindrical inter-stage screens with mechanical wipers are installed in each
adsorption tank. The inter-stage screens retain carbon in the tank but let the slurry pass through to the
next stage. A bleed stream is pumped from an adsorption tank to the previous tank in the circuit, the
carbon contained in the bleed stream is retained in the previous adsorption tank in the circuit, this
provides counter current flow whereby the slurry flows from adsorption tank 1 to 7 while the carbon flows
from adsorption tank 7 to 1. This allows for maximum carbon loading in adsorption tank 1 and maximum
scavenging of gold solution in adsorption tank 7. From adsorption tank 7 the slurry passes over a carbon
safety screen to collect any carbon that may have leaked from the adsorption circuit, the barren tailings
slurry is then pumped to the tailing’s storage facility.
Cyanide is delivered and mixed on-site, via a sparging system to a concentration of 21 % wt./vol. The
cyanide is dosed into the first leach tank and the concentration is maintained at 250-280 ppm. Oxygen is
added to the first leach tank by a shear reactor to enhance the leach kinetics and reduce cyanide
consumption.
17.1.3Elution, Electrowinning and Smelting
Loaded carbon from the adsorption circuit is fed into an elution column where the carbon is washed at
high temperature and pressure to remove the gold and silver from the carbon and into a pregnant eluate
using the AARL process. The pregnant eluant is then passed through electrowinning cells where gold and
silver are electroplated onto stainless steel cathodes. Following elution, the barren carbon is reactivated
and recycled to the adsorption tanks.
The cathodes are periodically harvested and rinsed to yield a gold and silver bearing sludge which is
dried, mixed with fluxes and put into a furnace at 1200 °C. Once the sludge is molten it is poured as bars
of doré ready for shipment to the Mint.
17.1.4Metallurgical Accounting
Metallurgical accounting at Waihi is primarily based on the tonnage of wet ore processed through the
comminution circuit, as totalized on a conveyor weightometer and gold receipts from the Mint. Wet tonnes
are converted to dry tonnes by using a moisture factor, the moisture factor is derived from samples taken
from the conveyor. Gold production is based on gold receipts from the Mint and the changes to the gold
stocks in circuit. Gold stock takes are taken monthly.
Document ID: STU-063-REP-002-0 Released: 11th December 2024Page 164 of 244
OceanaGold Corporation | ||
NI 43-101 Technical Report – Waihi District Pre-feasibility Study, New Zealand | ||
Samples are taken at strategic points in the processing stream to measure gold concentrations in those
streams to determine plant efficiencies on a day-to-day basis. All information is entered into a data base
which then performs the metallurgical accounting.
17.1.5Other
The Waihi processing plant has a SCADA control system. Equipment protection and control loops to
optimise the control of the major streams/processing parameters within each process circuit are actively
in use within the process plant.
17.1.6Process Plant Upgrade
The processing plant currently has the capacity to treat either 1.25 Mt of open pit or 0.66 Mt of
underground mill feed per annum at a feed rate of 150 tph and 80 tph respectively. To align with the
proposed mine schedule for the new WUG orebody, throughput capacity on underground ore will need to
increase to 0.8 Mt per annum or 100 tph.
Ausenco were engaged to design and cost the expansion option(s) to pre-feasibility study level accuracy.
OceanaGold provided the major inputs to the process design criteria and specified the major equipment
to be included in the study. Ausenco developed mass balances, process flow diagrams, mechanical
equipment lists, electrical load lists, material take-offs and plant layout designs showing new, relocated,
and upgraded equipment.
Key elements for the proposed plant upgrade include:
•Installation of the primary crusher salvaged from OceanaGold’s Reefton process plant
•Relocation of process water and elution water tanks that currently sit in the proposed crusher site
•Installation of 1.8 MW tower mill for secondary grinding (to replace existing conventional 1.2 MW
ball mill) and associated feed pumps and hopper
•New classification circuit to operate with the new tower mill, including cyclones, feed pump and
associated hopper
•Replacement of the 6 current adsorption tank interstage screens with larger capacity Derrick units
•Replacement of the 6 current adsorption circuit air lifts with centrifugal recessed impeller carbon
advance pumps
•Upgrade of the tailings pumping system to pump to the new TSF3
•Containerized MCC to provide power to the Primary Crusher Area
•Upgrades to the existing switchroom(s) to support the installation and the associated new
equipment
•HV/LV Switchroom and stepdown transformers
•A general layout of the proposed plant upgrade, and the crusher and tower mill installations are
shown in the figures below- Figure 17-2; Figure 17-3; Figure 17-4.
Document ID: STU-063-REP-002-0 Released: 11th December 2024Page 165 of 244
OceanaGold Corporation | ||
NI 43-101 Technical Report – Waihi District Pre-feasibility Study, New Zealand | ||
Figure 17-2: General Arrangement for Proposed Process Plant Upgrade
Figure 17-3: Proposed Reefton Crusher Installation
Document ID: STU-063-REP-002-0 Released: 11th December 2024Page 166 of 244
OceanaGold Corporation | ||
NI 43-101 Technical Report – Waihi District Pre-feasibility Study, New Zealand | ||
Figure 17-4: Proposed Tower Mill Installation
17.2Operational Results
Mill production tonnes processed by source and plant recovery for the 2009 -2023 years are shown in
Figure 17-5. Mill throughput has been mine constrained since 2015 with all ore being sourced from a
single underground mine. Reduced recoveries in 2018 and 2019 are a product of high arsenic levels in
the lower levels of the Correnso mine and in line with budget recovery models incorporating gold and
arsenic head grades.
Document ID: STU-063-REP-002-0 Released: 11th December 2024Page 167 of 244
OceanaGold Corporation | ||
NI 43-101 Technical Report – Waihi District Pre-feasibility Study, New Zealand | ||
Source: Newmont and OceanaGold Monthly Reports
Figure 17-5: Underground Mill Feed Tonnes and Recovery 2009-2023
17.3Process Unit Costs
Process unit costs are dependent to a large degree on ore availability with initiatives implemented since
2015 to reduce costs in the mill given the limited supply of ore. Processing costs have ranged from NZ$34
– 50 /tonne milled (CPI adjusted) when more than 40,000 tonnes per month of ore was available. The unit
cost history for the Waihi mill is shown in Figure 17-6 below.
Source: Newmont and OceanaGold Monthly Reports
Figure 17-6: Actual Process Unit Costs 2009-2023
Document ID: STU-063-REP-002-0 Released: 11th December 2024Page 168 of 244
OceanaGold Corporation | ||
NI 43-101 Technical Report – Waihi District Pre-feasibility Study, New Zealand | ||
17.4Water Treatment Plant
As the Waihi processing plant operates with a positive water balance, a water treatment plant (WTP) and
a reverse osmosis (RO) plant treat various water sources before discharging into the local Ohinemuri
River. The WTP flowsheet is illustrated in Figure 17-7.
Figure 17-7: Water Treatment Plant Flowsheet
The WTP has been in operation since 1988 and has been subject to upgrades in 1999 and 2011. A
reverse osmosis plant was built and commissioned in 2008 to provide an additional treatment option for
metals removal but has not been used since 2012. The WTP has performed consistently well with no
recorded non compliances with consent conditions.
The WTP incorporates four parallel streams with three of these dedicated to soluble metals removal only.
The fourth stream has two phases of treatment; oxidation of cyanide to destroy the cyanide complexes
followed by metals precipitation and removal.
Lime and ferric chloride are added to all four water streams to facilitate metals precipitation and removal.
Metals tend to occur in a soluble form when the pH of water is low and raising the pH with lime in the
presence of ferric chloride creates insoluble hydroxides and carbonates to form. Following mixing and
retention a polyelectrolyte (flocculant) is added along with more lime to form flocs that can be settled out.
Cyanide oxidation is achieved using a combination of hydrogen peroxide, copper sulphate and lime. A
series of tanks are used for reagent mixing followed by retention to provide time for chemical reaction.
Hydrogen peroxide in the presence of copper destroys all free cyanide through chemical oxidation. Weak
Document ID: STU-063-REP-002-0 Released: 11th December 2024Page 169 of 244
OceanaGold Corporation | ||
NI 43-101 Technical Report – Waihi District Pre-feasibility Study, New Zealand | ||
acid dissociable (WAD) cyanide is also oxidized during the process. On oxidation, cyanide yields simple
carbon and nitrogen compounds.
Clarifiers at the end of the treatment process allow the suspended solids and metals to be removed from
the water. The suspended solids and metals fall to the bottom of the clarifiers forming a slurry. The slurry
is pumped to the tailings pond via a thickener. Carbon dioxide is added to the clean water overflow from
the clarifier to reduce the pH of the water to meet the compliance limits.
There are two polishing ponds that hold the treated water for approximately 16 hours prior to discharge to
the river. This provides time for the treated water to be tested, and the results to be received and
interpreted prior to the water discharging to the Ohinemuri River.
Water that meets the discharge criteria is discharged to the Ohinemuri River. If the water does not meet
the discharge criteria, it is recycled back through the plant, used in processing, or pumped to the tailings
storage facility.
There are five operating regimes, and each provides for a different combination of water requiring cyanide
destruction versus metals removal only. These operating regimes recognise that the proportion of water
being treated for cyanide destruction impacts the treated water quality.
17.4.1Water Treatment Plant Upgrade
GHD were engaged to design and cost an upgrade of the water treatment plant (WTP) to meet the
predicted demands of the WNP.
The design capacity of the expanded WTP is double that of the existing infrastructure – 1,800 m3/hr for
metals removal and 500 m3/hr for cyanide destruction and metals removal. This aligns with expected
dewatering flows and the newly consented discharge regime (Regime E).
Datasets of WTP influent and treated waters formed the basis of design. Influent analysis was used to
calculate predicted loads to the upgraded plant and the Resource Consent (AUTH971318.01.13) was
used as the basis for treatment targets.
The upgrade study identified the preferred treatment options as follows:
•Metals Removal: Two additional streams, replicating the current metals precipitation treatment
method
•Cyanide Destruction: One additional stream, replicating the current hydrogen peroxide oxidation
process.
These treatment options were progressed to further engineering design and costing.
•Metals Streams Upgrade: Involves adding two additional parallel metals treatment streams, as
per the current method of treatment. A new blend tank would be added to maintain the residence
of upfront mixing of incoming water. The two new streams would both have:
-mixing tanks with agitators for dosing of ferric chloride, calcium hydroxide and polyelectrolyte
-clarifiers with motorized rake and platforms, each equipped with duty-standby underflow
pumps
-a thickener to receive pumped clarifier underflow, each sized to accommodate clarifier
underflow from the new cyanide stream and each with duty-standby underflow pumps
Document ID: STU-063-REP-002-0 Released: 11th December 2024Page 170 of 244
OceanaGold Corporation | ||
NI 43-101 Technical Report – Waihi District Pre-feasibility Study, New Zealand | ||
-in-pipe CO2 dosing of effluent on passage to the polishing ponds.
•Cyanide Stream Upgrade: This upgrade involves the addition of a 250m3/h treatment stream,
mimicking the current stream, thus including:
-mixing tanks with agitators for the mixing of ferric chloride and calcium hydroxide
-chemical oxidation tanks (5 of) with introduction of hydrogen peroxide and copper sulphate in
the first tank
-final mixing tank to add polyelectrolyte
-a clarifier with motorized rake and platforms, each equipped with duty-standby underflow
pumps
-in-pipe CO2 dosing of effluent, on passage to the polishing ponds.
•Preliminary assessment of required footprint indicates that all options can fit within the designated
expansion area
•Assessment of all dosing chemical storage capacity versus proposed upgrades was carried out,
indicating that lime storage would need to be doubled. No other current chemical storage tanks
require upgrade based on projected use
•The river discharge infrastructure also needs upsizing to accommodate the higher outflow rates.
This will duplicate the existing discharge pumping and pipework system.
A general arrangement of the proposed water treatment plant upgrade is illustrated in Figure 17-8.
Document ID: STU-063-REP-002-0 Released: 11th December 2024Page 171 of 244
OceanaGold Corporation | ||
NI 43-101 Technical Report – Waihi District Pre-feasibility Study, New Zealand | ||
Figure 17-8: General Arrangement of Water Treatment Plant Upgrade
Document ID: STU-063-REP-002-0 Released: 11th December 2024Page 172 of 244
OceanaGold Corporation | ||
NI 43-101 Technical Report – Waihi District Pre-feasibility Study, New Zealand | ||
18PROJECT INFRASTRUCTURE
18.1Existing Mine Site Surface Infrastructure
MUG is an active mine with much of the infrastructure required for its ongoing operation already in place.
New facilities will be required at the Willows portal for WUG. The location of the existing infrastructure is
shown in Figure 18-1.
Figure 18-1: Waihi Existing Infrastructure
Existing facilities comprise:
•Two separate tailings storage facilities (TSF1A and TSF2)
•Numerous silt and collection ponds
•Stockpile facilities
•Mine access roads
•Water treatment facilities
•Underground administration, workshop, and change house
•MOP surface conveying and loadout facilities
•Surface explosives magazines
•Process plant
•Cement batch plant adjacent to the existing polishing pond stockpile.
5 Note that TSF 2 currently discharges directly to the Ohinemuri River and its tributaries via a pump pontoon system
without water treatment. Water quality meets conditions and has been satisfactory since 2007. Some collection ponds
are permitted to directly overflow into the Ohinemuri River subject to water quality being met.
Document ID: STU-063-REP-002-0 Released: 11th December 2024Page 173 of 244
OceanaGold Corporation | ||
NI 43-101 Technical Report – Waihi District Pre-feasibility Study, New Zealand | ||
18.2Tailings Storage Facility
18.2.1Existing Tailings Storage Facilities
Waihi has two tailings storage facilities (TSFs) known as TSF2 and TSF1A. Both are located southeast of
the process plant and MOP as shown in Figure 18-1. The TSF’s are formed by downstream constructed
embankments that abut elevated ground to the east of TSF2 and north of TSF1A. TSF 2 ceased
operation in 2001, and TSF1A is the current active TSF. TSF2 has a planned finished crest elevation of
159.5 mRL and the planned finished crest of 182 mRL for TSF1A. The embankments have both been
constructed from overburden material obtained from mining MOP. TSF2 was constructed first and
provided tailings storage from 1989 to 2000. TSF1A has since provided tailings storage to date. TSF1A
and TSF2 were originally permitted under a former mining licence and now operate under the provisions
of the RMA, TSF1A has a Building Consent allowing it to be constructed to 182 mRL, while TSF2 has a
Building Consent allowing it to be raised to 160.7 mRL (approved internally by OceanaGold to 159 mRL).
The TSFs are designed as a zero-discharge facility during its use5. In addition to the anticipated tailings
storage and operating pool requirements, the facility is designed to always contain the probable maximum
precipitation storm event and still maintain an additional one metre of freeboard.
18.2.2Planned Tailings Storage Facility 3 (TSF3)
TSF3 provides 6.3 Mm3 of tailings storage capacity for WUG (Table 18-1). TSF3 will be constructed in
accordance with the recommendations and guidelines of the New Zealand Society on Large Dams
(NZSOLD) ‘New Zealand Dam Safety Guidelines’ (NZDSG) along with the International Commission on
Large Dams (ICOLD) and the Global Industry Standard on Tailings Management (GISTM) standard and
guideline. TSF3 is designed and when operated will be classed as a High Potential Impact Classification
(PIC) dam.
The TSF3 design considers:
•Downstream construction techniques
•Availability of different rock types to meet construction, stability and closure requirements
•Compliance with the Building Act, NZSOLD Dam Safety Guidelines, ICOLD and GISTM
•Geotechnical conditions
•The need to restrict seepage from the tailings
•Surface water diversion works to divert clean run-off to collection ponds.
The footprint of the TSF3 will require approximately 60 Ha of topsoil and subsoil to be progressively
stripped. Areas of compressible soils will be removed from the footprint of both the TSF3 impoundment
area and the embankment footprint. This material will be replaced with suitable structural fill material
sourced locally. A water collection pond is to be constructed in the lowest area of the site and lined with a
geomembrane over its full height with an overflow spillway into the Ruahorehore Stream.
Document ID: STU-063-REP-002-0 Released: 11th December 2024Page 174 of 244
OceanaGold Corporation | ||
NI 43-101 Technical Report – Waihi District Pre-feasibility Study, New Zealand | ||
TSF3 will also include an uphill diversion drain to divert clean run-off from higher ground, perimeter drains
collect surface water run-off from the embankment and to direct it to a collection pond, and a perimeter
road to provide access for operation and maintenance. Run-off collected in the collection pond will be
pumped to the existing WTP. The clean water diversion/ stream diversion drains, and the collection pond /
silt pond are shown in Figure 18-2.
The embankment would be raised in two stages to provide the required storage. The proposed
construction would commence with a starter embankment raised to 135 mRL. Followed by a single lift to
142 mRL. All construction material will be sourced locally from existing stockpiles, within the
impoundment and embankment footprint and excavation of the three borrow areas within the Waihi site
boundary.
Figure 18-2: Plan View of TSF3 to 142 mRL
For the prefeasibility study an insitu tailings dry density of 1.15 t/m3 is estimated.
Table 18-1: Tailings Storage Plan
Area | Tailings Storage | Embankment Fill required | ||||
Storage Mm3 | Cumulative storage Mm3 | Cumulative storage Mt | Fill required Mm3 | Cumulative fill Mm3 | Cumulative fill Mt | |
TSF1A (182mRL) | 2.36 | 2.36 | 2.71 | 0.98 | 0.98 | 1.96 |
TSF2 (159.5mRL) | 1.58 | 3.94 | 4.53 | 0.46 | 1.44 | 2.88 |
TSF3 (142mRL) | 3.12 | 7.06 | 8.12 | 3.31 | 4.75 | 9.5 |
Document ID: STU-063-REP-002-0 Released: 11th December 2024Page 175 of 244
OceanaGold Corporation | ||
NI 43-101 Technical Report – Waihi District Pre-feasibility Study, New Zealand | ||
Construction of the tailings facilities has been scheduled to ensure the TSF’s meet the minimum
freeboard conditions and provides adequate tailings capacity throughout the LoM Figure 18-3 below.
Figure 18-3: Tailings Storage and TSF Construction Chart
The deposition of tailings into the TSF will be via high-density polyethylene tailings pipeline located
around the perimeter of embankment crest. Deposition will occur from multiple spigots inserted along the
tailing’s distribution line. The deposition locations will be moved progressively along the distribution line,
as required, to maintain a beach with a slightly graded deposition of tailings towards the decant pond that
is located in the southeast corner of the facility. Water from the decant pond will be recycled back to the
mill for makeup water and will be reclaimed by utilising either vertical turbine pumps mounted on a floating
barge above the decant pond or skid mounted pumps to be located on the ramp within the southern end
of the decant pond.
18.3Waste Rock Storage and Usage
18.3.1MUG
Waste rock is required to backfill MUG and selected historical workings. Waste rock sufficient for the
remaining raises on the TSF1A and 2 is located close to the TSF’s in the northern, central and eastern
stockpile areas.
All waste rock produced from the underground mine is classified as potentially acid forming and is
returned to the underground as stope backfill.
Some stockpiling of waste rock from the underground will be required to enable waste production to be
scheduled in accordance with backfill requirements. The stockpile area is already established near the
Favona portal and will be used for the temporary storage of waste rock. A surge stockpile is available at
the polishing pond stockpile up to 1 Mt capacity.
Document ID: STU-063-REP-002-0 Released: 11th December 2024Page 176 of 244
OceanaGold Corporation | ||
NI 43-101 Technical Report – Waihi District Pre-feasibility Study, New Zealand | ||
There is a 1.5 Mt deficit of waste rock for backfilling the MUG voids and 1.7 Mt deficit of waste rock for
closure. The additional waste rock is planned to be sourced from the existing polishing pond stockpile and
from waste sourced from within the existing MOP.
18.3.2WUG
Approximately 3.2 Mt of waste rock will be generated during the development of the WUG tunnels and
shafts network. 0.8 Mt is hauled internally to provide backfill during production leaving 2.4 Mt that will
require to be hauled by truck for temporary storage at either the Waste Rock Stack (WRS), located at the
Willows or at the polishing pond stockpile near the Processing Plant to Willows access tunnel. Following a
multiple technical discipline assessment, a design for the WRS with a capacity of approximately 1.6 Mt
was selected for WUG and the design further developed. The WRS is situated in a valley formed by an
unnamed northeast flowing tributary of Mataura Stream.
The WRS is situated in a relatively steep gully to the north of the surface facilities area (SFA) and
although feasible to build a facility in this location there will be challenges due to the steep slopes.
Bottom-up construction techniques will be used to place material in compacted layers allowing for
stripping of topsoil and weaker materials within the footprint, and establishment of drainage control from a
flat bench surface as each layer is placed.
Based on the test pit data, topsoil depth varies but averages a depth of 0.3 m. On the northern side of the
WRS, where the natural slope angle is unfavourable to stability, weak materials will require removal to an
estimated depth of 1.0 m prior to fill material placement.
The development plan is to access and place the first WRS layers from the lower access road, formed
along the existing farm track, using smaller 30 tonne class trucks until enough bench width is developed.
The track requires upgrading during the initial development phase to a width of 5.5 m, including a lined
side drainage channel and engineered bunded edge. Once material is placed up to approximately the
205 mRL, the remaining lifts are placed from the main portal access ramp. A dual lane haul road, formed
in the WRS to access upper benches, is advanced with each rock layer placed up to the final planned
bench height at 265 mRL.
Tunnel development waste is placed in the WRS over the first five years and then reclaimed as backfill
material for the underground is planned to start in approximately year 10 with complete removal of the
WRS by year 13.
WRS water management elements include a network of diversion and stormwater collection drains,
culverts, and collection ponds. Drainage elements are incorporated within the WRS design to direct
contaminated water runoff and seepage flows for ultimate pumped transfer to the Waihi water treatment
plant. Willows also includes a diversion and stormwater drainage around other surface facilities and
sewerage disposal facilities.
Document ID: STU-063-REP-002-0 Released: 11th December 2024Page 177 of 244
OceanaGold Corporation | ||
NI 43-101 Technical Report – Waihi District Pre-feasibility Study, New Zealand | ||
18.4Site Wide Water Management
A schematic of the site wide water management system is shown in Figure 18-4.
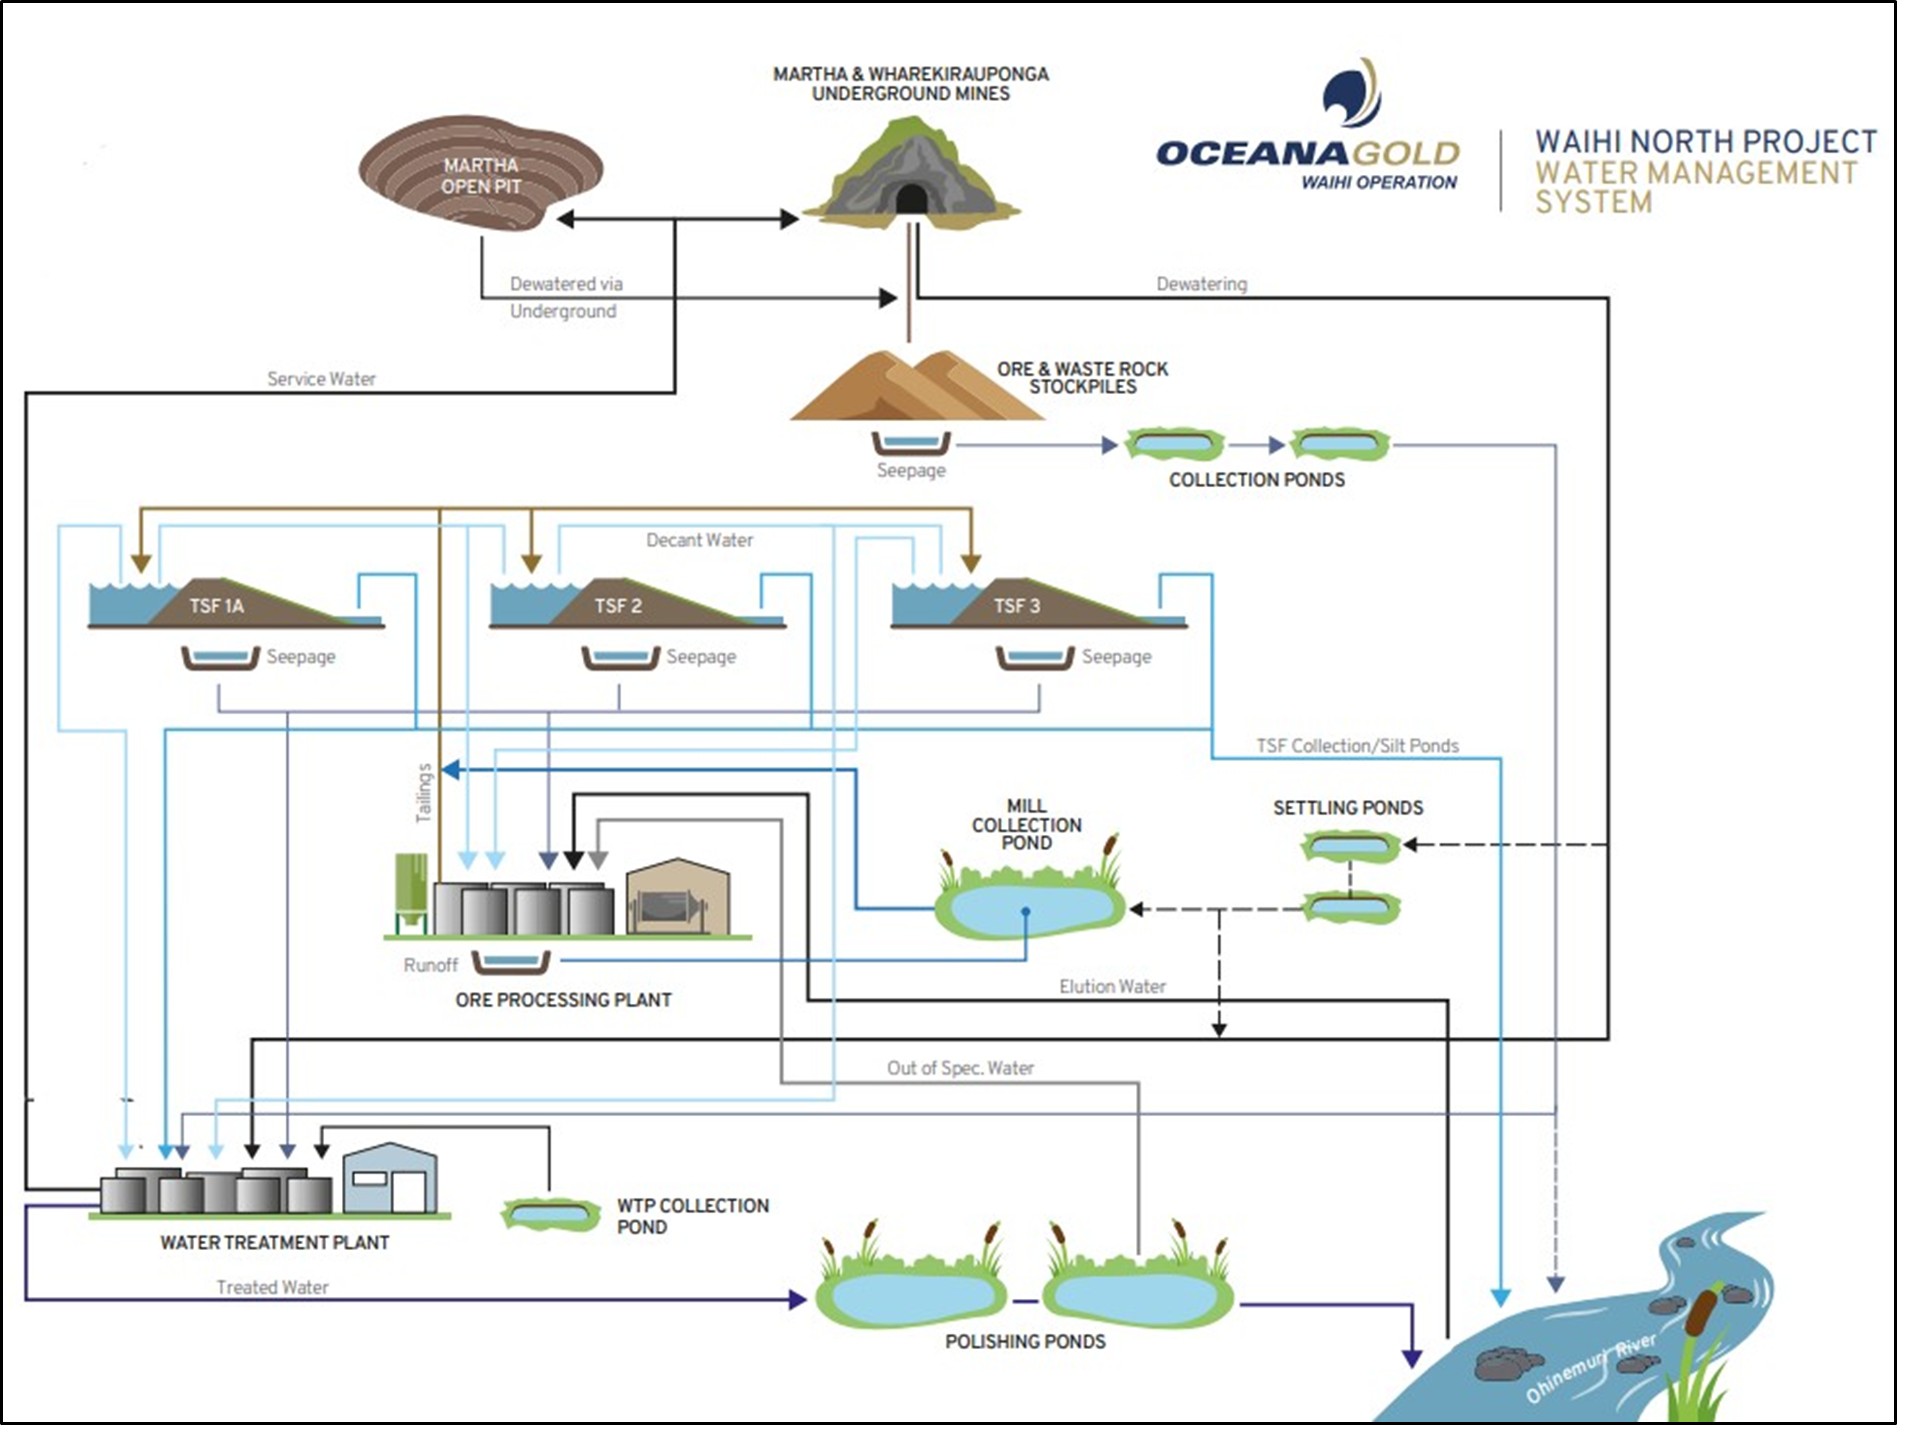
Figure 18-4: Site Wide Water Management
Waihi requires approximately 1.75 ML of water to process a nominal 1 MT of ore annually. Most of this
water is sourced from water contained within TSF1A.
The high rainfall in the area means there is a net surplus of water on site, with water from mine
dewatering, the tailings impoundments, and collection ponds being directed to a water treatment plant
(WTP) prior to discharge to the Ohinemuri River. TSF2 is a retired tailings impoundment and the decant
water overflows directly to the Ohinemuri River. The volume of water treated in 2023 was 6.6 Mm3 and
water discharged from site was 5.6 Mm3.
The current water management system is designed to capture and treat all water impacted by mining
activity; and divert clean water where practicable. While some water is re-used as process water there is
always a net gain of water on-site due to the high rainfall experienced in Waihi. The basic rules applied to
site water management that have been effective in 35 years of operation to date include:
•natural water is diverted away from areas disturbed by mining activities wherever practicable in
order to reduce the volumes of water affected by the mining activities
•all water from areas disturbed by mining activities is directed to appropriate collection and
treatment facilities prior to discharge off-site
Document ID: STU-063-REP-002-0 Released: 11th December 2024Page 178 of 244
OceanaGold Corporation | ||
NI 43-101 Technical Report – Waihi District Pre-feasibility Study, New Zealand | ||
•where practicable, OceanaGold endeavours to reduce the volumes of water requiring treatment.
An extensive program of water quality monitoring is key to checking what water sources do
require treatment
•disturbed areas are progressively rehabilitated at the earliest practicable time to minimise silt
losses and improve runoff water quality.
The volume of water that can be discharged from the WTP on any given day is limited to an allowable
discharge, which forms part of a suite of resource consents and is related to both the flow in the river and
the treatment regime in operation.
The site WTP operators manage the system such that sufficient freeboard is maintained in collection
ponds and the active TSF to provide buffer storage over periods where the allowable discharge is less
than the volume of water requiring treatment.
18.5Site Wide Water Balance
Hydrology data for the WNP was uploaded to the site water balance model (WBM) to (i) assess how
water volumes change over the life of the mine; and (ii) check that proposed infrastructure for
conveyance, storage and treatment will be adequate. This was carried out using the GoldSim software
package which is designed to run Monte Carlo simulations for probabilistic analysis of dynamic systems.
The WBM has been in use since 2012 and as a result there is confidence it represents the quantities of
water generated from the different water sources that require treatment for both current and future
operations. Additional inputs into the model are considered conservative and therefore the predictions
outlined (in terms of both water volume and quality) are considered a conservative estimate based on the
WNP projections.
The water balance model, encompassing the Waihi operations and proposed WUG Project have includes
the following assumptions and considerations:
•Mine dewatering rates are a critical driver of the site water balance
•TSF deposition schedule is also important, with optimal scheduling reducing the need to
treat water from multiple TSFs at any one time
•The existing WTP has insufficient capacity when Waihi North comes on-stream, with a
need to double capacity when dewatering of WUG commences
•Under the current consent conditions (Regime E), there is a risk of insufficient discharge
capacity during summer months, but excess flows can be temporarily stored underground
or on the TSF(s)
•Water balance modelling also included a review of the impact of climate change. This is
currently considered as a minor risk given the dominant impact of mine dewatering on the
site water balance, including the likely recharge.
Based on the water balance analysis completed, it is predicted that the WNP can be implemented using
the existing and upgraded WTP functionality and within the current consented discharge and receiving
environment conditions subject to renewal of those consents for an appropriate term. The capacity of the
Document ID: STU-063-REP-002-0 Released: 11th December 2024Page 179 of 244
OceanaGold Corporation | ||
NI 43-101 Technical Report – Waihi District Pre-feasibility Study, New Zealand | ||
current WTP facilities will require upgrading throughout the WNP’s lifetime to cope with the expected
volume of water requiring treatment.
A contaminant mass balance has been conducted in parallel with the WBM. The purpose of this analysis
is to identify where variations in volume and composition of waters received by the WTP could result in
discharge consent breaches. Water quality predictions for the LoM are compliant with discharge and
receiving environment consent conditions. The utilisation of the reverse osmosis (RO) plant to further
reduce concentrations of elevated trace elements is a contingency that could be utilized if predicted
discharge concentrations are higher than that predicted.
In summary, the results presented are considered conservative and the modelling undertaken supports
the viability of the WNP in terms of both water balance and water quality.
18.6Water Supply
Process water is sourced from the TSF, via a pump on a pontoon collecting decant water, which is
conveyed to the mill via a pipeline. Water to supply the buildings, as well as for the fire suppression
distribution system will be provided by the town water supply.
Mine water is supplied from the WTP. Used water and sewage are handled by a septic tank system.
18.7Power and Electrical
The current Waihi operations site power is supplied from the Waihi town substation via dual 11 kV
powerlines that feed into the main site 11 kV switchroom/switchgear. Normally the maximum site load is
limited to 11.2 MW but during public holidays the site is restricted to 6.2 MW during the morning and
afternoon peak periods and the process plant is usually shutdown during these times. The current load for
surface and underground is between 9.1 MW and 10.6 MW but the process plant is not fully loaded due to
low feed tonnages from the underground. Project power demands average and peak are shown below in
Table 18-2.
Table 18-2: Waihi Power Demands
Activity | Peak Power (MW) | Average Power (MW) |
Ball and SAG mill | 3 | 2.7 |
Other processing and water treatment | 0.9 | 0.9 |
MUG | 7.3 | 7.0 |
OP crushing and conveying (not currently in operation) | 2.5 | 2.5 |
Total Power Draw | 14.1 | 13.1 |
The power capacity required for the WNP, which includes future upgrades could range between 19.2 MW
and 22 MW. To cater for the additional power capacity, a new 33 kV powerline (buried cables) is planned
to be installed from the Transpower Waikino grid exit point (GXP) in Hauraki District Council (HDC) Road
Reserve to a new 33 kV/11 kV substation at the Baxter Road Waihi operations (~12 km).
Document ID: STU-063-REP-002-0 Released: 11th December 2024Page 180 of 244
OceanaGold Corporation | ||
NI 43-101 Technical Report – Waihi District Pre-feasibility Study, New Zealand | ||
The powerline will be installed and owned by PowerCo but fully funded by OceanaGold. The 33 kV power
supply will be brought to the Willows via an underground cable located in the services trench, teeing off
the new 33 kV / 11 kV substation. On site at Willows, another 33 kV / 11 kV substation will be established
to provide 11 kV distribution to the surface workshop, office/change house, the site lighting network and
other infrastructure requiring power. An 11 kV supply will also be installed to the underground where
11 kV / 1 kV skid substations will be provided to supply power to fixed and mobile equipment. The
substation is incorporated within a preliminary design and located in the southeast corner of the surface
facilities area (SFA).
18.8Willows Facilities (for WUG)
The Willows, adjacent to the Coromandel Forest Park was purchased by OceanaGold in 2021, following
approval from the Government’s Overseas Investment Office. This area will form the initial access to
WUG and servicing the development of the mine. The PFS level design is shown in Figure 18-5. The area
will require the following infrastructure in close proximity to the Willows portal:
•Waste rock stack to accommodate development waste rock, all of which will be returned
underground as backfill
•Mobile maintenance workshop
•Explosives storage magazine
•Water and containment ponds and associated pumping stations
•Small general warehouse
•Services trench to process plant for water treatment, potable water, initial mine water and
electrical supply
•Sealed road from the Willows Road to the mine plant area to minimise dust nuisance
•An upgrade of the existing SH 25 and Willows Road intersection
•Noise bunding
•Electricity supply and sub stations
•Mine offices, crib room and ablution facilities
•Car parking
•Access road to portal
•Portal façade excavation.
Document ID: STU-063-REP-002-0 Released: 11th December 2024Page 181 of 244
OceanaGold Corporation | ||
NI 43-101 Technical Report – Waihi District Pre-feasibility Study, New Zealand | ||
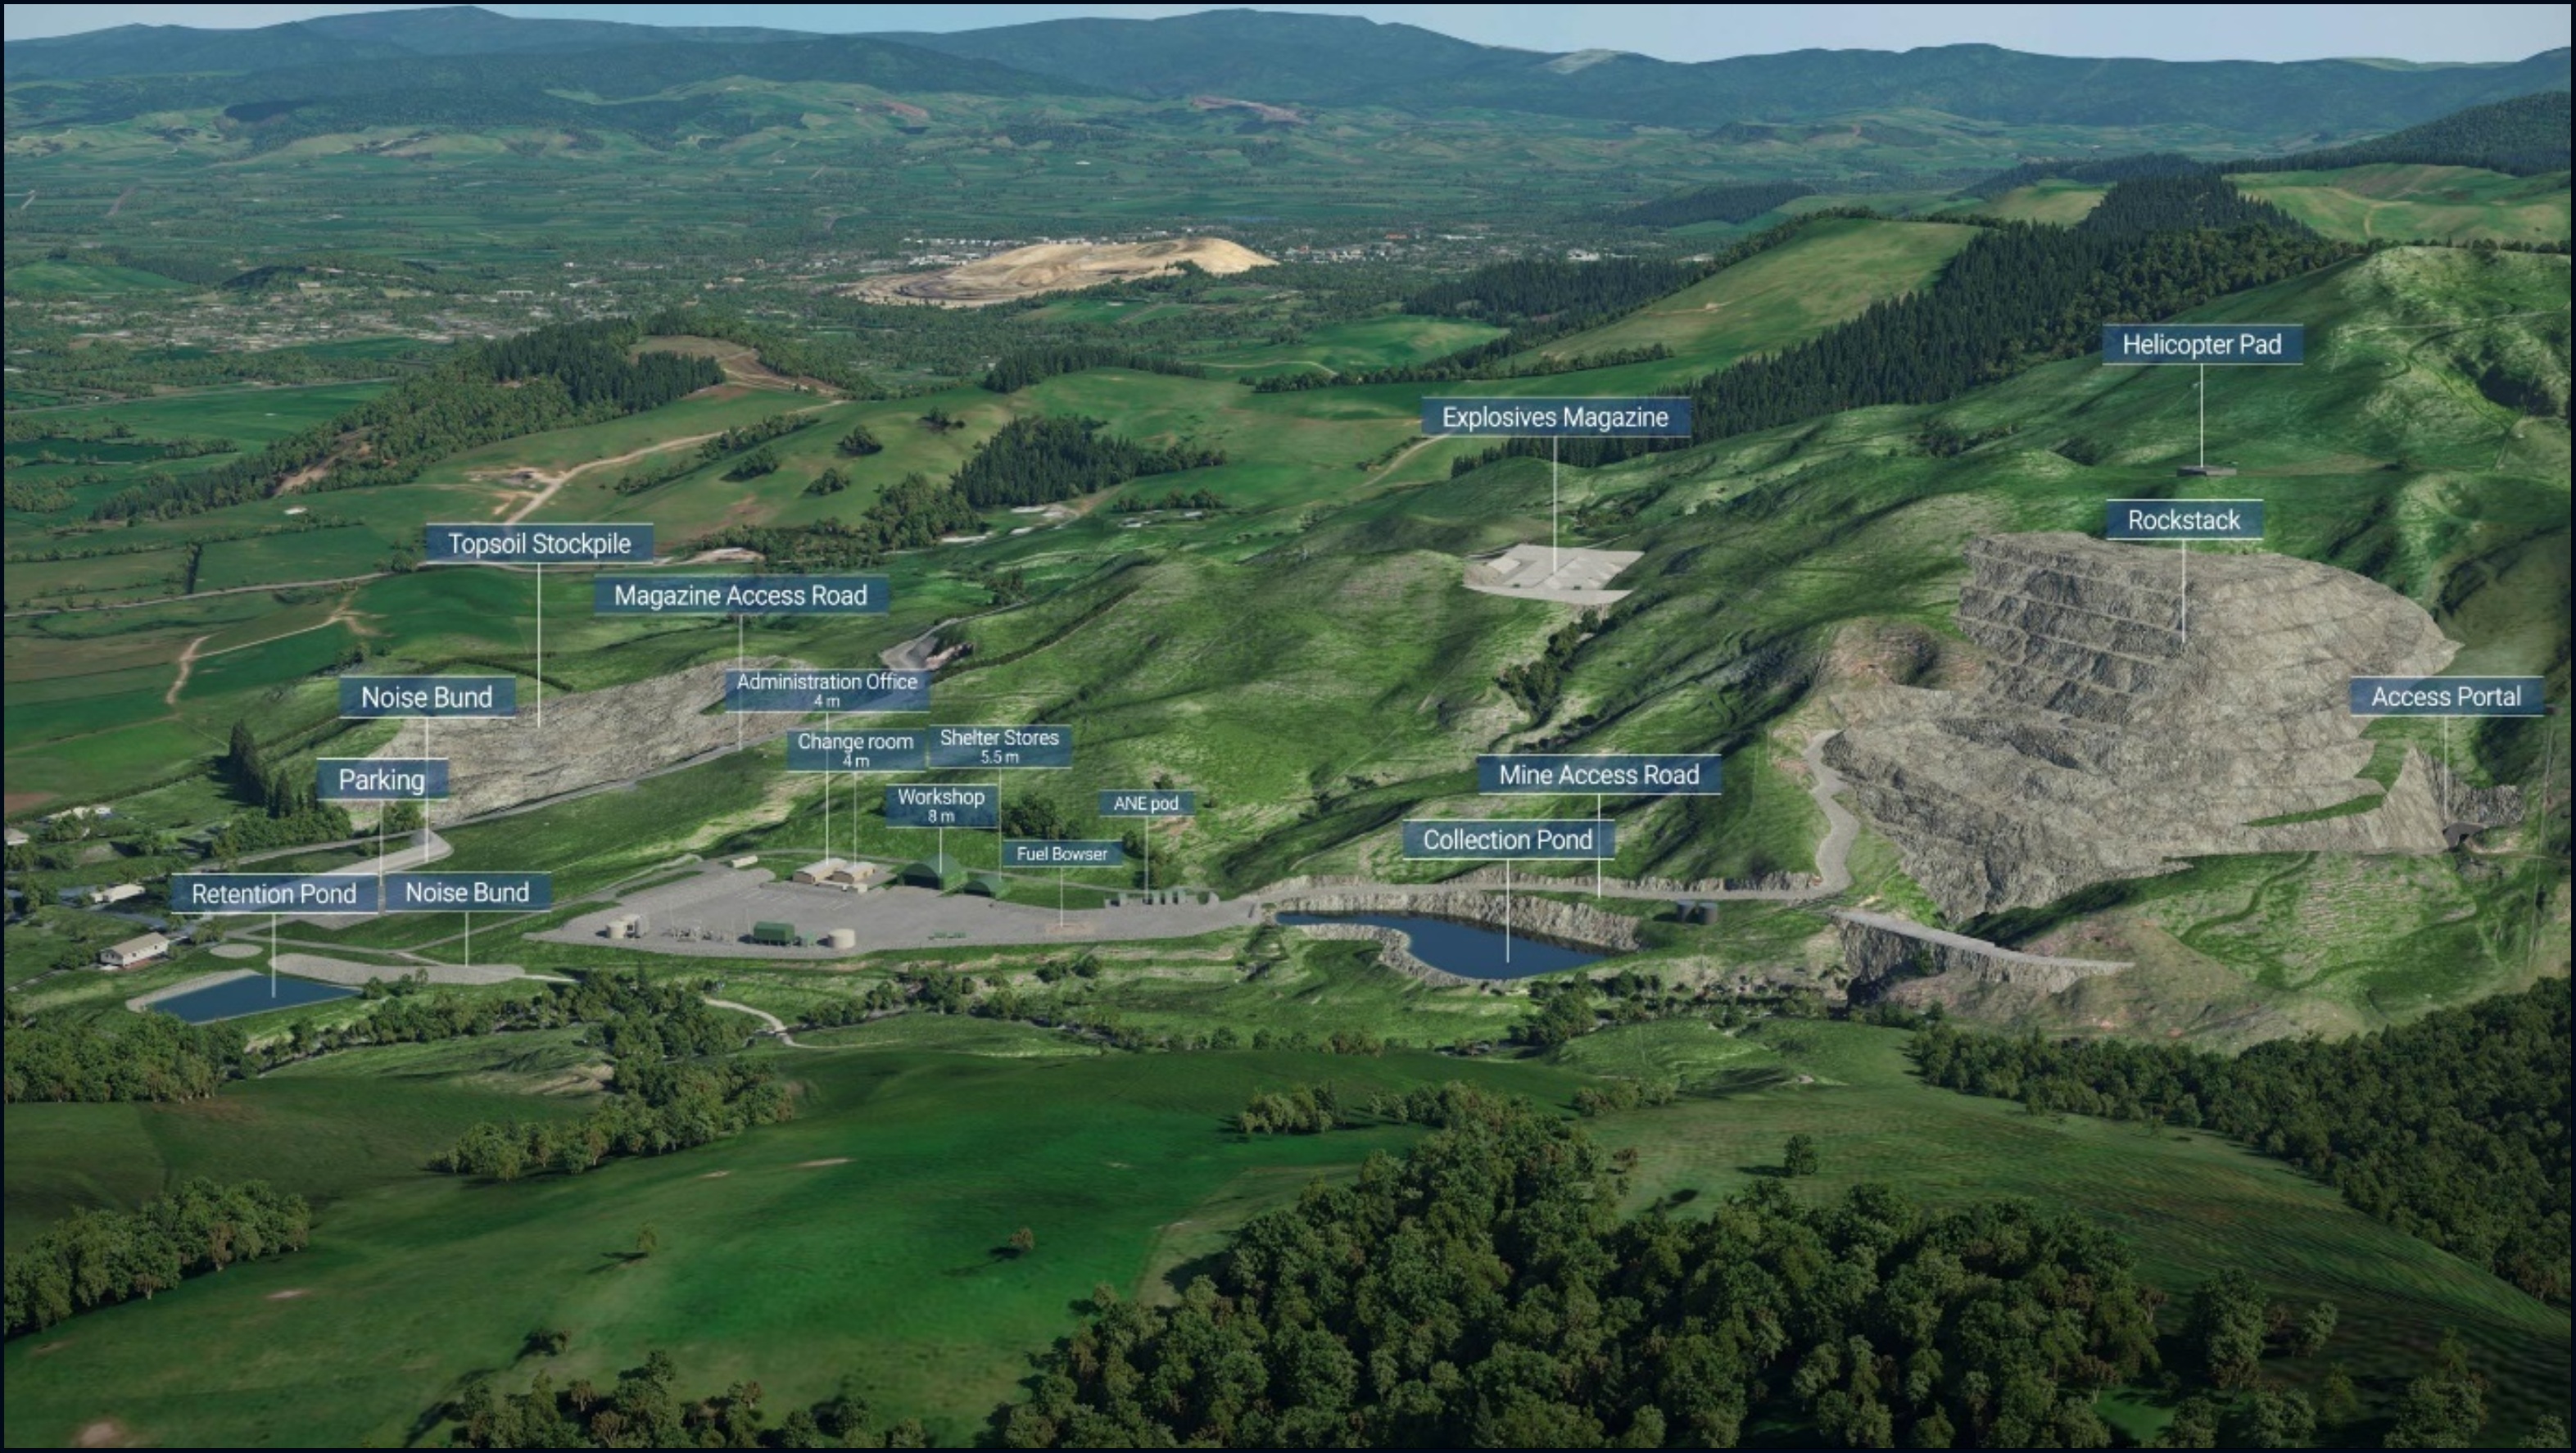
Figure 18-5: Willows Infrastructure and Buildings
The SFA comprises a 2 Ha earthworks formation that facilitates the location of mine support
infrastructure. The SFA is located 0.3 km east of the WUG mine portal and 4 km north northeast of the
township of Waihi.
Ground water and surface runoff will be pumped from Willows to the existing Waihi water treatment plant
by 450 mm nominal diameter pipe located within the service trench. Sizing to be confirmed during the
detailed design phase.
Potable water will be pumped within the service trench to the SFA from the existing Waihi operations.
Water will be delivered to tanks which will provide up to 24 hours potable water storage capacity for the
site.
A membrane bioreactor package treatment plant with disinfection will be provided to treat effluent from
SFA facilities. A storage tank will be required upstream and downstream of the sewage treatment plant.
Treated water will be discharged via a disposal field located within the Willows area.
Fuel is supplied directly to the mine, by local venders who contract supply from Tauranga, 60 km south of
Waihi.
Document ID: STU-063-REP-002-0 Released: 11th December 2024Page 182 of 244
OceanaGold Corporation | ||
NI 43-101 Technical Report – Waihi District Pre-feasibility Study, New Zealand | ||
19MARKET STUDIES AND CONTRACTS
19.1General
Waihi Gold Mine has been in commercial operation since 1988 and has contracts and purchase
arrangements in place for doré refining and other goods and services required for the operation. The
market for gold doré is well established. Market predictions and discussions on gold price are beyond the
scope of this document although sensitivities around gold price have been produced in the financial
analysis section.
19.2Bullion Production and Sales
Gold dore is produced and sold to a single refinery under a contract. Dore is stored on site and transport
is arranged with the refinery as required in accordance with company and refinery procedures. The
refining contract specifies limits for deleterious elements, material supplied exceeding those limits can be
refused however this has not occurred to date.
A contract is in place ABC Refinery in Sydney, New South Wales through until Q1 2025. Refining costs
are not material, with refined gold sold on arms-length terms at market prices prevailing at the time of
sale. Waihi currently has no forward sales, gold loans, offtake or similar type hedging or derivative
agreements in place.
19.3Contracts and Forward Sales Contracts
OceanaGold has agreements at typical industry benchmark terms for metal payables and refining
charges for doré produced from the Waihi operations. Gold and silver bearing doré is shipped to an
Australian refinery for further processing under a toll refining agreement.
Contracts are in place covering underground mining, transportation and refining of bullion, and the
purchase and delivery of fuel, electricity supply, explosives, and other commodities. These agreements
conform to industry norms.
Waihi currently has no forward sales, hedge, gold loans, offtake, or similar type agreements.
Document ID: STU-063-REP-002-0 Released: 11th December 2024Page 183 of 244
OceanaGold Corporation | ||
NI 43-101 Technical Report – Waihi District Pre-feasibility Study, New Zealand | ||
20ENVIRONMENTAL STUDIES, PERMITTING, AND SOCIAL
ORCOMMUNITY IMPACT
20.1Mineral Rights and land access
All naturally occurring gold and silver minerals in New Zealand are owned by the Crown. Rights to
prospect, explore or mine for these minerals are granted by permits issued under the CMA. Exploration
permits provide a permit holder the exclusive rights to explore for the specified minerals in an area.
Mining permits grant the holder exclusive rights to mine for the specified minerals.
Martha Underground (MUG), Martha Open Pit Phase 4 (MOP4), Gladstone Open Pit (GOP), the
processing plant, existing tailings facilities and associated infrastructure are located in and around the
township of Waihi, within the existing MP 41808 and, with very limited exceptions, on land which
OceanaGold owns or over which OceanaGold holds the land access rights it requires for the WNP.
The Wharekirauponga Underground Mine (WUG) is located approximately 10 km to the north of Waihi
and is held under the Wharekirauponga Mining Permit 60541 (MP 60541). The mine, decline corridor,
surface boxcut portal at Willows and associated tunnel and infrastructure connecting WUG to the
processing plant are located on land owned variously by the Crown and administered by DOC as a
conservation/forest park or as marginal strip, land (including “paper” road) owned by HDC, and land
owned by OceanaGold.
Approvals are in place, or approvals processes are underway or planned to secure land access rights
over DOC and HDC land, to provide for surface exploration, environmental management and monitoring
activities, ventilation rise structures and parts of the Services Trench connecting the Willows surface
facilities area to the existing Waihi operations.
An access arrangement between DOC and OceanaGold has been granted to allow for exploration
activities (including surface drilling) to take place within MP 60541 (Wharekirauponga). An area of council-
owned unformed road reserve, also located within the forest park, is also subject to an existing access
arrangement authorising surface exploration activities, field studies and the location of ventilation stacks
to service a future underground mine (subject to conditions). Known environmental liabilities are managed
through stipulated conditions in the access arrangements and Regional and District Council Consents
including conditions that protect the conservation (biodiversity, heritage and amenity) values of the land.
20.2Land Access Status
WUG and associated exploration, geotechnical drilling, environmental fieldwork and monitoring, mitigation
and biodiversity management activities, including proposed pest and predator control within the
conservation park, will require landowner access to be granted by DOC, HDC, and also Thames
Coromandel District Council (TCDC) for biodiversity net gain activities. Access is partially secured under
existing permissions.
Access for the balance of the WNP from Willows to the Waihi operations is mostly secured as
OceanaGold is landowner for the majority of the project footprint but will need to arrange road and river
reserve land access to route services and for other operational and mitigation purposes (such as riparian
Document ID: STU-063-REP-002-0 Released: 11th December 2024Page 184 of 244
OceanaGold Corporation | ||
NI 43-101 Technical Report – Waihi District Pre-feasibility Study, New Zealand | ||
planting within council and government-owned river reserve as part of proposed ecological mitigation
measures).
20.3Required Permits and Status
The Waihi operation holds the permits, water rights, certificates, licences, and agreements required to
conduct its current operations and to extract the Martha Mineral Reserve.
The WNP, including WUG, the access tunnels and associated surface infrastructure site and services
trench, required biodiversity mitigation plantings and other measures, TSF3, rock storage, quarrying of
rock required for construction purposes, process plant and water treatment plant upgrades, and increased
exploration activity will require various regulatory approvals and permits for the WNP to proceed.
20.4Permitting Process and Schedule
The Fast-track Approvals Bill was formally introduced into parliament on 7 March 2024. It has completed
the process of parliamentary sub-committee review and is expected to be enacted by parliament and
become operational by the end quarter one in 2025. The government has announced its intention to
name WNP within a range of projects, to be listed in the legislation, for which fast-track approval
processes will become available once the proposed legislation becomes operational.
The key assumptions in terms of the permitting process and schedule include:
•the Fast-track Approvals Bill will be passed and become operational by March 2025
•the WNP Fast-track Assessment of Environmental Effects (AEE) will be submitted in March 2025
•Fast-track approvals in a form sufficient to commence construction (with or without appeals) will
be granted by November 2025.
Willows bulk civils, water treatment plant and Service trench construction in late 2025 enables the decline
to commence in late 2026. It has been assumed that construction would start in parallel to any appeals
process in the absence of a court order staying the works.
20.5Environmental Studies
As part of existing consenting processes OceanaGold has commissioned independent experts to provide
a range of specialist environmental technical reports on the actual and potential effects on the
environment of allowing the activities associated with developing and operating the WNP. These effects
include:
•Biodiversity
•Water
•Landscape and Visual
•Transport
•Amenity
•Air Quality
•Rehabilitation and Closure.
Document ID: STU-063-REP-002-0 Released: 11th December 2024Page 185 of 244
OceanaGold Corporation | ||
NI 43-101 Technical Report – Waihi District Pre-feasibility Study, New Zealand | ||
In summary, the technical assessments conclude that the WNP’s effects are all able to be managed
through the application of the effects management hierarchy, to produce environmental, social and
cultural outcomes that are appropriate within the context of regulatory requirements, having regard to the
scale and location of the WNP activities. The WNP will manage the majority of its potential adverse effects
through avoidance and mitigation and it is also able to appropriately address the residual unavoidable
adverse effects of mining and related activities, including through the use of offsetting and compensation
for residual effects on terrestrial and aquatic biodiversity and habitat values, such that residual effects are
minor. With the targeting of a biodiversity net gain, it also incorporates measures proposed for the sole
purpose of providing benefits to the environment in recognition of the conservation purpose of the land
beneath which the WNP proposes to mine.
Some of the potential or actual effects and proposed management measures identified in the technical
assessments are outlined below.
Streams and wetlands (Wharekirauponga)
Engineering studies and technical modelling identify a limited range of sub-catchments, where the design
and operation of the underground mine will need to adaptively manage risks (which are low according to
recent models) with potential minor to moderate (before mitigation) impacts on natural values of streams
and spring-fed wetlands. The classification of larger streams and tributaries as “natural state” in the
Regional Plan makes this a key area of focus for OceanaGold.
Biodiversity
A key element of the WNP will be managing its effect on biodiversity values. In short, OceanaGold has
sought to design the WNP such that overall, it will have a biodiversity net gain in the region.
Central to achieving that outcome has been the inclusion of:
•Designing WUG to substantially remain at depth underground, thereby avoiding direct
impacts on Indigenous biodiversity within the Coromandel Forest Park
•Measures to ensure all non-trivial adverse effects (including potential effects) on terrestrial
and aquatic ecology are managed following a strict avoid, reduce [impact], remedy,
mitigate, offset hierarchy, such that a no net loss, and preferably a net gain outcome is
achieved. These management measures have been carefully designed to align with
regulatory requirements
•An $8.4 million predator control and ecological enhancement project, focused within an
18,870 ha area of the southern Coromandel Forest Park will aim to achieve long-term
(inter-generational) positive ecological outcomes for the area.
Freshwater
Water management is currently undertaken in an integrated and effective manner at OceanaGold’s
existing Waihi facilities, and the same concept will be extended to include the WNP elements. In
assessing that the current water management approach remains suitable for extension to incorporate
water associated with the WNP elements, two important matters have been considered:
•Confirming the existing water quality limits that apply to the discharge from the water
treatment plant and the Ohinemuri River receiving environment (after mixing) remain
appropriate to ensure the discharge’s effects on instream values are acceptable
Document ID: STU-063-REP-002-0 Released: 11th December 2024Page 186 of 244
OceanaGold Corporation | ||
NI 43-101 Technical Report – Waihi District Pre-feasibility Study, New Zealand | ||
•Confirming that the water treatment plant will be able to manage all affected mine water
from the WNP and existing mine activities in a manner that will meet those discharge
requirements.
Landscape Effects
Landscape effects associated with the WNP overall are not considered to be significant. Primarily this is
due to the underground nature of WUG and the sympathetic siting of surface elements in response to
sensitive views. For most people living in and around Waihi, the WNP will remain visually well contained,
resulting in no substantial change or adverse landscape effects in the context of existing mining activity.
Landscape mitigation will ensure the WNP remains well integrated within its local landscape setting. The
mitigation will facilitate positive landscape, natural character and ecological outcomes in the long-term
including greater connectivity between inherent values within the Coromandel Forest Park across the
wider surrounding rural landscape.
The Transport Network
The WNP contains a number of geographically discrete but interlinked components, and because of that,
effects on the transport network were a key consideration when it was being designed. A key output of
this was OceanaGold’s decision to include the Processing Plant to Willows access tunnel as a part of the
WNP. It provides a means of transporting material between WUG and Waihi without having to use the
road network. The effects of development traffic on the local roads and their points of access to the
arterial state highway network have been examined and recommendations have been made to mitigate
any potential adverse effects. With the implementation of those measures the potential adverse
transportation-related effects of vehicular access and traffic movement associated with the WNP, during
construction and over the longer term, will be avoided or mitigated.
Amenity Values
OceanaGold (and its predecessors) have been operating in and around Waihi for over 30 years and
understands the importance of managing the effects of activities on the amenity values of people in the
local community. For this reason, proposed conditions have been informed by appropriate expert
assessment and based on the application of recognized standards for achieving good practice in order to
protect a reasonable degree of amenity. They include controls on dust and other airborne emissions, and
limits on the noise, vibration and overpressure received by neighbours which align with best practice
guideline documents. In many cases these limits align or are more stringent than those which apply to
OceanaGold’s existing activities in this area and which have been proven effective in protecting amenity.
The visual effects associated with the WNP overall are not considered to be significant. For most people
living in and around Waihi, the WNP will remain visually well contained, resulting in no substantial change
or adverse visual effects in the context of existing mining activity.
Air Quality
The proposed activities are very similar in nature to those associated with OceanaGold’s existing mining
operations and similar measures for avoiding, remedying, or mitigating air quality effects will be
implemented.
Document ID: STU-063-REP-002-0 Released: 11th December 2024Page 187 of 244
OceanaGold Corporation | ||
NI 43-101 Technical Report – Waihi District Pre-feasibility Study, New Zealand | ||
To manage the potential effects of proposed activities on air quality, a range of management measures
are proposed, including:
•Keeping exposed surface areas to a minimum and revegetate exposed areas as soon as possible
•Using water sprays to keep surfaces damp
•Limiting speeds on haul roads and minimising haul distances
•Sealing access roads
•A real-time monitoring program of total suspended particulate in key areas with actions, should a
trigger level be exceeded.
These methods adequately avoid and mitigate effects on air quality, and the risk that discharges to air
from the proposed activities will result in noxious, dangerous, offensive or objectionable effects is low.
Rehabilitation and Closure
A comprehensive and integrated rehabilitation and closure concept is proposed which ties in with the
existing rehabilitation and closure obligations that apply to OceanaGold’s existing mining activities. The
details of the proposed rehabilitation and closure plan have been informed by the various technical
assessments. It requires OceanaGold to rehabilitate and close all mine areas such that in the long term:
•The Mine site, and any structures on it, will remain in a stable, self- sustaining, rehabilitated
state
•Removal of infrastructure not compatible with post mining land use at Willows and
rehabilitate impacted areas
•The soils on the site are such that it is highly unlikely that there will be a risk to human
health considering the post closure use of that land
•Any water discharging from the mine site, and any groundwater under the mine site, will be
of a quality such that it will not adversely affect aquatic life, or other users of the water
resource.
On closure it is proposed to transfer areas requiring ongoing monitoring and management such as TSF3
and the Northern Rock to the existing Martha Trust to be managed in perpetuity in the same manner as
the existing TSFs and open pit.
20.6Stakeholder Engagement
WNP commenced community engagement in 2020 and formal engagement with iwi and regulators began
in 2017. OGC has well established positive working relationships with key stakeholders and this has
provided a solid platform for understanding and respecting diverse viewpoints. A Stakeholder
Engagement Plan, which includes stakeholder identification and analysis, is in place and being
implemented for the proposed Project, this plan has been iteratively updated and implemented as the
Project has progressed, and this will continue to be the case.
Key methods of engagement that have been undertaken to-date include:
•Community Engagement Line – OceanaGold Waihi operates a free call Community Engagement
Line, that is available seven days a week
Document ID: STU-063-REP-002-0 Released: 11th December 2024Page 188 of 244
OceanaGold Corporation | ||
NI 43-101 Technical Report – Waihi District Pre-feasibility Study, New Zealand | ||
•Community Group Presentations - - OceanaGold has presented on the proposed Project to over
20 local community groups and organisations. During these presentations a high-level
explanation of the proposed project was provided, and stakeholders had the opportunity to ask
questions or seek clarity on any aspect of the proposal
•‘Expert Days’ - During these events the external consultants preparing the relevant technical
reports for the Project are available at the Company’s Project Information Office to speak directly
with interested Stakeholders
•Local Communications Collateral - OceanaGold ‘Update’, the ‘Mining Matters’, and OceanaGold
Waihi Facebook Page
•Meetings and Individual Consultation
•Open Days - Targeting the broader Waihi Community, providing an opportunity for the general
public to obtain information and share views and opinions regarding the project. Open day
events have included ‘Underground Simulator’
•Project Tours - These tours allowed stakeholders to get close to the site of proposed operations,
as well as develop an understanding of how OceanaGold Waihi currently operates
•Project Information Office - It is important to OceanaGold that reliable information about what the
Company is proposing and what it means for stakeholders is readily available directly from the
Company. Since July 2020 OceanaGold has had a Project Information Office open in the main
street of the Waihi Township
•Waihi Community Forum - act as a conduit between the Community, Council and OceanaGold
•Street Events: Small neighbourhood events with groups of residents identified as being close
proximity residents
•Surveys: Online and ‘Maptionnaire’ Surveys of people that live or work in Waihi, as well as local
suppliers and providers
•Interviews and Focus Groups: With Community, facilities and service representatives, regulatory
authorities, housing and accommodation entities, education, training and labour organisations
•Cultural Values Training of the OGC workforce, and the Completion of Cultural Impacts
Assessments by Tangata Whenua.
20.7Social and Cultural Impacts
The assessment of the social and cultural impacts is an important requirement of the permitting process
and a requirement of the Company’s External Affairs and Social Performance (EA and SP) Standard. An
independent Social Impact Assessment (SIA) was undertaken in 2022 for the WNP and is being updated
in 2024 to reflect the current project scope and potential social impacts. The SIA follows the International
Association of Impact Assessment’s guidance for preparing an SIA.
The WNP SIA (2022) indicates positive outcomes related to:
•Job security and sustained livelihoods
•Reduced local unemployment
Document ID: STU-063-REP-002-0 Released: 11th December 2024Page 189 of 244
OceanaGold Corporation | ||
NI 43-101 Technical Report – Waihi District Pre-feasibility Study, New Zealand | ||
•Increased business activity and indirect employment opportunities.
The assessment identified the following effects that were assessed as having moderate to high negative
significance:
•Increased demand for accommodation, potentially impacting housing availability and affordability
•Change in sense of place for residents around the Willows area (location of the SFA for the WUG)
•Reduced amenity as a result of increased traffic movements along the Willows area.
Mitigation measures have been identified in the SIA for the effective management of the potential
negative impacts.
The Company recognises the special relationship that iwi have with land and water, and that this
relationship is important to spiritual and cultural wellbeing. The Company has had a consultation program
in place with iwi for many years covering the operating mine, the mineral exploration program and new
projects, and this is ongoing. Through this consultation, nine iwi have expressed to OceanaGold that they
have interests in the proposed project areas.
Engagement with these groups is ongoing, providing iwi the opportunity to express their unique
relationship with the affected area, and to identify any potential impacts on their cultural values, and
discuss the socio-economic opportunities the WNP provides.
Of the nine iwi the Company has engaged with, five groups have agreed to provide a Cultural Impact
Assessment for the WNP. The remaining four iwi groups have either chosen not to complete an
assessment, to defer to another iwi group they have recognized as having authority over specific matters,
or to not engage with the Company further.
20.8Rehabilitation and Bonds
Rehabilitation proposals and concept plans were developed well before the commencement of
construction for open pit mining in 1987, and those plans are revised annually. In preparing these plans,
the advice and skill of a broad range of experts, including soil scientists, hydrologists, engineers, aquatic
biology, and water quality specialists has been sought. Where possible, OceanaGold progressively
rehabilitates areas of disturbed land.
The Company posts both cash and bank bonds for various purposes. The most significant of these, which
are held by the Hauraki District Council and Waikato Regional Council, cover the costs of closure works.
The purpose of the rehabilitation bond is to provide the Councils with unencumbered access to a source
of funds to close and rehabilitate the current mine site in the unlikely event that OceanaGold fails to meet
its closure obligations. The quantum of this bond is assessed annually, calculated on the basis of the cost
to close the site at the end of each 12-month bond period.
Each year, a Rehabilitation and Closure Plan is submitted to the Councils to describe the proposed
method of rehabilitation and closure of the site. The overall objective of this plan is to ensure rehabilitation
and closure of the site in such a manner that in the long-term the site, and any structures on it, will remain
stable; and any water discharging from the site, and any groundwater under the site, will be of a quality
such that it will not adversely affect aquatic life, or other users of the water resource.
Document ID: STU-063-REP-002-0 Released: 11th December 2024Page 190 of 244
OceanaGold Corporation | ||
NI 43-101 Technical Report – Waihi District Pre-feasibility Study, New Zealand | ||
The current rehabilitation bond in place is $39.1 million and is expected to rise to $45.4 for the 2024 to
2025 period. The current capitalisation bond sits at $6.3 M.
Both bonds will need to be reviewed should consents be granted for new projects, to provide for the full
closure costs and the post closure site management costs that include the new project components. That
review would need to be completed after the grant of consent so that the revised bond quanta can take
account of the closure obligations in the new conditions, and before works starts on the new projects.
21CAPITAL AND OPERATING COSTS
All costs, unit costs and prices in Section 21 are in United States dollars unless otherwise noted.
21.1Capital Expenditure Estimates
A summary of the total capital expenditure is provided in Table 22-5. The capital expenditure items have
been separated into sustaining and non-sustaining (growth) categories as per guidance from
OceanaGold. The life of mine capital cost is shown in Table 21-1.
Table 21-1: Life of Mine Capital Costs ($ 000’s)
Summary Capital Expenditure Schedule | Growth Estimate $ 000’s | Sustaining Estimate $ 000’s | Total Estimate $ 000’s |
WUG | 357,944 | 62,942 | 420,887 |
MUG | 0 | 102,075 | 102,075 |
Processing | 92,815 | 8,395 | 101,210 |
TSF's | 44,424 | 80,498 | 124,922 |
Other Capital | 60,623 | 16,032 | 76,655 |
Rehabilitation | 0 | 71,648 | 71,648 |
Total | 555,807 | 341,590 | 897,397 |
21.1.1Basis for Capital Expenditure Estimates
The base date of the WNP Capital Cost estimate is 30 June 2024. All values are in United States dollars
($), based on foreign currency exchange rate of $ 0.61: NZ$. Contingencies vary according to the level of
accuracy of design and estimate, and the average WUG contingency is 16 % and is considered
appropriate. The breakdown of the WUG contingency is shown in Table 21-2.
Document ID: STU-063-REP-002-0 Released: 11th December 2024Page 191 of 244
OceanaGold Corporation | ||
NI 43-101 Technical Report – Waihi District Pre-feasibility Study, New Zealand | ||
Table 21-2. WUG Contingency Breakdown
Item | Area | Rate |
1 | Contingency General | 20 % |
2 | Contingency Mobile Plant | 20 % |
3 | Contingency Capitalized UG development | 20 % |
4 | Infrastructure – Underground | 20 % |
5 | Infrastructure – Surface | 20 % |
6 | Process plant | 20 % |
7 | Water Treatment Plant (WTP) | 15 % |
8 | TSF3 | 20 % |
9 | Quarry/MOP4 Capitalized Prestrip | 10 % |
10 | General and Administration | 10 % |
11 | Rehabilitation | 10 % |
Underground Mines
All major mining equipment is supplied under operating lease arrangements. Projected capital costs for
underground mining are summarized for MUG and WUG in Table 21-3. The underground capital estimate
includes capitalized development, mine infrastructure and equipment not sourced under capital leasing
arrangements.
Document ID: STU-063-REP-002-0 Released: 11th December 2024Page 192 of 244
OceanaGold Corporation | ||
NI 43-101 Technical Report – Waihi District Pre-feasibility Study, New Zealand | ||
Table 21-3: Underground Capital Cost Summary (Growth and Sustaining)
Item | Units | LoM Total |
WUG | ||
Capital Development (Growth) | $ 000’s | 203,747 |
Capital Development (Sustaining) | $ 000’s | 14,949 |
UG Capital Equipment Purchases (Growth) | $ 000’s | 88,316 |
UG Capital Infrastructure (Growth) | $ 000’s | 12,259 |
Willows Infrastructure (Growth) | $ 000’s | 50,392 |
WUG Project Management (Growth) | $ 000’s | 26,994 |
WUG Studies (Growth) | $ 000’s | 16,665 |
Resource Drilling (Growth) | $ 000’s | 4,896 |
Polishing Pond Portal Works (Growth) | $ 000’s | 2,670 |
Sub-total | $ 000’s | 420,887 |
MUG | ||
Capital Development (Sustaining) | $ 000’s | 65,346 |
UG Capital Purchases (Growth) | $ 000’s | 34,327 |
Resource Drilling (Growth) | $ 000’s | 2,402 |
Sub-total | $ 000’s | 102,075 |
Total | $ 000’s | 522,962 |
Document ID: STU-063-REP-002-0 Released: 11th December 2024Page 193 of 244
OceanaGold Corporation | ||
NI 43-101 Technical Report – Waihi District Pre-feasibility Study, New Zealand | ||
Process Plant
Process plant capital over the remaining LoM totalling $101.2 million is shown in Table 21-4 and is
principally related to:
•Upgrade of the crushing and grinding circuit
•Debottlenecking and minor pumping upgrades within the plant to maintain milling rates
•Other sustaining capital spend to mitigate wear and tear
•Water treatment plant upgrade
Table 21-4: Processing Capital Cost Summary
Item | Units | LoM Total |
Process (Growth) | $ 000’s | 47,919 |
Process (Sustaining) | $ 000’s | 8,395 |
Water Treatment (Growth) | $ 000’s | 44,896 |
Water Treatments (Sustaining) | $ 000’s | 0 |
Total | $ 000’s | 101,210 |
Infrastructure -Tailings
Infrastructure capital associated with tailings is estimated to be $124.9 million as summarized in Table
21-5 for the LoM. Infrastructure capital has been estimated internally by OceanaGold and provided by
experienced contractors and external consultants. The major capital items are tailings storage facility
expansion and construction, containment ponds, diversion drains, tailings pipelines, and expansion of the
existing water management facilities.
Table 21-5: Tailings Storage Capital Cost Summary
Item | Units | LoM Total |
TSF1A and 2 (Sustaining) | $ 000’s | 10,766 |
TSF3 Construction (Growth) | $ 000’s | 34,717 |
TSF3 Construction (Sustaining) | $ 000’s | 23,259 |
TSF3 Borrow (Growth) | $ 000’s | 9,708 |
TSF3 Borrow (Sustaining) | $ 000’s | 46,472 |
Total | $ 000’s | 124,922 |
Document ID: STU-063-REP-002-0 Released: 11th December 2024Page 194 of 244
OceanaGold Corporation | ||
NI 43-101 Technical Report – Waihi District Pre-feasibility Study, New Zealand | ||
Other Capital
Other capital required for the LoM plan is as shown in Table 21-6. Key costs relate to permitting, consent
compliance (fencing, riparian planting, pest control, biodiversity programs and social, iwi engagement),
new power line and substation upgrade and site rehabilitation works.
Table 21-6: Other Capital Cost Summary
Item | Units | LoM Total |
G&A (Sustaining) | $ 000’s | 2,339 |
Permitting (Growth) | $ 000’s | 10,042 |
Consent compliance (Growth) | $ 000’s | 22,224 |
Consent compliance (Sustaining) | $ 000’s | 13,693 |
Power Line Upgrade and Substation (Growth) | $ 000’s | 28,357 |
Rehabilitation (Sustaining) | $ 000’s | 71,648 |
Total | $ 000’s | 148,303 |
21.2Operating Cost Estimates
The total operating cost unit rate of $141.8 /t processed is summarized in Table 21-7. Carbon costs for a
fully equipped diesel mine have been included in the operating cost estimate based on recent New
Zealand guidance. Carbon costs commence in 2026 and progressively increase through the life of mine
calculated on the equivalent tonne of CO2 produced.
Table 21-7: LoM Operating Cost Summary
Description | $ 000’s | $/t Mined |
UG Mining – MUG | 488,812 | 110.8 |
UG Mining – WUG | 264,410 | 65.2 |
Subtotal Mining | 753,223 | 89.0 |
Description | $ 000’s | $/t Ore Processed |
Processing | 222,717 | 26.3 |
G&A Costs | 191,026 | 22.6 |
Refining / Freight Costs | 5,584 | 0.7 |
Other - Carbon Costs and stockpile movements | 28,232 | 3.3 |
Total Operating Costs | 1,200,783 | 141.8 |
21.2.1Basis of Operating Costs
The operating cost estimates throughout this section has a base or effective date of June 30, 2024. All
values are in United States dollars ($), based on foreign currency exchange rate of $ 0.61: NZ$. No
Document ID: STU-063-REP-002-0 Released: 11th December 2024Page 195 of 244
OceanaGold Corporation | ||
NI 43-101 Technical Report – Waihi District Pre-feasibility Study, New Zealand | ||
contingency has been applied to operating cost estimates for mining, processing, or G&A. A notional
carbon cost for a diesel equipped mine has been included in the operating cost estimate based on the
New Zealand Climate Change Commission research report recommendations.
21.2.2Underground Mining
Projected operating costs for underground mining have been developed from the LoM production
schedule. The average cost of underground mining is $88.9 /t and the cost by activity for MUG is
presented in Table 21-8 and for WUG is presented in Table 21-9.
The difference in unit costs between MUG and WUG mines can be largely attributed to the higher annual
production rate at WUG, and the backfilling of historical stoping areas with cemented fill, remnant mining
practices and extensive working areas at MUG.
Table 21-8: MUG Cost Summary
Description | $ 000’s | $/t Mined |
Labour | 180,592 | 40.95 |
Fuel | 13,507 | 3.06 |
Power | 50,883 | 11.54 |
Equipment Operating | 45,111 | 10.23 |
Equipment Maintenance | 75,935 | 17.22 |
Explosives | 27,159 | 6.16 |
Ground Support | 42,181 | 9.56 |
Grout/Shotcrete | 11,598 | 2.63 |
Services | 10,462 | 2.37 |
Contracts | 7,205 | 1.63 |
Finance Lease Interest | 12,251 | 2.78 |
Supply rockfill to UG | 11,929 | 2.70 |
Total | 488,812 | 110.84 |
Document ID: STU-063-REP-002-0 Released: 11th December 2024Page 196 of 244
OceanaGold Corporation | ||
NI 43-101 Technical Report – Waihi District Pre-feasibility Study, New Zealand | ||
Table 21-9: WUG Cost Summary
Description | $ 000’s | $/t Mined |
Labour | 87,160 | 21.48 |
Fuel | 17,585 | 4.33 |
Power | 23,047 | 5.68 |
Equipment Operating | 70,853 | 17.46 |
Explosives | 3,925 | 0.97 |
Ground Support | 17,233 | 4.25 |
Grout/Shotcrete | 16,085 | 3.96 |
Services | 4,648 | 1.15 |
Other | 10,064 | 2.48 |
Contracts | 11,038 | 2.72 |
Finance Lease Interest | 1,966 | 0.48 |
Surface Loader - Willows Stockpile | 806 | 0.20 |
Total | 264,410 | 65.17 |
Note: preproduction finance lease interest included in underground capital equipment purchases.
21.2.3Process Plant
The power cost component of the estimate is based on current power consumption for each area of the
plant with allowance for increased loads from planned equipment upgrades. The current unit energy cost
rates in the existing power supply agreement with the power supplier to the current operation (Genesis
Energy) were used.
Labour costs were developed based on the current staffing plan for the plant reflecting the four-panel
operations roster and maintenance support roles with a total head count of 52 people, using the current
labour rate schedules.
The reagent and grinding media consumption estimates are based on forecasts used in the current Waihi
LoM plan, adjusted for metallurgical testwork forecasts.
Crusher and mill liner replacement costs are based on vendor pricing for current supply of components
and a long-term reline schedule for the LoM based on life predicted on tonnage treated developed over
the last several years of operation.
Maintenance costs are based on forecast consumable rates for each area of the plant from operating
experience since startup. Contractor costs are based on expected usage based on recent experience to
support shutdown and rebuild activities.
Miscellaneous costs cover assay laboratory charges assigned to the process plant and other minor ad-
hoc expenses such as software license and lease fees, technical consultancy services, development test
work and advisors fees, etc.
The breakdown of the processing operating cost estimate is summarized in Table 21-10.
Document ID: STU-063-REP-002-0 Released: 11th December 2024Page 197 of 244
OceanaGold Corporation | ||
NI 43-101 Technical Report – Waihi District Pre-feasibility Study, New Zealand | ||
Table 21-10: Processing Cost Summary
Description | $ 000’s | $/t Milled |
Processing Labour | 42,986 | 5.08 |
Maintenance Labour | 19,531 | 2.31 |
Variable Costs | 41,592 | 4.91 |
Water Treatment Costs | 17,985 | 2.12 |
Assaying | 7,596 | 0.90 |
Mill Loader | 6,126 | 0.72 |
Fixed Costs - Processing | 6,794 | 0.80 |
Driver Costs -Power | 49,852 | 5.89 |
Driver Costs -Maintenance | 12,499 | 1.48 |
Fixed costs - Maintenance | 17,756 | 2.10 |
Total Processing Costs | 222,717 | 26.30 |
21.2.4Selling and Refining
Sales refining charges are charges incurred in the sale and transport of material to the refiner and are
listed below. These total $5.6 million over the LoM or $0.66 /t processed.
Gold
•99.90 % payable Au
•$1.28 /troy oz Au treatment and shipment charge.
Silver
•99.0 % payable Ag
•$1.28 /troy oz Au treatment and shipment charge.
21.2.5General and Administration
The G&A operating cost is time based and was estimated by OceanaGold at a total LoM of $191 M or an
equivalent of $22.6 /t of mill feed processed. The G&A operating cost is time based and was estimated by
OceanaGold at a total LoM of $191 M or an equivalent of $22.6 /t of mill feed processed. These are
based on the current site budget estimates adjusted for future growth as outlined in Table 21-11.
Document ID: STU-063-REP-002-0 Released: 11th December 2024Page 198 of 244
OceanaGold Corporation | ||
NI 43-101 Technical Report – Waihi District Pre-feasibility Study, New Zealand | ||
Table 21-11: General and Administration Operating Costs
General and Administration Operating Cost | $ 000’s | $/t Milled |
Administration Costs | 80,561 | 9.51 |
Miscellaneous Departmental Costs | 36,392 | 4.30 |
Labour | 74,073 | 8.75 |
Total General and Administration Costs | 191,026 | 22.56 |
22ECONOMIC ANALYSIS
All costs, unit costs revenues, prices and financial indices in Section 22 are in United States dollars
unless otherwise noted. Economic analysis is undertaken in real terms, i.e. constant 2024 dollars. No
inflation or escalation included.
22.1Principal Assumptions and Input Parameters
The indicative economic results summarized in this section are based upon work performed by
OceanaGold in 2024. The metrics reported in this volume are based on the annual cash flow model
results. The metrics are on both a pre-tax and after-tax basis, no Project financing inputs and are in Q2,
2024 U.S. constant dollars. Non-site costs have been excluded from this analysis.
Key criteria used in the analysis are discussed in detail throughout this section. Principal Project
assumptions used are summarized in Table 22-1.
Table 22-1: Basic Model Parameters
Description | Value |
Technical Economic Model (TEM) Time Zero Start Date | 30th June 2024 |
MUG Life | 9 years |
WUG Life | 6 years |
Mill Operations | 15 years |
Discount Rate | 5.0 % |
Exchange Rate $: NZ$ | 0.61 |
All costs incurred prior to July 2024 are considered sunk with respect to this analysis. The selected
Project discount rate is 5 %, gold price $1,750 /oz and foreign exchange rate of $0.61 / NZ$ as directed
by OceanaGold. A sensitivity analysis of the gold price is discussed later in this section. All costs and
revenues are denominated in US dollars.
Document ID: STU-063-REP-002-0 Released: 11th December 2024Page 199 of 244
OceanaGold Corporation | ||
NI 43-101 Technical Report – Waihi District Pre-feasibility Study, New Zealand | ||
22.2Cashflow Forecasts and Annual Production Forecasts
22.2.1Mine Production
Figure 22-1 and Table 22-2 shows LoM production by year. A more detailed production schedule is shown
in section 16.4. Note figures and tables show H2 only for 2024 with full year production expected to be
48-52 koz.
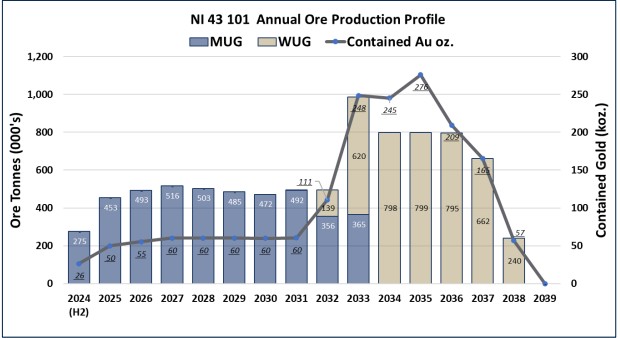
Figure 22-1: Annual Mine Production
Table 22-2: Annual Mine Production
2024 (H2) | 2025 | 2026 | 2027 | 2028 | 2029 | 2030 | 2031 | 2032 | 2033 | 2034 | 2035 | 2036 | 2037 | 2038 | ||
MUG | Ore Tonnes (000's) | 275 | 973 | 929 | 878 | 831 | 614 | 516 | 536 | 360 | 365 | - | - | - | - | - |
Grade Au (g/t) | 3.0 | 3.4 | 3.5 | 3.6 | 3.7 | 3.8 | 4.0 | 3.8 | 5.2 | 4.0 | - | - | - | - | - | |
Contained Gold (koz.) | 26 | 107 | 104 | 102 | 99 | 76 | 66 | 65 | 60 | 47 | - | - | - | - | - | |
WUG | Ore Tonnes (000's) | - | - | - | - | - | - | - | 3 | 139 | 620 | 798 | 799 | 795 | 662 | 240 |
Grade Au (g/t) | - | - | - | - | - | - | - | 5.5 | 11.4 | 10.1 | 9.6 | 10.7 | 8.2 | 7.8 | 7.4 | |
Contained Gold (koz.) | - | - | - | - | - | - | - | 1 | 51 | 201 | 245 | 276 | 209 | 165 | 57 |
Document ID: STU-063-REP-002-0 Released: 11th December 2024Page 200 of 244
OceanaGold Corporation | ||
NI 43-101 Technical Report – Waihi District Pre-feasibility Study, New Zealand | ||
22.2.2Mill Production
A summary of the estimated process plant production is shown in Figure 22-3. Differences in mined ore
and ounces compared to processed ore and ounces are due to stockpile strategies and management. A
more detailed production schedule is shown in section 16.4. Note figures and tables show H2 only for
2024 with full year production expected to be 48-52 koz.
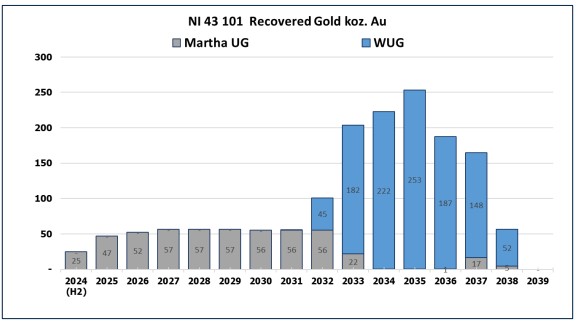
Figure 22-2: Annual Process Plant Production
Table 22-3: Annual Process Plant Production
2024 (H2) | 2025 | 2026 | 2027 | 2028 | 2029 | 2030 | 2031 | 2032 | 2033 | 2034 | 2035 | 2036 | 2037 | 2038 | |
MUG (koz) | 25 | 47 | 52 | 57 | 57 | 57 | 56 | 56 | 56 | 22 | - | - | 1 | 17 | 5 |
WUG (koz) | - | - | - | - | - | - | - | - | 45 | 182 | 222 | 253 | 187 | 148 | 52 |
22.2.3Revenue
Gold pricing assumptions used in the economic analysis include a constant LoM gold price of $1,750 /troy
oz and a LoM silver price of $20 /troy oz. Doré refining/freight costs are modelled as follows:
•99.90 % payable Au
•$1.28 /troy oz Au treatment and shipment charge.
Silver is also included in the current Mineral Resource or Reserve estimates.
Document ID: STU-063-REP-002-0 Released: 11th December 2024Page 201 of 244
OceanaGold Corporation | ||
NI 43-101 Technical Report – Waihi District Pre-feasibility Study, New Zealand | ||
The silver by-product credit in the TEM is calculated by using a constant silver price of $20 /troy oz and
an average recovery of 60 %. The additional silver related doré refining costs are as follows:
•99.0 % payable Ag
•$1.28 /troy oz Au treatment and shipment charge.
The silver by-product credit of $55 million over LoM represents 1.9 % of revenue over LoM.
Metallurgical recovery varies as a function of gold and arsenic grades and by lode but averages 93.7 %
for MUG and 90.4 % for WUG.
22.2.4Operating and Capital Costs
No contingency was applied to the operating costs within the economic model. The total operating cost
unit rate of $142 /t processed is summarized in Table 22-4.
Table 22-4: LoM Operating Cost Summary
Description | $ 000’s | $/t Mined |
UG Mining – MUG | 488,812 | 110.8 |
UG Mining – WUG | 264,410 | 65.2 |
Subtotal Mining | 753,223 | 89.0 |
Description | $ 000’s | $/t Ore Processed |
Processing | 222,717 | 26.3 |
G&A Costs | 191,026 | 22.6 |
Refining / Freight Costs | 5,584 | 0.7 |
Other - Carbon Costs and stockpile movements | 28,232 | 3.3 |
Total Operating Costs | 1,200,783 | 141.8 |
Total LoM capital costs totalling $897 million including rehabilitation costs are summarized in Table 22-5.
The capital expenditure items have been separated into sustaining and non-sustaining categories per
guidance from OceanaGold. Non-Sustaining (Growth) capital is primarily related to the development of
WUG and associated infrastructure and totals $556 million over the LoM. Sustaining capital includes $72
million rehabilitation costs.
Document ID: STU-063-REP-002-0 Released: 11th December 2024Page 202 of 244
OceanaGold Corporation | ||
NI 43-101 Technical Report – Waihi District Pre-feasibility Study, New Zealand | ||
Table 22-5: Life of Mine Capital Costs ($ 000’s)
Summary Capital Expenditure Schedule | Growth Estimate $ 000’s | Sustaining Estimate $ 000’s | Total Estimate $ 000’s |
WUG | 357,944 | 62,942 | 420,887 |
MUG | 0 | 102,075 | 102,075 |
Processing | 92,815 | 8,395 | 101,210 |
TSF's | 44,424 | 80,498 | 124,922 |
Other Capital | 60,623 | 16,032 | 76,655 |
Rehabilitation (non-sustaining) | 0 | 71,648 | 71,648 |
Total | 555,807 | 341,590 | 897,397 |
The assumptions used for working capital for this estimate are as follows:
•Accounts Receivable (A/R): 3-day delay
•Accounts Payable (A/P): 20-day delay
•Zero opening balance for A/P and A/R.
Annual adjustments to working capital levels are made in the TEM with all working capital recaptured by
the end of the mine life resulting in a LoM net free cash flow (FCF) impact of $0.
22.2.5Economic Results
The TEM metrics are prepared on an annual after-tax basis, the results of which are summarized in Table
22-6. A full LoM annual cash flow forecast is presented in. Table 22-12. The results indicate that at a flat
$1,750 /oz gold price and a 5 % discount rate, an after-tax NPV of $138 million is returned.
OceanaGold has provided an alternative price profile which consists of a flat $2,400 /oz gold price over
the life of the operation. At this price and a 5 % discount rate, and after-tax NPV of $621 million is
returned.
Document ID: STU-063-REP-002-0 Released: 11th December 2024Page 203 of 244
OceanaGold Corporation | ||
NI 43-101 Technical Report – Waihi District Pre-feasibility Study, New Zealand | ||
Table 22-6: Indicative Economic Results
Description | Reserve Case Price | Alternative Price |
Market Prices | ||
Gold ($/oz) | 1,750 | 2,400 |
Payable Gold (koz) | 1,593 | 1,593 |
Revenue ($ 000’s) | ||
Gross Gold Revenue | 2,788,394 | 3,824,083 |
Silver By-Product Credit (@$20 / oz Ag) | 54,598 | 54,598 |
Total Gross Revenue | 2,842,992 | 3,878,682 |
Direct Operating Costs ($ 000’s) | ||
Mining | 753,223 | 753,223 |
Processing | 222,717 | 222,717 |
Site G&A | 191,026 | 191,026 |
Selling/Refining | 5,584 | 5,584 |
Other - Carbon Costs and stockpile movements | 28,232 | 28,232 |
Total Direct Operating Costs | 1,200,783 | 1,200,783 |
Non-Operating Costs ($ 000’s) | ||
Royalties payable to Government | 58,213 | 98,343 |
Other Royalties | 38,582 | 52,742 |
Total Non-Direct Operating Costs | 96,795 | 151,085 |
Operating Cash Flow | 1,545,414 | 2,526,815 |
Taxes ($ 000’s) | ||
Income Tax | 217,309 | 482,089 |
Capital ($ 000’s) | ||
Sustaining Capital | 341,590 | 341,590 |
Non-Sustaining Capital | 555,807 | 555,807 |
Total Capital | 897,397 | 897,397 |
Metrics ($ 000’s) | ||
Pre-Tax Free Cash Flow | 648,017 | 1,629,418 |
After-Tax Free Cash Flow | 430,709 | 1,147,329 |
Pre-Tax NPV @ 5% | 258,543 | 902,338 |
After-Tax NPV @ 5% | 137,726 | 620,707 |
IRR | 9.2% | 24.0% |
Document ID: STU-063-REP-002-0 Released: 11th December 2024Page 204 of 244
OceanaGold Corporation | ||
NI 43-101 Technical Report – Waihi District Pre-feasibility Study, New Zealand | ||
Figure 22-3 and Figure 22-4 presents annual cash flow metrics vs. recovered gold production for both
pricing scenario’s.
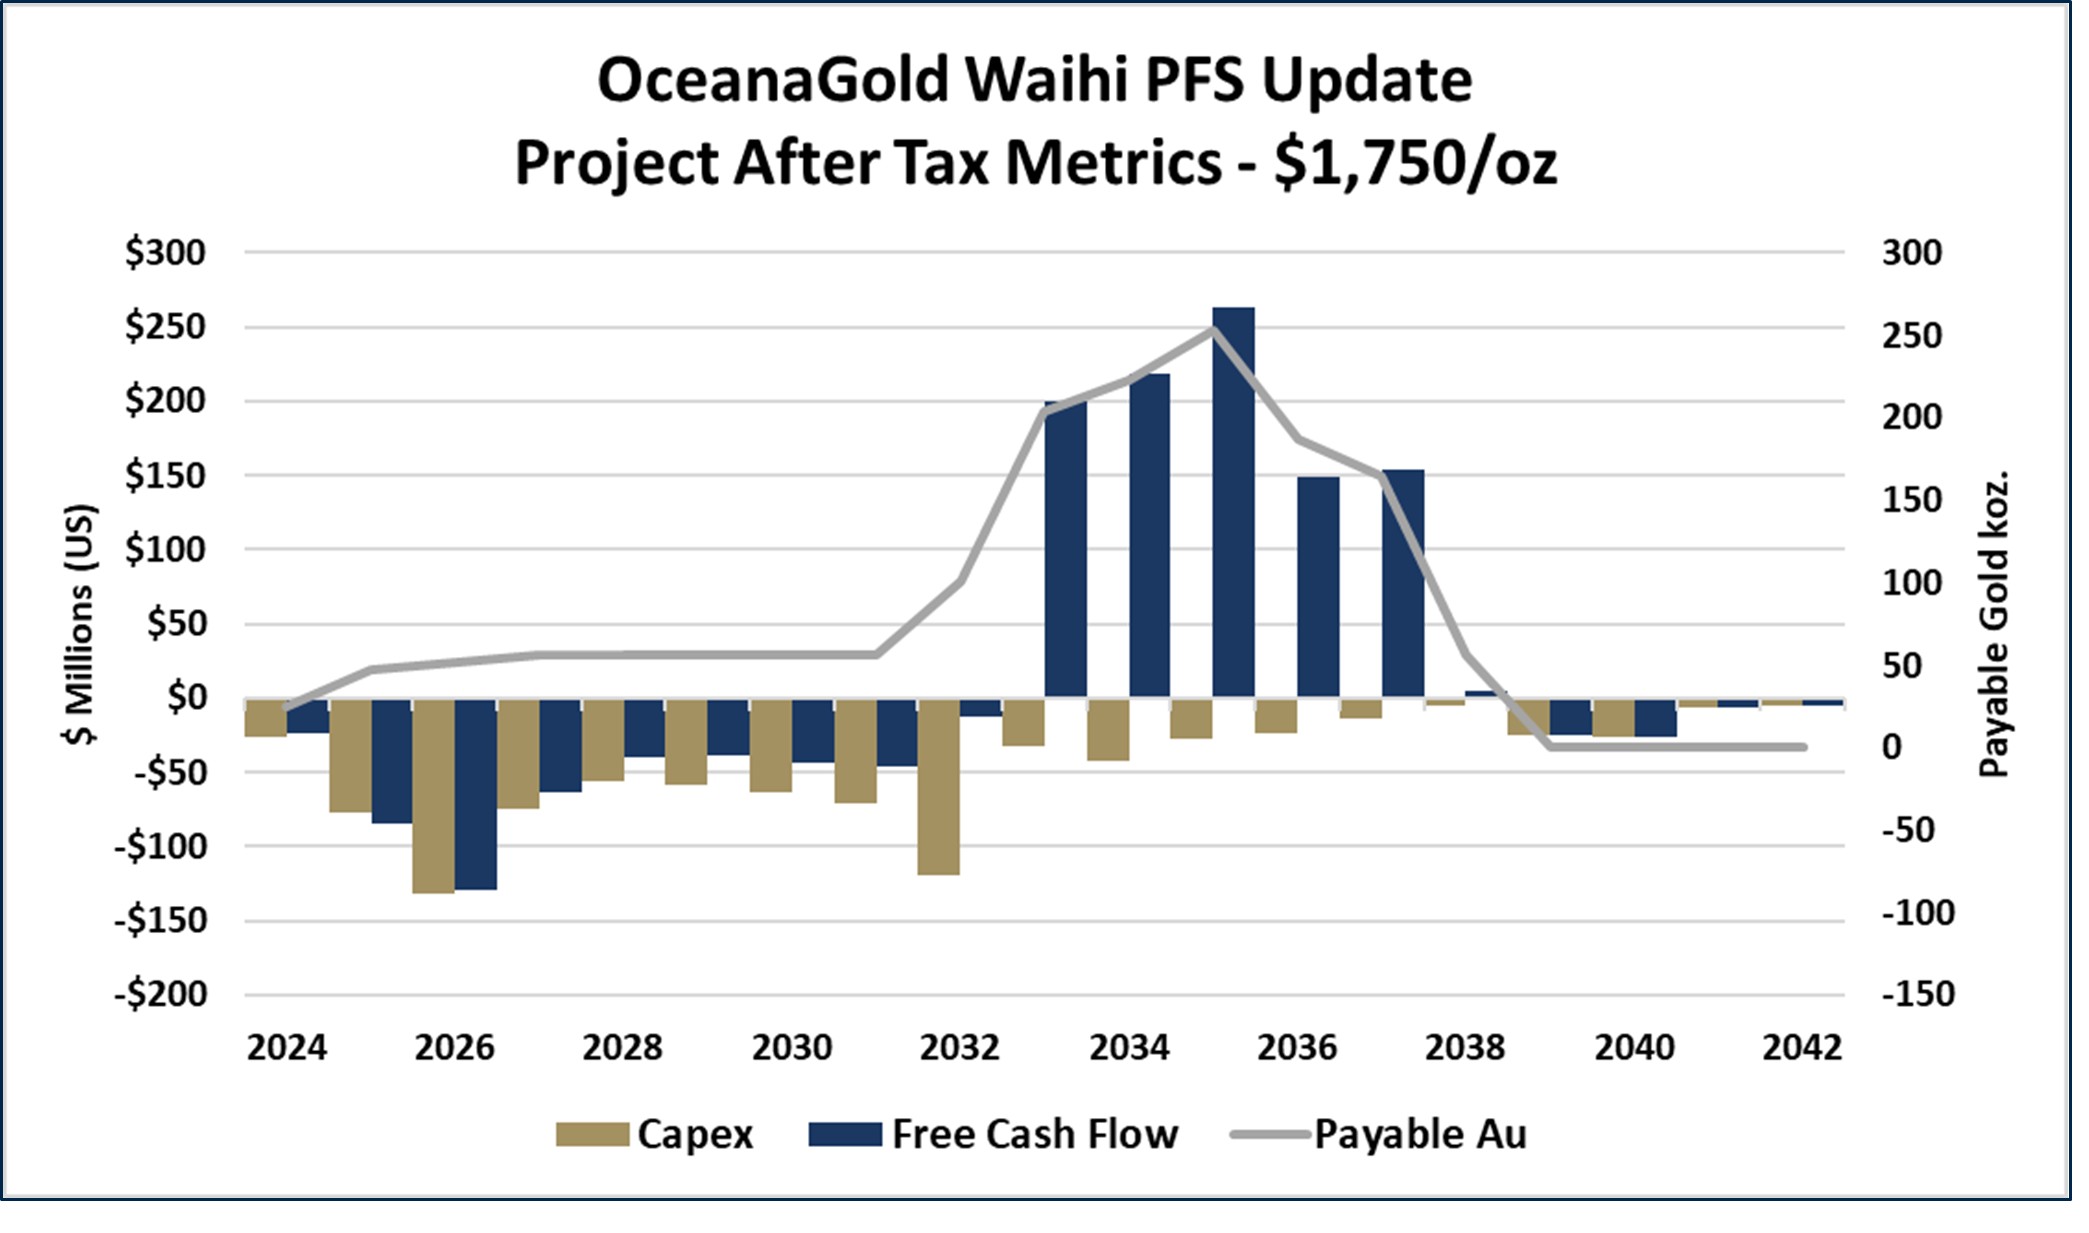
Figure 22-3: Project After-Tax Metrics Summary at $1,750 /oz Au
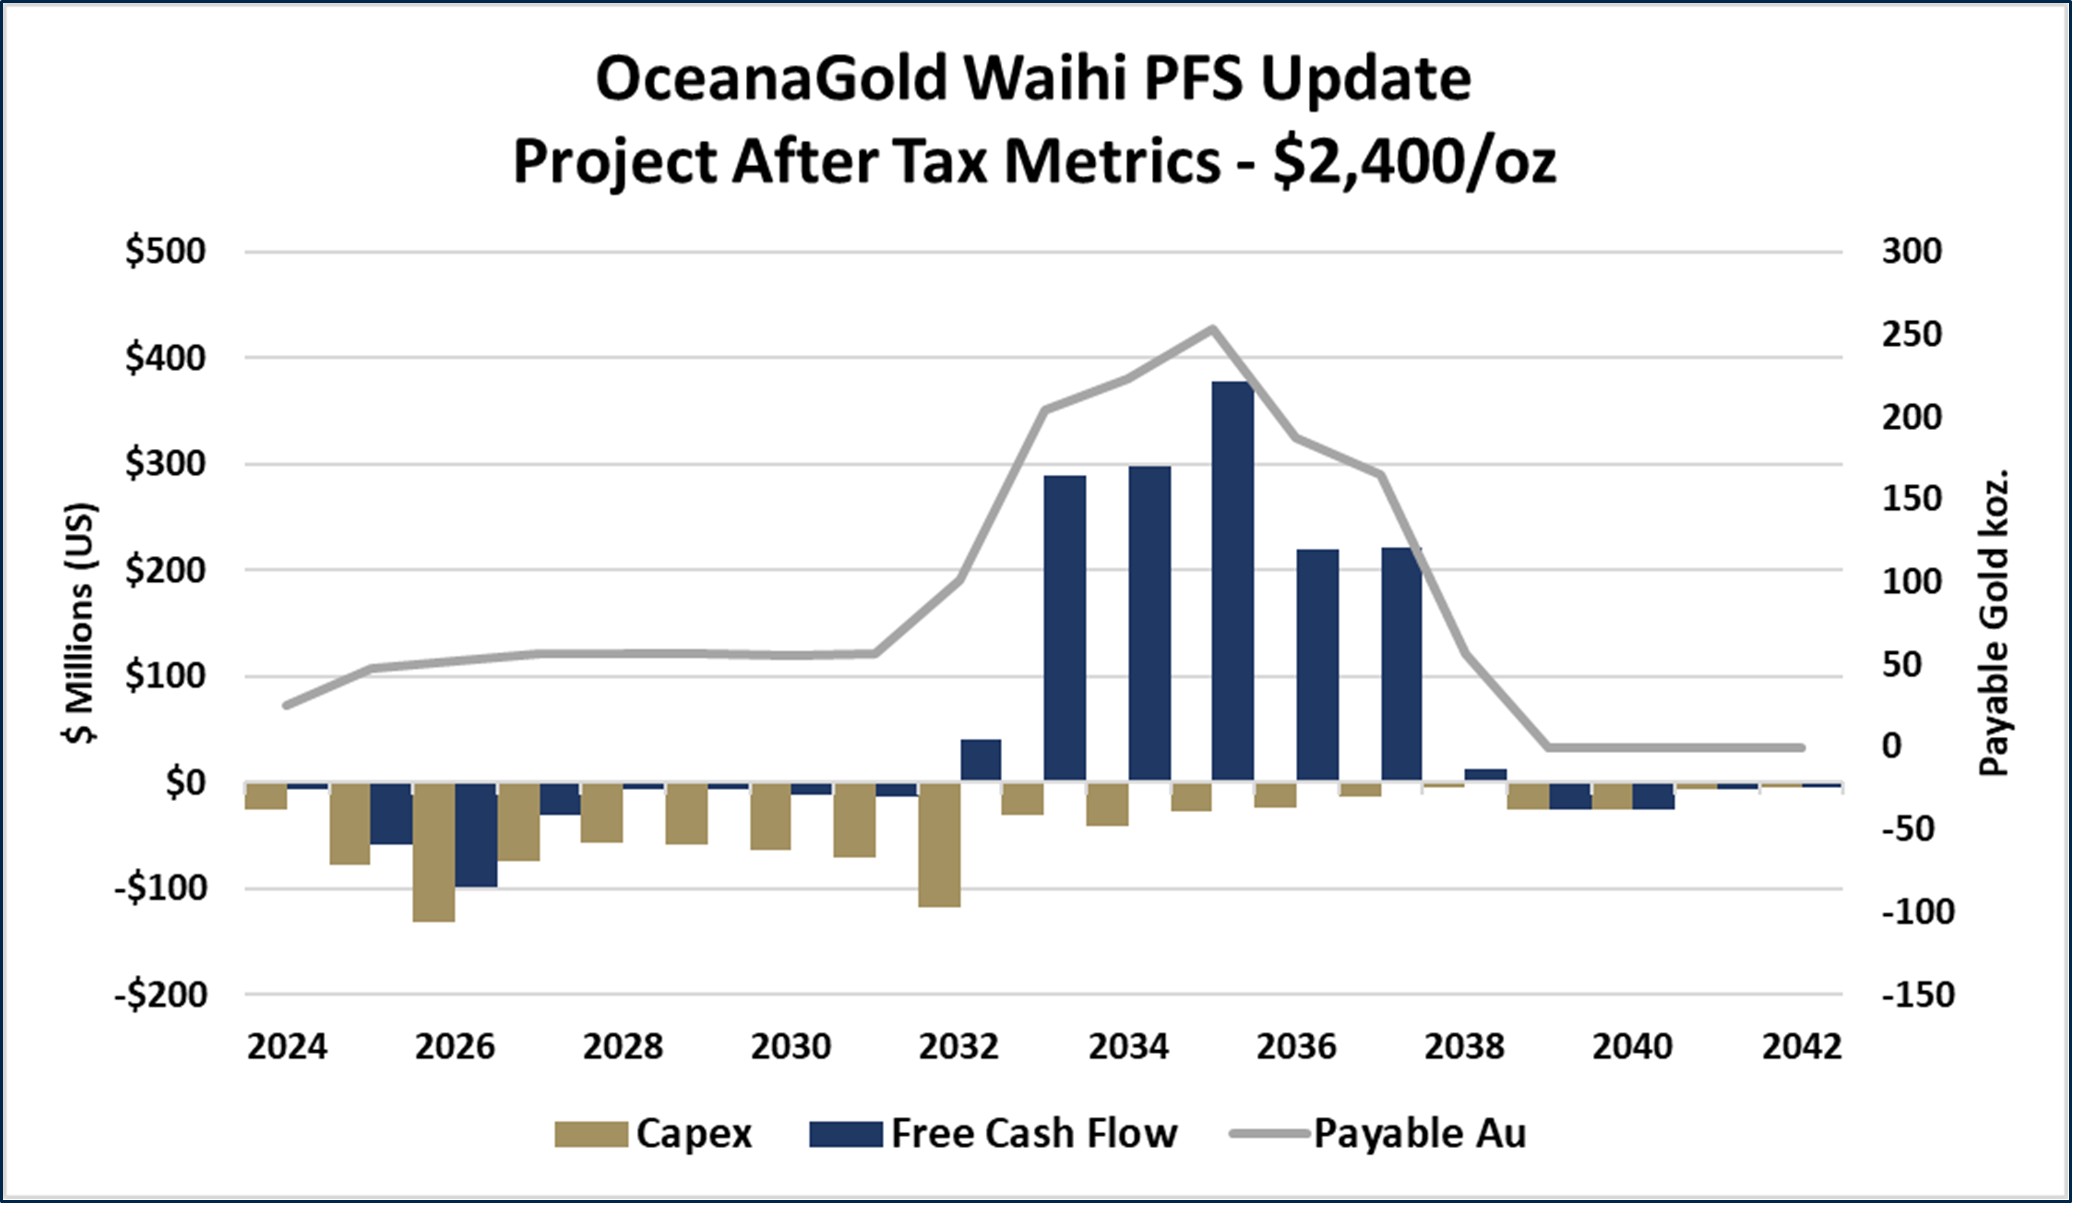
Figure 22-4: Project After-Tax Metrics Summary at $2,400 /oz Au
Document ID: STU-063-REP-002-0 Released: 11th December 2024Page 205 of 244
OceanaGold Corporation | ||
NI 43-101 Technical Report – Waihi District Pre-feasibility Study, New Zealand | ||
Table 22-7 shows the build-up of a AISC of $994 /oz Au, net of a $20 /oz silver by-product credit, over the
life of mine. Total payable gold sales is 1,593 koz as of 30th June 2024.
Table 22-7: LoM AISC Contribution
Description | $ 000’s | $/oz |
Mining | 753,223 | 473 |
Processing | 222,717 | 140 |
Site G&A | 191,026 | 120 |
Selling/Refining/Freight | 5,584 | 4 |
Carbon Costs / Other Costs | 28,232 | 18 |
Direct Cash Costs Before By-Product Credit | 1,200,783 | 754 |
Silver By-Product Credit | 54,598 | 34 |
Direct Cash Costs After By-Product Credit | 1,146,184 | 719 |
Royalties | 96,795 | 61 |
Non-Operating Cash Costs | 96,795 | 61 |
Sustaining Capex | 341,590 | 214 |
Total AISC | 1,584,570 | 994 |
Figure 22-5 shows the annual AISC trend over the life of mine. The improvement in AISC is due to the
commencement of WUG and is primarily due to the improvement in grade. Over the WUG production life
(2033-2038) the AISC is $634 /oz.
Document ID: STU-063-REP-002-0 Released: 11th December 2024Page 206 of 244
OceanaGold Corporation | ||
NI 43-101 Technical Report – Waihi District Pre-feasibility Study, New Zealand | ||
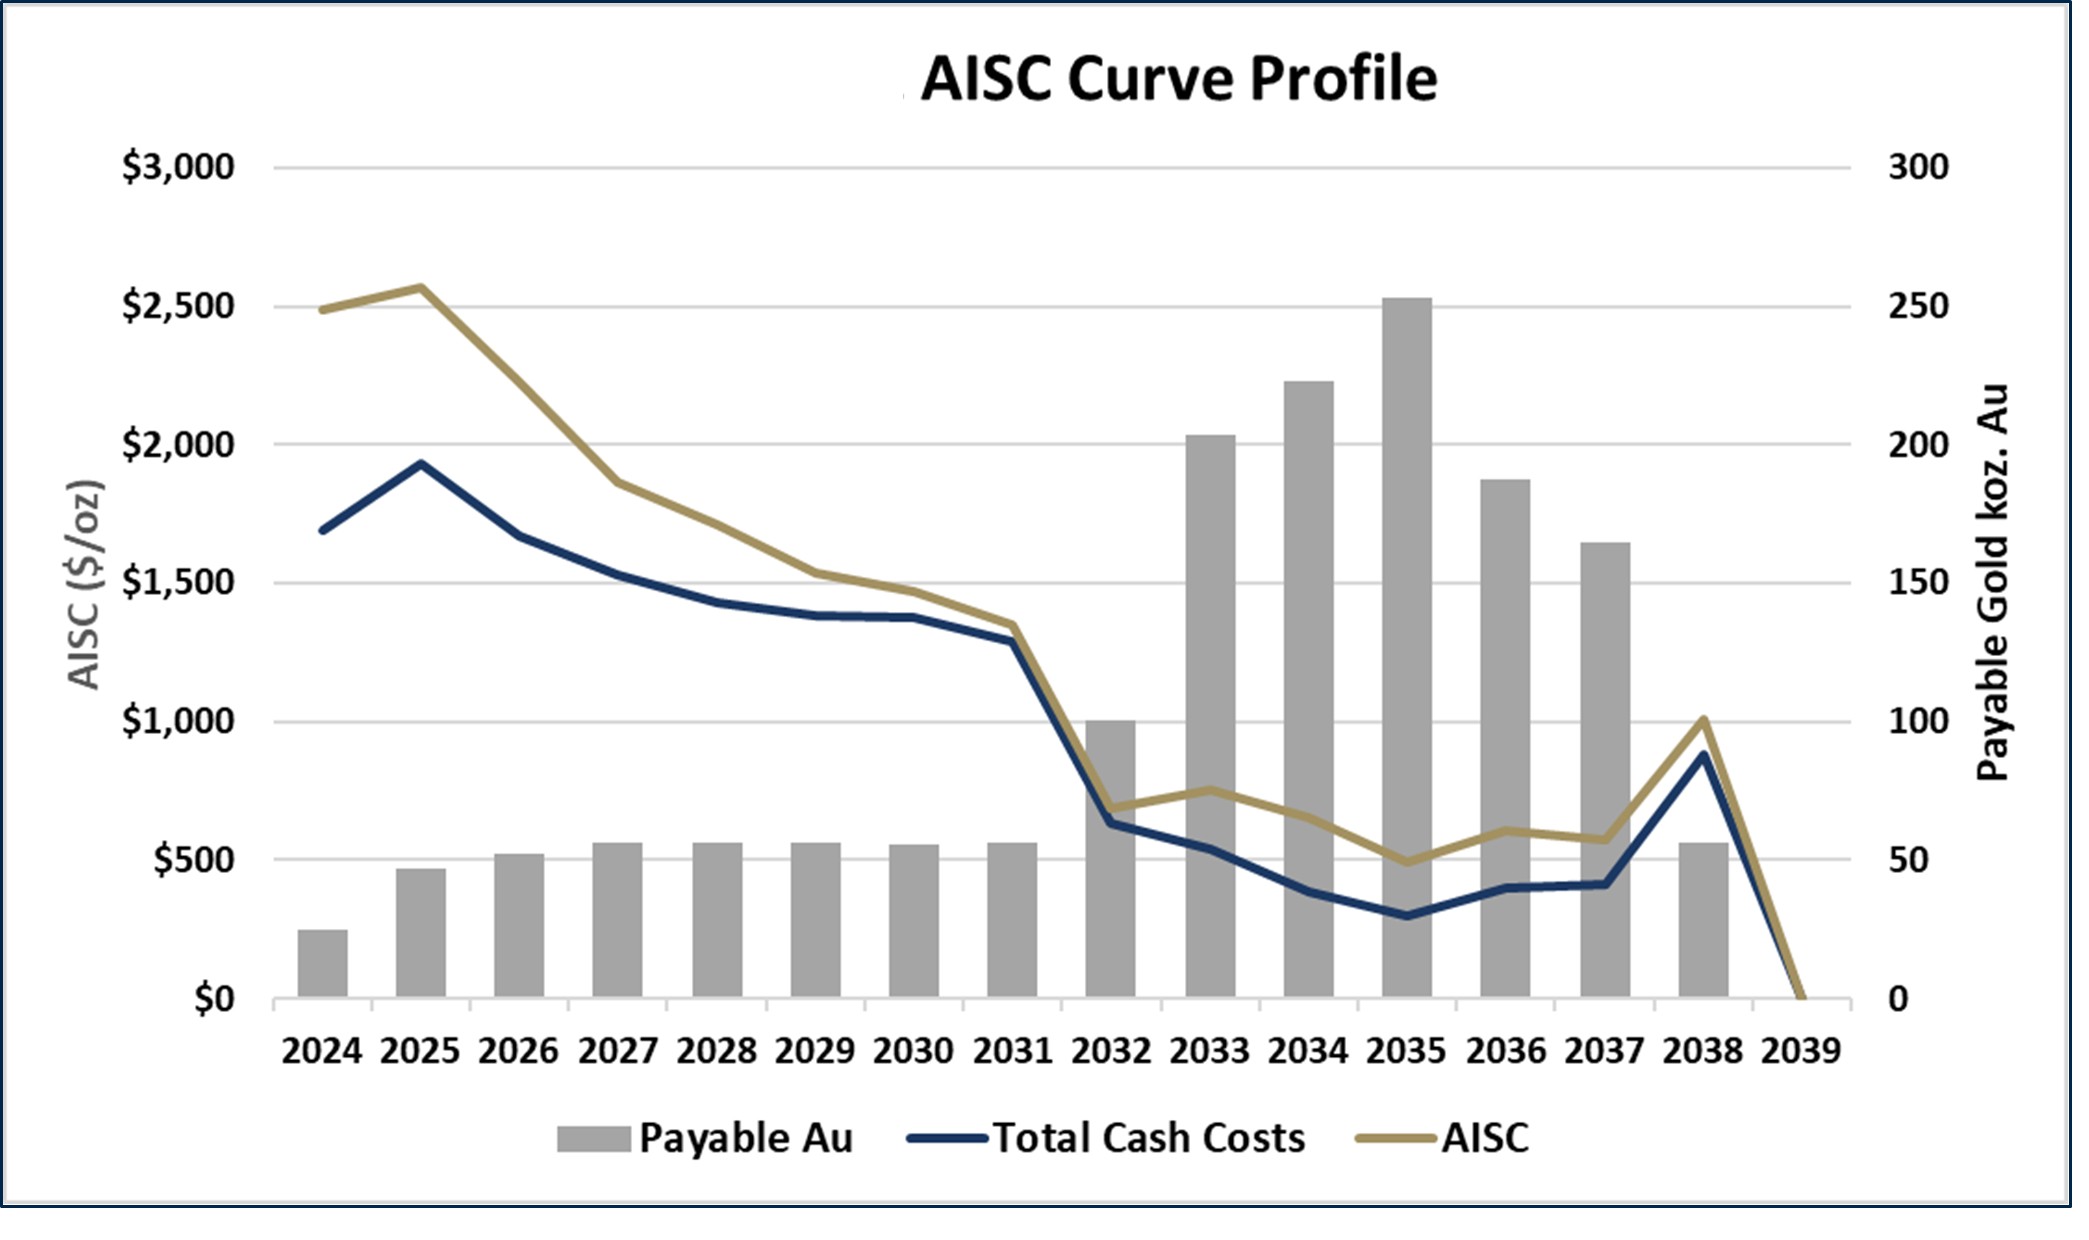
Figure 22-5: Annual AISC and Total Cash Cost Curve Profile
Table 22-8: Annual AISC Curve Profile
NI 43-101 All In Sustaining and Cash Cost Profile | |||||||||||||||
2024 | 2025 | 2026 | 2024 | 2025 | 2026 | 2024 | 2025 | 2026 | 2024 | 2025 | 2026 | 2024 | 2025 | 2026 | |
Payable Au | 25 | 47 | 52 | 57 | 57 | 57 | 56 | 56 | 101 | 204 | 223 | 253 | 188 | 165 | 57 |
RoM AISC $/oz | 2,484 | 2,570 | 2,224 | 1,868 | 1,711 | 1,537 | 1,471 | 1,348 | 685 | 757 | 654 | 494 | 605 | 572 | 1,010 |
22.3Taxes, Royalties and Other Interests
The main taxation assumptions utilized within the model are as follows:
•MUG and WUG royalties are payable to the NZ government at the greater of a 1 % royalty on net
sales revenue from gold and silver or 5 % of accounting profits
•In addition, parts of the Wharekirauponga Mining Permit, MP 60541, are subject to an additional
2 % of sales royalty payable to Osisko (acquired from Geoinformatics)
•The New Zealand corporate income tax (CIT) rate is 28 %. There are no state or municipal
income taxes in New Zealand
•Existing Net Operating Loss (NOL) pools are not considered.
Document ID: STU-063-REP-002-0 Released: 11th December 2024Page 207 of 244
OceanaGold Corporation | ||
NI 43-101 Technical Report – Waihi District Pre-feasibility Study, New Zealand | ||
The TEM was created on a project level basis and no fractional ownership, if applicable, was considered
in the result. Local authorities levy tax known as 'rates' on land within their territorial boundaries. Rates
are levied on properties based on the properties’ rateable value and included in the G&A costs.
Document ID: STU-063-REP-002-0 Released: 11th December 2024Page 208 of 244
OceanaGold Corporation | ||
NI 43-101 Technical Report – Waihi District Pre-feasibility Study, New Zealand | ||
22.4Sensitivity Analysis
22.4.1Operational Sensitivity
After-tax NPV sensitivity analyses for key operational parameters are shown in Figure 22-6 and is
nominally most sensitive to revenue. Sensitivities to capital and operating costs are similar but slightly
more susceptible to variations in operating costs.
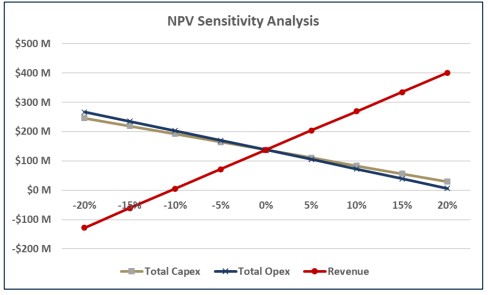
Figure 22-6: NPV Sensitivity Analysis
22.4.2Gold Price Sensitivity
Additional gold price sensitivity analyses are shown with after-tax cumulative cashflow at various constant
gold prices of $1,100, $1,500, $2,000 and $2,400. Figure 22-7 and Table 22-9 show the gold price
sensitivity analysis by year and compare with the Reserve case at $1,750 /oz Au.
Document ID: STU-063-REP-002-0 Released: 11th December 2024Page 209 of 244
OceanaGold Corporation | ||
NI 43-101 Technical Report – Waihi District Pre-feasibility Study, New Zealand | ||
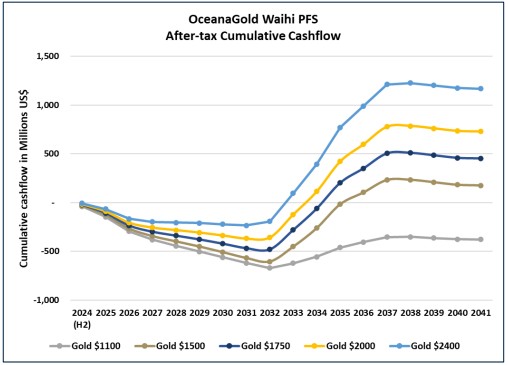
Figure 22-7: Gold Price Sensitivity Analysis
Table 22-9: Gold Price Sensitivity analysis
2024 (H2) | 2025 | 2026 | 2027 | 2028 | 2029 | 2030 | 2031 | 2032 | 2033 | 2034 | 2035 | 2036 | 2037 | 2038 | 2039 | 2040 | 2041 | |
Gold $1100 | -39 | -153 | -316 | -416 | -492 | -567 | -647 | -729 | -804 | -727 | -620 | -456 | -355 | -261 | -258 | -283 | -309 | -315 |
Gold $1500 | -29 | -125 | -267 | -344 | -398 | -451 | -509 | -569 | -605 | -452 | -262 | -17 | 105 | 232 | 233 | 208 | 182 | 176 |
Gold $1750 | -23 | -107 | -237 | -300 | -340 | -379 | -422 | -469 | -481 | -281 | -62 | 202 | 351 | 504 | 509 | 484 | 458 | 452 |
Gold $2000 | -17 | -91 | -208 | -257 | -283 | -308 | -338 | -370 | -359 | -123 | 113 | 420 | 597 | 777 | 784 | 760 | 733 | 727 |
Gold $2400 | -7 | -66 | -166 | -197 | -205 | -211 | -223 | -235 | -194 | 94 | 392 | 770 | 990 | 1,212 | 1,225 | 1,200 | 1,174 | 1,168 |
Note: For brevity rehabilitation years 2042 to 2048 are not shown in the Table or Chart. At gold price $1,100, $1,500,
$1,750, $2,000 and $2,400 /oz the final cumulative cashflow estimate is -$336M, $155M, $431M, $706M and
$1,147M respectively at completion of rehabilitation works.
Document ID: STU-063-REP-002-0 Released: 11th December 2024Page 210 of 244
OceanaGold Corporation | ||
NI 43-101 Technical Report – Waihi District Pre-feasibility Study, New Zealand | ||
The after tax NPV5 % and IRR for the gold price sensitivity cases are shown in Table 22-10.
Table 22-10: Gold Price
NI 43-101 Sensitivity to Gold price | ||
After tax NPV 5 % ($ M) | IRR (%) | |
Gold $1,100 | -387 | N/A |
Gold $1,500 | -52 | N/A |
Gold $1,750 | 138 | 9.2 % |
Gold $2,000 | 326 | 14.8 % |
Gold $2,400 | 621 | 24.0 % |
22.5OceanaGold Pricing Model Result
22.5.1Cash Flow Analysis
Key economic results are as presented in Table 22-11, using 1 July 2024 as the reference
commencement date and the cash flow summary is presented in Table 22-12 and Table 22-13.
Document ID: STU-063-REP-002-0 Released: 11th December 2024Page 211 of 244
OceanaGold Corporation | ||
NI 43-101 Technical Report – Waihi District Pre-feasibility Study, New Zealand | ||
Table 22-11: Key Economic Metrics
Financial Metric | Unit | Reserve Case Price | Alternative Case Price |
Gold Price | $/oz | 1,750 | 2,400 |
Exchange Rate | $: NZ$ | 0.61 | 0.61 |
Before-Tax | |||
NPV5% | $M | 259 | 902 |
Internal Rate of Return | % | 12 | 29 |
LoM Cumulative Free Cash Flow | $M | 648 | 1,629 |
After-Tax | |||
NPV5% | $M | 138 | 621 |
Internal Rate of Return | % | 9 | 24 |
LoM Cumulative Free Cash Flow | $M | 431 | 1,147 |
Payback Period | years | 11.2 | 9.7 |
Cash Costs C1 | $/oz | 719 | 719 |
AISC | $/oz | 994 | 1,026 |
Document ID: STU-063-REP-002-0 Released: 11th December 2024Page 212 of 244
OceanaGold Corporation | ||
NI 43-101 Technical Report – Waihi District Pre-feasibility Study, New Zealand | ||
Table 22-12: Cash Flow Summary Mineral Reserves (Reserve Case Price)
Description | TOTAL | 2024 | 2025 | 2026 | 2027 | 2028 | 2029 | 2030 | 2031 | 2032 | 2033 | 2034 | 2035 | 2036 | 2037 | 2038 | 2039 |
Payable (koz) | 1,593 | 25 | 47 | 52 | 56 | 56 | 56 | 56 | 56 | 101 | 204 | 222 | 253 | 187 | 165 | 57 | - |
Revenue | $ 000’s | ||||||||||||||||
Gross Gold Revenue | 2,788,394 | 43,316 | 82,467 | 91,272 | 98,852 | 98,804 | 98,847 | 97,400 | 98,159 | 176,164 | 356,133 | 389,181 | 442,370 | 327,844 | 288,516 | 99,072 | - |
Silver By-Product Credit | 54,598 | 1,478 | 2,906 | 3,615 | 2,681 | 2,568 | 2,698 | 2,421 | 1,797 | 6,614 | 5,768 | 5,355 | 5,781 | 4,619 | 4,475 | 1,822 | - |
Total Gross Revenue | 2,842,992 | 44,794 | 85,373 | 94,886 | 101,532 | 101,371 | 101,546 | 99,820 | 99,956 | 182,778 | 361,900 | 394,535 | 448,151 | 332,463 | 292,991 | 100,894 | - |
Operating Costs | $ 000’s | ||||||||||||||||
Mining | 753,223 | 29,651 | 67,089 | 62,695 | 60,709 | 54,783 | 51,940 | 49,717 | 43,998 | 39,399 | 80,886 | 56,317 | 47,397 | 45,711 | 38,706 | 24,224 | - |
Processing | 222,717 | 7,426 | 13,462 | 13,840 | 14,094 | 14,075 | 13,998 | 14,353 | 14,844 | 15,065 | 18,023 | 17,688 | 17,719 | 17,735 | 17,677 | 12,719 | - |
Site G&A | 191,026 | 6,197 | 13,277 | 13,277 | 13,277 | 13,277 | 13,277 | 13,277 | 13,277 | 13,277 | 13,102 | 13,102 | 13,102 | 13,102 | 13,102 | 13,102 | - |
Selling/Refining | 5,584 | 128 | 249 | 301 | 246 | 239 | 247 | 228 | 188 | 558 | 635 | 633 | 699 | 540 | 502 | 191 | - |
Other - Carbon Costs and stockpile movements | 28,232 | - | - | 778 | 1,091 | 1,224 | 1,391 | 1,551 | 2,022 | 2,255 | 3,541 | 3,464 | 3,225 | 3,332 | 2,707 | 1,651 | - |
Total Direct Operating Costs | 1,200,783 | 43,402 | 94,076 | 90,892 | 89,418 | 83,598 | 80,853 | 79,126 | 74,329 | 70,554 | 116,187 | 91,204 | 82,141 | 80,421 | 72,694 | 51,887 | - |
Royalties payable to Government | 58,213 | 447 | 851 | 946 | 1,013 | 1,011 | 1,013 | 996 | 998 | 3,250 | 8,585 | 10,348 | 12,837 | 7,910 | 7,001 | 1,007 | - |
Other Royalties | 38,582 | - | - | - | - | - | - | - | 17 | 1,598 | 6,444 | 7,871 | 8,943 | 6,619 | 5,248 | 1,842 | - |
Total Non-Direct Operating Costs | 96,795 | 447 | 851 | 946 | 1,013 | 1,011 | 1,013 | 996 | 1,015 | 4,848 | 15,029 | 18,219 | 21,780 | 14,529 | 12,249 | 2,849 | - |
Operating Cash Flow | 1,545,414 | 946 | 9,555 | 3,049 | 11,101 | 16,762 | 19,679 | 19,698 | 24,612 | 107,376 | 245,307 | 284,992 | 344,122 | 237,157 | 197,130 | 43,038 | - |
Income Tax | 217,309 | - | 22 | - | - | - | - | - | - | - | - | 22,647 | 52,847 | 65,789 | 40,227 | 35,776 | - |
Capital | $ 000’s | ||||||||||||||||
Sustaining Capital | 341,590 | 19,197 | 29,251 | 27,969 | 17,927 | 14,723 | 7,786 | 4,342 | 2,214 | 332 | 28,974 | 41,819 | 27,068 | 23,342 | 14,179 | 4,402 | 24,923 |
Non-Sustaining Capital | 555,807 | 6,793 | 47,974 | 103,933 | 56,466 | 41,542 | 50,589 | 59,011 | 68,337 | 118,353 | 2,808 | 0 | 0 | 0 | 0 | 0 | 0 |
Total Capital | 897,397 | 25,990 | 77,225 | 131,902 | 74,392 | 56,265 | 58,374 | 63,353 | 70,551 | 118,684 | 31,782 | 41,819 | 27,068 | 23,342 | 14,179 | 4,402 | 24,923 |
Metrics | $ 000’s | ||||||||||||||||
Pre-Tax Free Cash Flow | 648,017 | -23,046 | -84,337 | -129,108 | -63,424 | -39,831 | -38,837 | -43,735 | -46,201 | -12,219 | 199,933 | 241,655 | 316,221 | 215,032 | 193,777 | 40,205 | -24,923 |
After-Tax Free Cash Flow | 430,709 | -23,046 | -84,359 | -129,108 | -63,424 | -39,831 | -38,837 | -43,735 | -46,201 | -12,219 | 199,933 | 219,009 | 263,374 | 149,243 | 153,550 | 4,428 | -24,923 |
Rehabilitation years from 2040 to 2048 inclusive are not shown in Table but reflected in Totals.
Document ID: STU-063-REP-002-0 Released: 11th December 2024Page 213 of 244
OceanaGold Corporation | ||
NI 43-101 Technical Report – Waihi District Pre-feasibility Study, New Zealand | ||
Table 22-13. Cash Flow Summary Mineral Reserves (Alternative Case Price)
Description | TOTAL | 2024 | 2025 | 2026 | 2027 | 2028 | 2029 | 2030 | 2031 | 2032 | 2033 | 2034 | 2035 | 2036 | 2037 | 2038 | 2039 |
Payable (koz) | 1,593 | 25 | 47 | 52 | 56 | 56 | 56 | 56 | 56 | 101 | 204 | 222 | 253 | 187 | 165 | 57 | |
Revenue | US$ 000’s | ||||||||||||||||
Gross Gold Revenue | 3,824,083 | 59,404 | 113,097 | 125,172 | 135,568 | 135,502 | 135,562 | 133,577 | 134,618 | 241,596 | 488,410 | 533,733 | 606,678 | 449,615 | 395,679 | 135,870 | |
Silver By-Product Credit | 54,598 | 1,478 | 2,906 | 3,615 | 2,681 | 2,568 | 2,698 | 2,421 | 1,797 | 6,614 | 5,768 | 5,355 | 5,781 | 4,619 | 4,475 | 1,822 | |
Total Gross Revenue | 3,878,682 | 60,883 | 116,003 | 128,787 | 138,249 | 138,070 | 138,260 | 135,997 | 136,415 | 248,211 | 494,178 | 539,088 | 612,460 | 454,234 | 400,154 | 137,693 | |
Operating Costs | $ 000’s | ||||||||||||||||
Mining | 753,223 | 29,651 | 67,089 | 62,695 | 60,709 | 54,783 | 51,940 | 49,717 | 43,998 | 39,399 | 80,886 | 56,317 | 47,397 | 45,711 | 38,706 | 24,224 | - |
Processing | 222,717 | 7,426 | 13,462 | 13,840 | 14,094 | 14,075 | 13,998 | 14,353 | 14,844 | 15,065 | 18,023 | 17,688 | 17,719 | 17,735 | 17,677 | 12,719 | - |
Site G&A | 191,026 | 6,197 | 13,277 | 13,277 | 13,277 | 13,277 | 13,277 | 13,277 | 13,277 | 13,277 | 13,102 | 13,102 | 13,102 | 13,102 | 13,102 | 13,102 | - |
Selling/Refining | 5,584 | 128 | 249 | 301 | 246 | 239 | 247 | 228 | 188 | 558 | 635 | 633 | 699 | 540 | 502 | 191 | - |
Other - Carbon Costs and stockpile movements | 28,232 | - | - | 778 | 1,091 | 1,224 | 1,391 | 1,551 | 2,022 | 2,255 | 3,541 | 3,464 | 3,225 | 3,332 | 2,707 | 1,651 | - |
Total Direct Operating Costs | 1,200,783 | 43,402 | 94,076 | 90,892 | 89,418 | 83,598 | 80,853 | 79,126 | 74,329 | 70,554 | 116,187 | 91,204 | 82,141 | 80,421 | 72,694 | 51,887 | - |
Royalties payable to Government | 98,343 | 831 | 1,158 | 1,285 | 1,380 | 1,378 | 1,380 | 1,358 | 1,492 | 6,522 | 15,199 | 17,576 | 21,053 | 13,998 | 12,359 | 1,375 | |
Other Royalties | 52,742 | - | - | - | - | - | - | - | 23 | 2,185 | 8,808 | 10,760 | 12,227 | 9,047 | 7,174 | 2,516 | |
Total Non-Direct Operating Costs | 151,085 | 831 | 1,158 | 1,285 | 1,380 | 1,378 | 1,380 | 1,358 | 1,515 | 8,707 | 24,008 | 28,336 | 33,280 | 23,045 | 19,534 | 3,891 | |
Operating Cash Flow | 2,526,815 | 16,650 | 20,769 | 36,611 | 47,450 | 53,093 | 56,027 | 55,513 | 60,571 | 168,950 | 368,607 | 419,429 | 496,931 | 350,411 | 297,008 | 78,795 | |
Income Tax | 482,089 | - | 4,420 | 3,971 | 4,542 | 3,929 | 4,033 | 3,483 | 2,559 | 7,928 | 34,085 | 78,394 | 90,489 | 108,576 | 71,938 | 63,742 | |
Capital | $ 000’s | ||||||||||||||||
Sustaining Capital | 341,590 | 19,197 | 29,251 | 27,969 | 17,927 | 14,723 | 7,786 | 4,342 | 2,214 | 332 | 28,974 | 41,819 | 27,068 | 23,342 | 14,179 | 4,402 | 24,923 |
Non-Sustaining Capital | 555,807 | 6,793 | 47,974 | 103,933 | 56,466 | 41,542 | 50,589 | 59,011 | 68,337 | 118,353 | 2,808 | 0 | 0 | 0 | 0 | 0 | 0 |
Total Capital | 897,397 | 25,990 | 77,225 | 131,902 | 74,392 | 56,265 | 58,374 | 63,353 | 70,551 | 118,684 | 31,782 | 41,819 | 27,068 | 23,342 | 14,179 | 4,402 | 24,923 |
Metrics | |||||||||||||||||
Pre-Tax Free Cash Flow | 1,629,418 | -7,473 | -54,133 | -95,573 | -27,098 | -3,498 | -2,490 | -7,915 | -10,244 | 49,118 | 322,681 | 375,991 | 468,868 | 328,638 | 293,773 | 76,842 | -24,923 |
After-Tax Free Cash Flow | 1,147,329 | -7,473 | -58,552 | -99,544 | -31,640 | -7,428 | -6,523 | -11,398 | -12,803 | 41,190 | 288,596 | 297,597 | 378,379 | 220,062 | 221,834 | 13,099 | -24,923 |
Rehabilitation years from 2040 to 2048 inclusive are not shown in Table but reflected in Totals.
Document ID: STU-063-REP-002-0 Released: 11th December 2024Page 214 of 244
OceanaGold Corporation | ||
NI 43-101 Technical Report – Waihi District Pre-feasibility Study, New Zealand | ||
23ADJACENT PROPERTIES
There are no adjacent properties that are relevant to this report.
Document ID: STU-063-REP-002-0 Released: 11th December 2024Page 215 of 244
OceanaGold Corporation | ||
NI 43-101 Technical Report – Waihi District Pre-feasibility Study, New Zealand | ||
24OTHER RELEVANT DATA AND INFORMATION
New Zealand has an established framework that is well regulated and monitored by a range of
regulatory bodies. OceanaGold has dedicated programs and personnel involved in monitoring
consent compliance and works closely with authorities to promptly address additional requests for
information. Risks associated with review and renewal of operating consents is, upon that basis,
regarded as manageable within the ordinary course of business.
OceanaGold holds a suite of land ownership, surface access rights and resource consents authorising
existing operations within the MP 41808 area and a range of the activities proposed for the WNP
within the MP 41808 and MP 60541 areas. Processes to secure the remaining land access rights,
permits, consents and approvals are underway or planned, including through the government’s
proposed Fast-track Approvals Bill in which the WNP is a listed project.
No additional information or explanation is necessary to make this Technical Report understandable
and not misleading.
Document ID: STU-063-REP-002-0 Released: 11th December 2024Page 216 of 244
OceanaGold Corporation | ||
NI 43-101 Technical Report – Waihi District Pre-feasibility Study, New Zealand | ||
25INTERPRETATION AND CONCLUSIONS
Following review of the data available on the Waihi District Study, the QPs have reached the following
interpretations and conclusions.
25.1Geology and Mineralization
The Martha, Gladstone and Wharekirauponga deposits are located within the Coromandel Peninsula
which hosts over fifty gold and silver deposits that make up the Hauraki Goldfield. The peninsula is
built up of Miocene to Quaternary volcanic rocks, the Coromandel Volcanic Zone (CVZ) overlying a
Mesozoic basement. It is bound to the west by the Hauraki Rift, a large graben filled with Quaternary
and Tertiary sediments, and to the south by volcanics deposited by the presently active Taupo
Volcanic Zone (TVZ).
The geological understanding of the setting, lithologies, and structural and alteration controls on
mineralization is sufficient to support estimation of Mineral Resources and Mineral Reserves. The
geological knowledge of the area is also considered sufficiently acceptable to reliably inform mine
planning. The mineralization style and setting are well understood and can support declaration of
Mineral Resources and Mineral Reserves. The deposit displays classic features that are typical of
volcanic-hosted epithermal Au deposits. The QP considers the model and interpreted deposit genesis
to be appropriate to support exploration activities.
25.2Resource Estimation
The drillhole database and Resource estimation methodology are appropriate for the purposes of
estimating the open pit and underground Mineral Resources. OceanaGold has completed industry
standard Resource definition drilling at the MOP, GOP, MUG and WUG deposits to support the current
Mineral Resource estimations. Regular internal peer reviews and, where appropriate, independent
external reviews, of the geological and estimation processes are undertaken. The results of the
drilling, sampling, analytical testing, core logging and geologic interpretation provide good support for
an industry standard Resource estimation. A summary of the Resource estimates is shown in Table
14-22.
OceanaGold is not aware of any environmental, permitting, legal, socio-economic, marketing, political,
or other factors that might materially affect the Mineral Resource estimates. The QPs acknowledge
that the consenting timeline is a risk, however, are satisfied with the Company’s risk mitigation plans.
25.3Status of Exploration, Development and Operations
Exploration activities since 1986 comprised surface reconnaissance exploration, geological and
structural mapping, geochemical sampling, airborne, ground, and downhole geophysical surveys,
surface and underground drilling, engineering studies and mine development.
The exploration programs completed to date are appropriate to the style of the deposit and prospects.
The research work supports the genetic interpretation of the Waihi vein deposits.
The majority of surface drilling was by triple tube wireline diamond methods. Surface holes are
collared using large-diameter PQ core, both as a means of improving core recovery and to provide
greater opportunity to case off and reduce diameter when drilling through broken ground and historic
stopes. Drill hole diameter is usually reduced to HQ at the base of the post mineral stratigraphy. RC
drilling is mostly confined to the immediate pit vicinity, or isolated first pass exploration drill holes.
Document ID: STU-063-REP-002-0 Released: 11th December 2024Page 217 of 244
OceanaGold Corporation | ||
NI 43-101 Technical Report – Waihi District Pre-feasibility Study, New Zealand | ||
The quantity and quality of the lithological, geotechnical, collar and downhole survey data collected in
the exploration, delineation, underground, and grade control drill programs are sufficient to support
Mineral Resource and Mineral Reserve estimation. Sampling methods are acceptable, meet industry-
standard practice, and are acceptable for Mineral Resource and Mineral Reserve estimation and mine
planning purposes.
Approximately 370 km of diamond core has been drilled within the Martha and Gladstone areas since
1980 (as of June 2024) and WUG has had ~64 km of diamond drilling since 1980 (as of June 2024).
Additionally, 86 km has been drilled in approximately 4,500 reverse circulation grade control holes
during the open pit operation. Recent diamond drilling has largely focused on the Wharekirauponga,
Martha and Gladstone deposits. The exploration programs completed to date are appropriate to the
style of the deposit and prospects.
25.4Geotechnical, Hydrology, Mining and Reserves
25.4.1Geotechnical
At Wharekirauponga, a geotechnical field characterisation program has been undertaken to assess
the expected rock quality. This program included logging core, laboratory strength testing, in situ
stress measurements and oriented core logging of jointing. The results of this program have provided
adequate quantity and quality data for prefeasibility-level design of the underground workings.
A geotechnical assessment of the orebody shape and ground conditions has determined that a
combination of modified Avoca and longhole open stoping mining are appropriate mining methods.
Stopes have been sized to maintain stability once mucked empty. For the bulk stopes, a primary/
secondary extraction sequence with tight backfilling allows optimization of ore recovery while
maintaining ground stability. Primary stopes will be backfilled with cemented rockfill, while secondary
stopes will be backfilled with cemented and uncemented waste rock.
The WUG Mine geotechnical risks are assessed to be hydrology and hydrogeological conditions for
development, LoM crown stability for production, and excessive overlying cover and poor rock
conditions for ventilation rises requiring pre-conditioning or consolidation. Control measures include
footwall infrastructure drilling, structural geology assessments and numerical modelling to optimise
current empirical assessments and LoM crown stability.
The Willows geotechnical investigations have included the waste rock stack (WRS) foundation and
slope stability, contact and seepage water control measures, portal slope stability, portal box cut and
WRS toe interaction, underground tunnel and infrastructure stability and Ventilation Shaft 1 site
selection, depth of cover and stability. Initial geotechnical investigations at Willows portal, tunnel WRS
and Ventilation Shaft 1 have encountered varying weak weathered to strong fresh andesite generally
overlain by ash tuff materials. Studies have confirmed that there are no deep-seated instability risks.
The TSF3 geotechnical considerations include quality and methods of extraction for borrow sources,
staging of borrow quarrying and starter and embankment development, foundation engineering,
seepage and PAF encapsulation. Significant work has been progressed to identify suitable competent
material required to build TSF3 in a cost-effective manner.
Document ID: STU-063-REP-002-0 Released: 11th December 2024Page 218 of 244
OceanaGold Corporation | ||
NI 43-101 Technical Report – Waihi District Pre-feasibility Study, New Zealand | ||
25.4.2Hydrogeology and Hydrology
A wide range of specialist technical studies have been undertaken to date, looking at effects on the
environment and water ingress potential from dewatering of WUG. This included hydrology and
hydrogeological data collection, numerical groundwater modelling and uncertainty analysis. The
geology is characterized by low-permeability, low-storage Andesite or Rhyolite with structurally
controlled storage and flux/transmissivity. The technical studies undertaken have assessed minor
impact on surface bodies and ecology from mining activities at WUG.
25.4.3Mining
Mineral Resources and Mineral Reserves have been estimated using core drill data, performed to
industry best practices, and conform to the requirements of CIM Definition Standards on Mineral
Resources and Reserves (2014). The Mineral Reserves are acceptable to support mine planning.
Reviews of the environmental, permitting, legal, title, taxation, socio-economic, and marketing factors
and constraints support the declaration of Mineral Reserves using the set of assumptions outlined.
Resource and Reserve estimates have been based on assumptions, which are considered
appropriate, for commodity prices, metallurgical recovery, changes to the geotechnical and
hydrogeological parameters used for stope and open pit mine design, dilution, and changes to capital
and operating costs. Tonnage and grades presented in the Mineral Reserve include dilution and
recovery and are benchmarked to the existing MUG operation as well as other similar operations.
MUG is an operating mine. Productivities have been adjusted based on existing productivities
achieved and also taking into account any future scheduled activities.
WUG productivities were developed from a combination of existing MUG benchmarking, first
principles and benchmarking against similar projects where applicable. Equipment used in this study
is standard equipment used worldwide with only standard package/automation features.
The UG production schedule was completed using Deswik® scheduling software and is based on
mining operations occurring 365 days/year, seven days/week, with two 12-hr shifts each day. A
production rate of approximately 2,200 t/d was targeted for WUG with ramp-up to full production as
quickly as possible. Resource levelling was used for ore tonnage and lateral development.
A workable ventilation plan was developed to support the mining fleet that satisfied the NZ Mining
Regulations for both MUG and WUG.
MUG support infrastructure is largely in place. No infrastructure is in place for WUG.
25.4.4Mineral Reserves
Measured Mineral Resources were converted to Proven Mineral Reserves, and Indicated Mineral
Resources were converted to Probable Mineral Reserves by applying appropriate modifying factors.
MUG mining Reserves of 4.4 Mt (diluted) with an average grade of 3.8 g/t Au and WUG Reserves of
are 4.1 Mt (diluted) with an average grade of 9.2 g/t Au presented in Table 15-4.
Document ID: STU-063-REP-002-0 Released: 11th December 2024Page 219 of 244
OceanaGold Corporation | ||
NI 43-101 Technical Report – Waihi District Pre-feasibility Study, New Zealand | ||
25.5Mineral Processing, and Water Treatment
25.5.1Mineral Processing
Metallurgical test work and associated analytical procedures are appropriate to the mineralization
type, appropriate to establish the optimal processing routes, and were performed using samples that
are typical of the mineralization styles found.
Samples selected for testing were representative of the various types and styles of mineralization.
Samples were selected from a range of depths within the deposit. Sufficient samples were taken so
that tests were performed on sufficient sample mass. As mining progresses deeper and/or new mining
zones are identified, additional variability tests will be undertaken as required.
Mill process recovery factors are based on production data or from ore composite test work and are
considered appropriate to support Mineral Resource and Mineral Reserve estimation, and mine
planning.
Metallurgical testwork on WUG supports ongoing use of the existing process flowsheet with plant
expansions to enable higher throughput rates. These expansions will be timed to align with the
development of new orebodies. Key elements of the expansions include installation of a jaw crusher,
replacement of the ball mill with a 1.8 MW tower mill; refurbishment of the adsorption circuit; and new
pumps and pipework for delivery of tailings to TSF3. This will increase throughput capacity from 0.66
to 0.8 million tonnes per annum of underground ore.
25.5.2Water Treatment
It is estimated that WUG, including the tunnels will generate 12,000 m3/d of water, dependent on the
number of structures intersected and permeability of rock. It is estimated that the Willows Waste Rock
Stack generate up to 20,000 m3/d, and MUG 15,000 m3 per day, with a combined total less than the
Regime E high river flow discharge limit. The design capacity of the expanded WTP is double that of
the existing infrastructure – 1,800 m3/hr for metals removal and 500 m3/hr for cyanide destruction and
metals removal.
25.6Project Infrastructure
MUG uses the existing process facilities, tailings storage, water treatment facilities and other site
infrastructure. Power is supplied through the local utility, provided from the national grid and supplied
to the Company’s substation. Sufficient tailings storage facilities have been planned for the MUG,
involving lifts on existing TSF’s.
New surface facilities and infrastructure at Willows will be required for WUG, including:
•Waste rock stack
•Boxcut portal façade excavation
•Access road to portal
•Bulk earthworks and drainage
•Collection/Silt ponds and associated pumping requirements
•Surface Facilities Area, including workshop, warehouse, bathhouse, substations, offices,
parking, fuel and explosives storage, washbays
•An upgrade of the existing SH 25 and Willows Road intersection.
Document ID: STU-063-REP-002-0 Released: 11th December 2024Page 220 of 244
OceanaGold Corporation | ||
NI 43-101 Technical Report – Waihi District Pre-feasibility Study, New Zealand | ||
A services trench between the Processing Plant and Willows (approximately 5 km) for water
treatment, potable water, mine dewatering, electrical supply and communications (fibre optic cables)
A new tailings storage facility, TSF3, is to be constructed adjacent to existing tailings facilities at
Baxter Road for the Waihi Operations, featuring downstream construction and associated stockpiles,
containment ponds and diversion drains.
The capacity of the water treatment plant (WTP) will be doubled to allow treatment of mine dewatering
from WUG and decant water off TSF3.
A high voltage (HV) power upgrade will also be required from the Transpower Waikino grid exit point
(GXP) in Hauraki District Council (HDC) Road Reserve to a new 33 kV / 11 kV substation at the
Baxter Road Waihi operations.
25.7Mineral Tenure, Surface Rights, Royalties, Environment, Social and
Permits
25.7.1Mineral Tenure and permitting
MUG falls within MP 41808, with a duration out to March 21st, 2044. WUG falls within MP 60541, with
a duration out to August 4th, 2060. Both permits are in good standing.
OceanaGold holds a suite of land ownership, surface access rights and resource consents authorising
existing operations within the MP 41808 area and a range of the activities proposed for the WNP
within the MP 41808 and MP 60541 areas. Processes to secure the remaining land access rights,
permits, consents and approvals are underway or planned, including through the government’s
proposed Fast-track Approvals Bill in which the WNP is a listed project.
25.7.2Martha
All permits are in place for MUG and Martha Phase 4 pit. Mining tenure held by OceanaGold in the
areas for which Mineral Resources and Mineral Reserves are estimated is valid.
OceanaGold holds sufficient surface rights to support mining operations over the planned life of mine
that was developed based on the Mineral Reserves. Permits held by OceanaGold are sufficient to
ensure that mining activities are conducted within the regulatory framework required by New Zealand
law.
OceanaGold has sufficiently addressed the environmental impact of the operation, and subsequent
closure and remediation requirements that Mineral Resources and Mineral Reserves can be declared,
and that the mine plan is appropriate and achievable. Closure provisions are appropriately
considered. Monitoring programs are in place.
The existing infrastructure, availability of staff, the existing power, water, and communications
facilities, the methods whereby goods are transported to the mine, and any planned modifications or
supporting studies are sufficiently well-established, or the requirements to establish such, are well
understood by OceanaGold, and can support the declaration of Mineral Resources and Mineral
Reserves and the current mine plan.
The mine currently holds the appropriate social licenses to operate. OceanaGold has developed a
community’s relations plan to identify and ensure an understanding of the needs of the surrounding
communities and to determine appropriate programs for filling those needs. The Company monitors
socio-economic trends, community perceptions and mining impacts.
Document ID: STU-063-REP-002-0 Released: 11th December 2024Page 221 of 244
OceanaGold Corporation | ||
NI 43-101 Technical Report – Waihi District Pre-feasibility Study, New Zealand | ||
25.7.3WUG
Permits are required to enable the WNP to proceed. Applications for resource consents were lodged
in June 2022 and the Company has subsequently undertaken additional field studies and analysis in
order to satisfy requests for further information from the Council regulators largely related to
groundwater, surface water, wetland, and ecology. The Company’s expectation is that the process of
gaining consents and approvals for WNP will move to come under the proposed Fast-track Approvals
Bill following its passage into law and becoming operational (scheduled for the first quarter of 2025)
and that permits would be obtained under this legislation, in a form allowing works to commence,
before the end of 2025.
25.8Economic Analysis
The Mineral Reserves case is presented using underground Mineral Resources. Mineral Reserves
are declared for the first time at WUG.
•Total capital costs are $897 M, including $556 M growth capital. Total operating costs,
including mining, processing, and G&A, are $1,201 M, or $141.8 per tonne of ore including
carbon costs. Carbon costs have been estimated at $27 million. All-In Sustaining Cost (AISC)
averages $994 /oz, with life of mine cash cost $717 /oz.
•The cumulative undiscounted free cash flow after tax been calculated at $431 M. The average
free cash flow is $30 M per year with the highest year for free cash flow in 2035 at $263
million.
•For $1,750 /oz gold price and 5 % discount rate, pre-tax NPV is $259 M and after-tax NPV is
$138 M. Pre-tax IRR is 12 % and after-tax IRR is 9 %.
Structured risk assessments have shown that the key project risks lie in:
•defining the geological Resource and grade estimation
•project staffing
•geotechnical and hydrogeological conditions in the WUG access tunnel, and ventilation shaft
•geotechnical conditions associated with waste storage facilities
•higher than expected dewatering volumes and rates at WUG
•capital cost overruns
•consent conditions and delays to finalising consents.
Mitigation plans have been developed to address or control these risks.
Document ID: STU-063-REP-002-0 Released: 11th December 2024Page 222 of 244
OceanaGold Corporation | ||
NI 43-101 Technical Report – Waihi District Pre-feasibility Study, New Zealand | ||
26RECOMMENDATIONS
26.1Recommended Work Programs
26.1.1Geology, Mineralization and Resource Estimation
A broad development and drilling strategy is recommended to extend WUG Resources in a south-
westward direction from Drill Site 9. Infill drilling in the northern and central area of WUG will be a
target in 2025 and 2026, to convert Inferred Au Resources to Indicated. This includes 5,000 m of
planned and budgeted conversion drilling in 2025.
The key activities include:
•Identify opportunities through access agreements or the Fast track consenting program to
provide additional exploration drilling sites at WUG
•Analysis of the Q4 2024 geophysical survey along the alignment of the main WUG access
incline to identify potentially faulted or water bearing structures and weathering horizons to
assist in mine design
•Conduct suitable sterilisation of any selected decline route where appropriate or, otherwise
demonstrate that any incidental ore discovery along the route will not be sterilized.
A rolling front of pre-production infill drilling at approximately 15 m x 15 m spacing will be maintained
from underground development to improve confidence in tonnage and grade estimates supporting the
mine plan. Future capital development and resource infill drilling will further improve the geological
interpretation.
•Study grade control strategy including data spacing studies and investigating the potential for
underground, reverse circulation, grade control drilling
•Identify whether close spaced, short, ore-drive parallel diamond drilling is the preferred option
for grade control drilling.
OceanaGold will continue to expand resources adjacent to underground Reserves in the Waihi district
through core drilling aligned with LoM plans. Systematic target generation and rationalisation
supported by mapping, drilling, geochemistry, and geophysics is expected to yield new discoveries
during the next five years, particularly for underground deposits.
26.1.2Mine Planning, Reserves and Geotechnical Investigations
Key recommendations relating to the mine planning include completing:
•Extensional and infill drilling to further optimise capital infrastructure requirements
•Continue geotechnical investigations for WUG including data collection for crown pillar area,
footwall development and EG Vein areas, investigative drillholes for each ventilation shaft and
numerical modelling for both crown and pillar stability
•Material balance analysis for TSF construction options
•Willows waste rock stack design and construction methodologies provided by EGL
•Willows Portal boxcut and tunnel will be provided by PSM
•Ventilation Shaft 1 on Willows to be undertaken by PSM
•Mine equipment fleet and material handling optioneering
•Staged ventilation modelling and optimisation.
Document ID: STU-063-REP-002-0 Released: 11th December 2024Page 223 of 244
OceanaGold Corporation | ||
NI 43-101 Technical Report – Waihi District Pre-feasibility Study, New Zealand | ||
26.1.3Metallurgy and Processing
The process plant flowsheet is effectively fixed and established on site. Ongoing future ores testwork
programs should continue to inform forecasting assumptions and identify (and address) potential risks
to production targets.
Infill drilling presents the opportunity to continue test work on available core samples to confirm
hardness and recovery estimates for any new Reserves that are defined. This should occur as
material becomes available to de-risk the use of existing throughput and recovery models.
26.1.4Project Infrastructure
Detailed design and execution works is planned for the services trench to join the Processing Plant to
Willows, the water treatment plant upgrade, and bulk earthworks for Willows. Geotechnical
investigations will continue to enable portal boxcut and waste rock stack detailed design, and the first
1.5 km of decline to Ventilation Shaft No.1.
A geotechnical borehole investigation will be conducted around the ridges to the east of the proposed
TSF3 and borrow pits to identify suitable materials for construction of the embankment and extent of
earthworks required.
Additional infrastructure design works includes:
•undertake drilling with man portable drill rig that does not require vegetation clearance to
identify near surface conditions favourable for construction of the ventilation shafts within the
Coromandel Forest Park
•confirming the methodology for construction of ventilation shafts with specialist contractors
•confirming the suitability of the proposed plant upgrade as metallurgical testwork and mine
schedule plans are updated
•completion of detailed design for the 33 kV buried powerline upgrade from Waikino and the
Baxter Road and Willows substations.
26.1.5Environmental Study
Continue collection of baseline data and refinement of an integrated hydrogeological and hydrological
model(s).
26.1.6Permitting and Consenting
As part of the proposed fast-track consent application, develop staged / separate groups of the WNP’s
activities within the application to prioritise the processing of approvals for works relating to activities
that would be undertaken in the next two years, over the processing of those activities that will be
required later in the works program of the WNP. Specifically, exploration and geotechnical
investigations, Willows infrastructure, the services trench, and the Processing Plant to Willows access
tunnel.
Document ID: STU-063-REP-002-0 Released: 11th December 2024Page 224 of 244
OceanaGold Corporation | ||
NI 43-101 Technical Report – Waihi District Pre-feasibility Study, New Zealand | ||
26.2Recommended Work Program Costs
The estimated costs for the next stage of Feasibility are shown in Table 26-1.
Table 26-1: Recommended Work Program Costs
Area | Scope | Cost ($ M) |
Geology and Mineralization | Geophysical survey, external reviews, drilling. | 3.4 |
Mine Planning | Geotechnical drilling, Material balance study, FS Design work. | 1.9 |
Tailings Infrastructure | Geotechnical drilling of eastern ridges, embankment, and liner design. | 0.2 |
WUG supporting surface infrastructure | Geotechnical drilling of portal and waste stack, detailed design of waste stack and box cut / initial tunnel ground support. Detailed design of services trench. | 3.0 |
Power Supply | Complete license to occupy road reserve, early commitment to long lead items including substation transformer supply. | 0.3 |
Water Treatment | Geotechnical investigations for plant foundations. Detailed design of WTP Upgrade and discharge. | 1.1 |
Mineral Processing and Metallurgical Testing | Test work to confirm metallurgical assumptions on ore hardness and recovery for future ore sources. This will support future Feasibility Studies and resource growth. | 0.5 |
Permitting | Legal support, consenting assessments and environment and social performance. | 3.9 |
Total $ | 14.2 |
Document ID: STU-063-REP-002-0 Released: 11th December 2024Page 225 of 244
OceanaGold Corporation | ||
NI 43-101 Technical Report – Waihi District Pre-feasibility Study, New Zealand | ||
27REFERENCES
A. 2013 QEMSCAN Analysis of Samples from the Waihi District, New Zealand: Correnso.
Unpublished report. Universidad Catolica del Norte, Antofagasta, Chile.
Allwood, K. Geomodelling Limited 2024. Waihi MUG Resource Estimation Review. Unpublished
Memo to OceanaGold.
Barker, S., Hood, S., Hughes, R., Richards, S. 2019. The Lithogeochemical signatures of
hydrothermal alteration in the Waihi epithermal District, New Zealand. New Zealand Journal of
Geology and Geophysics, Vol 62, Issue 4.
Biggalow, J. 2015. Review of multielement geochemistry of Waihi drill data. Unpublished Internal
Review. Newmont.
Coote, A. 2011 Petrological Studies of Diamond Core from WKP029 and WKP030, of the WKP South
Project, Coromandel, New Zealand. Unpublished Report to Newmont Waihi Gold
De Veth, A. AMC Limited 2022. Report Waihi North – Mining Pre-Feasibility Study (GOP Block Model
Review Final Report). Unpublished Memo to OceanaGold.
De Veth, A. AMC Limited 2022. Report Waihi North – Mining Pre-Feasibility Study (MOP Block Model
Review Final Report). Unpublished Memo to OceanaGold.
GWS Limited 2012. Proposed Underground Mining Extensions – Waihi. Assessment of Groundwater
Inflows and Throughflows. Prepared for Newmont Waihi Gold.
Inglis R. 2013. Heterogeneity Study. Unpublished Internal Report, Newmont Waihi Gold.
Kirk, A. 2012. Geochemistry of Ore, Tailings and Waste Rock Assessment by URS New Zealand for
the Correnso Underground Mine (Newmont Waihi Gold).
Mauk J. 2009. Petrographic Examination of Samples from the Reptile North and Number Nine Veins,
Waihi. Unpublished Report to Newmont Waihi Gold.
Mauk, J.L., Hall, C.M., Barra, F., and Chesley, J.T., 2011, Punctuated evolution of a large epithermal
province: The Hauraki goldfield, New Zealand. Economic Geology, v. 106, p. 921–943.
McArthur, F. 2019 WKP SG Data Memo. Unpublished Internal Report. OceanaGold.
Meyer, N 2024 Dry Bulk Density Testing WKP, Unpublished Internal Report, OceanaGold.
Meyer, N. 2024 Dry Bulk Density Testing MOP5, Unpublished Internal Report, OceanaGold.
Rhys, DA. 2009 Observations, and exploration recommendations at Newmont exploration properties
Hauraki Goldfield. Unpublished Memo to Newmont Waihi Gold.
Rhys, DA. 2010 WKP prospect: review of exploration results with recommendations. Unpublished
Memo to Newmont Waihi Gold.
Rhys, DA. 2011 Observations of selected drill core from the WKP prospect (with WKP-30 information
added). Unpublished Memo to Newmont Waihi Gold.
Rhys, DA. 2011. Review of the Structural Setting of the Correnso Vein System, Waihi, New Zealand.
Unpublished Report to Newmont Waihi Gold.
Rhys, DA. 2017. Waihi District geology: continuing contributions to understanding structural setting
and zonation as applied to exploration and mining. Unpublished Memo to OceanaGold.
Document ID: STU-063-REP-002-0 Released: 11th December 2024Page 226 of 244
OceanaGold Corporation | ||
NI 43-101 Technical Report – Waihi District Pre-feasibility Study, New Zealand | ||
Rhys, DA. 2020. Review of the core logging template for the Martha Underground Project.
Unpublished correspondence to OceanaGold.
Rhys, DA. 2020. Review of the structural controls of the WKP prospect. Unpublished Memo to
OceanaGold.
Richards, SD. 2019. Review of the WKP vein model using orientation data. Unpublished internal
validation.
Richards, SD. 2023. Review of the WKP vein model. Unpublished internal review.
Ross, KV. and Rhys, DA. 2011. Petrographic Study of Representative Samples from the Correnso
Vein System, Waihi District, New Zealand. Unpublished Report to Newmont Waihi Gold.
Simpson, M. 2012 SWIR report for drill holes WKP-24, WKP-27, and WKP-30, Wharekirauponga,
Southern Hauraki Goldfield. Unpublished Report to Newmont Waihi Gold.
Van de Ven, M. and Sterk R. RSC Limited 2020. Data Quality Review: Waihi Martha Underground
Project. Unpublished Memo to OceanaGold.
Van de Ven, M. and Sterk R. RSC Limited 2024. Draft Independent Technical Review of Mineral
Resources, Waihi North Project, NZ. Unpublished Memo to OceanaGold.
Vigour-Brown, W. 2019 Martha Underground SG Memo, Unpublished Internal Report. OceanaGold.
White, T. 2012 Correnso Dry Bulk Density Study. Unpublished Internal Report, Newmont Waihi Gold.
Document ID: STU-063-REP-002-0 Released: 11th December 2024Page 227 of 244
OceanaGold Corporation | ||
NI 43-101 Technical Report – Waihi District Pre-feasibility Study, New Zealand | ||
28GLOSSARY
The Mineral Resources and Mineral Reserves have been classified according to CIM (CIM, 2014).
Accordingly, the Resources have been classified as Measured, Indicated, or Inferred, the Reserves
have been classified as Proven, and Probable based on the Measured and Indicated Resources as
defined below.
28.1Mineral Resources
A Mineral Resource is a concentration or occurrence of solid material of economic interest in or on
the Earth’s crust in such form, grade or quality and quantity that there are reasonable prospects for
eventual economic extraction. The location, quantity, grade or quality, continuity and other geological
characteristics of a Mineral Resource are known, estimated or interpreted from specific geological
evidence and knowledge, including sampling.
An Inferred Mineral Resource is that part of a Mineral Resource for which quantity and grade or
quality are estimated on the basis of limited geological evidence and sampling. Geological evidence is
sufficient to imply but not verify geological and grade or quality continuity. An Inferred Mineral
Resource has a lower level of confidence than that applying to an Indicated Mineral Resource and
must not be converted to a Mineral Reserve. It is reasonably expected that the majority of Inferred
Mineral Resources could be upgraded to Indicated Mineral Resources with continued exploration.
An Indicated Mineral Resource is that part of a Mineral Resource for which quantity, grade or quality,
densities, shape and physical characteristics are estimated with sufficient confidence to allow the
application of Modifying Factors in sufficient detail to support mine planning and evaluation of the
economic viability of the deposit. Geological evidence is derived from adequately detailed and reliable
exploration, sampling and testing and is sufficient to assume geological and grade or quality continuity
between points of observation. An Indicated Mineral Resource has a lower level of confidence than
that applying to a Measured Mineral Resource and may only be converted to a Probable Mineral
Reserve.
A Measured Mineral Resource is that part of a Mineral Resource for which quantity, grade or quality,
densities, shape, and physical characteristics are estimated with confidence sufficient to allow the
application of Modifying Factors to support detailed mine planning and final evaluation of the
economic viability of the deposit. Geological evidence is derived from detailed and reliable
exploration, sampling and testing and is sufficient to confirm geological and grade or quality continuity
between points of observation. A Measured Mineral Resource has a higher level of confidence than
that applying to either an Indicated Mineral Resource or an Inferred Mineral Resource. It may be
converted to a Proven Mineral Reserve or to a Probable Mineral Reserve.
28.2Mineral Reserves
A Mineral Reserve is the economically mineable part of a Measured and/or Indicated Mineral
Resource. It includes diluting materials and allowances for losses, which may occur when the material
is mined or extracted and is defined by studies at Pre-feasibility or Feasibility level as appropriate that
include application of Modifying Factors. Such studies demonstrate that, at the time of reporting,
extraction could reasonably be justified.
The reference point at which Mineral Reserves are defined, usually the point where the ore is
delivered to the processing plant, must be stated. It is important that, in all situations where the
reference point is different, such as for a saleable product, a clarifying statement is included to ensure
Document ID: STU-063-REP-002-0 Released: 11th December 2024Page 228 of 244
OceanaGold Corporation | ||
NI 43-101 Technical Report – Waihi District Pre-feasibility Study, New Zealand | ||
that the reader is fully informed as to what is being reported. The public disclosure of a Mineral
Reserve must be demonstrated by a Pre-feasibility Study or Feasibility Study.
A Probable Mineral Reserve is the economically mineable part of an Indicated Mineral Resource,
and in some circumstances, a Measured Mineral Resource. The confidence in the Modifying Factors
applying to a Probable Mineral Reserve is lower than that applying to a Proven Mineral Reserve.
A Proven Mineral Reserve is the economically mineable part of a Measured Mineral Resource. A
Proven Mineral Reserve implies a high degree of confidence in the Modifying Factors.
28.3Definition of Terms
The following general mining terms may be used in this report.
Table 28-1: Definition of Terms
Term | Definition |
Assay | The chemical analysis of mineral samples to determine the metal content. |
Capital Expenditure | All other expenditures not classified as operating costs. |
Composite | Combining more than one sample result to give an average result over a larger distance. |
Concentrate | A metal-rich product resulting from a mineral enrichment process such as gravity concentration or flotation, in which most of the desired mineral has been separated from the waste material in the ore. |
Crushing | Initial process of reducing ore particle size to render it more amenable for further processing. |
Cut-off Grade (CoG) | The grade of mineralized rock, which determines as to whether or not it is economic to recover its gold content by further concentration. |
Dilution | Waste, which is unavoidably mined with ore. |
Dip | Angle of inclination of a geological feature/rock from the horizontal. |
Fault | The surface of a fracture along which movement has occurred. |
Footwall | The underlying side of an orebody or stope. |
Gangue | Non-valuable components of the ore. |
Grade | The measure of concentration of gold within mineralized rock. |
Hanging wall | The overlying side of an orebody or slope. |
Haulage | A horizontal underground excavation which is used to transport mined ore. |
Hydrocyclone | A process whereby material is graded according to size by exploiting centrifugal forces of particulate materials. |
Igneous | Primary crystalline rock formed by the solidification of magma. |
Kriging | An interpolation method of assigning values from samples to blocks that minimizes the estimation error. |
Level | Horizontal tunnel the primary purpose is the transportation of personnel and materials. |
Lithological | Geological description pertaining to different rock types. |
LoM Plans | Life-of-Mine plans. |
Material Properties | Mine properties. |
Document ID: STU-063-REP-002-0 Released: 11th December 2024Page 229 of 244
OceanaGold Corporation | ||
NI 43-101 Technical Report – Waihi District Pre-feasibility Study, New Zealand | ||
Term | Definition |
Milling | A general term used to describe the process in which the ore is crushed and ground and subjected to physical or chemical treatment to extract the valuable metals to a concentrate or finished product. |
Mineral/Mining Lease | A lease area for which mineral rights are held. |
Mining Assets | The Material Properties and Significant Exploration Properties. |
Ongoing Capital | Capital estimates of a routine nature, which is necessary for sustaining operations. |
Ore Reserve | See Mineral Reserve. |
Paper Road | Unformed legal road that is undeveloped or partly formed but provides public access to a particular area or feature. |
Pillar | Rock left behind to help support the excavations in an underground mine. |
RoM | Run-of-Mine. |
Sedimentary | Pertaining to rocks formed by the accumulation of sediments, formed by the erosion of other rocks. |
Shaft | An opening cut downwards from the surface for transporting personnel, equipment, supplies, ore and waste. |
Sill | A thin, tabular, horizontal to sub-horizontal body of igneous rock formed by the injection of magma into planar zones of weakness. |
Smelting | A high temperature pyrometallurgical operation conducted in a furnace, in which the valuable metal is collected to a molten matte or doré phase and separated from the gangue components that accumulate in a less dense molten slag phase. |
Stope | Underground void created by mining. |
Stratigraphy | The study of stratified rocks in terms of time and space. |
Strike | Direction of line formed by the intersection of strata surfaces with the horizontal plane, always perpendicular to the dip direction. |
Sulphide | A sulphur bearing mineral. |
Tailings | Finely ground waste rock from which valuable minerals or metals have been extracted. |
Thickening | The process of concentrating solid particles in suspension. |
Total Expenditure | All expenditures including those of an operating and capital nature. |
Variogram | A statistical representation of the characteristics (usually grade). |
Waihi District | Includes Martha Underground (MUG), Martha Open Pit (MOP), Gladstone Open Pit (GOP) and Wharekirauponga Underground (WUG). |
28.4Abbreviations
The following abbreviations may be used in this report.
Table 28-2: Abbreviations
Abbreviation | Definition |
AAS | Atomic absorption spectroscopy |
AECOM | AECOM Pty Ltd |
Document ID: STU-063-REP-002-0 Released: 11th December 2024Page 230 of 244
OceanaGold Corporation | ||
NI 43-101 Technical Report – Waihi District Pre-feasibility Study, New Zealand | ||
Abbreviation | Definition |
AEP | Amenity Effects Program |
Ag | silver |
AMC | AMC Consultants |
Analabs | Analabs Propriety Limited |
ANCOLD | Means the Australian National Committee on Large Dams Inc., which is an Australian based non-government, non-profit association of professional practitioners and corporations with a profession interest in dams. ANCOLD is a member of the International Commission on Large Dams (ICOLD) and publishes international recognized guidelines for the sustainable development and management of dams and water resources. |
ATV | Acoustic Televiewer |
Au | gold |
AuEq | gold equivalent |
bcm | bank cubic metre(s) |
BFA | bench face angles |
Block model | is a computer-based representation of a deposit in which geological zones are defined and filled with block which are assigned estimated values of grade and other attributes. The purpose of the block model is to associate grades with the volume model. |
BQ | is a reference to the ~ 60 mm diameter drill rods used to recover diamond drill core. |
Bulk density | is the dry in-situ tonnage factor used to convert volumes to tonnage. |
CIL | carbon in leach |
CIM | the Canadian Institute of Mining, Metallurgy and Petroleum |
CIM Standards | are the CIM Definitions Standards for Mineral Resources and Mineral Reserves adopted by the CIM Council on 27th December 2010, for the reporting of Mineral Resource, Mineral Reserve and Mining Studies used in Canada. The Mineral Resource, Mineral Reserve and Mining Study definitions are incorporated, by reference, into the NI 43-101, and from the basis for the reporting of Reserves and Resources in the Technical Report. With triple listing on the TSX, ASX and NZX. OceanaGold also reports in accordance with the JORC Code and where necessary reconciles its reporting to ensure compliance with both the CIM Standards and the JORC Code. |
CIP | carbon in pulp |
CMA | Crown Minerals Act 1991 |
cm | centimetre(s) |
CRM | Certified Reference Material |
CSR | corporate social responsibility |
Cu | copper |
cut-off grade | is the lowest grade value that is included in a Mineral Resource Statement, being the lowest grade, or quality of mineralized material that has reasonable prospect for eventual economic extraction. |
CVZ | Coromandel Volcanic Zone |
DH | drill hole |
Document ID: STU-063-REP-002-0 Released: 11th December 2024Page 231 of 244
OceanaGold Corporation | ||
NI 43-101 Technical Report – Waihi District Pre-feasibility Study, New Zealand | ||
Abbreviation | Definition |
diamond drilling or DD | is a rotary drilling technique using diamond set or impregnated bits, to cut a solid, continuous core sample of the rock. |
DOC | Department of Conservation |
E | East |
EDA | Exploration Data Analysis |
EG | East Graben |
EIS | Environmental Impact Assessment |
ELB | Eastern Layback |
EOM | end of month |
EOY | end of year |
EPCM | Engineering, Procurement and Construction Management |
ESE | East Southeast |
SEIA | Environmental and Social Impact Assessment |
FAR | fresh air rise |
Fe | iron |
FTE | full-time employee(s) |
FUFG | flotation and ultra-fine grind |
FX | Foreign Exchange |
g | gram(s) |
G&A | general and administration |
GHD | GHD Limited |
GOP | Gladstone Open Pit |
g/t | grams per metric tonne |
GWS | GWS Limited Consulting |
Ha | hectare(s) |
HDC | Hauraki District Council |
HDPE | high density polyethylene |
Hg | mercury |
HQ | is a reference to the ~ 96 mm diameter of drill rods used to recover diamond drill core |
HR | hydraulic radii |
ID2 | Inverse Distance weighting to the second power method |
ID3 | Inverse Distance weighting to the third power method |
IRA | inter-ramp angles |
JK | JKTech Pty Ltd |
kg | kilogram(s) |
km | kilometre(s) |
Document ID: STU-063-REP-002-0 Released: 11th December 2024Page 232 of 244
OceanaGold Corporation | ||
NI 43-101 Technical Report – Waihi District Pre-feasibility Study, New Zealand | ||
Abbreviation | Definition |
km2 | square kilometres(s). |
koz | thousand troy ounces. |
kt | thousand metric tonnes. |
kV | kilovolts. |
kWh | kilowatt hour(s) |
kWh/t | kilowatt-hours per tonne |
LG | Lerch Grossman |
LHD | load haul dump machines |
LHOS | long hole open stoping |
LINZ | Land Information New Zealand |
LoM | Life of mine |
µm | micron or micrometre |
m | metre(s) |
M | million(s) |
m3 | cubic metre(s) |
m3/h | cubic metres per hour |
m/s | metres per second |
Ma | million years |
MEO | Mt Eden Old Cadastral grid |
Metso | Metso Technology PTSI Pty Ltd |
Mineralization | the concentration of minerals in a body of rock |
MLR | Multiple Linear Regression |
mm | millimetre(s) |
MOP | Martha Open Pit |
MOP4 | Martha Open Pit Phase 4 |
MOP5 | Martha Open Pit Phase 5 |
Moz | million troy ounces |
MP | Mining Permit |
m RL | Reduced Level from mien datum |
MSO | Mineable Stope Optimiser software |
Mt | million metric tonnes |
Mtpa | million tonnes per annum |
MUG | Martha Underground |
multiple indicator kriging | is a grade estimation technique |
MW | megawatt(s) |
N | North |
Document ID: STU-063-REP-002-0 Released: 11th December 2024Page 233 of 244
OceanaGold Corporation | ||
NI 43-101 Technical Report – Waihi District Pre-feasibility Study, New Zealand | ||
Abbreviation | Definition |
NAF | non-acid forming rock |
NAPP | negative acid producing potential |
NATA | National Association of Testing Authorities, the body which accredits laboratories and inspection bodies within Australia. |
NE | Northeast |
NI 43-101 | National Instrument 43-101 – Standards of Disclosure for Mineral Projects of the Canadian Securities Administrators. |
NNE | North northeast |
NPV | net present value |
NQ | is a reference to the ~ 76 mm diameter drill rods used to recover diamond drill core. |
NRS | Northern Rock Stack |
NSR | net smelter return |
NW | Northwest |
NZMG | New Zealand Map Grid |
NZPAM | New Zealand Petroleum and Minerals |
NZ$ | New Zealand Dollar |
NZ$M | New Zealand Dollar Millions |
NZTM | New Zealand Transverse Mercator |
OceanaGold | means OceanaGold Corporation and/or any of its subsidiaries. |
OCEANAGOLD or OGC | means OceanaGold Corporation |
OEM | Original Equipment Manufacturer |
OHPL | Overhead Power Line |
ordinary kriging or OK | is a grade estimation technique |
Outotec | Outotec Pty Ltd |
oz | troy ounce (31.103477 grams) |
PAF | potentially acid forming rock |
Pb | lead |
PEA | Preliminary Economic Assessment |
PMP | Probable Maximum Precipitation storm event |
polygonal method | is a grade estimation technique |
ppb | parts per billion |
ppm | parts per million |
PPS | Polishing Ponds Stockpile |
PQ | is a diamond tube size equivalent to 85 mm inside diameter |
PFS | Preliminary Feasibility Study as defined under the CIM Standards |
PSM | PSM Consultants Pty Ltd |
Document ID: STU-063-REP-002-0 Released: 11th December 2024Page 234 of 244
OceanaGold Corporation | ||
NI 43-101 Technical Report – Waihi District Pre-feasibility Study, New Zealand | ||
Abbreviation | Definition |
pXRF | portable X-ray fluorescence |
Q1 | Quarter beginning 1 January and ending 31 March |
Q2 | Quarter beginning 1 April and ending 30 June |
Q3 | Quarter beginning 1 July and ending 30 September |
Q4 | Quarter beginning 1 October and ending 31 December |
QA/QC | quality assurance / quality control |
Qualified Person or QP | as defined under the CIM Standards means and individual who is an engineer or geoscientist with at least five years of experience in mineral exploration, mine development or operation, or mineral project assessment, or any combination of these; has experience relevant to the subject matter of the mineral project and the Technical Report; and is a member or licensee in good standing of a professional association. |
PLI | Point Load Index |
RAB | rotary air blast |
RAR | return air rise |
RC | Reverse Circulation drilling |
RMA | Resource Management Act 1991 |
RMI | Rick Management Intercontinental Pty Ltd |
ROM | Run-of-mine |
RPS | Waikato Regional Policy Statement |
RQD | Rock Quality Designation index of rock quality |
S | South |
SABC | SAG mill / Ball mill / pebble crusher |
SAG | semi-autogenous grinding mill |
SCSR | self-contained self-rescuer |
SE | Southeast |
SEDAR | System for Electronic Document Analysis and Retrieval (www.sedar.com) |
SG | specific gravity |
SGS | SGS Laboratory Waihi |
SIA | Social Impact Assessment |
SIMP | Social Impact Management Plan |
SMU | selective mining unit |
SRK | SRK Consulting Pty Ltd |
SSC | Southern Stability Cut |
STDEV | standard deviation |
SW | Southwest |
t | metric tonne (1,000 kilograms) |
TCDC | Thames Coromandel District Council |
Document ID: STU-063-REP-002-0 Released: 11th December 2024Page 235 of 244
OceanaGold Corporation | ||
NI 43-101 Technical Report – Waihi District Pre-feasibility Study, New Zealand | ||
Abbreviation | Definition |
TEM | Technical economic model |
the District | Waihi District |
t/m3 | tonnes per cubic metre |
tpa | tonnes per annum |
tpd | tonnes per day |
tpm | tonnes per month |
TSF | Tailings Storage Facility |
TSP | total suspended particulate |
TSS | total suspended solids |
TSX | Toronto Stock Exchange |
TVZ | Taupo Volcanic Zone |
UCS | Uniaxial Compressive Strength |
$ | United States dollars |
$M | United States Dollar Millions |
UTM | Universal Transverse Mercator |
UTS | Uniaxial Tensile Strength |
W | West |
WKP | Wharekirauponga |
WNP | Waihi North Project |
WRC | Waikato Regional Council |
WRD | waste rock dump |
WUG | Wharekirauponga Underground mine |
wt | weight |
WTP | water treatment plant |
XRF | x-ray fluorescence |
Zn | zinc |
3D | three-dimensional |
@ | at |
% | percent |
ºC | degrees Celsius |
Document ID: STU-063-REP-002-0 | Released: 11th December 2024 | Appendices |
OceanaGold Corporation | ||
NI 43-101 Technical Report – Waihi District Pre-feasibility Study, New Zealand | ||
APPENDICES
Document ID: STU-063-REP-002-0 | Released: 11th December 2024 | Appendices |
OceanaGold Corporation | ||
NI 43-101 Technical Report – Waihi District Pre-feasibility Study, New Zealand | ||
APPENDIX A – CERTIFICATES OF QUALIFIED
PERSONS
CERTIFICATE OF QUALIFIED PERSON
I, David James Townsend, Assoc Deg (Surveying), GDip (Mining), MAusIMM CP(Min), do hereby certify
that:
1.I am the Manager of Mining at the Waihi Operation of OceanaGold Corporation (“OceanaGold”),
Suite 1020, 400 Burrard Street, Vancouver, British Columbia V6C 3A6.
2.This certificate applies to the technical report titled “NI 43-101 Technical Report Waihi District Pre-
feasibility Study, New Zealand” dated December 11, 2024 with an effective date of June 30, 2024
(the “Technical Report”).
3.I graduated with an Associate Degree in Spatial Science (Surveying) from the University of
Southern Queensland and a Graduate Diploma in Mining from the University of Ballarat. I am a
Member and Chartered Professional of the Australasian Institute of Mining and Metallurgy. I have
23 years of experience in technical, operational and management roles in underground epithermal
gold mines.
4.I have read the definition of “qualified person” set out in National Instrument 43-101 (“Nl 43- 101”)
and certify that by reason of my education, affiliation with a professional/technical association, (as
defined in Nl 43-101) and past relevant work experience, I fulfill the requirements of a "qualified
person" for the purposes of Nl 43-101.
5.I last visited the Waihi Operations in December 2024.
6.I have been employed at the Waihi Operation by OceanaGold Corporation since 2015, and with
previous companies since 2006.
7.I am responsible for the preparation of Sections 1.6 - 1.7, 1.13, 15.1, 15.3, 16.1 - 16.2, 16.4, 25.4,
and 26 of the Technical Report that relate to the Martha Underground Mine (MUG).
8.I am not independent of the issuer applying all the tests in Section 1.5 of Nl 43-101 as I have been
a full-time employee of OceanaGold since 2015.
9.Prior to my employment with OceanaGold,I was employedatthe property with previous
companies.
10.I have read Nl 43-101 and Form 43-101F1and the sectionsofthe Technical Report I am
responsible for have been prepared in compliance with NI 43-101 and Form 43-101F1.
11.As of the aforementioned effective date, to the best of my knowledge, information and belief, the
sections of the Technical Report I am responsible for contain all scientific and technical information
that is required to be disclosed to make the Technical Report not misleading.
Dated: December 11, 2024
(Signed) “David Townsend” | “Stamped” | ||
David James Townsend, Assoc Deg (Surveying), GDip (Mining), MausIMM CP(Min) | |||
CERTIFICATE OF QUALIFIED PERSON
I, Leroy Crawford-Flett, BCA/BSc (Management/Geology), MPM, MAusIMM CP (Geo), do hereby certify
that:
1.I am the Exploration and Geology Manager of OceanaGold Corporation (“OceanaGold”), Suite
1020, 400 Burrard Street, Vancouver, British Columbia V6C 3A6.
2.This certificate applies to the technical report titled “NI 43-101 Technical Report Waihi District Pre-
feasibility Study, New Zealand” dated December 11, 2024 with an effective date of June 30, 2024
(the “Technical Report”).
3.I have worked as an Exploration and Geology manager since 2024 and as a Geologist since
completion of a degree in Bachelor of Commerce and Administration in Management and a
Bachelor of Science in Geology from Victoria University, Wellington in 2009. I completed a Master
of Project Management specializing in Risk Management from Sydney University in 2015. I am a
Member and Chartered Professional of the Australasian Institute of Mining and Metallurgy
(AusIMM) CP (Geo). I have 15 years of relevant experience in mine geology, resource development
and exploration roles in open pit and underground gold mines, including 9 years of experience in
interpretation, estimation, and evaluation of epithermal gold deposits.
4.I have read the definition of “qualified person” set out in National Instrument 43-101 (“NI 43- 101”)
and certify that by reason of my education, affiliation with a professional/technical association, (as
defined in Nl 43-101) and past relevant work experience, I fulfill the requirements of a "qualified
person" for the purposes of Nl 43-101.
5.I last visited the Waihi Operations in December 2024.
6.I have been employed by OceanaGold or its subsidiaries since 2015 in a variety of roles.
7.I am responsible for the preparation of Sections 1.1 - 1.3, 1.5, 1.13, 2 – 4, 6 – 12, 14, 23 -24, 25.1 -
25.3, and 26 of the Technical Report.
8.I am not independent of the issuer applying all the tests in Section 1.5 of Nl 43-101 as I have been
a full-time employee of OceanaGold since 2015.
9.I have had prior involvement with the property that is the subject of the Technical Report. The
nature of my prior involvement has been production geology and resource development since 2011.
10.I have read Nl 43-101 and Form 43-101F1 and the sections of the Technical Report I am
responsible for have been prepared in compliance with NI 43-101 and Form 43-101F1.
11.As of the aforementioned effective date, to the best of my knowledge, information and belief, the
sections of the Technical Report I am responsible for contain all scientific and technical information
that is required to be disclosed to make the Technical Report not misleading.
Dated: December 11, 2024
(Signed) “Leroy Crawford-Flett” | “Stamped" | ||
Leroy Crawford-Flett, BCA/BSc (Management/Geology), MPM, MAusIMM CP (Geo) | |||
CERTIFICATE OF QUALIFIED PERSON
I, Kirsty Hollis, BEng (Mineral Processing), MBA, FAusIMM CP (Met), do hereby certify that:
1.I am the Principal Metallurgist of OceanaGold Corporation (“OceanaGold”), Suite 1020, 400
Burrard Street, Vancouver, British Columbia V6C 3A6.
2.This certificate applies to the technical report titled “NI 43-101 Technical Report Waihi District Pre-
Feasibility Study, New Zealand” dated December 11, 2024 with an effective date of June 30, 2024
(the “Technical Report”).
3.I graduated with a Bachelor of Engineering in Mineral Processing from the University of Auckland in
1989. I am a Fellow and Chartered Professional of the Australasian Institute of Mining and
Metallurgy. I have worked as a metallurgist for a total of 36 years since my graduation from
university. My relevant experience includes flotation and leaching of gold ores, base metal flotation,
ultra-fine grinding, waste-water treatment, process plant design, project evaluation, studies and
plant commissioning.
4.I have read the definition of “qualified person” set out in National Instrument 43-101 (“Nl 43- 101”)
and certify that by reason of my education, affiliation with a professional/technical association, (as
defined in Nl 43-101) and past relevant work experience, I fulfill the requirements of a "qualified
person" for the purposes of Nl 43-101.
5.I last visited the Waihi Operations in December 2024.
6.I have been employed by OceanaGold or its subsidiaries since 2020.
7.I am responsible for the preparation of Sections 1.4, 1.8, 1.13, 2, 13, 17, 18.4, 18.5, 25.5, 25.6, and
26 of the Technical Report.
8.I am not independent of the issuer applying all the tests in Section 1.5 of Nl 43-101 as I have been
a full-time employee of OceanaGold since 2020.
9.Prior to my employment with OceanaGold, I had previous involvement with the property that is the
subject of the Technical Report. This was as a site employee in the roles of Senior Metallurgist and
Process Manager, from 2000 to 2011. The operation was owned by Newmont Corporation at the
time.
10.I have read Nl 43-101 and Form 43-101F1 and the sections of the Technical Report I am
responsible for have been prepared in compliance with NI 43-101 and Form 43-101F1.
11.As of the aforementioned effective date, to the best of my knowledge, information and belief, the
sections of the Technical Report I am responsible for contain all scientific and technical information
that is required to be disclosed to make the Technical Report not misleading.
Dated: December 11, 2024
(Signed) “Kirsty Hollis” | “Stamped” | ||
Kirsty Hollis, BEng (Mineral Processing), MBA, FAusIMM CP (Met) | |||
CERTIFICATE OF QUALIFIED PERSON
I, Euan Leslie, BEng Mining (Hons), BCom Economics, MAusIMM CP (Min), do hereby certify that:
1.I am the Group Mining Engineer of OceanaGold Corporation (“OceanaGold”), Suite 1020, 400
Burrard Street, Vancouver, British Columbia V6C 3A6.
2.This certificate applies to the technical report titled “NI 43-101 Technical Report Waihi District Pre-
feasibility Study, New Zealand” dated December 11, 2024 with an effective date of June 30, 2024
(the “Technical Report”).
3.I have worked as a Mining Engineer since my completion of a Bachelor of Engineering and a
Bachelor of Commerce from Curtin University, Western Australian School of Mines (WASM) in
2009. I am a member and Chartered Professional of the Australasian Institute of Mining and
Metallurgy (AusIMM) CP (Min). My relevant experience for the purpose of this technical report is
mining engineering which has covered exposure as an operator, shift supervisor, underground
manager and technical services manager including within hard rock operations involving longhole
open stoping, avoca with both paste and cemented rock backfill mining methods.
4.I have read the definition of “qualified person” set out in National Instrument 43-101 (“Nl 43- 101”)
and certify that by reason of my education, affiliation with a professional/technical association, (as
defined in Nl 43-101) and past relevant work experience, I fulfill the requirements of a "qualified
person" for the purposes of Nl 43-101.
5.I last visited the Waihi Operations in December 2024.
6.I have been employed by OceanaGold or its subsidiaries since 2021 in a variety of roles.
7.I am responsible for the preparation of Sections 1.6, 1.7, 1.13, 2 – 3, 15.2, 15.3, 16.3, 16.4, 25.4,
and 26 of the Technical Report.
8.I am not independent of the issuer applying all the tests in Section 1.5 of Nl 43-101 as I have been
a full-time employee of OceanaGold since 2021.
9.Prior to my employment with OceanaGold, I had no prior involvement with the property that is the
subject of the Technical Report.
10.I have read Nl 43-101 and Form 43-101F1 and the sections of the Technical Report I am
responsible for have been prepared in compliance with NI 43-101 and Form 43-101F1.
11.As of the aforementioned effective date, to the best of my knowledge, information and belief, the
sections of the Technical Report I am responsible for contain all scientific and technical information
that is required to be disclosed to make the Technical Report not misleading.
Dated: December 11, 2024
(Signed) “Euan Leslie” | “Stamped” | ||
Euan Leslie, BEng Mining (Hons), BCom Economics, MAusIMM CP (Min) | |||
CERTIFICATE OF QUALIFIED PERSON
I, Trevor Maton, ARSM, BSc. (Eng) Mining (Hons), MSc. Economics MAusIMM CP (Min), do hereby
certify that:
1.I am the Study Director of OceanaGold Corporation (“OceanaGold”), Suite 1020, 400 Burrard
Street, Vancouver, British Columbia, V6C 3A6.
2.This certificate applies to the technical report titled “NI 43-101 Technical Report Waihi District Pre-
feasibility Study, New Zealand” dated December 11, 2024, with an effective date of June 30, 2024
(the “Technical Report”).
3.I have worked as a Study Director since 2010. I graduated with a degree in BSc Eng (Hons) Mining
Engineering from the University of London in 1981 and Associateship of the Royal School of Mines
from Imperial College in 1982. I graduated with a MSc. in Mineral Economics from Curtin
University, Western Australia in 2002. I have also held first class mine managers certificates of
competence in metalliferous mining from Queensland, Australia, and New Zealand. I am a member
and Chartered Professional of the AusIMM. I have worked as a miner, shift supervisor, foreman,
mining engineer, consulting engineer, mining manager, study director for a total of 39 years, in
open pit and underground mining operations throughout Australia, New Zealand, England, South
America, Africa and the USA. Commodities include gold, silver, bauxite, coal, fluorspar, copper,
lead, and zinc.
4.I have read the definition of “qualified person” set out in National Instrument 43-101 (“Nl 43- 101”)
and certify that by reason of my education, affiliation with a professional/technical association, (as
defined in Nl 43-101) and past relevant work experience, I fulfill the requirements of a "qualified
person" for the purposes of Nl 43-101.
5.I last visited the Waihi Operations in December 2024.
6.I have been employed by OceanaGold or its subsidiaries since 2016 as Study Director.
7.I am responsible for the preparation of Sections 1.9 – 1.13, 2, 3, 5, 18 – 22, 24, 25.6 - 25.8 and 26
of the Technical Report.
8.I am not independent of the issuer applying all the tests in Section 1.5 of Nl 43-101 as I have been
a full-time employee of OceanaGold since 2016.
9.I have had prior involvement with the property that is the subject of the Technical Report. The
nature of my prior involvement has been geotechnical engineering, mine planning, environmental
studies, and mine design with the project since 2003.
10.I have read Nl 43-101 and Form 43-101F1 and the sections of the Technical Report I am
responsible for have been prepared in compliance with NI 43-101 and Form 43-101F1.
11.As of the aforementioned effective date, to the best of my knowledge, information and belief, the
sections of the Technical Report I am responsible for contain all scientific and technical information
that is required to be disclosed to make the Technical Report not misleading.
Dated: December 11, 2024
(Signed) “Trevor Maton” | “Stamped” | |
Trevor Maton, ARSM, BSc. (Eng) Mining (Hons), MSc. Economics, MAusIMM CP (Min) | ||