Pay vs Performance Disclosure
Dec. 31, 2025
USD ($)
Dec. 31, 2024
USD ($)
Dec. 31, 2023
USD ($)
Dec. 31, 2022
USD ($)
Dec. 31, 2021
USD ($)
| VALUE OF INITIAL FIXED $100 INVESTMENT BASED ON: | |||||||||||||||||||||||||||||||||||||||||||||||
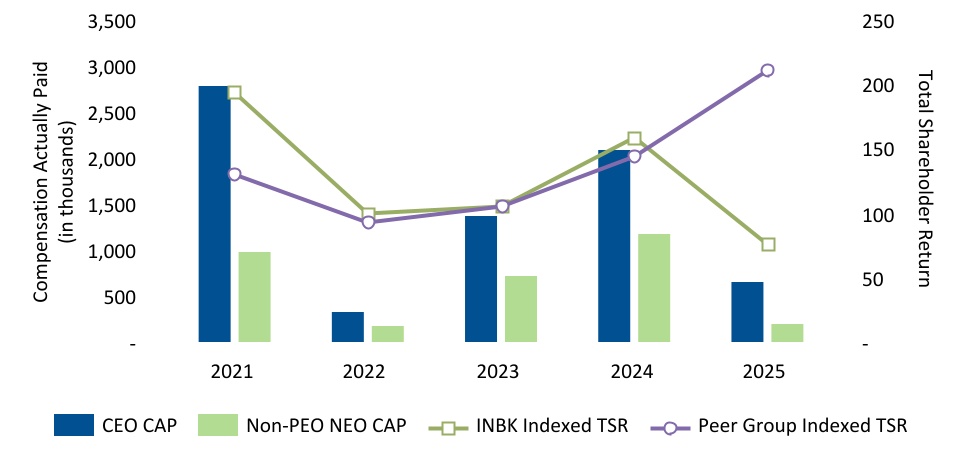
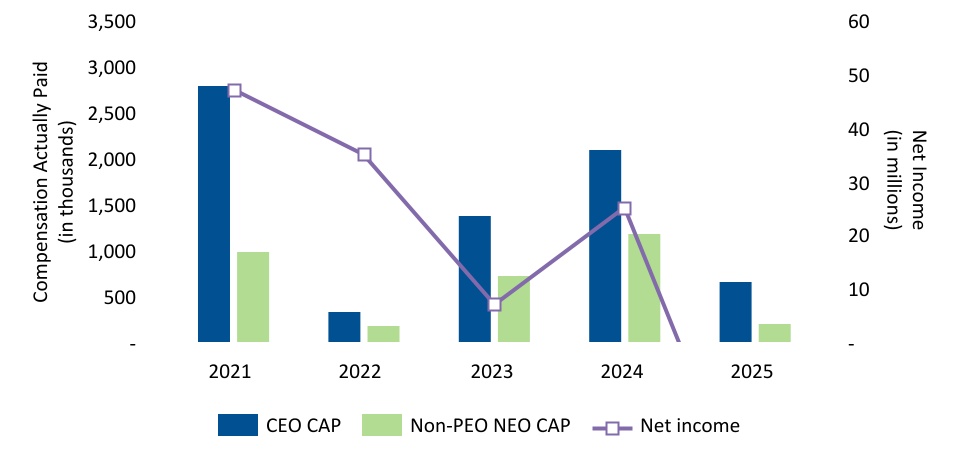
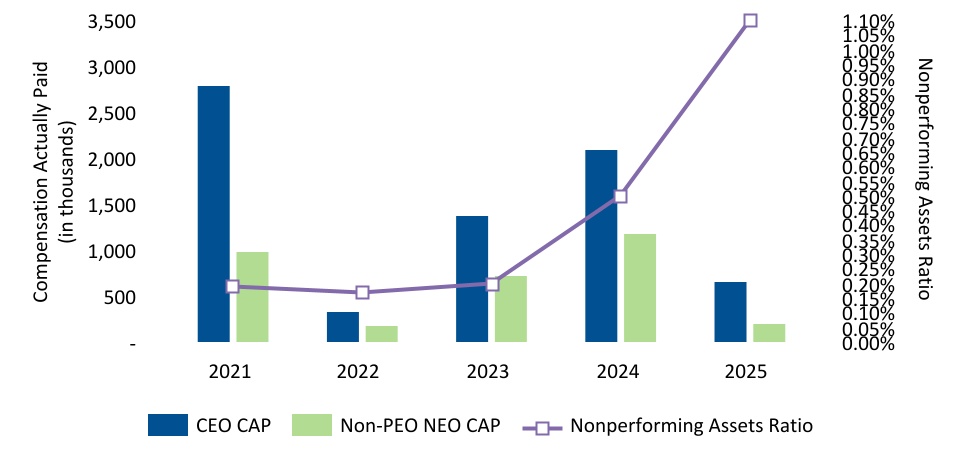
| YEAR | SUMMARY COMP. TABLE TOTAL FOR CEO (1)(2) ($) | COMP. ACTUALLY PAID TO CEO (1)(2) ($) | AVERAGE SUMMARY COMP. TABLE FOR OTHER NEOS (1)(2) ($) | AVERAGE COMP. ACTUALLY PAID TO OTHER NEOS (1)(2) ($) | TOTAL SHAREHOLDER RETURN (3) ($) | PEER GROUP TOTAL SHAREHOLDER RETURN (3)(4) ($) | NET INCOME ($ IN MILLIONS) | COMPANY-SELECTED MEASURE: NONPERFORMING ASSETS RATIO (5) | |||||||||||||||||||||||||||||||||||||||
| 2025 | 1,492,001 | 674,229 | 798,986 | 226,587 | 76.0 | 211.4 | $(35,168) | 1.10% | |||||||||||||||||||||||||||||||||||||||
| 2024 | 1,934,751 | 2,143,326 | 1,001,935 | 1,153,665 | 159.4 | 143.7 | 25,276 | 0.50% | |||||||||||||||||||||||||||||||||||||||
| 2023 | 1,727,322 | 1,414,677 | 894,137 | 724,468 | 106.3 | 107.3 | 8,417 | 0.20% | |||||||||||||||||||||||||||||||||||||||
| 2022 | 1,816,153 | 342,701 | 668,807 | 194,445 | 105.3 | 98.4 | 35,441 | 0.17% | |||||||||||||||||||||||||||||||||||||||
| 2021 | 1,920,277 | 2,900,421 | 725,604 | 1,031,657 | 202.5 | 118.6 | 48,114 | 0.20% | |||||||||||||||||||||||||||||||||||||||
(1)
| YEAR | PEO | NEOs | ||||||
| 2025 | David Becker | Nicole S. Lorch, Kenneth J. Lovik | ||||||
| 2024 | David Becker | Nicole S. Lorch, Kenneth J. Lovik | ||||||
| 2023 | David Becker | Nicole S. Lorch, Kenneth J. Lovik | ||||||
| 2022 | David Becker | Nicole S. Lorch, Kenneth J. Lovik, C. Charles Perfetti | ||||||
| 2021 | David Becker | Nicole S. Lorch, Kenneth J. Lovik, C. Charles Perfetti | ||||||
(4)Our peer group used for the Total Shareholder Return calculations is the S&P U.S. BMI Banks Index, which is the industry index used to show our performance in our Annual Report on Form 10-K.
(2)We did not report a change in pension value for any of the years reflected in this table; therefore, a deduction from the Summary Compensation Table (“SCT”) total related to pension value is not needed. A reconciliation of Total Compensation from the SCT to Compensation Actually Paid to our CEO and our Other NEOs (as an average) is shown below:
| Adjustments | 2025 | ||||||||||
| CEO ($) | Average of Other NEOs ($) | ||||||||||
| Total Compensation from SCT | 1,492,001 | 798,986 | |||||||||
| Adjustments for stock and option awards: | |||||||||||
| (Subtraction): SCT amounts | (628,001) | (315,416) | |||||||||
| Addition: Fair value at year-end of awards granted during the covered fiscal year that are outstanding and unvested at year-end | 369,127 | 185,441 | |||||||||
| (Subtraction) Addition: The difference between fair value from the end of the prior year to the end of this year of awards granted in any prior fiscal year that are outstanding and unvested at year end | (254,696) | (301,010) | |||||||||
| Addition: Fair value of awards granted and vesting during such year as of the end of the year | - | - | |||||||||
| (Subtraction) Addition: Difference in fair value from the end of the prior year to the vesting date of awards granted in any prior fiscal year for which vesting conditions were satisfied during such year | (28,735) | (12,300) | |||||||||
| (Subtraction): Fair value at end of prior year of awards granted in any prior fiscal year that fail to meet the applicable vesting conditions during such year | (275,467) | (129,114) | |||||||||
| Addition: Dividends or other earnings paid on stock or option awards in the covered year prior to vesting if not otherwise included in fair value or total compensation for the covered year | – | – | |||||||||
| Compensation Actually Paid (as calculated) | 674,229 | 226,587 | |||||||||
| Financial Performance Measure | ||
| Nonperforming Assets Ratio | ||
| Texas Ratio | ||
Return on Average Assets | ||
| Net Interest Income | ||
(5)Our company-selected measure, which is the measure we believe represents the most important financial performance not otherwise presented in the table above that we used to link Compensation Actually Paid to our NEOs for 2025 to our company’s performance, is our ratio of nonperforming assets to total assets, which we refer to as our “nonperforming assets ratio.” This measure is one of the four metrics used to determine annual bonus plan awards for each of the years presented. Further, all PRSUs granted in each of the years require a threshold nonperforming asset ratio in order to vest and settle into shares.