Pay vs Performance Disclosure
number in Thousands
number in Thousands
Dec. 31, 2025
USD ($)
Dec. 31, 2024
USD ($)
Dec. 31, 2023
USD ($)
Dec. 31, 2022
USD ($)
Dec. 31, 2021
USD ($)
Summary Compensation Table Total for PEO1 ($) | Compensation Actually Paid to PEO2 ($) | Average Summary Compensation Table Total for Non-PEO NEOs3 ($) | Average Compensation Actually Paid to Non-PEO NEOs4 ($) | Value of Initial Fixed $100 Investment Based On: | GAAP Net Income7 ($000s) | Total Revenue8 ($000s) | ||||||||||||||||||||
| Year | Total Stockholder Return5 ($) | Peer Group Total Stockholder Return6 ($) | ||||||||||||||||||||||||
| 2025 | 3,502,747 | 416,290,717 | 3,445,394 | 32,278,280 | 302.98 | 65.63 | (87,140) | 2,023,994 | ||||||||||||||||||
2024(9) | 44,961,745 | 39,968,711 | 3,792,370 | 6,625,609 | 77.45 | 49.71 | (27,203) | 1,473,856 | ||||||||||||||||||
2023(9) | 1,704,008 | (2,904,929) | 2,841,673 | (334,144) | 51.62 | 61.27 | (307,937) | 1,333,470 | ||||||||||||||||||
| 2022 | 2,632,248 | (1,564,752) | 4,924,026 | 4,429,158 | 66.70 | 68.01 | (315,086) | 1,199,125 | ||||||||||||||||||
| 2021 | 34,210,000 | 45,039,705 | 5,309,245 | 4,000,340 | 76.51 | 97.36 | (193,369) | 972,176 | ||||||||||||||||||
Year | Reported Summary Compensation Table Total for PEO ($) | Deduct Reported Value of Equity Awardsa ($) | Add (or Deduct) Equity Award Adjustmentsb ($) | Compensation Actually Paid to PEO ($) | ||||||||||
| 2025 | 3,502,747 | — | 412,787,970 | 416,290,717 | ||||||||||
| 2024 | 44,961,745 | (42,394,800) | 37,401,766 | 39,968,711 | ||||||||||
| 2023 | 1,704,008 | — | (4,608,937) | (2,904,929) | ||||||||||
aThe grant date fair value of equity awards represents the total of the amounts reported in the “Stock Awards” and “Option Awards” columns in the Summary Compensation Table for the applicable year.
bThe equity award adjustments for each applicable year include the addition (or subtraction, as applicable) of the following: (i) the year-end fair value of any equity awards granted in the applicable year that are outstanding and unvested as of the end of the year; (ii) the amount of change as of the end of the applicable year (from the end of the prior fiscal year) in fair value of any awards granted in prior years that are outstanding and unvested as of the end of the applicable year; (iii) for awards that are granted and vest in the same applicable year, the fair value as of the vesting date; (iv) for awards granted in prior years that vest in the applicable year, the amount equal to the change as of the vesting date (from the end of the prior fiscal year) in fair value; (v) for awards granted in prior years that are determined to fail to meet the applicable vesting conditions during the applicable year, a deduction for the amount equal to the fair value at the end of the prior fiscal year; and (vi) the dollar value of any dividends or other earnings paid on stock or option awards in the applicable year prior to the vesting date that are not otherwise reflected in the fair value of such award or included in any other component of total compensation for the applicable year. The valuation assumptions used to calculate fair values did not materially differ from those disclosed at the time of grant. The amounts deducted or added in calculating the equity award adjustments are as follows:
Year | Year End Fair Value of Outstanding and Unvested Equity Awards Granted in the Fiscal Year ($) | Year over Year Change in Fair Value of Outstanding and Unvested Equity Awards Granted in Prior Years ($) | Fair Value as of Vesting Date of Equity Awards Granted and Vested in the Year ($) | Year over Year Change in Fair Value of Equity Awards Granted in Prior Years that Vested in the Year ($) | Fair Value at the End of the Prior Year of Equity Awards that Failed to Meet Vesting Conditions in the Year ($) | Value of Dividends or other Earnings Paid on Stock or Option Awards not Otherwise Reflected in Fair Value ($) | Total Equity Award Adjustments ($) | ||||||||||||||||
| 2025 | — | 403,828,378 | — | 8,959,592 | — | — | 412,787,970 | ||||||||||||||||
| 2024 | 51,083,000 | (1,739,842) | 7,038,000 | (4,529,356) | (14,450,036) | — | 37,401,766 | ||||||||||||||||
| 2023 | — | (5,093,298) | — | 484,362 | — | — | (4,608,937) | ||||||||||||||||
Year | Average Reported Summary Compensation Table Total for Non-PEO NEOs ($) | Deduct Average Reported Value of Equity Awards ($) | Add (or Deduct) Average Equity Award Adjustmentsa ($) | Average Compensation Actually Paid to Non-PEO NEOs ($) | ||||||||||
| 2025 | 3,445,394 | (2,063,848) | 30,896,734 | 32,278,280 | ||||||||||
| 2024 | 3,792,370 | (2,673,975) | 5,507,214 | 6,625,609 | ||||||||||
| 2023 | 2,841,673 | (2,146,080) | (1,029,736) | (334,144) | ||||||||||
a The amounts deducted or added in calculating the total average equity award adjustments are as follows:
Year | Average Year End Fair Value of Outstanding and Unvested Equity Awards Granted in the Fiscal Year ($) | Year over Year Average Change in Fair Value of Outstanding and Unvested Equity Awards Granted in Prior Years ($) | Average Fair Value as of Vesting Date of Equity Awards Granted and Vested in the Year ($) | Year over Year Average Change in Fair Value of Equity Awards Granted in Prior Years that Vested in the Year ($) | Average Fair Value at the End of the Prior Year of Equity Awards that Failed to Meet Vesting Conditions in the Year ($) | Average Value of Dividends or other Earnings Paid on Stock or Option Awards not Otherwise Reflected in Fair Value ($) | Total Average Equity Award Adjustments ($) | ||||||||||||||||
| 2025 | 13,751,350 | 17,133,252 | — | 702,596 | (690,464) | — | 30,896,734 | ||||||||||||||||
| 2024 | 5,780,496 | 143,757 | — | (174,362) | (242,677) | — | 5,507,214 | ||||||||||||||||
| 2023 | 340,400 | (303,198) | — | 64,574 | (1,131,513) | — | (1,029,736) | ||||||||||||||||
Bloom Energy Corp CAP vs TSR
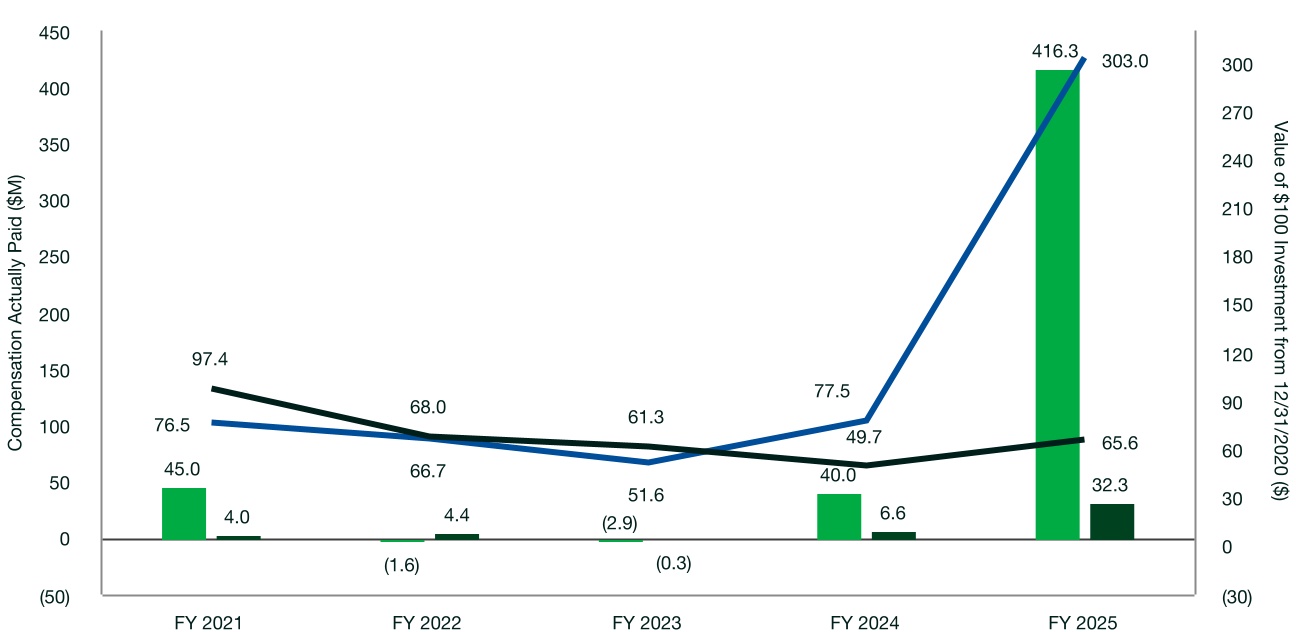
 | KR Sridhar |  | Avg NEO CAP |  | BE TSR |  | NASDAQ Clean Edge Green Energy Total Return Index TSR | ||||||||||||||||
Bloom Energy Corp CAP vs Net Income
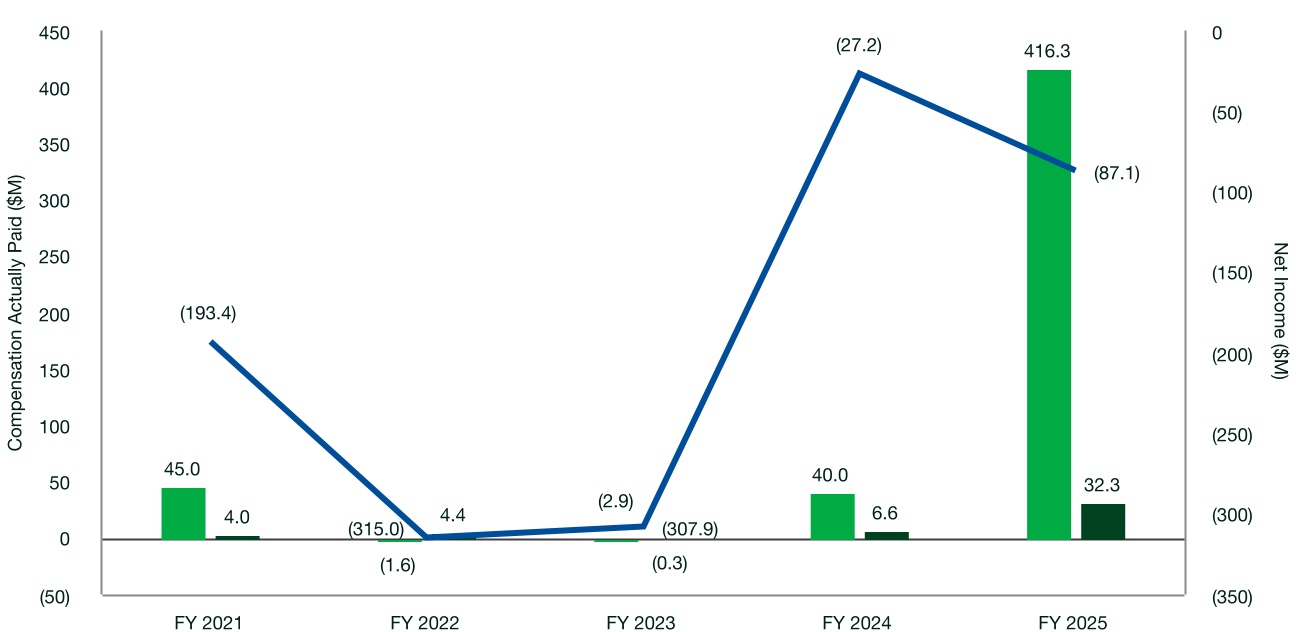
| | KR Sridhar | | Avg NEO CAP | | Net Income | ||||||||||||
Bloom Energy Corp CAP vs Total Revenue
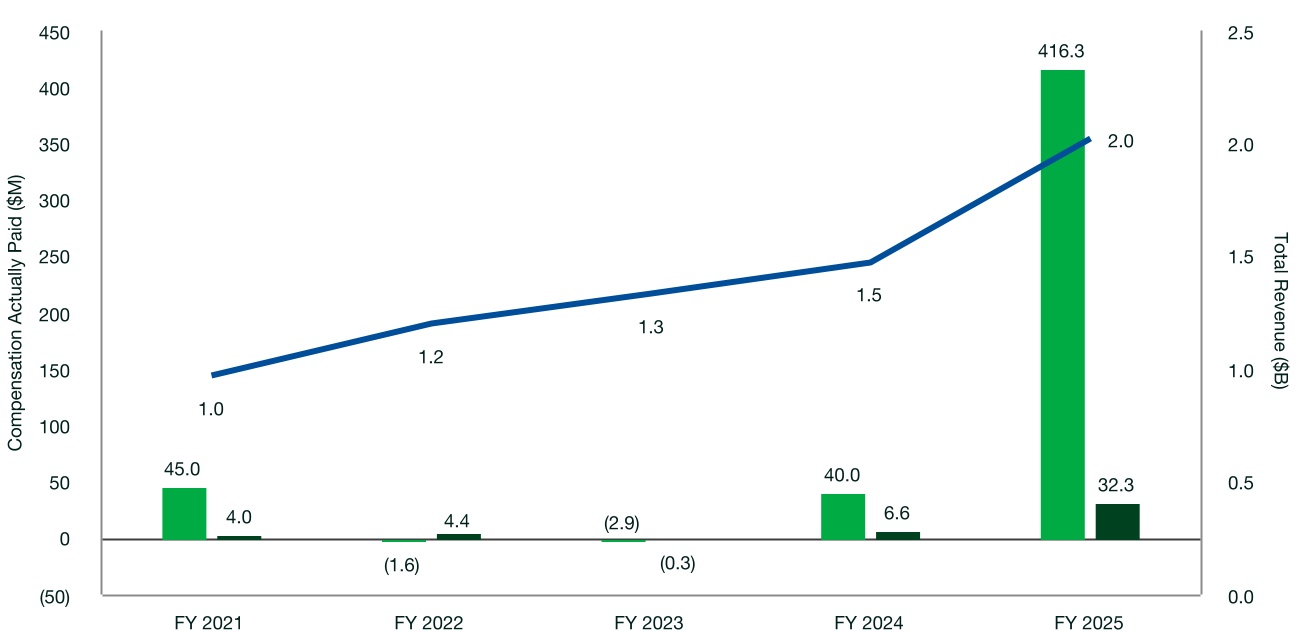
| | KR Sridhar | | Avg NEO CAP | | Product and Service Revenue | ||||||||||||
•total revenue
•annual product revenue growth
•annual adjusted gross product margin
•non-GAAP operating income/loss
As required by Section 953(a) of the Dodd-Frank Wall Street Reform and Consumer Protection Act, and Item 402(v) of Regulation S-K, we are providing the following information about the relationship between executive compensation actually paid and certain financial performance of the Company. For further information concerning the Company’s pay for performance philosophy and how the Company aligns executive compensation with the Company’s performance, refer to the Compensation Discussion and Analysis of this Proxy Statement.
Cumulative TSR is calculated by dividing the sum of the cumulative amount of dividends for the measurement period, assuming dividend reinvestment, and the difference between the Company’s share price at the end of each fiscal year shown and the beginning of the measurement period by the Company’s share price at the beginning of the measurement period. The beginning of the measurement period for each year in the table is December 31, 2020.The dollar amounts reported represent the amount of net income (loss) reflected in the Company’s audited financial statements for the applicable year (net income (loss) before portion attributable to redeemable noncontrolling interest and noncontrolling interest). 8The Company-selected measure is Revenue as this metric replaced the non-GAAP operating gross margin used to determine ACI awards, described in our Compensation Discussion and Analysis section of this Proxy Statement above.
9The average "Compensation Actually Paid" to the non-PEO named executive officers for fiscal 2024 and 2023 reflects updates to underlying compensation data from that previously reported, including the correction of an immaterial amount previously included in prior year total compensation for one executive and the inclusion of compensation previously omitted for another individual who was a named executive officer for the applicable year but is no longer a named executive officer.