PAY VERSUS PERFORMANCE
The following tables and related disclosures have been prepared in accordance with the SEC’s pay versus performance rules in Item 402(v) of Regulation S-K of the Exchange Act (“Item 402(v)”) and provide information about (i) the total compensation (“SCT Total”) of our principal executive officers (“PEOs”) and our non-PEO NEOs (collectively, the “Non-PEO NEOs”) as presented in the Summary Compensation Table on page 33, (ii) the “compensation actually paid” (“CAP”) to our PEOs and our Non-PEO NEOs, as calculated pursuant to Item 402(v), (iii) certain financial performance measures, and (iv) the relationship of the CAP to those financial performance measures. The below tables and disclosures do not necessarily reflect value actually realized by the NEOs or how the Compensation Committee evaluates compensation decisions in light of the Company’s performance or individual performance.
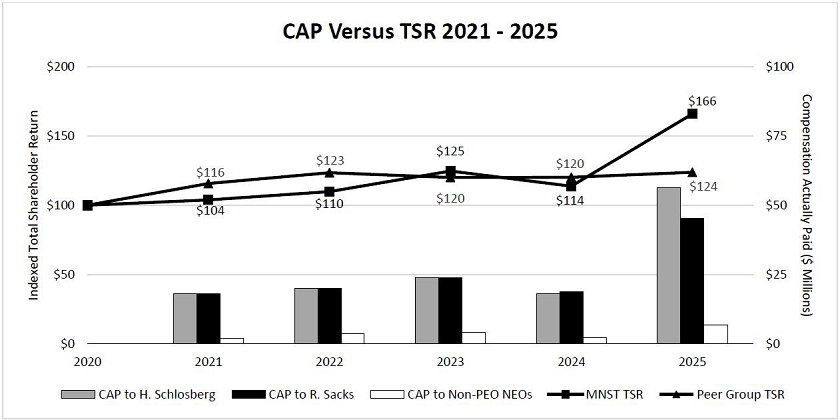
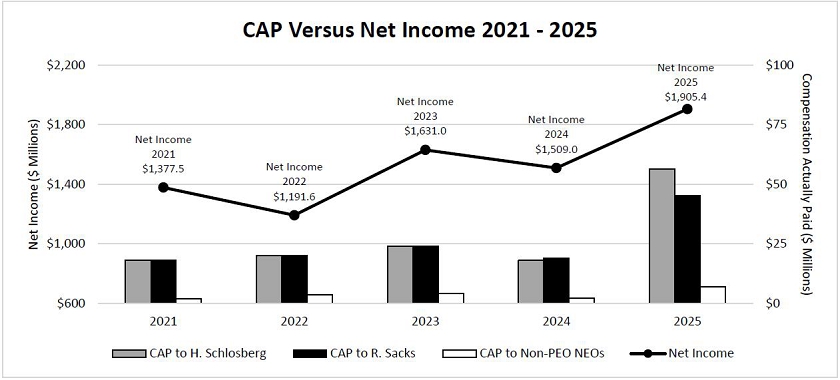
| Summary | Summary | Compensation | Compensation | Average | Average | Value of Fixed $100 Investment Based on: | Adjusted Operating | |||
| Year | Compensation Table Total for PEO Hilton H. Schlosberg ($)(1) | Compensation Table Total for Former PEO Rodney C. Sacks ($)(1) | Actually Paid to PEO Hilton H. Schlosberg ($)(1) | Actually Paid to Former PEO Rodney C. Sacks ($)(1) | Summary Compensation Table Total for Non-PEO NEOs ($)(1) | Compensation Actually Paid to Non-PEO NEOs ($)(1) | Total Shareholder Return ($)(2) | Peer Group Total Shareholder Return ($)(3) | Net Income (In Thousands) ($) | Income (Non- GAAP) (In Thousands) ($)(4) |
| 2025 | 19,282,630 | 13,845,537 | 56,281,111 | 45,275,425 | 3,307,908 | 6,931,572 | 166 | 124 | 1,905,432 | 2,522,215 |
| 2024 | 16,868,040 | 17,709,651 | 18,038,891 | 18,880,502 | 2,561,361 | 2,281,797 | 114 | 120 | 1,509,048 | 2,127,143 |
| 2023 | 17,805,908 | 17,875,482 | 23,904,895 | 23,974,469 | 3,182,634 | 4,210,627 | 125 | 120 | 1,630,988 | 2,012,539 |
| 2022 | 15,394,400 | 15,417,084 | 20,033,195 | 20,055,879 | 2,837,541 | 3,565,950 | 110 | 123 | 1,191,624 | 1,685,745 |
| 2021 | 16,686,528 | 16,707,577 | 18,121,808 | 18,142,857 | 2,013,059 | 1,961,241 | 104 | 116 | 1,377,475 | 1,816,831 |
| (1) | For 2025, our PEOs were Hilton H. Schlosberg and Rodney C. Sacks, and our Non-PEO NEOs were Thomas J. Kelly, Emelie C. Tirre, Guy P. Carling and Rob L. Gehring. Mr. Sacks was no longer a PEO effective June 13, 2025. For 2024, 2023, 2022 and 2021, our PEOs were Hilton H. Schlosberg and Rodney C. Sacks, and our Non-PEO NEOs were Thomas J. Kelly, Emelie C. Tirre and Guy P. Carling. |
| (2) | The amounts represent an initial value of $100 on December 31, 2020 at the end of the fiscal years ended December 31, 2021 through 2025 and assumes that all dividends (if applicable) were reinvested. |
| (3) | The amounts represent an initial value of $100 into the Company’s peer group on a market capitalization weighted basis on December 31, 2020 at the end of the fiscal years ended December 31, 2021 through 2025 and assumes that all dividends (if applicable) were reinvested. The Company’s self-selected peer group is as described in Part II, Item 5 of our Annual Report on Form 10-K for the fiscal year ended December 31, 2025, filed with the SEC on February 27, 2026, which is comprised of TCCC, Keurig Dr. Pepper Inc., Constellation Brands, Inc., Molson Coors Beverage Company and PepsiCo, Inc. | |
| (4) | The Company has elected to present adjusted operating income, as the Company-selected measure to assist in understanding the changes in CAP over the fiscal years presented. For a reconciliation of adjusted operating income to operating income, the most directly comparable GAAP financial measure, see Appendix A. |
A reconciliation of adjustments from SCT Total to CAP for our PEOs and Non-PEO NEOs is presented in the table below. For purposes of this reconciliation, because the Company historically has not paid dividends, no adjustment was made for the amount of any dividends or other earnings for any unvested stock awards on which dividends or other earnings were paid during any applicable fiscal year that were not otherwise included in the total compensation column of the SCT for the applicable fiscal year.
| PEO/ | SCT Total | (a) | (b) | (c) | (d) | (e) | (f) | (g) | CAP Amounts | |
| Year | Non-PEO NEOs | ($) | ($) | ($) | ($) | ($) | ($) | ($) | ($) | ($) |
| PEO Hilton H. Schlosberg | 19,282,630 | (14,180,811) | 30,805,900 | 13,440,902 | 6,932,490 | 56,281,111 | ||||
| 2025 | Former PEO Rodney C. Sacks | 13,845,537 | (9,429,467) | 20,485,963 | 13,440,902 | 6,932,490 | 45,275,425 | |||
| Non-PEO NEOs* | 3,307,908 | (1,301,343) | 2,810,417 | 1,659,845 | 454,745 | 6,931,572 | ||||
| PEO Hilton H. Schlosberg | 16,868,040 | (14,055,685) | 11,601,946 | 4,772,335 | (1,147,745) | 18,038,891 | ||||
| 2024 | Former PEO Rodney C. Sacks | 17,709,651 | (14,055,685) | 11,601,946 | 4,772,335 | (1,147,745) | 18,880,502 | |||
| Non-PEO NEOs* | 2,561,361 | (1,252,134) | 1,027,936 | 57,972 | (113,338) | 2,281,797 | ||||
| PEO Hilton H. Schlosberg | 17,805,908 | (13,746,659) | 15,916,007 | 2,873,972 | 1,055,667 | 23,904,895 | ||||
| 2023 | Former PEO Rodney C. Sacks | 17,875,482 | (13,746,659) | 15,916,007 | 2,873,972 | 1,055,667 | 23,974,469 | |||
| Non-PEO NEOs* | 3,182,634 | (1,490,600) | 1,750,353 | 581,262 | 186,978 | 4,210,627 | ||||
| PEO Hilton H. Schlosberg | 15,394,400 | (13,563,286) | 21,055,402 | 1,634,689 | (4,488,010) | 20,033,195 | ||||
| 2022 | Former PEO Rodney C. Sacks | 15,417,084 | (13,563,286) | 21,055,402 | 1,634,689 | (4,488,010) | 20,055,879 | |||
| Non-PEO NEOs* | 2,837,541 | (1,655,774) | 2,583,986 | 414,736 | (614,539) | 3,565,950 | ||||
| PEO Hilton H. Schlosberg | 16,686,528 | (13,529,221) | 14,649,088 | 1,006,176 | (690,763) | 18,121,808 | ||||
| 2021 | Former PEO Rodney C. Sacks | 16,707,577 | (13,529,221) | 14,649,088 | 1,006,176 | (690,763) | 18,142,857 | |||
| Non-PEO NEOs* | 2,013,059 | (841,200) | 909,252 | 217,845 | (337,715) | 1,961,241 |
| * | Amounts presented are averages for the entire group of Non-PEO NEOs in each respective year. |
| (a) | (Deduct): Aggregate value for stock awards and option awards included in SCT for the covered fiscal year. |
| (b) | Add: Fair value at year end of stock awards and option awards granted during the covered fiscal year that were outstanding and unvested at the covered fiscal year end. |
| (c) | Add (Deduct): The change in fair value (whether positive or negative) at the covered fiscal year end of stock awards and option awards granted in any prior fiscal year that were outstanding and unvested at the covered fiscal year end, as measured from the end of the prior fiscal year. |
| (d) | Add: Vesting date fair value of stock awards and option awards granted and vested during the covered fiscal year. |
| (e) | Add (Deduct): Change as of the vesting date (from the end of the prior fiscal year) in fair value (whether positive or negative) of awards granted in any prior fiscal year for which vesting conditions were satisfied during the covered fiscal year. |
| (f) | Deduct: Fair value at the applicable fiscal year end of stock awards and option awards that were granted in any prior fiscal year that did not vest during the covered fiscal year by failing to satisfy the relevant vesting conditions for the applicable stock award or option award. |
| (g) | Add: Dividends or other earnings paid on stock awards or option awards in the covered fiscal year prior to vesting if not otherwise included in the SCT Total for the covered fiscal year. |
| (1) | For 2025, our PEOs were Hilton H. Schlosberg and Rodney C. Sacks, and our Non-PEO NEOs were Thomas J. Kelly, Emelie C. Tirre, Guy P. Carling and Rob L. Gehring. Mr. Sacks was no longer a PEO effective June 13, 2025. For 2024, 2023, 2022 and 2021, our PEOs were Hilton H. Schlosberg and Rodney C. Sacks, and our Non-PEO NEOs were Thomas J. Kelly, Emelie C. Tirre and Guy P. Carling. |
| (3) | The amounts represent an initial value of $100 into the Company’s peer group on a market capitalization weighted basis on December 31, 2020 at the end of the fiscal years ended December 31, 2021 through 2025 and assumes that all dividends (if applicable) were reinvested. The Company’s self-selected peer group is as described in Part II, Item 5 of our Annual Report on Form 10-K for the fiscal year ended December 31, 2025, filed with the SEC on February 27, 2026, which is comprised of TCCC, Keurig Dr. Pepper Inc., Constellation Brands, Inc., Molson Coors Beverage Company and PepsiCo, Inc. | |
A reconciliation of adjustments from SCT Total to CAP for our PEOs and Non-PEO NEOs is presented in the table below. For purposes of this reconciliation, because the Company historically has not paid dividends, no adjustment was made for the amount of any dividends or other earnings for any unvested stock awards on which dividends or other earnings were paid during any applicable fiscal year that were not otherwise included in the total compensation column of the SCT for the applicable fiscal year.
| PEO/ | SCT Total | (a) | (b) | (c) | (d) | (e) | (f) | (g) | CAP Amounts | |
| Year | Non-PEO NEOs | ($) | ($) | ($) | ($) | ($) | ($) | ($) | ($) | ($) |
| PEO Hilton H. Schlosberg | 19,282,630 | (14,180,811) | 30,805,900 | 13,440,902 | 6,932,490 | 56,281,111 | ||||
| 2025 | Former PEO Rodney C. Sacks | 13,845,537 | (9,429,467) | 20,485,963 | 13,440,902 | 6,932,490 | 45,275,425 | |||
| Non-PEO NEOs* | 3,307,908 | (1,301,343) | 2,810,417 | 1,659,845 | 454,745 | 6,931,572 | ||||
| PEO Hilton H. Schlosberg | 16,868,040 | (14,055,685) | 11,601,946 | 4,772,335 | (1,147,745) | 18,038,891 | ||||
| 2024 | Former PEO Rodney C. Sacks | 17,709,651 | (14,055,685) | 11,601,946 | 4,772,335 | (1,147,745) | 18,880,502 | |||
| Non-PEO NEOs* | 2,561,361 | (1,252,134) | 1,027,936 | 57,972 | (113,338) | 2,281,797 | ||||
| PEO Hilton H. Schlosberg | 17,805,908 | (13,746,659) | 15,916,007 | 2,873,972 | 1,055,667 | 23,904,895 | ||||
| 2023 | Former PEO Rodney C. Sacks | 17,875,482 | (13,746,659) | 15,916,007 | 2,873,972 | 1,055,667 | 23,974,469 | |||
| Non-PEO NEOs* | 3,182,634 | (1,490,600) | 1,750,353 | 581,262 | 186,978 | 4,210,627 | ||||
| PEO Hilton H. Schlosberg | 15,394,400 | (13,563,286) | 21,055,402 | 1,634,689 | (4,488,010) | 20,033,195 | ||||
| 2022 | Former PEO Rodney C. Sacks | 15,417,084 | (13,563,286) | 21,055,402 | 1,634,689 | (4,488,010) | 20,055,879 | |||
| Non-PEO NEOs* | 2,837,541 | (1,655,774) | 2,583,986 | 414,736 | (614,539) | 3,565,950 | ||||
| PEO Hilton H. Schlosberg | 16,686,528 | (13,529,221) | 14,649,088 | 1,006,176 | (690,763) | 18,121,808 | ||||
| 2021 | Former PEO Rodney C. Sacks | 16,707,577 | (13,529,221) | 14,649,088 | 1,006,176 | (690,763) | 18,142,857 | |||
| Non-PEO NEOs* | 2,013,059 | (841,200) | 909,252 | 217,845 | (337,715) | 1,961,241 |
| * | Amounts presented are averages for the entire group of Non-PEO NEOs in each respective year. |
| (a) | (Deduct): Aggregate value for stock awards and option awards included in SCT for the covered fiscal year. |
| (b) | Add: Fair value at year end of stock awards and option awards granted during the covered fiscal year that were outstanding and unvested at the covered fiscal year end. |
| (c) | Add (Deduct): The change in fair value (whether positive or negative) at the covered fiscal year end of stock awards and option awards granted in any prior fiscal year that were outstanding and unvested at the covered fiscal year end, as measured from the end of the prior fiscal year. |
| (d) | Add: Vesting date fair value of stock awards and option awards granted and vested during the covered fiscal year. |
| (e) | Add (Deduct): Change as of the vesting date (from the end of the prior fiscal year) in fair value (whether positive or negative) of awards granted in any prior fiscal year for which vesting conditions were satisfied during the covered fiscal year. |
| (f) | Deduct: Fair value at the applicable fiscal year end of stock awards and option awards that were granted in any prior fiscal year that did not vest during the covered fiscal year by failing to satisfy the relevant vesting conditions for the applicable stock award or option award. |
| (g) | Add: Dividends or other earnings paid on stock awards or option awards in the covered fiscal year prior to vesting if not otherwise included in the SCT Total for the covered fiscal year. |
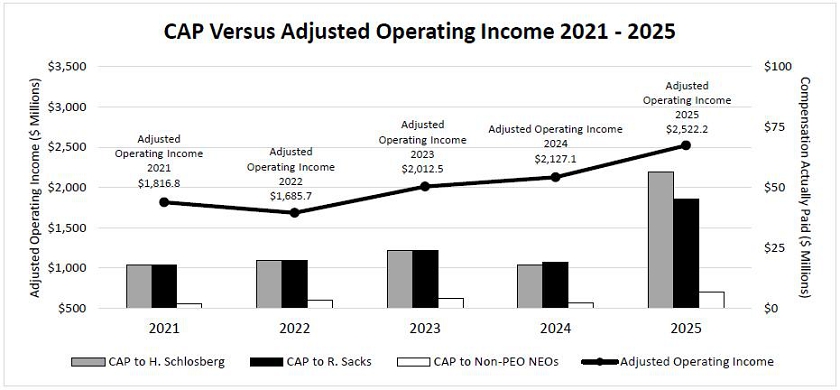
The following table lists the financial performance measures that, in the Company’s assessment, represent the most important performance measures used to link CAP for our NEOs to Company performance for 2025. We determined adjusted operating income to be the most important financial performance measure used to link the Company’s performance to CAP to our PEOs and Non-PEO NEOs in 2025. We may determine different financial performances to be the most important financial performance in future years.
| Financial Performance Measures |
| Adjusted operating income |
| Adjusted diluted EPS |
| (4) | The Company has elected to present adjusted operating income, as the Company-selected measure to assist in understanding the changes in CAP over the fiscal years presented. For a reconciliation of adjusted operating income to operating income, the most directly comparable GAAP financial measure, see Appendix A. |