Pay Versus Performance
The “Compensation Actually Paid” values shown below do not reflect the compensation actually paid to the CEO or the NEOs. As such, the Compensation Committee did not consider the information provided in the table in structuring or determining compensation for our NEOs. For a complete discussion of the company’s executive compensation program and the Committee’s philosophy and approach, please refer to the CD&A section of this Proxy Statement (beginning on page 41).
The table intends to compare “Pay Versus Performance” and prescribes a method to calculate “Compensation Actually Paid” (CAP). While the table shows SCT compensation and CAP values side by side, they are not comparable.
Together with the salary and annual incentive, the SCT values include the accounting fair value of equity awards granted in the year shown (at the time the grant was made), whereas CAP values include a revaluation of the current grant at year-end, plus the year-over-year change in the fair value of multiple years of historical equity grants. Because CAP includes multiple years of grants, the calculation of CAP each year is heavily impacted by the change in the stock price and therefore, may be higher or lower than the SCT compensation values.
The actual value of an equity award realized by an executive depends on several factors measured over multiple years, including the stock price, the financial performance of the company, the rTSR performance of the company as compared to a peer group, timing of stock option exercises and other factors.
| Value of Initial Fixed $100 Investment Based on | ||||||||||||||||
| Year | Summary Compensation Table Total for PEO ($)(a) | Compensation Actually Paid to PEO ($)(a)(b)(c) | Average Summary Compensation Table Total for Non-PEO NEOs ($)(a) | Average Compensation Actually Paid to Non-PEO NEOs ($)(a)(b)(c) | GD
Total Shareholder Return ($) | S&P Total Aerospace & Defense Shareholder Return ($)(d) | Net Earnings ($M) | Annual ROIC(e) | ||||||||
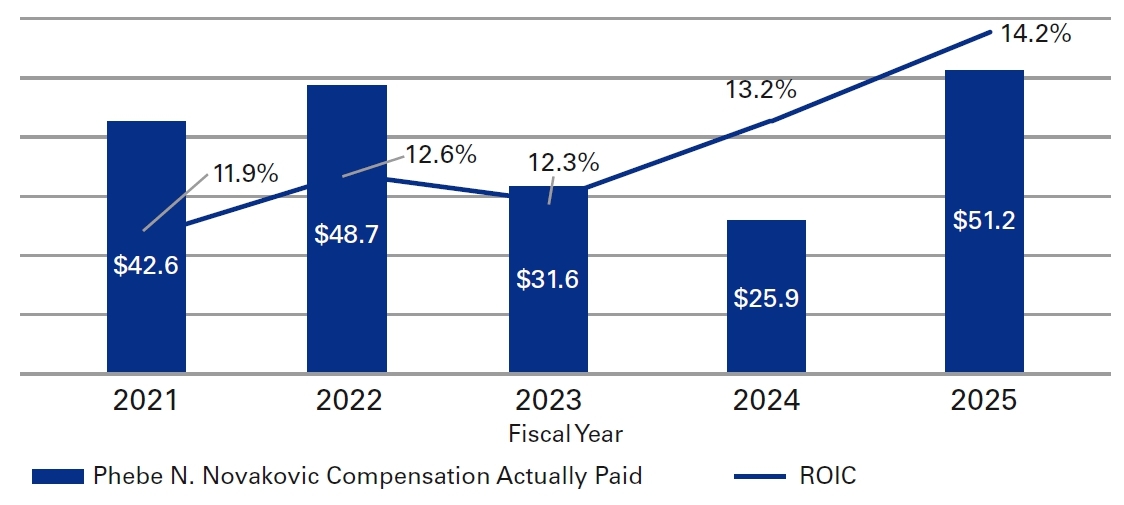
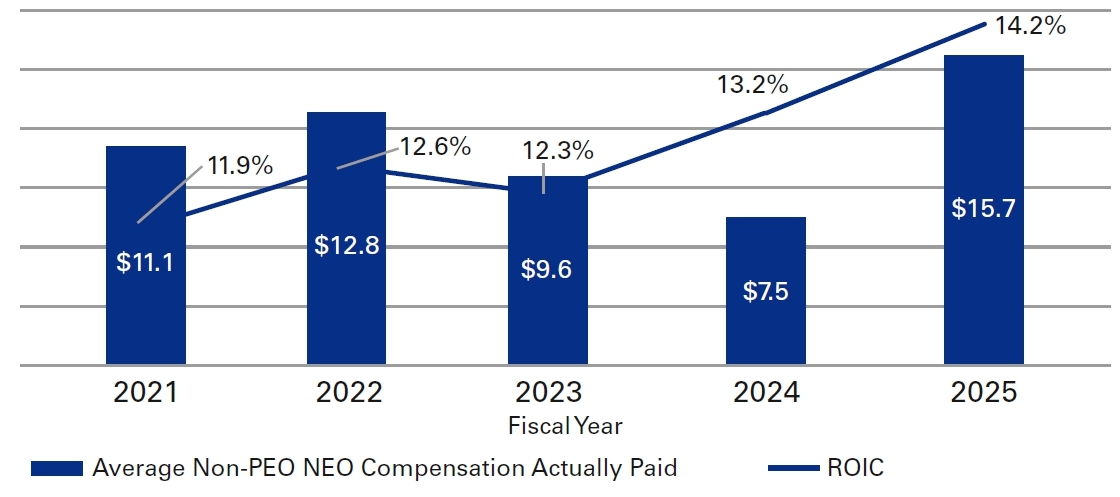
| 2025 | 25,924,082 | 51,230,765 | 8,680,154 | 15,742,758 | 253 | 230 | 4,210 | 14.2% | ||||||||
| 2024 | 23,794,702 | 25,948,804 | 7,130,795 | 7,525,174 | 194 | 162 | 3,782 | 13.2% | ||||||||
| 2023 | 22,582,776 | 31,647,903 | 7,204,864 | 9,619,890 | 187 | 142 | 3,315 | 12.3% | ||||||||
| 2022 | 21,478,167 | 48,651,910 | 6,221,750 | 12,842,568 | 175 | 133 | 3,390 | 12.6% | ||||||||
| 2021 | 23,553,861 | 42,557,364 | 6,501,277 | 11,102,219 | 144 | 113 | 3,257 | 11.9% | ||||||||
| (a) | For each year represented, Ms. Phebe N. Novakovic was our principal executive officer (PEO). The individuals comprising the Non-PEO NEOs for each year presented are listed below. |
| 2021 | 2022 | 2023 | 2024 | 2025 |
| Jason W. Aiken | Jason W. Aiken | Jason W. Aiken | Jason W. Aiken | Jason W. Aiken |
| Mark L. Burns | Mark L. Burns | Mark L. Burns | Mark L. Burns | Mark L. Burns |
| Robert E. Smith | Robert E. Smith | Robert E. Smith | Robert E. Smith | Kimberly A. Kuryea |
| Mark C. Roualet | Mark C. Roualet | Mark C. Roualet | Kimberly A. Kuryea | Danny Deep |
| Danny Deep |
| (d) | TSR shown in this table utilizes the S&P 500 Aerospace & Defense (A&D) Index, which we use in our stock performance graph required by Item 201(e) of Regulation S-K included in the company’s consolidated audited financial statements filed with the SEC on Form 10-K for the years reflected in the table above. The comparison assumes $100 was invested for the period starting December 31, 2020, through December 31 of the applicable fiscal year in each of the company’s Common Stock and the S&P A&D Index. All dollar values assume reinvestment of the pre-tax value of dividends paid by companies included in the S&P A&D Index. The historical stock price performance of our Common Stock shown is not necessarily indicative of future stock price performance. |
| SCT Total to Compensation Actually Paid Reconciliation for the PEO and non-PEO NEOs: |
| Calculation for PEO | Calculation for Average of Non-PEO NEOs | ||||||||
| Calculation(1)
of Compensation Actually Paid | Year 2024 ($) | Year 2025 ($) | Year 2024 ($) | Year 2025 ($) | |||||
| Summary Compensation Table Total | 23,794,702 | 25,924,082 | 7,130,795 | 8,680,154 | |||||
| Less aggregate change in actuarial present value of pension benefits | 0 | 0 | 0 | 0 | |||||
| Less grant date fair value of stock and option awards | (17,752,248) | (17,760,079) | (4,927,971) | (5,294,502) | |||||
| Add year-end fair value of awards granted during the fiscal year that are outstanding and unvested as of the end of the fiscal year | 16,252,006 | 27,425,701 | 4,511,493 | 8,175,816 | |||||
| Add change in fair value (whether positive or negative) as of vesting date of awards granted in prior fiscal years for which all applicable vesting conditions were satisfied at fiscal year-end or during the fiscal year | 2,791,083 | (1,282,311) | 624,107 | (282,340) | |||||
| Add change in fair value (whether positive or negative) as of fiscal year-end for unvested and outstanding awards granted in prior fiscal years | 640,687 | 16,691,403 | 130,062 | 4,398,635 | |||||
| Add dividends paid on unvested equity awards during the fiscal year | 222,574 | 231,969 | 56,688 | 64,995 | |||||
| Compensation Actually Paid | 25,948,804 | 51,230,765 | 7,525,174 | 15,742,758 | |||||
| (1) | For the PEO and other NEOs, for each covered year, service cost and prior service cost of pension benefits equals $0, fair value of awards that are granted and vest in the same covered fiscal year equals $0, and fair value of awards granted in prior years that are determined to fail to meet the applicable vesting conditions during the covered fiscal year equals $0. |
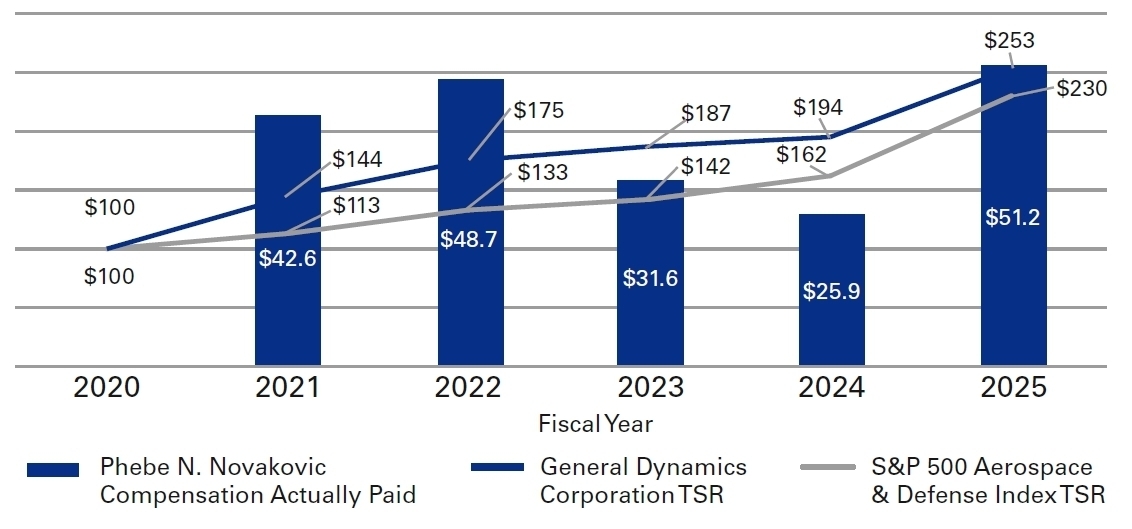
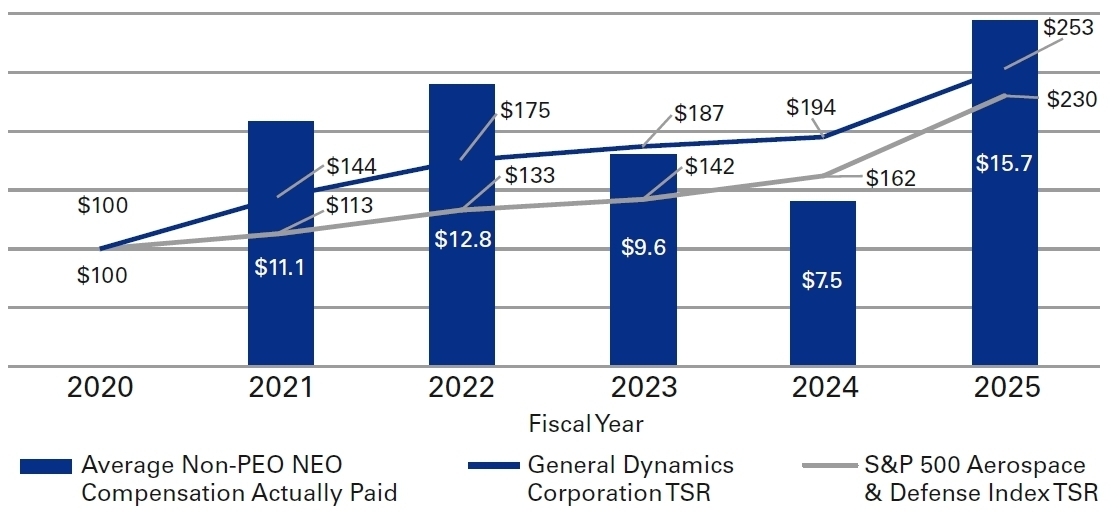
| PEO Compensation Actually Paid ($M) Versus TSR | Average Non-PEO NEO Compensation Actually Paid ($M) Versus TSR | |
 |
 | |
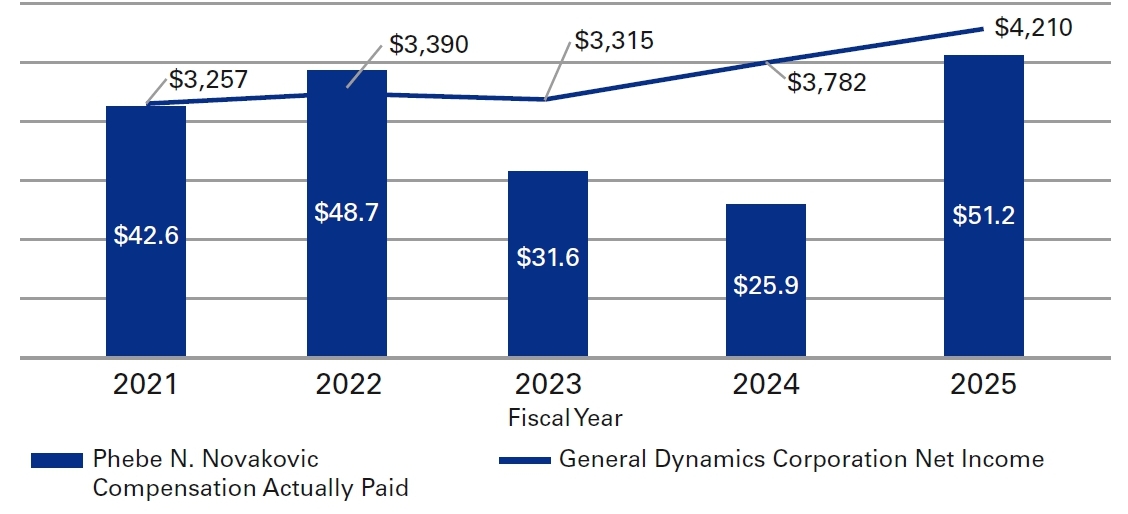
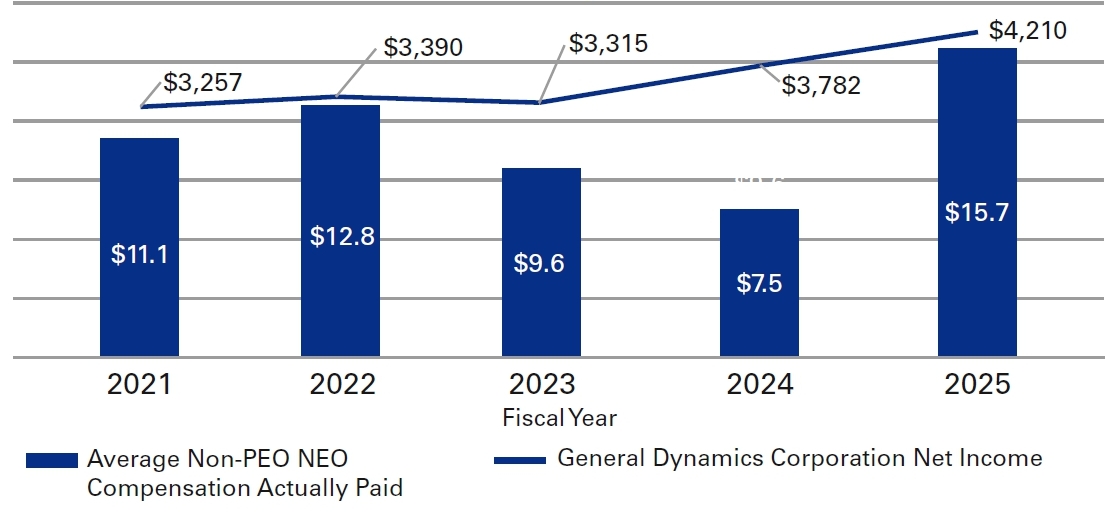
| PEO Compensation Actually Paid ($M) Versus Net Earnings ($M) | Average Non-PEO NEO Compensation Actually Paid ($M) Versus Net Earnings ($M) | |
 |
 | |
| PEO Compensation Actually Paid ($M) Versus ROIC | Average Non-PEO NEO Compensation Actually Paid ($M) Versus ROIC | |
 |
 |
2025 Tabular List of Most Important Financial and Non-Financial Performance Measures
The following table presents the financial and non-financial performance measures that the company considers to have been the most important in linking CAP to our PEO and other NEOs in 2025 as set forth in the table above to company performance. The measures in this table are not ranked.
| Most Important Performance Measures | |
| Diluted EPS | |
| Free Cash Flow | |
| Operating Margin | |
| Return on Invested Capital (ROIC) | |
| Total Shareholder Return |