Tabular Disclosure of Pay Versus Performance
|
|
|
|
|
|
|
|
|
|
Value of Initial Fixed $100 Investment on December 31, 2020 Based On: |
|
|
Year |
Summary Compensation Table Total |
Summary Compensation Table Total |
Summary Compensation Table Total |
Compensation Actually Paid to PEO1(1),(5) |
Compensation Actually Paid to PEO2(2),(5) |
Compensation Actually Paid to PEO3(3) |
Average Summary Compensation Table Total |
Average Compensation Actually Paid to Non-PEO NEOs(4),(5) |
Norfolk Southern Total Shareholder Return |
Peer Group |
Net Income |
After-Tax Return on Average Invested Capital(7) |
2025 |
16,245,050 |
|
|
13,376,591 |
|
|
5,442,145 |
4,386,599 |
$135 |
$129 |
2,873 |
11.8% |
2024 |
8,985,660 |
11,924,070 |
|
9,134,271 |
(5,709,671) |
|
5,282,388 |
4,304,294 |
$107 |
$116 |
2,622 |
11.5% |
2023 |
|
13,418,978 |
|
|
4,077,950 |
|
3,478,630 |
1,402,195 |
$106 |
$121 |
1,827 |
11.4% |
2022 |
|
9,770,910 |
9,615,456 |
|
10,444,401 |
1,969,194 |
4,239,302 |
4,343,073 |
$107 |
$106 |
3,270 |
14.1% |
2021 |
|
|
14,016,942 |
|
|
25,072,294 |
4,059,729 |
5,783,924 |
$127 |
$126 |
3,005 |
12.7% |
Notes:
Summary Compensation Table to Compensation Actually Paid Reconciliation
|
|
|
|
PEO1 |
|
Average of |
|
|
|
|
|
2025 |
|
2025 |
|
Components of Compensation |
|
($) |
|
($) |
|
||
Summary Compensation Table (SCT) Total |
16,245,050 |
|
5,442,145 |
|
|||
Deductions From SCT Total |
|
|
|
|
|||
Stock Awards and Option Awards Value |
11,499,743 |
|
2,793,743 |
|
|||
Change in Pension Value and Nonqualified Deferred Compensation Earnings |
511,140 |
|
727,476 |
|
|||
Additions to SCT Total (i) |
|
|
|
|
|||
Year-End Fair Value of Equity Awards Granted During the Year |
7,480,848 |
|
1,817,340 |
|
|||
Change in Value During the Year of Prior-Year Awards Remaining Unvested |
718,600 |
|
444,466 |
|
|||
Change in Value During the Year of Prior-Year Awards Vesting During the Year |
298,170 |
|
44,838 |
|
|||
Dividend Equivalent Payments Made on Unvested Awards |
473,472 |
|
118,925 |
|
|||
Current-Year Pension Service Cost |
171,334 |
|
40,104 |
|
|||
Value of Changes in Pension Plan |
0 |
|
0 |
|
|||
Compensation Actually Paid |
13,376,591 |
|
4,386,599 |
|
|||
1. Compensation Actually Paid Compared to TSR
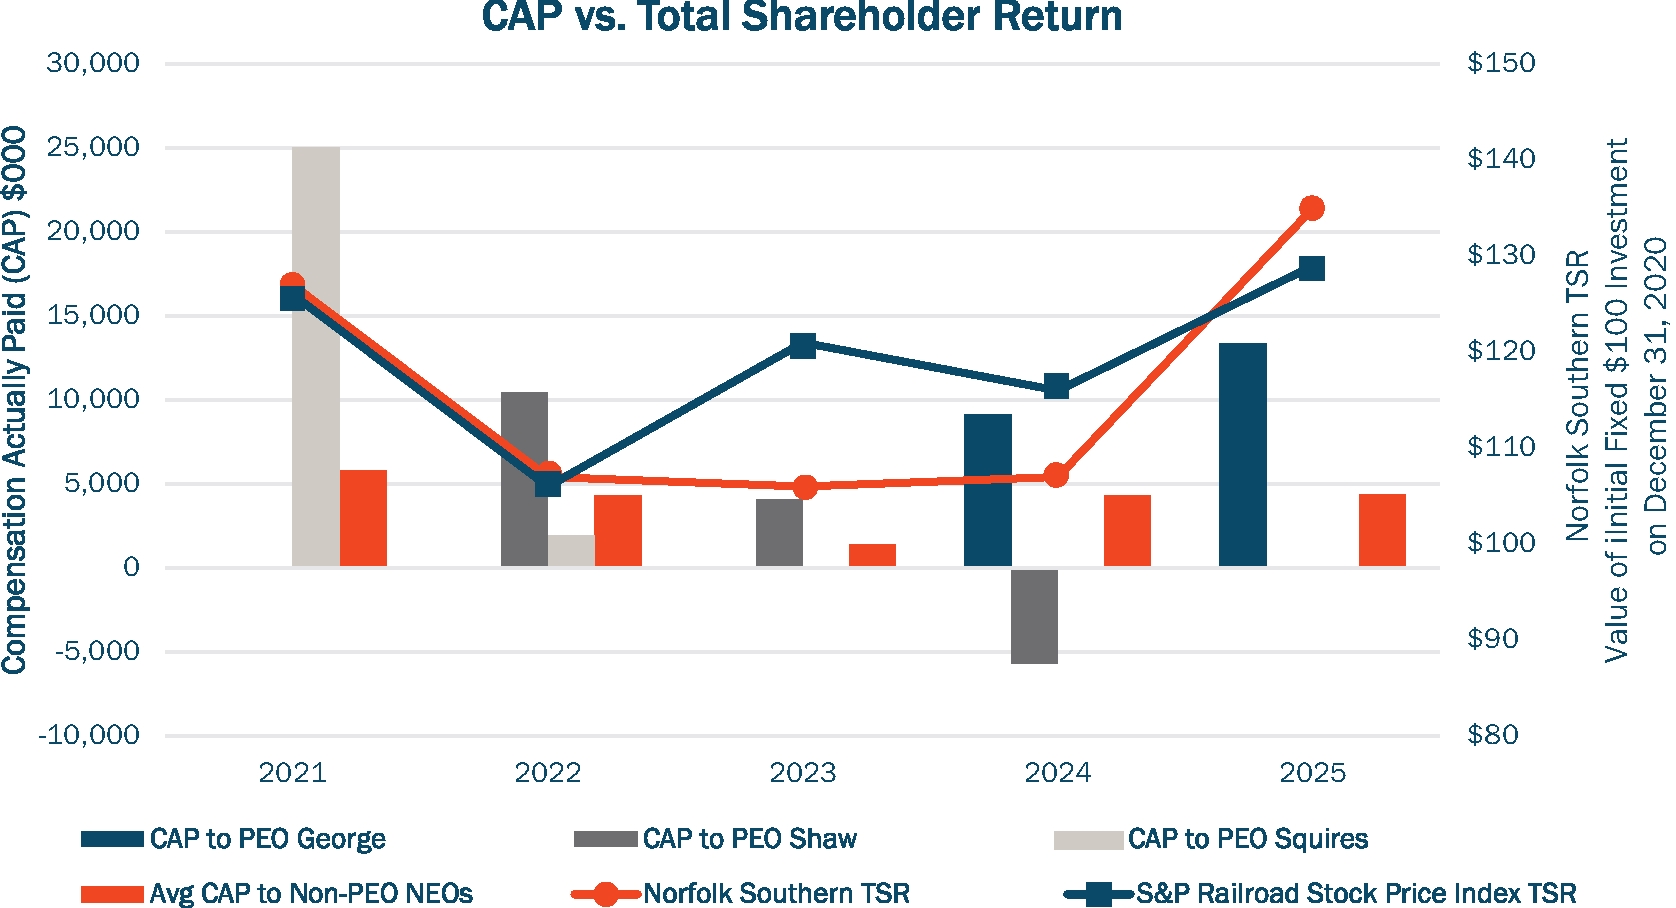
As shown in the chart below, compensation actually paid (CAP) to the PEOs and the non-PEO NEOs is aligned with total shareholder return on Norfolk Southern's stock. This is primarily because the majority of compensation to the named executive officers is in the form of long-term, stock-based incentives which are tied directly to stock price, as described in the CD&A report. Norfolk Southern’s total shareholder return (TSR) was aligned with the peer group for 2021 and 2022, declined somewhat in 2023 due largely to the effects of the East Palestine derailment, and compared favorably to the peer group in 2024 and 2025 based on improved business performance. CAP to all NEOs declined in 2023 and CAP to non-CEO NEOs increased in 2024, aligned with relative TSR performance. CAP for 2024 to Mr. Shaw was negative due to the forfeiture of his annual incentive payment and all unvested equity awards as a result of his termination for Cause. CAP to Mr. George increased in 2025 largely because 2025 was the first full year for which he served as PEO. CAP to the non-PEO NEOs was relatively constant from 2024 to 2025 due to decreases in the value of stock awards to some of these executives from 2024 to 2025.
2. Compensation Actually Paid Compared to Net Income
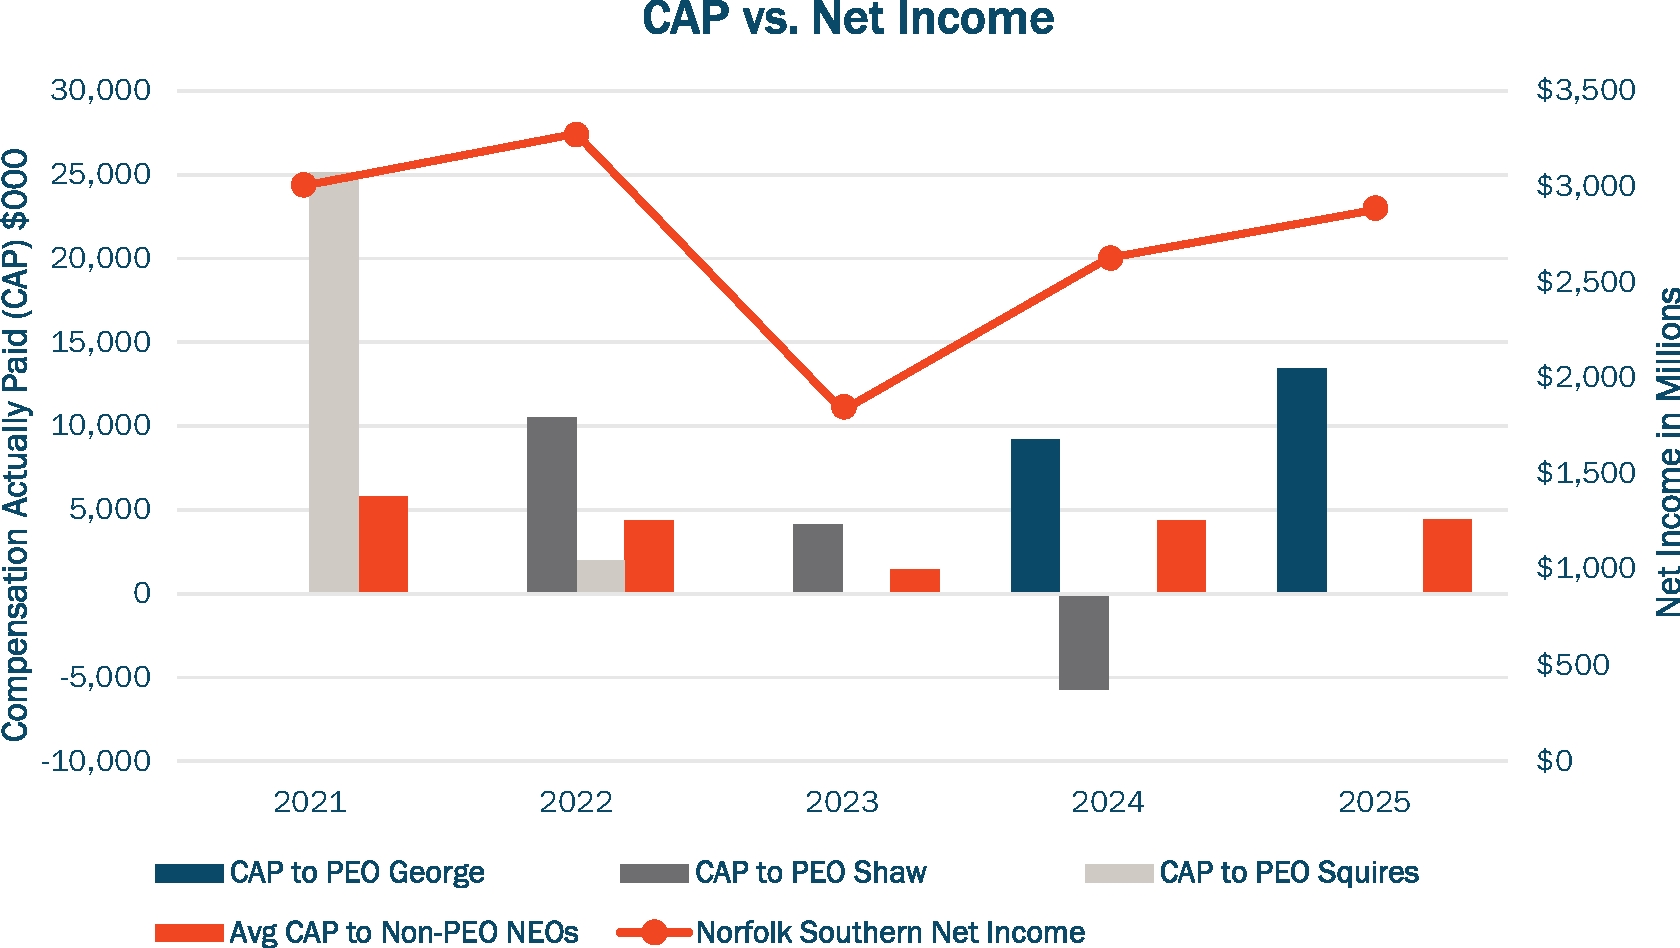
As shown in the chart below, CAP to the PEOs and other NEOs is generally, but not directly, aligned with net income. This is primarily because the majority of compensation to the named executive officers is in the form of long-term, stock-based incentives which are sensitive to changes in stock price. Compensation to our named executive officers is not tied directly to net income, although annual incentive awards are partially based on operating income.
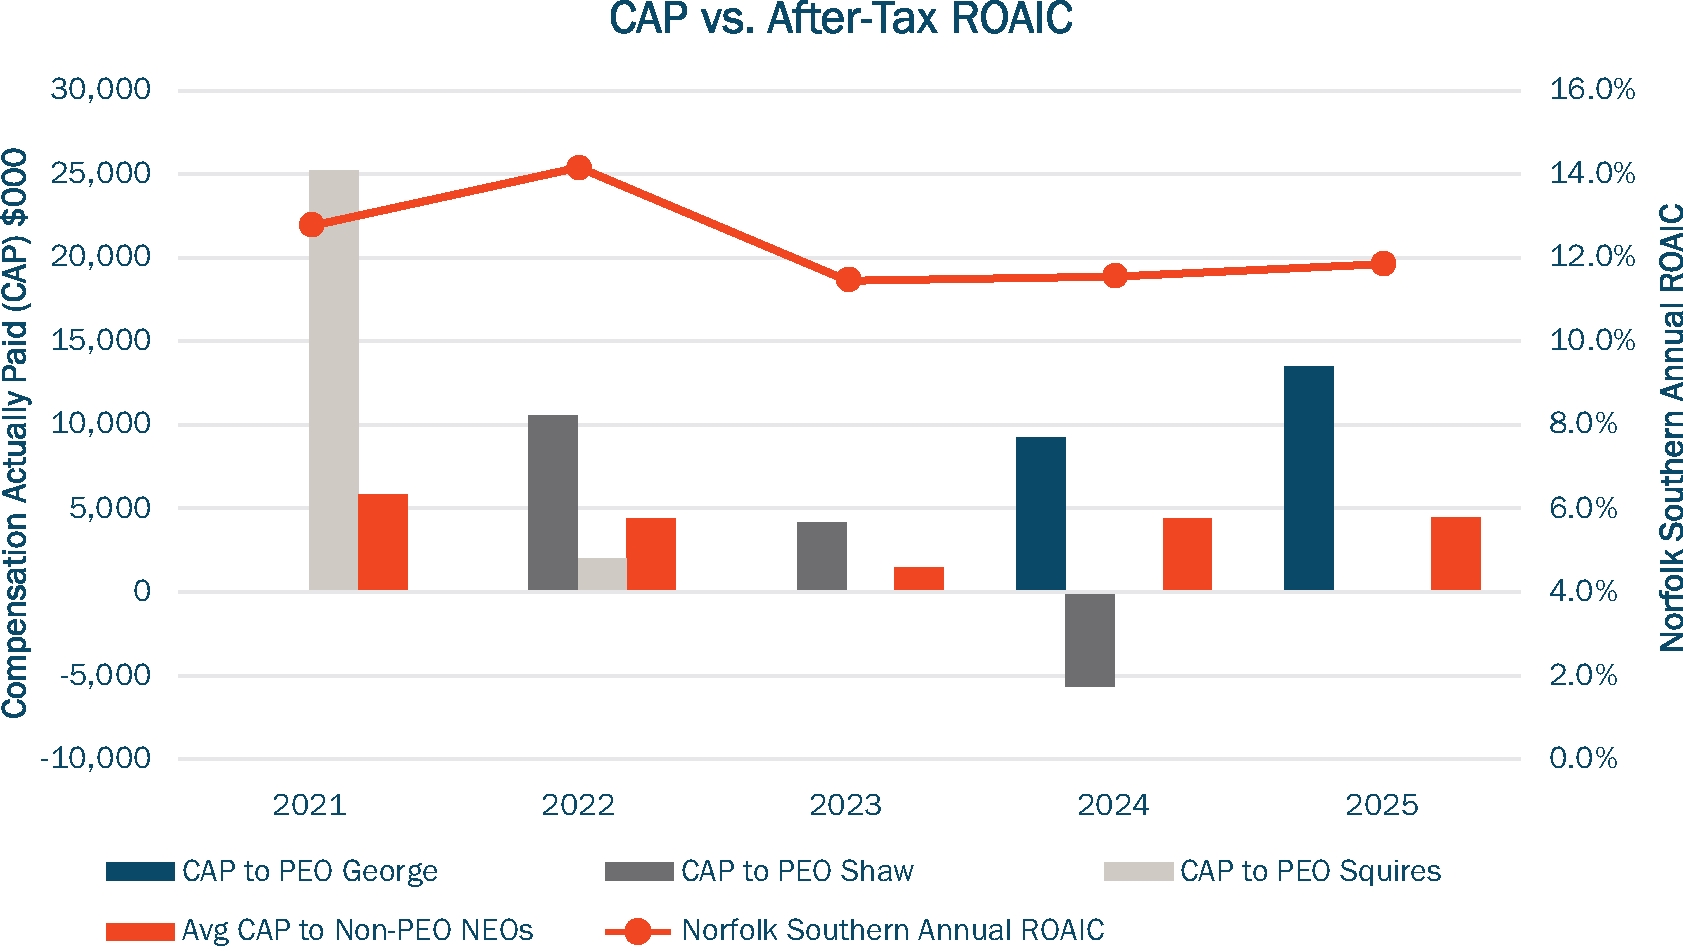
3. Compensation Actually Paid Compared to After-Tax ROAIC
As described in the CD&A report, ROAIC is the primary performance measure that determines the number of shares earned under our performance share unit (PSU) awards, and 50% or more of our named executive officers' long-term incentive awards are made in PSUs. Because of ROAIC’s impact on the number of PSU awards earned, we believe that after-tax ROAIC is the most important financial performance measure used in determining CAP to our named executive officers. As required by SEC guidance, we are presenting our one-year ROAIC for each listed year, rather than our three-year average ROAIC.
As shown in the chart below, Norfolk Southern’s annual after-tax ROAIC increased from 2021 to 2022, declined for 2023, and increased somewhat in 2024 and 2025. CAP to the PEOs and other NEOs is generally aligned with this performance measure. However, because the majority of compensation to the named executive officers is in the form of stock-based incentives, total shareholder return has a more significant effect on CAP.
1. Compensation Actually Paid Compared to TSR
As shown in the chart below, compensation actually paid (CAP) to the PEOs and the non-PEO NEOs is aligned with total shareholder return on Norfolk Southern's stock. This is primarily because the majority of compensation to the named executive officers is in the form of long-term, stock-based incentives which are tied directly to stock price, as described in the CD&A report. Norfolk Southern’s total shareholder return (TSR) was aligned with the peer group for 2021 and 2022, declined somewhat in 2023 due largely to the effects of the East Palestine derailment, and compared favorably to the peer group in 2024 and 2025 based on improved business performance. CAP to all NEOs declined in 2023 and CAP to non-CEO NEOs increased in 2024, aligned with relative TSR performance. CAP for 2024 to Mr. Shaw was negative due to the forfeiture of his annual incentive payment and all unvested equity awards as a result of his termination for Cause. CAP to Mr. George increased in 2025 largely because 2025 was the first full year for which he served as PEO. CAP to the non-PEO NEOs was relatively constant from 2024 to 2025 due to decreases in the value of stock awards to some of these executives from 2024 to 2025.
Most Important Performance Measures to Determine Compensation Actually Paid
The five items listed below represent the most important performance measures we used to determine compensation actually paid to our named executive officers in 2025, as described in the Compensation Discussion and Analysis (CD&A) sections titled “2025 Annual Incentives” on page 58 and “Long-Term Incentive Awards” on page 61.
|
Most Important Performance Measures |
|
After-tax ROAIC |
|
Operating Ratio |
|
Operating income |
|
Annual revenue |
|
Total shareholder return |