v3.26.1
Pay vs Performance Disclosure - USD ($)
12 Months Ended
Dec. 31, 2025
Dec. 31, 2024
Dec. 31, 2023
Dec. 31, 2022
Dec. 31, 2021
Pay vs Performance Disclosure          
Pay vs Performance Disclosure, Table

Pay Versus Performance

In accordance with rules adopted by the Securities and Exchange Commission pursuant to the Dodd-Frank Wall Street Reform and Consumer Protection Act of 2010, we provide the following disclosure regarding executive compensation for our principal executive officer (“PEO”) and Non-PEO NEOs and Company performance for the fiscal years listed below. The Compensation Committee did not consider the pay versus performance disclosure below in making its pay decisions for any of the years shown.

.


Summary
Compensation
Table Total


Compensation
Actually Paid


Average
Summary
Compensation
Table Total


Average
Compensation
Actually Paid


Value of Initial Fixed
$100 Investment based
on:
4


Year


for David
C. Brown
1
($)


to David
C. Brown
1,2,3
($)


for Non-PEO
NEOs
1
($)


to Non-PEO
NEOs
1,2,3
($)


TSR ($)


Peer
Group
TSR ($)


Net
Income
($ Millions)


Adjusted
EBITDA
($ Millions)
5


(a)


(b)


(b)


(d)


(e)


(f)


(g)


(h)


(i)


2025


16,198,144


16,633,500


4,362,789


4,504,325


295.88


185.07


330.1


682.9


2024


11,594,447


19,805,694


3,710,810


6,067,471


298.07


134.31


288.9


475.6


2023


5,900,840


7,496,823


1,859,996


2,316,250


152.09


117.90


213.2


418.0


2022


9,683,410


7,437,748


3,741,944


2,862,554


113.93


102.51


275.5


424.2


2021


7,085,179


11,253,633


3,123,535


4,654,152


149.74


132.06


278.4


449.0


1.
David C. Brown was our PEO for each year presented. The individuals comprising the Non-PEO NEOs for each year presented are listed below.


2021


2022


2023


2024


2025

Michael D. Policarpo


Michael D. Policarpo


Michael D. Policarpo


Michael D. Policarpo


Michael D. Policarpo

Nina Gupta


Nina Gupta


Nina Gupta


Nina Gupta


Nina Gupta


Mannik S. Dhillon


Mannik S. Dhillon


Mannik S. Dhillon


Kelly S. Cliff


Thomas M. Sipp


2. The amounts shown for Compensation Actually Paid have been calculated in accordance with Item 402(v) of Regulation S-K and do not reflect compensation actually earned, realized, or received by the Company’s NEOs. These amounts reflect the Summary Compensation Table Total with certain adjustments as described in footnote 3 below.

3. Compensation Actually Paid reflects the exclusions and inclusions of certain amounts for the PEO and the Non-PEO NEOs as set forth below. Equity values are calculated in accordance with FASB ASC Topic 718. Amounts in the Exclusion of Stock Awards column are the totals from the Stock Awards column set forth in the Summary Compensation Table.


Year


Summary
Compensation
Table Total for
David C. Brown
($)


Exclusion of
Change in Pension
Value for David
C. Brown
($)


Exclusion of Stock
Awards for
David
C. Brown
($)


Inclusion of
Pension Service
Cost for David
C. Brown
($)


Inclusion of Equity
Values for David
C. Brown
($)


Compensation
Actually Paid to
David C. Brown
($)


2025


16,198,144


(9,819,944

)


10,255,300


16,633,500


2024


11,594,447


(7,699,997

)


15,911,244


19,805,694


2023


5,900,840


(3,384,977

)


4,980,960


7,496,823


2022


9,683,410


(3,914,992

)


1,669,330


7,437,748


2021


7,085,179


(749,974

)


4,918,428


11,253,633


Year


Average Summary
Compensation
Table Total for
Non-PEO NEOs
($)


Average Exclusion
of Change in
Pension Value for
Non-PEO NEOs
($)


Average Exclusion
of Stock Awards
and Option
Awards for
Non-PEO NEOs
($)


Average Inclusion
of Pension Service
Cost for Non-PEO
NEOs
($)


Average Inclusion
of Equity Values
for Non-PEO
NEOs
($)


Average
Compensation
Actually Paid to
Non-PEO NEOs
($)


2025


4,362,789


(2,649,977

)


2,791,512


4,504,325


2024


3,710,810


(2,049,981

)


4,406,641


6,067,471


2023


1,859,996


(828,742

)


1,284,997


2,316,250


2022


3,741,944


(1,397,481

)


518,090


2,862,554


2021


3,123,535


(574,980

)


2,105,598


4,654,152


The amounts in the Inclusion of Equity Values in the tables above are derived from the amounts set forth in the following tables:


Year


Year-End Fair
Value of Equity
Awards
Granted During
Year That
Remained
Unvested as of
Last Day of
Year for David
C. Brown
($)


Change in Fair
Value from Last
Day of Prior
Year to Last
Day of Year of
Unvested
Equity Awards
for David
C. Brown
($)


Vesting-Date
Fair Value of
Equity Awards
Granted During
Year that
Vested During
Year for David
C. Brown
($)


Change in Fair
Value from Last
Day of Prior
Year to Vesting
Date of
Unvested
Equity Awards
that Vested
During Year for
David C. Brown
($)


Fair Value at
Last Day of
Prior Year of
Equity Awards
Forfeited
During Year for
David C. Brown
($)


Value of
Dividends or
Other Earnings
Paid on Equity
Awards Not
Otherwise
Included for
David C. Brown
($)


Total-
Inclusion
of
Equity Values
for David
C. Brown
($)


2025


10,936,270


(78,149

)


(602,821

)


10,255,300


2024


12,787,756


2,471,791


654,697


15,911,244


2023


4,065,615


623,944


291,401


4,980,960


2022


3,386,828


(1,104,039

)


(613,459

)


1,669,330


2021


1,037,865


3,211,618


668,945


4,918,428


Year


Average
Year-End Fair
Value of Equity
Awards
Granted During
Year That
Remained
Unvested as of
Last Day of
Year for
Non-PEO
NEOs
($)


Average
Change in Fair
Value from Last
Day of Prior
Year to Last
Day of Year of
Unvested
Equity Awards
for Non-PEO
NEOs
($)


Average
Vesting-Date
Fair Value of
Equity Awards
Granted During
Year that
Vested During
Year for
Non-PEO
NEOs
($)


Average
Change in Fair
Value from Last
Day of Prior
Year to Vesting
Date of
Unvested
Equity Awards
that Vested
During Year for
Non-PEO NEOs
($)


Average Fair
Value at Last
Day of Prior
Year of Equity
Awards
Forfeited
During Year for
Non-PEO NEOs
($)


Average Value
of Dividends or
Other Earnings
Paid on Equity
Awards Not
Otherwise
Included for
Non-PEO NEOs
($)


Total-Average
Inclusion of
Equity Values
for Non-PEO
NEOs
($)


2025


2,896,038


(20,989

)


(83,537

)


2,791,512


2024


3,403,703


782,571


220,368


4,406,641


2023


995,383


199,554


90,060


1,284,997


2022


1,208,949


(404,586

)


(286,273

)


518,090


2021


795,697


1,096,223


213,678


2,105,598


4.
The Peer Group TSR set forth in this table utilizes the peer group established in the stock performance graph included in the Company’s Annual Report on Form 10-K for the year ended December 31, 2025, which is required by Item 201(e) of Regulation S-K. This Peer Group was updated in 2024 to remove Eaton Vance which was acquired by Morgan Stanley and ceased trading publicly on March 1, 2021. The comparison assumes $100 was invested for the period starting December 31, 2020, through the end of the listed year in the Company and in the Custom Peer Group, respectively. Historical stock performance is not necessarily indicative of future stock performance.
5.
We determined Adjusted EBITDA to be the most important financial performance measure used to link Company performance to Compensation Actually Paid to our PEO and Non-PEO NEOs in 2024 and 2023. This performance measure may not have been the most important financial performance measure for years 2022 and 2021 and we may determine a different financial performance measure to be the most important financial performance measure in future years.

       
Company Selected Measure Name Adjusted EBITDA        
Named Executive Officers, Footnote The individuals comprising the Non-PEO NEOs for each year presented are listed below.


2021


2022


2023


2024


2025

Michael D. Policarpo


Michael D. Policarpo


Michael D. Policarpo


Michael D. Policarpo


Michael D. Policarpo

Nina Gupta


Nina Gupta


Nina Gupta


Nina Gupta


Nina Gupta


Mannik S. Dhillon


Mannik S. Dhillon


Mannik S. Dhillon


Kelly S. Cliff


Thomas M. Sipp


Peer Group Issuers, Footnote
4.
The Peer Group TSR set forth in this table utilizes the peer group established in the stock performance graph included in the Company’s Annual Report on Form 10-K for the year ended December 31, 2025, which is required by Item 201(e) of Regulation S-K. This Peer Group was updated in 2024 to remove Eaton Vance which was acquired by Morgan Stanley and ceased trading publicly on March 1, 2021. The comparison assumes $100 was invested for the period starting December 31, 2020, through the end of the listed year in the Company and in the Custom Peer Group, respectively. Historical stock performance is not necessarily indicative of future stock performance.
       
PEO Total Compensation Amount $ 16,198,144 $ 11,594,447 $ 5,900,840 $ 9,683,410 $ 7,085,179
PEO Actually Paid Compensation Amount $ 16,633,500 19,805,694 7,496,823 7,437,748 11,253,633
Adjustment To PEO Compensation, Footnote

3. Compensation Actually Paid reflects the exclusions and inclusions of certain amounts for the PEO and the Non-PEO NEOs as set forth below. Equity values are calculated in accordance with FASB ASC Topic 718. Amounts in the Exclusion of Stock Awards column are the totals from the Stock Awards column set forth in the Summary Compensation Table.


Year


Summary
Compensation
Table Total for
David C. Brown
($)


Exclusion of
Change in Pension
Value for David
C. Brown
($)


Exclusion of Stock
Awards for
David
C. Brown
($)


Inclusion of
Pension Service
Cost for David
C. Brown
($)


Inclusion of Equity
Values for David
C. Brown
($)


Compensation
Actually Paid to
David C. Brown
($)


2025


16,198,144


(9,819,944

)


10,255,300


16,633,500


2024


11,594,447


(7,699,997

)


15,911,244


19,805,694


2023


5,900,840


(3,384,977

)


4,980,960


7,496,823


2022


9,683,410


(3,914,992

)


1,669,330


7,437,748


2021


7,085,179


(749,974

)


4,918,428


11,253,633


The amounts in the Inclusion of Equity Values in the tables above are derived from the amounts set forth in the following tables:


Year


Year-End Fair
Value of Equity
Awards
Granted During
Year That
Remained
Unvested as of
Last Day of
Year for David
C. Brown
($)


Change in Fair
Value from Last
Day of Prior
Year to Last
Day of Year of
Unvested
Equity Awards
for David
C. Brown
($)


Vesting-Date
Fair Value of
Equity Awards
Granted During
Year that
Vested During
Year for David
C. Brown
($)


Change in Fair
Value from Last
Day of Prior
Year to Vesting
Date of
Unvested
Equity Awards
that Vested
During Year for
David C. Brown
($)


Fair Value at
Last Day of
Prior Year of
Equity Awards
Forfeited
During Year for
David C. Brown
($)


Value of
Dividends or
Other Earnings
Paid on Equity
Awards Not
Otherwise
Included for
David C. Brown
($)


Total-
Inclusion
of
Equity Values
for David
C. Brown
($)


2025


10,936,270


(78,149

)


(602,821

)


10,255,300


2024


12,787,756


2,471,791


654,697


15,911,244


2023


4,065,615


623,944


291,401


4,980,960


2022


3,386,828


(1,104,039

)


(613,459

)


1,669,330


2021


1,037,865


3,211,618


668,945


4,918,428


Non-PEO NEO Average Total Compensation Amount $ 4,362,789 3,710,810 1,859,996 3,741,944 3,123,535
Non-PEO NEO Average Compensation Actually Paid Amount $ 4,504,325 6,067,471 2,316,250 2,862,554 4,654,152
Adjustment to Non-PEO NEO Compensation Footnote 3. Compensation Actually Paid reflects the exclusions and inclusions of certain amounts for the PEO and the Non-PEO NEOs as set forth below. Equity values are calculated in accordance with FASB ASC Topic 718. Amounts in the Exclusion of Stock Awards column are the totals from the Stock Awards column set forth in the Summary Compensation Table.

Year


Average Summary
Compensation
Table Total for
Non-PEO NEOs
($)


Average Exclusion
of Change in
Pension Value for
Non-PEO NEOs
($)


Average Exclusion
of Stock Awards
and Option
Awards for
Non-PEO NEOs
($)


Average Inclusion
of Pension Service
Cost for Non-PEO
NEOs
($)


Average Inclusion
of Equity Values
for Non-PEO
NEOs
($)


Average
Compensation
Actually Paid to
Non-PEO NEOs
($)


2025


4,362,789


(2,649,977

)


2,791,512


4,504,325


2024


3,710,810


(2,049,981

)


4,406,641


6,067,471


2023


1,859,996


(828,742

)


1,284,997


2,316,250


2022


3,741,944


(1,397,481

)


518,090


2,862,554


2021


3,123,535


(574,980

)


2,105,598


4,654,152


The amounts in the Inclusion of Equity Values in the tables above are derived from the amounts set forth in the following tables:

Year


Average
Year-End Fair
Value of Equity
Awards
Granted During
Year That
Remained
Unvested as of
Last Day of
Year for
Non-PEO
NEOs
($)


Average
Change in Fair
Value from Last
Day of Prior
Year to Last
Day of Year of
Unvested
Equity Awards
for Non-PEO
NEOs
($)


Average
Vesting-Date
Fair Value of
Equity Awards
Granted During
Year that
Vested During
Year for
Non-PEO
NEOs
($)


Average
Change in Fair
Value from Last
Day of Prior
Year to Vesting
Date of
Unvested
Equity Awards
that Vested
During Year for
Non-PEO NEOs
($)


Average Fair
Value at Last
Day of Prior
Year of Equity
Awards
Forfeited
During Year for
Non-PEO NEOs
($)


Average Value
of Dividends or
Other Earnings
Paid on Equity
Awards Not
Otherwise
Included for
Non-PEO NEOs
($)


Total-Average
Inclusion of
Equity Values
for Non-PEO
NEOs
($)


2025


2,896,038


(20,989

)


(83,537

)


2,791,512


2024


3,403,703


782,571


220,368


4,406,641


2023


995,383


199,554


90,060


1,284,997


2022


1,208,949


(404,586

)


(286,273

)


518,090


2021


795,697


1,096,223


213,678


2,105,598


Compensation Actually Paid vs. Total Shareholder Return

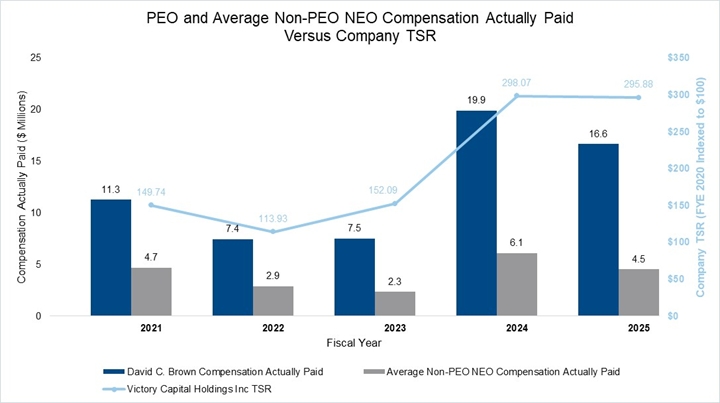
Relationship Between PEO and Non-PEO NEO Compensation Actually Paid and Company Total Shareholder Return (“TSR”)

The following chart sets forth the relationship between Compensation Actually Paid to our PEO, the average of Compensation Actually Paid to our Non-PEO NEOs, and the Company’s cumulative TSR over the four most recently completed fiscal years.


img129133085_8.jpg

       
Compensation Actually Paid vs. Net Income

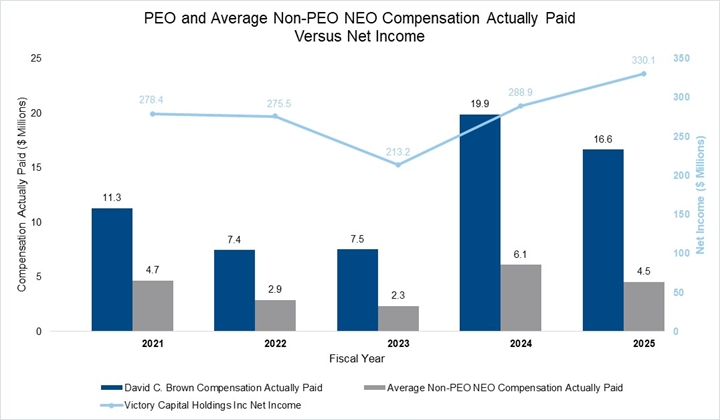
Relationship Between PEO and Non-PEO NEO Compensation Actually Paid and Net Income

The following chart sets forth the relationship between Compensation Actually Paid to our PEO, the average of Compensation Actually Paid to our Non-PEO NEOs, and our Net Income during the four most recently completed fiscal years.


img129133085_9.jpg

       
Compensation Actually Paid vs. Company Selected Measure

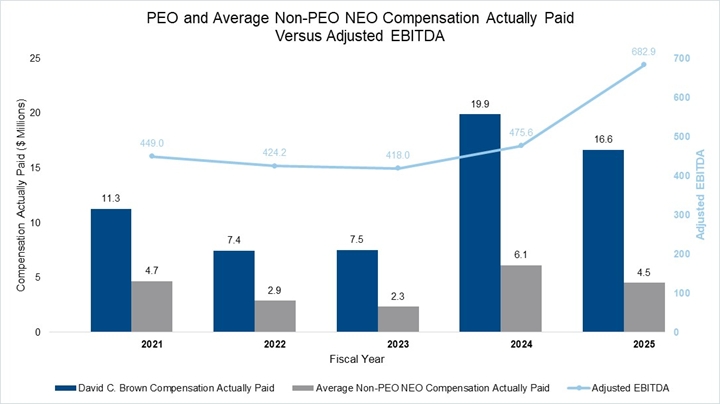
Relationship Between PEO and Non-PEO NEO Compensation Actually Paid and Adjusted EBITDA

The following chart sets forth the relationship between Compensation Actually Paid to our PEO, the average of Compensation Actually Paid to our Non-PEO NEOs, and our Adjusted EBITDA during the four most recently completed fiscal years.


img129133085_10.jpg

       
Total Shareholder Return Vs Peer Group

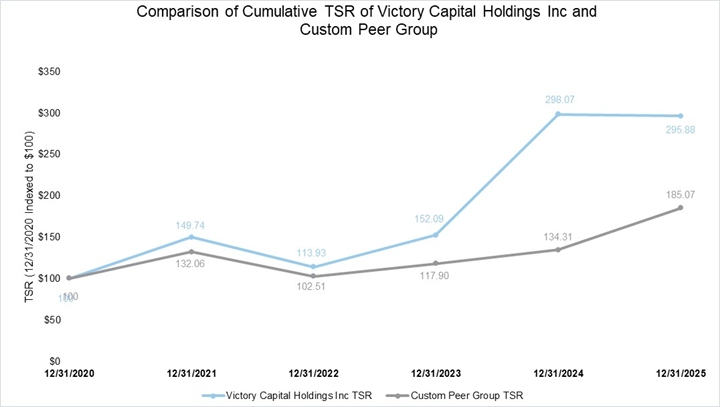
Description of Relationship Between Company TSR and Peer Group TSR

The following chart compares our cumulative TSR over the four most recently completed fiscal years to that of the Custom Peer Group over the same period.


img129133085_11.jpg

       
Tabular List, Table

Most Important Financial Performance Measure

The Company considers Adjusted EBITDA to have been the most important financial performance measure in linking Compensation Actually Paid to our PEOs and other NEOs for 2025 to Company performance. Please refer to Appendix A for the Company’s supplemental Non-GAAP financial information.

       
Total Shareholder Return Amount $ 295.88 298.07 152.09 113.93 149.74
Peer Group Total Shareholder Return Amount 185.07 134.31 117.9 102.51 132.06
Net Income (Loss) $ 330,100,000 $ 288,900,000 $ 213,200,000 $ 275,500,000 $ 278,400,000
Company Selected Measure Amount 682,900,000 475,600,000 418,000,000 424,200,000 449,000,000
PEO Name David C. Brown David C. Brown David C. Brown David C. Brown David C. Brown
Measure:: 1          
Pay vs Performance Disclosure          
Name Adjusted EBITDA        
PEO | Aggregate Change in Present Value of Accumulated Benefit for All Pension Plans Reported in Summary Compensation Table          
Pay vs Performance Disclosure          
Adjustment to Compensation, Amount $ 0 $ 0 $ 0 $ 0 $ 0
PEO | Pension Adjustments Service Cost          
Pay vs Performance Disclosure          
Adjustment to Compensation, Amount 0 0 0 0 0
PEO | Aggregate Grant Date Fair Value of Equity Award Amounts Reported in Summary Compensation Table          
Pay vs Performance Disclosure          
Adjustment to Compensation, Amount (9,819,944) (7,699,997) (3,384,977) (3,914,992) (749,974)
PEO | Equity Awards Adjustments, Excluding Value Reported in Compensation Table          
Pay vs Performance Disclosure          
Adjustment to Compensation, Amount 10,255,300 15,911,244 4,980,960 1,669,330 4,918,428
PEO | Year-end Fair Value of Equity Awards Granted in Covered Year that are Outstanding and Unvested          
Pay vs Performance Disclosure          
Adjustment to Compensation, Amount 10,936,270 12,787,756 4,065,615 3,386,828 1,037,865
PEO | Year-over-Year Change in Fair Value of Equity Awards Granted in Prior Years That are Outstanding and Unvested          
Pay vs Performance Disclosure          
Adjustment to Compensation, Amount (78,149) 2,471,791 623,944 (1,104,039) 3,211,618
PEO | Vesting Date Fair Value of Equity Awards Granted and Vested in Covered Year          
Pay vs Performance Disclosure          
Adjustment to Compensation, Amount 0 0 0 0 0
PEO | Change in Fair Value as of Vesting Date of Prior Year Equity Awards Vested in Covered Year          
Pay vs Performance Disclosure          
Adjustment to Compensation, Amount (602,821) 654,697 291,401 (613,459) 668,945
PEO | Prior Year End Fair Value of Equity Awards Granted in Any Prior Year that Fail to Meet Applicable Vesting Conditions During Covered Year          
Pay vs Performance Disclosure          
Adjustment to Compensation, Amount 0 0 0 0 0
PEO | Dividends or Other Earnings Paid on Equity Awards not Otherwise Reflected in Total Compensation for Covered Year          
Pay vs Performance Disclosure          
Adjustment to Compensation, Amount 0 0 0 0 0
Non-PEO NEO | Aggregate Change in Present Value of Accumulated Benefit for All Pension Plans Reported in Summary Compensation Table          
Pay vs Performance Disclosure          
Adjustment to Compensation, Amount 0 0 0 0 0
Non-PEO NEO | Pension Adjustments Service Cost          
Pay vs Performance Disclosure          
Adjustment to Compensation, Amount 0 0 0 0 0
Non-PEO NEO | Aggregate Grant Date Fair Value of Equity Award Amounts Reported in Summary Compensation Table          
Pay vs Performance Disclosure          
Adjustment to Compensation, Amount (2,649,977) (2,049,981) (828,742) (1,397,481) (574,980)
Non-PEO NEO | Equity Awards Adjustments, Excluding Value Reported in Compensation Table          
Pay vs Performance Disclosure          
Adjustment to Compensation, Amount 2,791,512 4,406,641 1,284,997 518,090 2,105,598
Non-PEO NEO | Year-end Fair Value of Equity Awards Granted in Covered Year that are Outstanding and Unvested          
Pay vs Performance Disclosure          
Adjustment to Compensation, Amount 2,896,038 3,403,703 995,383 1,208,949 795,697
Non-PEO NEO | Year-over-Year Change in Fair Value of Equity Awards Granted in Prior Years That are Outstanding and Unvested          
Pay vs Performance Disclosure          
Adjustment to Compensation, Amount (20,989) 782,571 199,554 (404,586) 1,096,223
Non-PEO NEO | Vesting Date Fair Value of Equity Awards Granted and Vested in Covered Year          
Pay vs Performance Disclosure          
Adjustment to Compensation, Amount 0 0 0 0 0
Non-PEO NEO | Change in Fair Value as of Vesting Date of Prior Year Equity Awards Vested in Covered Year          
Pay vs Performance Disclosure          
Adjustment to Compensation, Amount (83,537) 220,368 90,060 (286,273) 213,678
Non-PEO NEO | Prior Year End Fair Value of Equity Awards Granted in Any Prior Year that Fail to Meet Applicable Vesting Conditions During Covered Year          
Pay vs Performance Disclosure          
Adjustment to Compensation, Amount 0 0 0 0 0
Non-PEO NEO | Dividends or Other Earnings Paid on Equity Awards not Otherwise Reflected in Total Compensation for Covered Year          
Pay vs Performance Disclosure          
Adjustment to Compensation, Amount $ 0 $ 0 $ 0 $ 0 $ 0