Pay vs Performance Disclosure
Unit_pure in Millions
Unit_pure in Millions
Dec. 31, 2025
USD ($)
Dec. 31, 2024
USD ($)
Dec. 31, 2023
USD ($)
Dec. 31, 2022
USD ($)
Dec. 31, 2021
USD ($)
Pay vs. Performance Comparison
Our executive compensation programs are intended to link a substantial portion of our NEOs’ realized compensation to the achievement of our financial, operational, and strategic objectives, and to align our NEOs’ pay with changes in the value of our shareholders’ investments. For further information concerning the Corporation’s variable pay-for-performance philosophy and how the Corporation aligns executive compensation with company performance, refer to the “Compensation Discussion and Analysis” section of this proxy statement. As required by Item 402(v) of Regulation S-K, we are providing the following information about the relationship between compensation actually paid (“CAP”) (as defined in Item 402(v)) and performance for fiscal years 2025, 2024, 2023, 2023 and 2021.
Ending Value of Initial Fixed $100 Investment Based on: |
(Stated in Millions) | |||||||||||||||||||||||||||||||||||||||||||||||||
Year |
Summary Compensation Table Total for CEO(1) ($) |
Compensation Actually Paid to CEO(1)(2) ($) |
Summary Compensation Table Total for Former CEO(1) ($) |
Compensation Actually Paid to Former CEO(1)(2) ($) |
Average Summary Compensation Table Total for Non-CEO NEOs(1) ($) |
Average Compensation Actually Paid to Non-CEO NEOs(1)(2)($) |
Total Shareholder Return(3) |
Comparator Group Total Shareholder Return(3) |
Net Income ($) |
Adjusted EBITDA(4) ($) | ||||||||||||||||||||||||||||||||||||||||
2025 |
5,417,315 | 6,706,640 | — | — | 1,893,638 | 2,121,030 | $ | 71.45 | $ | 134.80 | 17.1 | 219.8 | ||||||||||||||||||||||||||||||||||||||
2024 |
4,697,225 | 2,491,169 | — | — | 1,383,117 | 934,000 | $ | 60.08 | $ | 137.23 | 64.9 | 239.8 | ||||||||||||||||||||||||||||||||||||||
2023 |
4,540,521 | 1,684,905 | — | — | 1,633,051 | 1,081,007 | $ | 91.83 | $ | 128.76 | 97.2 | 256.4 | ||||||||||||||||||||||||||||||||||||||
2022 |
4,425,333 | 5,441,860 | — | — | 2,352,870 | 2,100,774 | $ | 115.24 | $ | 111.26 | 81.1 | 251.9 | ||||||||||||||||||||||||||||||||||||||
2021 |
10,838,013 | 12,876,797 | ( 5 ) |
156,353 | 8,412,110 | 1,758,544 | 1,748,319 | $ | 131.41 | $ | 122.05 | 97.9 | 253.3 | |||||||||||||||||||||||||||||||||||||
| (1) | The following individuals are our CEO, our former CEO, and other NEOs for each fiscal year: |
Year |
CEO(s) |
Non-CEO NEOs | ||
| 2025 | John W. Peyton | Vance Y. Chang, Lawrence Y. Kim, Christine K. Son, Tony E. Moralejo | ||
| 2024 | John W. Peyton | Vance Y. Chang, Jay D. Johns, Christine K. Son, Tony E. Moralejo | ||
| 2023 | John W. Peyton | Vance Y. Chang, Jay D. Johns, Christine K. Son, Tony E. Moralejo | ||
| 2022 | John W. Peyton | Vance Y. Chang, John C. Cywinski, Jay D. Johns, Christine K. Son | ||
| 2021 | John W. Peyton Stephen P. Joyce |
Vance Y. Chang, Allison Hall, John C. Cywinski, Jay D. Johns, Christine K. Son, Thomas H. Song | ||
| (2) | Compensation actually paid to our NEOs represents the “Total” compensation reported in the Summary Compensation Table for the applicable fiscal year , adjusted as follows: |
FY 2025 |
||||||||
Adjustments |
CEO |
Avg. non- CEO NEO |
||||||
Summary Compensation Table Total for Applicable Year |
5,417,315 | 1,893,638 | ||||||
Decrease for Amounts Reported Under the “Stock Awards” and “Option Awards” Columns in the Summary Compensation Table for Applicable FY |
(2,213,577 | ) | (569,807 | ) | ||||
Increase Based on ASC 718 Fair Value of Awards Granted During Applicable FY that Remain Unvested as of Applicable FY End, Determined as of Applicable FY End. RSU values include RSUs attributable to reinvested Dividend Equivalents |
2,888,747 | 705,776 | ||||||
Increase Based on ASC 718 Fair Value of Awards Granted During Applicable FY that Vested during Applicable FY, Determined as of the Vesting Date |
0 | 0 | ||||||
Increase (Decrease) for Awards Granted During Prior FY That Were Outstanding and Unvested as of Applicable FY End, Determined Based on Change in ASC 718 Fair Value From Prior FY End to Applicable FY End |
889,605 | 125,945 | ||||||
Increase (Decrease) for Awards granted During Prior FY That Vested During Applicable FY, Determined Based on Change in ASC 718 Fair Value From Prior FY End to Vesting Date |
(366,514 | ) | (38,624 | ) | ||||
Decrease of ASC 718 Fair Value of Awards Granted During Prior FY That Were Forfeited During Applicable FY, Determined as of Prior FY End |
0 | (24,270 | ) | |||||
Increase Based on Dividends or Other Earnings Paid During Applicable FY Prior to Vesting Date |
91,063 | 28,371 | ||||||
Compensation Actually Paid |
6,706,640 |
2,121,030 |
||||||
| (3) | TSR is cumulative for the measurement periods beginning as of close of business on December 31, 2020 and ending on January 2, 2022, January 1, 2023, December 31, 2023, December 29, 2024, and December 28, 2025 calculated in accordance with Item 201(e) of Regulation S-K. The S&P 1500 Composite Restaurant Index TSR column consists of 20 companies (excluding Dine Brands), which is the industry specific peer group in our 10-K. |
| (4) | “Adjusted EBITDA” is a non-GAAP measure used for purposes of our Annual Incentive Plan. Adjusted EBITDA includes income before interest, taxes, depreciation and amortization. A reconciliation of this non-GAAP financial measure to results in accordance with GAAP can be found in Appendix A to this Proxy Statement. |
| (5) | Includes one-time grants in the form of a sign-on bonus of $1,200,000, special sign-on RSUs valued at $3,096,478 as of the grant date, and special sign-on stock options valued at $884,704 as of the grant date. |
| (1) | The following individuals are our CEO, our former CEO, and other NEOs for each fiscal year: |
Year |
CEO(s) |
Non-CEO NEOs | ||
| 2025 | John W. Peyton | Vance Y. Chang, Lawrence Y. Kim, Christine K. Son, Tony E. Moralejo | ||
| 2024 | John W. Peyton | Vance Y. Chang, Jay D. Johns, Christine K. Son, Tony E. Moralejo | ||
| 2023 | John W. Peyton | Vance Y. Chang, Jay D. Johns, Christine K. Son, Tony E. Moralejo | ||
| 2022 | John W. Peyton | Vance Y. Chang, John C. Cywinski, Jay D. Johns, Christine K. Son | ||
| 2021 | John W. Peyton Stephen P. Joyce |
Vance Y. Chang, Allison Hall, John C. Cywinski, Jay D. Johns, Christine K. Son, Thomas H. Song | ||
| (2) | Compensation actually paid to our NEOs represents the “Total” compensation reported in the Summary Compensation Table for the applicable fiscal year , adjusted as follows: |
FY 2025 |
||||||||
Adjustments |
CEO |
Avg. non- CEO NEO |
||||||
Summary Compensation Table Total for Applicable Year |
5,417,315 | 1,893,638 | ||||||
Decrease for Amounts Reported Under the “Stock Awards” and “Option Awards” Columns in the Summary Compensation Table for Applicable FY |
(2,213,577 | ) | (569,807 | ) | ||||
Increase Based on ASC 718 Fair Value of Awards Granted During Applicable FY that Remain Unvested as of Applicable FY End, Determined as of Applicable FY End. RSU values include RSUs attributable to reinvested Dividend Equivalents |
2,888,747 | 705,776 | ||||||
Increase Based on ASC 718 Fair Value of Awards Granted During Applicable FY that Vested during Applicable FY, Determined as of the Vesting Date |
0 | 0 | ||||||
Increase (Decrease) for Awards Granted During Prior FY That Were Outstanding and Unvested as of Applicable FY End, Determined Based on Change in ASC 718 Fair Value From Prior FY End to Applicable FY End |
889,605 | 125,945 | ||||||
Increase (Decrease) for Awards granted During Prior FY That Vested During Applicable FY, Determined Based on Change in ASC 718 Fair Value From Prior FY End to Vesting Date |
(366,514 | ) | (38,624 | ) | ||||
Decrease of ASC 718 Fair Value of Awards Granted During Prior FY That Were Forfeited During Applicable FY, Determined as of Prior FY End |
0 | (24,270 | ) | |||||
Increase Based on Dividends or Other Earnings Paid During Applicable FY Prior to Vesting Date |
91,063 | 28,371 | ||||||
Compensation Actually Paid |
6,706,640 |
2,121,030 |
||||||
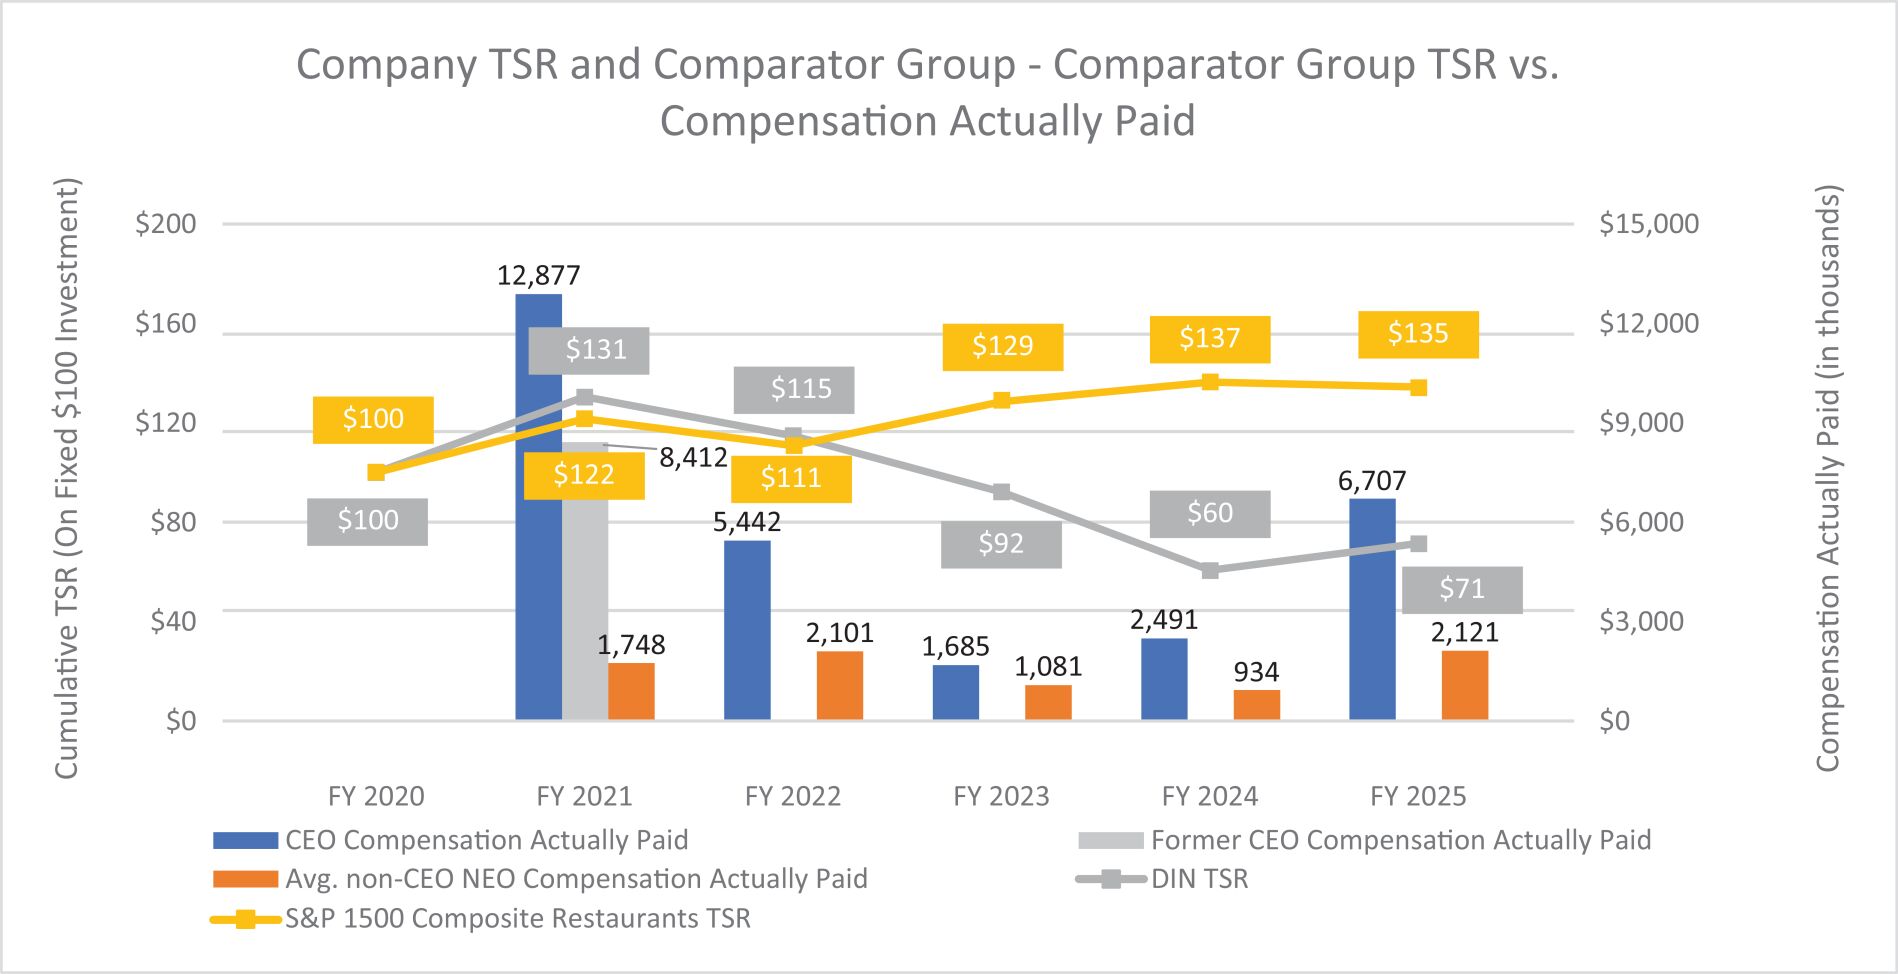
The chart below provides a comparison between (i) the total stockholder return of the Corporation and the S&P 1500 Composite Restaurants Index assuming a fixed $100 initial investment as of close of business on December 31, 2020 and reinvestment of dividends, and (ii) the compensation actually paid to the individuals serving as CEO and the average compensation actually paid to our non-CEO NEOs for the fiscal years ended January 2, 2022, January 1, 2023, December 31, 2023, December 29, 2024, and December 28, 2025.
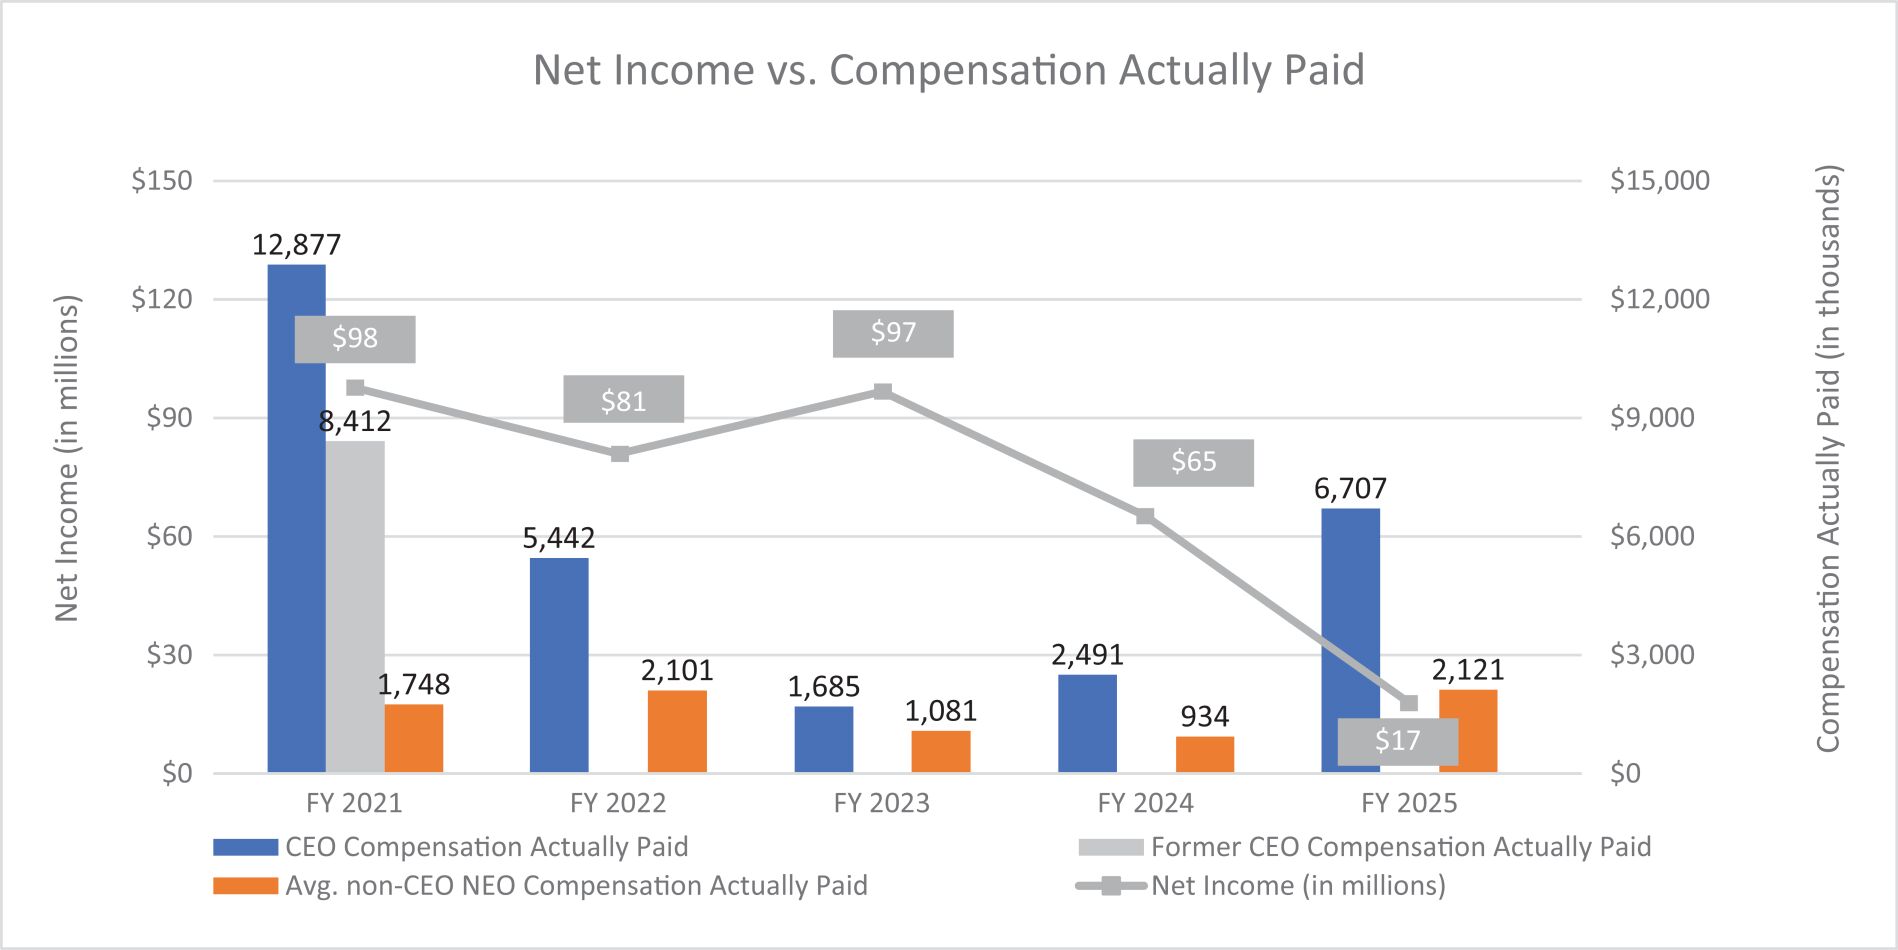
The chart below provides a comparison between (i) the Corporation’s Net Income and (ii) compensation actually paid to the individuals serving as CEO and average compensation actually paid to our non-CEO NEOs for the fiscal years ended January 2, 2022, January 1, 2023, December 31, 2023, December 29, 2024, and December 28, 2025.
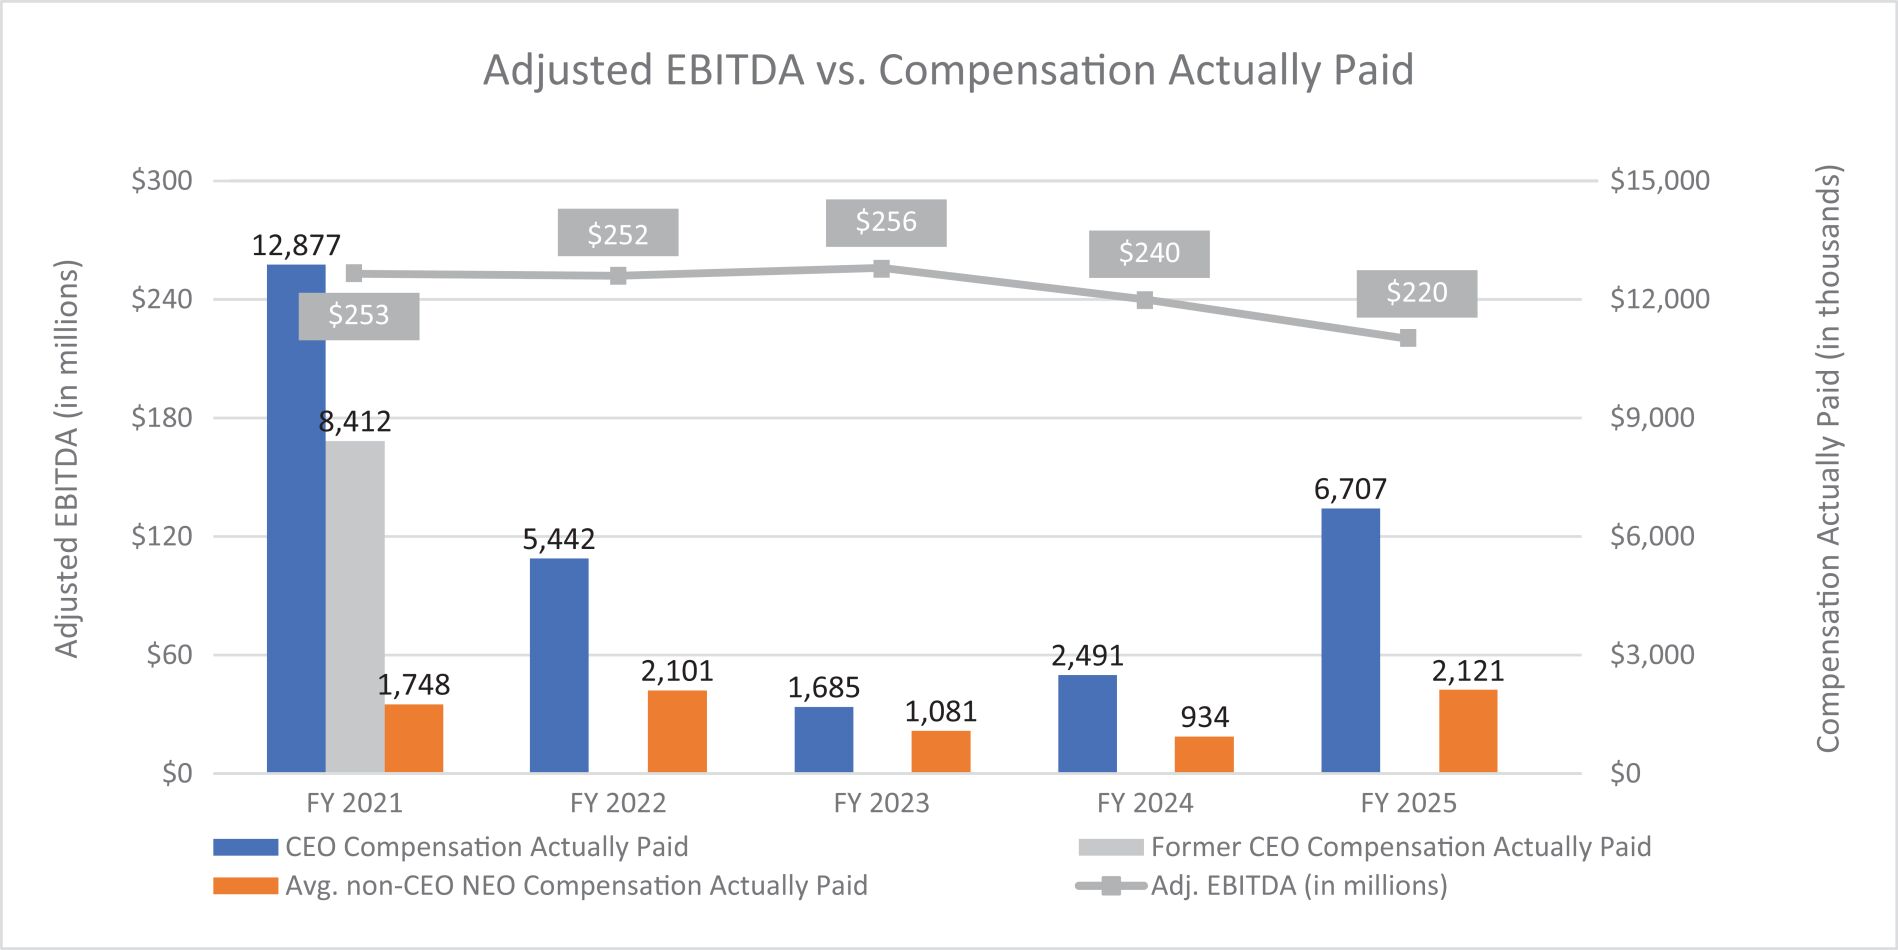
The chart below provides a comparison between (i) the Corporation’s Adjusted EBITDA and (ii) compensation actually paid to the individuals serving as CEO and average compensation actually paid to our non-CEO NEOs for the fiscal years ended January 2, 2022, January 1, 2023, December 31, 2023, December 29, 2024, and December 28, 2025.
The chart below provides a comparison between (i) the total stockholder return of the Corporation and the S&P 1500 Composite Restaurants Index assuming a fixed $100 initial investment as of close of business on December 31, 2020 and reinvestment of dividends, and (ii) the compensation actually paid to the individuals serving as CEO and the average compensation actually paid to our non-CEO NEOs for the fiscal years ended January 2, 2022, January 1, 2023, December 31, 2023, December 29, 2024, and December 28, 2025.
Financial Performance Measures
The following table identifies the most important financial performance measures used by our Compensation Committee to link the
CAP
to our CEO and other NEOs in 2025, calculated in accordance with SEC regulations, to our performance. The role of each of these performance measures on our NEOs’ compensation is discussed in the CD&A above. Financial Performance Measures |
Adjusted EBITDA |
Traffic (compared to Black Box Intelligence peer set) |
Net Development |
Relative Total Shareholder Return (compared to publicly-traded restaurant companies) |