Prior to March 30, 2021, the Fund was known as the North Country Equity Growth Fund and the strategy of the Fund differed from its current strategy. Accordingly, performance of the Fund for periods prior to March 30, 2021 may not be representative of the performance the Fund would have achieved had the Fund been following its current strategy.
The bar chart and table that follow provide some indication of the risks of investing in the Fund by showing changes in the performance of the Fund from year to year and by showing how the Fund’s average annual returns for 1, 5 and 10 years compare with those of a broad measure of market performance. Please remember that the Fund’s past performance (before and after taxes) is not an indication of how the Fund will perform in the future.
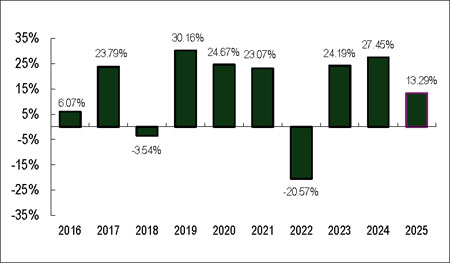
| Highest Quarter: | June 30, 2020 | 21.11% |
| Lowest Quarter: | December 31, 2018 | (16.55)% |
| 1 Year | 5 Years | 10 Years | |
| The North Country Large Cap Equity Fund | |||
| Return before taxes | 13.29% | 11.88% | 13.68% |
| Return after taxes on distributions | 12.55% | 9.37% | 11.51% |
| Return after taxes on distributions and sale of Fund shares | 8.40% | 8.93% | 10.80% |
| S&P 500 Total Return Index (1) (reflects no deduction for fees, expenses or taxes) |
17.88% | 14.42% | 14.82% |
| (1) | The S&P 500 Total Return Index is an unmanaged composite of 500 large capitalization companies and includes the reinvestment of dividends. This index is widely used by professional investors as a performance benchmark for large-cap stocks. Investors cannot invest directly in an index. |
After-tax returns were calculated using the historical highest individual federal marginal income tax rates and do not reflect the impact of state and local taxes. Actual after-tax returns depend on an investor’s tax situation and may differ from those shown, and after-tax returns are not relevant to investors who hold shares of the Fund through tax-advantaged arrangements, such as 401(k) plans or individual retirement accounts.