The bar chart and performance table below show the variability of the Fund’s returns, which is some indication of the risks of investing in the Fund by showing changes in the Fund’s performance from year to year and by showing the Fund’s one-year, five-year and since inception performance compared with those of a broad measure of market performance. The bar chart shows performance of the Fund’s shares for each calendar year since the Fund’s inception. The performance table compares the performance of the Fund over time to the performance of a broad-based securities market index and a supplemental index. You should be aware that the Fund’s past performance (before and after taxes) is not necessarily an indication of how the Fund will perform in the future. Updated performance information is available at no cost by visiting .
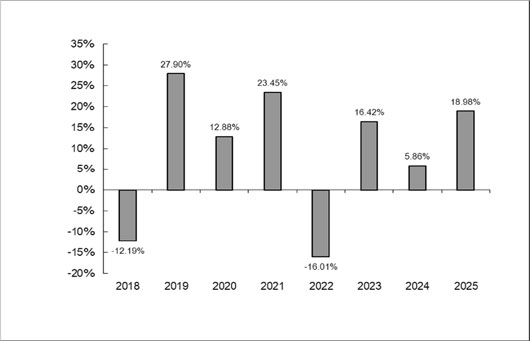
| Best Quarter: | 2nd Quarter 2020 | 24.10% |
| Worst Quarter: | 1st Quarter 2020 | (29.54)% |
| One Year | Five Years | Since Inception (2/27/17) | |
| Return before taxes | 18.98% | 8.74% | 9.48% |
| Return after taxes on distributions | 18.58% | 7.88% | 8.73% |
| Return after taxes on distributions and sale of Fund shares | 11.78% | 6.76% | 7.54% |
| Inspire Global Hope Index | 20.12% | 9.55% | 10.06% |
| S&P Global 1200 Total Return Index* | 23.03% | 12.78% | 12.86% |
| * | The S&P Global 1200 Total Return Index provides efficient exposure to the global equity market. Capturing approximately 70% of global market capitalization, it is constructed as a composite of 7 headline indices, many of which are accepted leaders in their regions. These include the S&P 500® (US), S&P Europe 350, S&P TOPIX 150 (Japan), S&P/TSX 60 (Canada), S&P/ASX All Australian 50, S&P Asia 50 and S&P Latin America 40. Investors cannot invest directly in an index. Unlike the Fund’s returns, the index does not reflect any fees or expenses. |
After-tax returns are calculated using the historical highest individual federal marginal income tax rates and do not reflect the impact of state and local taxes. Actual after-tax returns depend on an investor’s tax situation and may differ from those shown, and after-tax returns shown are not relevant to investors who hold their Shares through tax-deferred arrangements, such as 401(k) plans or individual retirement accounts.
The bar chart and performance table below show the variability of the Fund’s returns, which is some indication of the risks of investing in the Fund by showing changes in the Fund’s performance from year to year and by showing the Fund’s one-year, five-year and since inception performance compared with those of a broad measure of market performance. The bar chart shows performance of the Fund’s shares for each calendar year since the Fund’s inception. The performance table compares the performance of the Fund over time to the performance of a broad-based securities market index and supplemental indices. You should be aware that the Fund’s past performance (before and after taxes) is not necessarily an indication of how the Fund will perform in the future. Updated performance information is available at no cost by visiting www.inspireetf.com.
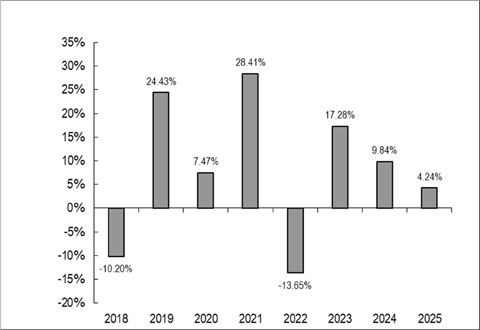
| Best Quarter: | 31.98% | |
| Worst Quarter: | 1st Quarter 2020 | (32.52)% |
| One Year | Five Year | Since Inception (2/27/17) | |
| Return before taxes | 4.24% | 8.29% | 7.67% |
| Return after taxes on distributions | 3.93% | 7.27% | 6.83% |
| Return after taxes on distributions and sale of Fund shares | 2.71% | 6.14% | 5.84% |
| Inspire Small/Mid Cap Index | 4.69% | 9.11% | 8.70% |
| Russell 2000 Total Return Index* | 12.81% | 6.09% | 8.08% |
| S&P SmallCap 600 Equal Weight Total Return Index** | 4.81% | 6.99% | 7.53% |
| * | The Russell 2000 Total Return Index is an unmanaged market capitalization-weighted index which measures the performance of the small-cap sector of the U.S. stock market. Investors cannot invest directly in an index. Unlike the Fund’s returns, the index does not reflect any fees or expenses. |
| ** | The S&P SmallCap 600 Equal Weight Total Return Index (EWI) is the equal-weight version of the S&P SmallCap 600. The index has the same constituents as the capitalization weighted S&P SmallCap 600, but each company in the S&P SmallCap 600 EWI is allocated a fixed weight. Investors cannot invest directly in an index. Unlike the Fund’s returns, the index does not reflect any fees or expenses. |
After-tax returns are calculated using the historical highest individual federal marginal income tax rates and do not reflect the impact of state and local taxes. Actual after-tax returns depend on an investor’s tax situation and may differ from those shown, and after-tax returns shown are not relevant to investors who hold their Shares through tax-deferred arrangements, such as 401(k) plans or individual retirement accounts.
The bar chart and performance table below show the variability of the Fund’s returns, which is some indication of the risks of investing in the Fund by showing changes in the Fund’s performance from year to year and by showing the Fund’s one-year, five-year and since inception performance compared with those of a broad measure of market performance. The bar chart shows performance of the Fund’s shares for each calendar year since the Fund’s inception. The performance table compares the performance of the Fund over time to the performance of a broad-based securities market index and supplemental indices. You should be aware that the Fund’s past performance (before and after taxes) is not necessarily an indication of how the Fund will perform in the future. Updated performance information is available at no cost by visiting www.inspireetf.com.
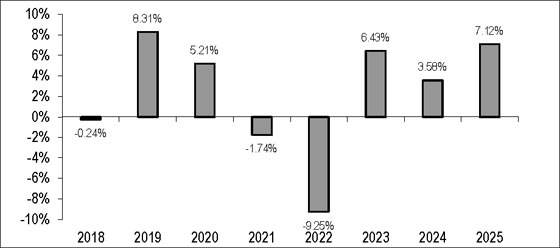
| Best Quarter: | 2nd Quarter 2020 | 8.29% |
| Worst Quarter: | 1st Quarter 2022 | (5.17)% |
| One Year | Five Years | Since Inception (7/10/17) | |
| Return before taxes | 7.12% | 1.04% | 2.22% |
| Return after taxes on distributions | 5.29% | (0.18)% | 1.13% |
| Return after taxes on distributions and sale of Fund shares | 4.18% | 0.26% | 1.22% |
| Inspire Corporate Bond Index | 7.59% | 1.53% | 3.35% |
| Bloomberg U.S. Intermediate Credit Total Return Index* | 7.88% | 1.54% | 2.96% |
| Bloomberg
U.S. Intermediate Corporate Bond Total Return Index** |
7.95% | 1.60% | 3.09% |
| * | The Bloomberg U.S. Intermediate Credit Total Return Index (LUICTRUU) measures the performance of investment grade, US dollar denominated, fixed-rate, taxable corporate and government-related debt with less than ten years to maturity. It is composed of a corporate and a non-corporate component that includes non-US agencies, sovereigns, supranational and local authorities. Investors cannot invest directly in an index. Unlike the Fund’s returns, the index does not reflect any fees or expenses. |
| ** | The Bloomberg U.S. Intermediate Corporate Bond Total Return Index (LD06TRUU) measures the investment grade, fixed-rate, taxable corporate bond market whose maturity ranges between 1 to 9.9999 years. It includes USD denominated securities publicly issued by US and non-US industrial, utility and financial issuers. Investors cannot invest directly in an index. Unlike the Fund’s returns, the index does not reflect any fees or expenses. |
After-tax returns are calculated using the historical highest individual federal marginal income tax rates and do not reflect the impact of state and local taxes. Actual after-tax returns depend on an investor’s tax situation and may differ from those shown, and after-tax returns shown are not relevant to investors who hold their Shares through tax-deferred arrangements, such as 401(k) plans or individual retirement accounts.
The bar chart and performance table below show the variability of the Fund’s returns, which is some indication of the risks of investing in the Fund by showing changes in the Fund’s performance from year to year and by showing the Fund’s one-year, five-year and since inception performance compared with those of a broad measure of market performance. The bar chart shows performance of the Fund’s shares for each calendar year since the Fund’s inception. The performance table compares the performance of the Fund over time to the performance of a broad-based securities market index and a supplemental index. You should be aware that the Fund’s past performance (before and after taxes) is not necessarily an indication of how the Fund will perform in the future. Updated performance information is available at no cost by visiting www.inspireetf.com.
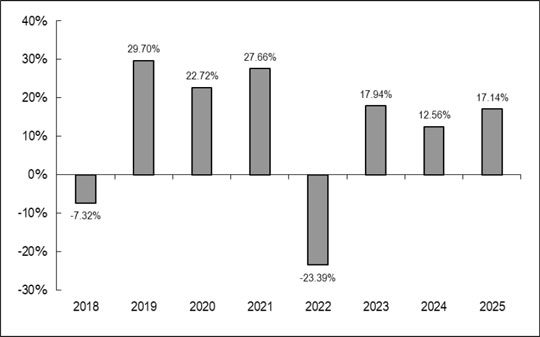
| Best Quarter: | 2nd Quarter 2020 | 23.67% |
| Worst Quarter: | 2nd Quarter 2022 | (18.79)% |
| One Year | Five Years | Since Inception (10/30/17) | |
| Return before taxes | 17.14% | 8.75% | 11.00% |
| Return after taxes on distributions | 16.83% | 7.57% | 10.08% |
| Return after taxes on distributions and sale of Fund shares | 10.33% | 6.60% | 8.73% |
| Inspire 100 Index | 17.60% | 9.25% | 11.77% |
| S&P 500 Index* | 17.88% | 14.42% | 14.61% |
| * | The S&P 500 Index is an unmanaged market capitalization-weighted index which is comprised of 500 of the largest U.S. domiciled companies and includes the reinvestment of all dividends. Investors cannot invest directly in an index. Unlike the Fund’s returns, the index does not reflect any fees or expenses. |
After-tax returns are calculated using the historical highest individual federal marginal income tax rates and do not reflect the impact of state and local taxes. Actual after-tax returns depend on an investor’s tax situation and may differ from those shown, and after-tax returns shown are not relevant to investors who hold their Shares through tax-deferred arrangements, such as 401(k) plans or individual retirement accounts.
The bar chart and performance table below show the variability of the Fund’s returns, which is some indication of the risks of investing in the Fund by showing changes in the Fund’s performance from year to year and by showing the Fund’s one-year, five-year and since inception performance compared with those of a broad measure of market performance. The bar chart shows performance of the Fund’s shares for each calendar year since the Fund’s inception. The performance table compares the performance of the Fund over time to the performance of a broad-based securities market index and supplemental indices. You should be aware that the Fund’s past performance (before and after taxes) is not necessarily an indication of how the Fund will perform in the future. Updated performance information is available at no cost by visiting www.inspireetf.com.
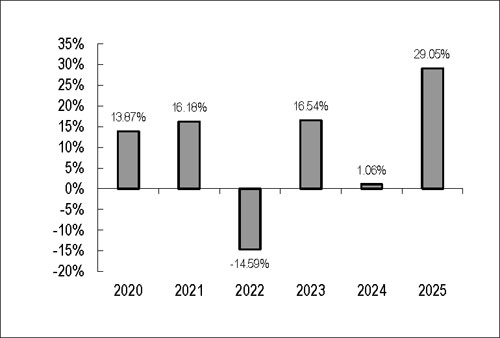
| Best Quarter: | 4th Quarter 2020 | 23.53% |
| Worst Quarter: | 1st Quarter 2020 | (27.55)% |
| One Year | Five Years | Since Inception (09/30/19) | |
| Return before taxes | 29.05% | 8.57% | 10.83% |
| Return after taxes on distributions | 28.34% | 7.32% | 9.76% |
| Return after taxes on distributions and sale of Fund shares | 17.85% | 6.53% | 8.52% |
| Inspire Global Hope Ex-US GTR Index* | 30.71% | 9.21% | 10.72% |
| Inspire International NTR Index | 29.78% | 7.53% | 10.05% |
| S&P International 700 Total Return Index** | 35.45% | 9.90% | 11.16% |
| * | The Inspire International Index GTR (the “Index”) is an Index of Inspire Investing, LLC and is calculated and distributed by Solactive AG. The Index intends to track the price movements of a portfolio of 200 of the most inspiring, biblically aligned large cap companies outside of the United States, as determined by Inspire’s revolutionary Inspire Impact Score methodology which measures a company’s positive impact on the world. Under normal circumstances the index will be comprised of 80% international developed large cap companies and 20% emerging markets large cap companies. The index is equally weighted, rebalanced quarterly, annually reconstituted, and calculated on a gross total return basis in USD. The Index is a Gross Total Return index. The Index is published in USD. Investors cannot invest directly in an index. |
| ** | The S&P International 700 Total Return Index measures the non-U.S. component of the global equity market through an index that is designed to be highly liquid and efficient to replicate. The index covers all regions included in the S&P Global 1200 except for the U.S., which is represented by the S&P 500. Investors cannot invest directly in an index. Unlike the Fund’s returns, the index does not reflect any fees or expenses. |
After-tax returns are calculated using the historical highest individual federal marginal income tax rates and do not reflect the impact of state and local taxes. Actual after-tax returns depend on an investor’s tax situation and may differ from those shown, and after-tax returns shown are not relevant to investors who hold their Shares through tax-deferred arrangements, such as 401(k) plans or individual retirement accounts.
The bar chart and performance table below show the variability of the Fund’s returns, which is some indication of the risks of investing in the Fund by showing changes in the Fund’s performance from year to year and by showing the Fund’s one-year, five-year and since inception performance compared with those of a broad measure of market performance. The bar chart shows performance of the Fund’s shares for each calendar year since the Fund’s inception. The performance table compares the performance of the Fund over time to the performance of a broad-based securities market index. You should be aware that the Fund’s past performance (before and after taxes) is not necessarily an indication of how the Fund will perform in the future. Updated performance information is available at no cost by visiting inspireetf.com.
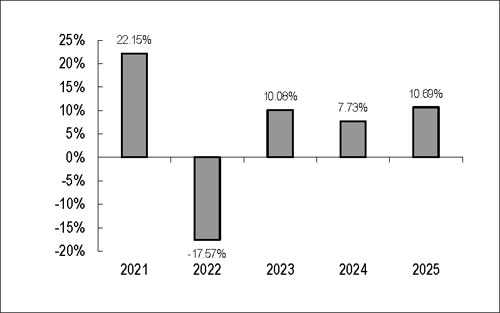
| Best Quarter: | 4th Quarter 2023 | 9.71% |
| Worst Quarter: | 1st Quarter 2022 | (10.73)% |
| One Year | 5 Years | Since Inception (7/15/20) | |
| Return before taxes | 10.69% | 5.74% | 6.63% |
| Return after taxes on distributions | 10.41% | 4.56% | 5.19% |
| Return after taxes on distributions and sale of Fund shares | 6.49% | 3.99% | 4.57% |
| S&P Target Risk Moderate Index* | 13.38% | 4.76% | 5.81% |
| * | The S&P Target Risk Moderate Index is designed to measure the performance of moderate stock-bond allocations to fixed income while seeking to increase opportunities for higher returns through equities. Investors cannot invest directly in an index. Unlike the Fund’s returns, the index does not reflect any fees or expenses. |
After-tax returns are calculated using the historical highest individual federal marginal income tax rates and do not reflect the impact of state and local taxes. Actual after-tax returns depend on an investor’s tax situation and may differ from those shown, and after-tax returns shown are not relevant to investors who hold their Shares through tax-deferred arrangements, such as 401(k) plans or individual retirement accounts.
The bar chart and performance table below show the variability of the Fund’s returns, which is some indication of the risks of investing in the Fund by showing changes in the Fund’s performance from year to year and by showing the Fund’s one-year, five-year and since inception performance compared with those of a broad measure of market performance. The bar chart shows performance of the Fund’s shares for each calendar year since the Fund’s inception. The performance table compares the performance of the Fund over time to the performance of a broad-based securities market index and a supplemental index. You should be aware that the Fund’s past performance (before and after taxes) is not necessarily an indication of how the Fund will perform in the future. Updated performance information is available at no cost by visiting www.inspireetf.com.
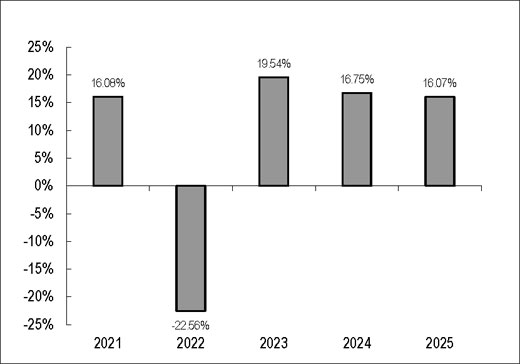
| Best Quarter: | 2nd Quarter 2025 | 14.16% |
| Worst Quarter: | 1st Quarter 2022 | (16.27)% |
| One Year | Five Years | Since Inception (12/7/2020) | |
| Return before taxes | 16.07% | 7.81% | 8.82% |
| Return after taxes on distributions | 15.96% | 7.34% | 8.35% |
| Return after taxes on distributions and sale of Fund shares | 9.57% | 5.97% | 6.79% |
| S&P MidCap 400 Index* | 7.50% | 9.12% | 9.68% |
| S&P Composite 1500 Total Return Index** | 17.02% | 13.96% | 14.20% |
| * | The S&P MidCap 400 Index® provides investors with a benchmark for mid-sized companies. The index, which is distinct from the large-cap S&P 500®, is designed to measure the performance of 400 mid-sized companies, reflecting the distinctive risk and return characteristics of this market segment. Investors cannot invest directly in an index. Unlike the Fund’s returns, the index does not reflect any fees or expenses. |
| ** | The S&P Composite 1500 Total Return Index combines three leading indices, the S&P 500, the S&P MidCap 400 and the S&P SmallCap 600, to cover approximately 90% of U.S. market capitalization. The index is designed for investors seeking to replicate the performance of the U.S. equity market or benchmark against a representative universe of tradable stocks. Investors cannot invest directly in an index. Unlike the Fund’s returns, the index does not reflect any fees or expenses. |
The bar chart and performance table below show the variability of the Fund’s returns, which is some indication of the risks of investing in the Fund’s performance from year to year and by showing the Fund’s one-year and since inception performance compared with those of a broad measure of market performance. The bar chart shows performance of the Fund’s shares for each calendar year since the Fund’s inception. The performance table compares the performance of the Fund over time to the performance of a broad-based securities market index and supplemental indices. You should be aware that the Fund’s past performance (before and after taxes) is not necessarily an indication of how the Fund will perform in the future. Updated performance information is available at no cost by visiting www.inspireetf.com.
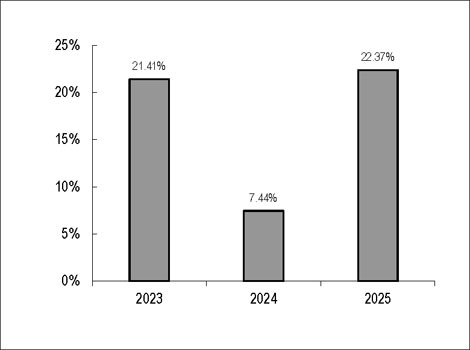
| Best Quarter: | 2nd Quarter 2025 | 13.11% |
| Worst Quarter: | 1st Quarter 2025 | (4.32)% |
| One Year | Since Inception (8/23/2022) | |
| Return before taxes | 22.37% | 14.26% |
| Return after taxes on distributions | 22.10% | 13.47% |
| Return after taxes on distributions and sale of Fund shares | 13.41% | 11.07% |
| WI Fidelis Multi-Cap, Multi-Factor Index | 23.28% | 15.54% |
| S&P Global 1200 Index* | 23.03% | 18.03% |
| MSCI ACWI Index** | 22.34% | 16.85% |
| * | The S&P Global 1200 Index captures approximately 70% of the world cap, covering seven distinct regions and 30 countries. Investors cannot invest directly in an index. Unlike the Fund’s returns, the index does not reflect any fees or expenses. |
| ** | The MSCI ACWI Index is an index representing the equity returns in 23 developed and 24 emerging markets. Investor may not invest in the index directly and the index does not take into account charges, fees and other expenses. Given the Fund’s principal investment strategies, the MSCI ACWI Index is a more appropriate benchmark index for the Fund. Investors cannot invest directly in an index. Unlike the Fund’s returns, the index does not reflect any fees or expenses. |
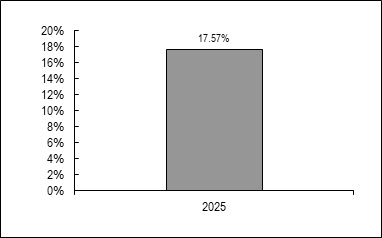
The bar chart and performance table below show the variability of the Fund’s returns, which is some indication of the risks of investing in the Fund’s performance from year to year and by showing the Fund’s one-year and since inception performance compared with those of a broad measure of market performance. The bar chart shows performance of the Fund’s shares for each calendar year since the Fund’s inception. The performance table compares the performance of the Fund over time to the performance of a broad-based securities market index and a supplemental index. You should be aware that the Fund’s past performance (before and after taxes) is not necessarily an indication of how the Fund will perform in the future. Updated performance information is available at no cost by visiting www.inspireetf.com.
| Best Quarter: | 2nd Quarter 2020 | 23.67% |
| Worst Quarter: | 2nd Quarter 2022 | (18.79)% |
| One Year | Since Inception (3/5/2024) | |
| Return before taxes | 17.57% | 14.22% |
| Return after taxes on distributions | 17.17% | 13.86% |
| Return after taxes on distributions and sale of Fund shares | 10.61% | 10.91% |
| Inspire 500 Index | 17.69% | 14.34% |
| S&P 500 Index* | 17.88% | 18.10% |
| * | The S&P 500 Index is an unmanaged market capitalization-weighted index which is comprised of 500 of the largest U.S. domiciled companies and includes the reinvestment of all dividends. Investors cannot invest directly in an index. Unlike the Fund’s returns, the index does not reflect any fees or expenses. |