Pay vs Performance Disclosure
|
12 Months Ended |
|
Dec. 31, 2025
USD ($)
|
Dec. 31, 2024
USD ($)
|
Dec. 31, 2023
USD ($)
|
Dec. 31, 2022
USD ($)
|
Dec. 31, 2021
USD ($)
|
| Pay vs Performance Disclosure |
|
|
|
|
|
| Pay vs Performance Disclosure, Table |
| | | | | | | | | | | | | | | | | | | | | | | | | | | | | | | | Value of Initial Fixed $100 Investment Based On: | | | | Year | Summary Compensation Table Total for PEO
(1) | CAP to PEO
(2) | Average Summary Compensation Table Total for Non-PEO NEOs (3) | Average CAP to Non-PEO NEOs
(2) (4) | Total Shareholder Return
(5) | Peer Group Total Shareholder Return
(5) | Net Earnings
(in thousands)
(6) | Company Selected Measure
(Adjusted ROA)
(6) | | 2025 | $ | 8,114,286 | | $ | 4,224,570 | | $ | 2,365,698 | | $ | 1,174,612 | | $ | 163.05 | | $ | 205.21 | | $ | 453,013 | | 7.4 | % | | 2024 | $ | 11,974,134 | | $ | 10,220,556 | | $ | 3,907,841 | | $ | 3,387,106 | | $ | 256.62 | | $ | 252.18 | | $ | 786,186 | | 13.8 | % | | 2023 | $ | 10,835,643 | | $ | 21,890,383 | | $ | 3,880,158 | | $ | 6,897,989 | | $ | 286.83 | | $ | 254.57 | | $ | 738,748 | | 15.2 | % | | 2022 | $ | 8,015,467 | | $ | 5,124,002 | | $ | 2,771,835 | | $ | 1,463,392 | | $ | 150.88 | | $ | 142.70 | | $ | 992,192 | | 20.7 | % | | 2021 | $ | 7,915,603 | | $ | 13,521,596 | | $ | 3,765,401 | | $ | 6,630,450 | | $ | 199.74 | | $ | 184.74 | | $ | 737,444 | | 20.7 | % |
|
|
|
|
|
| Named Executive Officers, Footnote |
For all years presented, our PEO is Phillippe Lord.
|
|
|
|
|
| PEO Total Compensation Amount |
$ 8,114,286
|
$ 11,974,134
|
$ 10,835,643
|
$ 8,015,467
|
$ 7,915,603
|
| PEO Actually Paid Compensation Amount |
$ 4,224,570
|
10,220,556
|
21,890,383
|
5,124,002
|
13,521,596
|
| Adjustment To PEO Compensation, Footnote |
Adjustments to the Summary Compensation Table Total to arrive at CAP for PEO are shown below. No adjustments were necessary for defined benefit and pension plans, dividends or forfeitures. | | | | | | | | | | | | | | | | | | | | | | Year | Summary Compensation Table Total for PEO | Less:
Grant Date Fair Value of Equity Awards Granted in Fiscal Year | Plus:
Increase/(Decrease) in Fair Value of Equity Vested during Fiscal Year | Plus:
Increase/(Decrease) in Fair Value of Unvested Equity at Fiscal Year-End
(Current Year Awards) | Plus:
Increase/(Decrease) in Fair Value of Unvested Equity at Fiscal Year-End
(Prior Year Awards) | CAP to PEO | | 2025 | $ | 8,114,286 | | $ | (5,697,085) | | $ | (372,539) | | $ | 4,843,162 | | $ | (2,663,254) | | $ | 4,224,570 | | | 2024 | $ | 11,974,134 | | $ | (4,927,978) | | $ | (612,858) | | $ | 5,382,084 | | $ | (1,594,826) | | $ | 10,220,556 | | | 2023 | $ | 10,835,643 | | $ | (4,248,118) | | $ | 530,043 | | $ | 7,473,949 | | $ | 7,298,866 | | $ | 21,890,383 | | | 2022 | $ | 8,015,467 | | $ | (3,667,484) | | $ | (1,235,030) | | $ | 3,642,886 | | $ | (1,631,837) | | $ | 5,124,002 | | | 2021 | $ | 7,915,603 | | $ | (2,956,519) | | $ | 97,238 | | $ | 4,562,638 | | $ | 3,902,636 | | $ | 13,521,596 | |
|
|
|
|
|
| Non-PEO NEO Average Total Compensation Amount |
$ 2,365,698
|
3,907,841
|
3,880,158
|
2,771,835
|
3,765,401
|
| Non-PEO NEO Average Compensation Actually Paid Amount |
$ 1,174,612
|
3,387,106
|
6,897,989
|
1,463,392
|
6,630,450
|
| Adjustment to Non-PEO NEO Compensation Footnote |
Adjustments to the Summary Compensation Table Total to arrive at CAP for Non-PEO NEOs are shown below. No adjustments were necessary for defined benefit and pension plans, dividends or forfeitures. | | | | | | | | | | | | | | | | | | | | | | Year | Average Summary Compensation Table Total for Non-PEO NEOs | Less:
Average Grant Date Fair Value of Equity Awards Granted in Fiscal Year | Plus:
Average Increase/(Decrease) in Fair Value of Equity Awards Vested during Fiscal Year | Plus:
Average Fair Value of Unvested Equity Awards at Fiscal Year-End
(Current Year Awards) | Plus:
Average Increase/(Decrease) in Fair Value of Unvested Equity Awards at Fiscal Year-End
(Prior Year Awards) | Average CAP to Non-PEO NEOs | | 2025 | $ | 2,365,698 | | $ | (1,409,068) | | $ | (102,370) | | $ | 810,414 | | $ | (490,062) | | $ | 1,174,612 | | | 2024 | $ | 3,907,841 | | $ | (1,290,893) | | $ | (164,892) | | $ | 1,392,235 | | $ | (457,185) | | $ | 3,387,106 | | | 2023 | $ | 3,880,158 | | $ | (1,094,728) | | $ | 273,493 | | $ | 1,888,288 | | $ | 1,950,778 | | $ | 6,897,989 | | | 2022 | $ | 2,771,835 | | $ | (991,485) | | $ | (660,564) | | $ | 989,330 | | $ | (645,724) | | $ | 1,463,392 | | | 2021 | $ | 3,765,401 | | $ | (976,923) | | $ | 276,939 | | $ | 1,366,073 | | $ | 2,198,960 | | $ | 6,630,450 | |
|
|
|
|
|
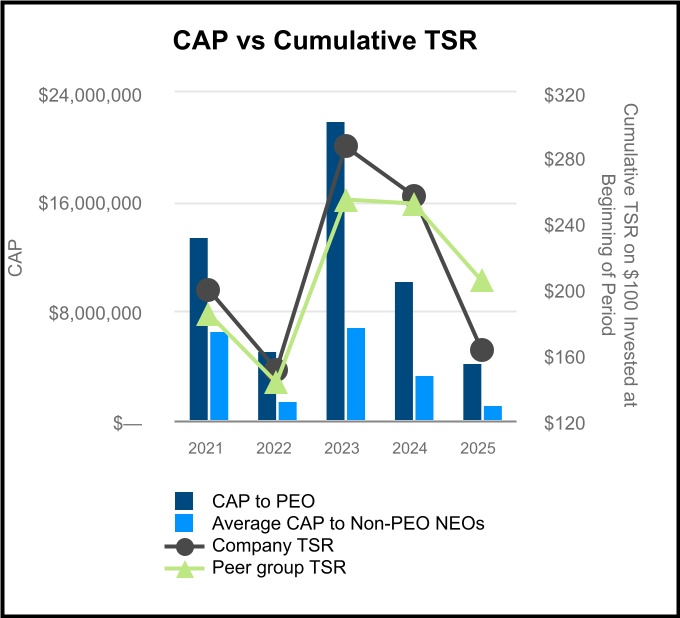
| Compensation Actually Paid vs. Total Shareholder Return |
We have elected to use the Dow Jones US Home Construction Index as our peer group. The graph below illustrates the relationship between our cumulative TSR and peer group TSR, and the relationship between our CAP and the cumulative TSR for both the Company and our peer group.
|
|
|
|
|
| Compensation Actually Paid vs. Net Income |
The relationships between CAP and Net Earnings and CAP and Adjusted ROA are illustrated in the following graphs. Adjusted ROA is calculated as Net Earnings divided by the average of five trailing quarters Total Assets, less Cash and Cash Equivalents. Net Earnings is adjusted for specific and predetermined items, including the add back of NEO compensation. Our Adjusted ROA as it relates to CAP is demonstrated below.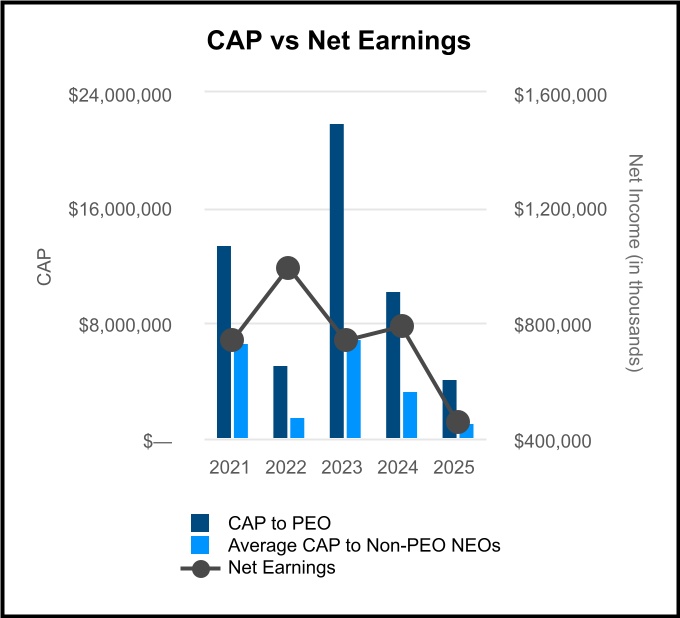
|
|
|
|
|
| Compensation Actually Paid vs. Company Selected Measure |
The relationships between CAP and Net Earnings and CAP and Adjusted ROA are illustrated in the following graphs. Adjusted ROA is calculated as Net Earnings divided by the average of five trailing quarters Total Assets, less Cash and Cash Equivalents. Net Earnings is adjusted for specific and predetermined items, including the add back of NEO compensation. Our Adjusted ROA as it relates to CAP is demonstrated below.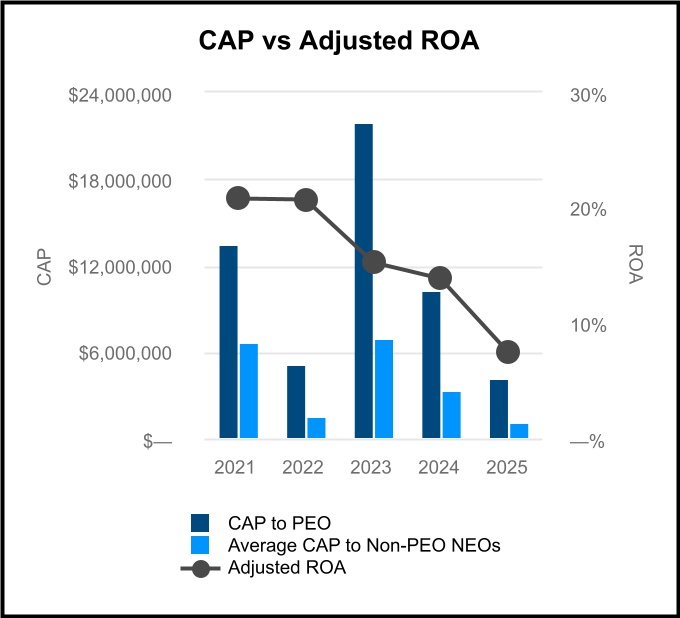
|
|
|
|
|
| Total Shareholder Return Vs Peer Group |
We have elected to use the Dow Jones US Home Construction Index as our peer group. The graph below illustrates the relationship between our cumulative TSR and peer group TSR, and the relationship between our CAP and the cumulative TSR for both the Company and our peer group.
|
|
|
|
|
| Tabular List, Table |
| | | | Metric | | rTSR | | Adjusted ROA | | Adjusted EBITDA | | Number of Home Closings | | Customer Satisfaction Rating |
|
|
|
|
|
| Total Shareholder Return Amount |
$ 163.05
|
256.62
|
286.83
|
150.88
|
199.74
|
| Peer Group Total Shareholder Return Amount |
205.21
|
252.18
|
254.57
|
142.70
|
184.74
|
| Net Income (Loss) |
$ 453,013,000
|
$ 786,186,000
|
$ 738,748,000
|
$ 992,192,000
|
$ 737,444,000
|
| Company Selected Measure Amount |
0.074
|
0.138
|
0.152
|
0.207
|
0.207
|
| PEO Name |
Phillippe Lord
|
Phillippe Lord
|
Phillippe Lord
|
Phillippe Lord
|
|
| Measure:: 1 |
|
|
|
|
|
| Pay vs Performance Disclosure |
|
|
|
|
|
| Name |
rTSR
|
|
|
|
|
| Measure:: 2 |
|
|
|
|
|
| Pay vs Performance Disclosure |
|
|
|
|
|
| Name |
Adjusted ROA
|
|
|
|
|
| Measure:: 3 |
|
|
|
|
|
| Pay vs Performance Disclosure |
|
|
|
|
|
| Name |
Adjusted EBITDA
|
|
|
|
|
| Measure:: 4 |
|
|
|
|
|
| Pay vs Performance Disclosure |
|
|
|
|
|
| Name |
Number of Home Closings
|
|
|
|
|
| Measure:: 5 |
|
|
|
|
|
| Pay vs Performance Disclosure |
|
|
|
|
|
| Name |
Customer Satisfaction Rating
|
|
|
|
|
| PEO | Phillppe Lord [Member] | Equity Awards Granted During The Year [Member] |
|
|
|
|
|
| Pay vs Performance Disclosure |
|
|
|
|
|
| Adjustment to Compensation, Amount |
$ (5,697,085)
|
$ (4,927,978)
|
$ (4,248,118)
|
$ (3,667,484)
|
|
| PEO | Phillppe Lord [Member] | Equity Awards Vested During The Year [Member] |
|
|
|
|
|
| Pay vs Performance Disclosure |
|
|
|
|
|
| Adjustment to Compensation, Amount |
(372,539)
|
(612,858)
|
530,043
|
(1,235,030)
|
|
| PEO | Phillppe Lord [Member] | Equity Awards Granted During The Year, Unvested [Member] |
|
|
|
|
|
| Pay vs Performance Disclosure |
|
|
|
|
|
| Adjustment to Compensation, Amount |
4,843,162
|
5,382,084
|
7,473,949
|
3,642,886
|
|
| PEO | Phillppe Lord [Member] | Equity Awards Granted In Prior Years, Unvested [Member] |
|
|
|
|
|
| Pay vs Performance Disclosure |
|
|
|
|
|
| Adjustment to Compensation, Amount |
(2,663,254)
|
(1,594,826)
|
7,298,866
|
(1,631,837)
|
|
| PEO | Steven J. Hilton [Member] | Equity Awards Granted During The Year [Member] |
|
|
|
|
|
| Pay vs Performance Disclosure |
|
|
|
|
|
| Adjustment to Compensation, Amount |
|
|
|
|
$ (2,956,519)
|
| PEO | Steven J. Hilton [Member] | Equity Awards Vested During The Year [Member] |
|
|
|
|
|
| Pay vs Performance Disclosure |
|
|
|
|
|
| Adjustment to Compensation, Amount |
|
|
|
|
97,238
|
| PEO | Steven J. Hilton [Member] | Equity Awards Granted During The Year, Unvested [Member] |
|
|
|
|
|
| Pay vs Performance Disclosure |
|
|
|
|
|
| Adjustment to Compensation, Amount |
|
|
|
|
4,562,638
|
| PEO | Steven J. Hilton [Member] | Equity Awards Granted In Prior Years, Unvested [Member] |
|
|
|
|
|
| Pay vs Performance Disclosure |
|
|
|
|
|
| Adjustment to Compensation, Amount |
|
|
|
|
3,902,636
|
| Non-PEO NEO | Equity Awards Granted During The Year [Member] |
|
|
|
|
|
| Pay vs Performance Disclosure |
|
|
|
|
|
| Adjustment to Compensation, Amount |
(1,409,068)
|
(1,290,893)
|
(1,094,728)
|
(991,485)
|
(976,923)
|
| Non-PEO NEO | Equity Awards Vested During The Year [Member] |
|
|
|
|
|
| Pay vs Performance Disclosure |
|
|
|
|
|
| Adjustment to Compensation, Amount |
(102,370)
|
(164,892)
|
273,493
|
(660,564)
|
276,939
|
| Non-PEO NEO | Equity Awards Granted During The Year, Unvested [Member] |
|
|
|
|
|
| Pay vs Performance Disclosure |
|
|
|
|
|
| Adjustment to Compensation, Amount |
810,414
|
1,392,235
|
1,888,288
|
989,330
|
1,366,073
|
| Non-PEO NEO | Equity Awards Granted In Prior Years, Unvested [Member] |
|
|
|
|
|
| Pay vs Performance Disclosure |
|
|
|
|
|
| Adjustment to Compensation, Amount |
$ (490,062)
|
$ (457,185)
|
$ 1,950,778
|
$ (645,724)
|
$ 2,198,960
|