Pay vs Performance Disclosure
|
12 Months Ended |
|
Dec. 31, 2025
USD ($)
|
Dec. 31, 2024
USD ($)
$ / shares
|
Dec. 31, 2023
USD ($)
$ / shares
|
Dec. 31, 2022
USD ($)
$ / shares
|
Dec. 31, 2021
USD ($)
$ / shares
|
| Pay vs Performance Disclosure |
|
|
|
|
|
| Pay vs Performance Disclosure, Table |
|
| | | | | | | | | | | | | | | | | | | | | | | | | | | Year (1) | Summary Compensation Table Total for PEO (2) | Compensation Actually Paid to PEO | Average Summary Compensation Table Total for Non-PEO NEOs (2) | Average Compensation Actually Paid to Non-PEO NEOs | Value of Initial Fixed $100 Investment Based On: | Net
Income (millions) | Book Value per Share (4) | | Total Shareholder Return | Peer Group Total Shareholder Return (3) | | (a) | (b) | (c) | (d) | (e) | (f) | (g) | (h) | (i) | | | | | | | | | | 2025 | $ | 10,209,615 | | $ | 14,181,268 | | $ | 2,897,416 | | $ | 3,616,594 | | $ | 180 | | $ | 166 | | $ | 388.9 | | $ | 34.58 | | 2024 | $ | 8,978,934 | | $ | 15,261,772 | | $ | 2,743,746 | | $ | 3,279,985 | | $ | 162 | | $ | 140 | | $ | 360.1 | | $ | 29.80 | | 2023 | $ | 7,931,487 | | $ | 12,238,436 | | $ | 2,515,877 | | $ | 3,829,745 | | $ | 131 | | $ | 130 | | $ | 322.1 | | $ | 25.54 | | 2022 | $ | 5,474,844 | | $ | 5,004,886 | | $ | 2,831,491 | | $ | 2,750,584 | | $ | 92 | | $ | 93 | | $ | 292.9 | | $ | 21.76 | | 2021 | $ | 4,970,949 | | $ | 4,032,083 | | $ | 2,605,661 | | $ | 2,534,488 | | $ | 96 | | $ | 106 | | $ | 231.1 | | $ | 18.23 | |
|
|
|
|
| Company Selected Measure Name |
|
BVPS
|
|
|
|
| Peer Group Issuers, Footnote |
|
The peer group used by the Company consists of the companies, including Essent Group Ltd., MGIC Investment Corporation, and Radian Group Inc., used in the Company’s performance graph as required by Item 201(e) of Regulation S-K and reported in Part II, Item 5 of its annual report on Form 10-K for the fiscal year ended December 31, 2025.
|
|
|
|
| PEO Total Compensation Amount |
$ 10,209,615
|
$ 8,978,934
|
$ 7,931,487
|
$ 5,474,844
|
$ 4,970,949
|
| PEO Actually Paid Compensation Amount |
14,181,268
|
$ 15,261,772
|
12,238,436
|
5,004,886
|
4,032,083
|
| Adjustment To PEO Compensation, Footnote |
|
The "2025 Summary Compensation Table" totals reported for the PEO and the average of the Non-PEO NEOs for each year were subject to the following adjustments as set forth in the below table, per Item 402(v)(2)(iii) of Regulation S-K to calculate “compensation actually paid.” We did not make any assumptions in valuation that differs materially from those disclosed as of the grant date of such equity awards with respect to the amounts added relative to stock and option awards. | | | | | | | | | | | | | | | | | | | | | | | | | | | | | | | | | | | | | | | | | | | | | | | | | | | | | 2025 | | 2024 | | 2023 | | 2022 | | 2021 | | | | PEO
(Mr. Pollitzer)
($) | Average for Non-PEO NEOs
($) | | PEO
(Mr. Pollitzer)
($) | Average for Non-PEO NEOs
($) | | PEO
(Mr. Pollitzer)
($) | Average for Non-PEO NEOs
($) | | PEO
(Mr. Pollitzer)
($) | Average for Non-PEO NEOs
($) | | PEO
(Ms. Merkle)
($) | Average for Non-PEO NEOs
($) | | | | | | | | | | | | | | | | | | | | Summary Compensation Table Total | 10,209,615 | 2,897,416 | | 8,978,934 | 2,743,746 | | 7,931,487 | 2,515,877 | | 5,474,844 | 2,831,491 | | 4,970,949 | 2,605,661 | | | Adjustments | | | | | | | | | | | | | | | | | Deduction for Grant Date Fair Value of Awards Granted During Year | (6,337,450) | | (1,306,651) | | | (4,874,994) | | (1,376,427) | | | (4,274,972) | | (977,983) | | | (3,000,000) | | (1,540,534) | | | (2,315,962) | | (991,737) | | | | Adjustment for Fair Value of Equity Calculated Using SEC Methodology (a) | | | (i) Year-End Fair Value of Outstanding and Unvested Equity Awards Granted in the Applicable Year | 7,352,234 | | 1,515,879 | | | 5,975,485 | | 1,389,925 | | | 5,480,828 | 1,253,846 | | 2,427,410 | 1,246,502 | | | 1,100,082 | | 942,150 | | | | (ii) Year over Year Change in Fair Value of Outstanding and Unvested Equity Awards Granted in Prior Years | 2,173,266 | | 412,980 | | | 4,522,308 | | 572,680 | | | 2,582,252 | | 818,534 | | | 13,051 | | 72,727 | | | 258,291 | | 22,031 | | | | (iii) Year over Year Change in Fair Value of Equity Awards Granted in Prior Years that Vested in the Year | 783,603 | | 96,970 | | | 660,039 | | 130,682 | | | 518,841 | | 219,471 | | | 89,581 | | 140,398 | | | 18,723 | | (43,617) | | | | (iv) Any awards granted in any prior fiscal year that fail to meet the applicable vesting conditions during the covered fiscal year, the amount equal to the fair value at the end of the prior fiscal year | — | | — | | | — | | (180,621) | | | — | | — | | | — | | — | | | — | | — | | | | Compensation Actually Paid | 14,181,268 | | 3,616,594 | | | 15,261,772 | | 3,279,985 | | | 12,238,436 | | 3,829,745 | | | 5,004,886 | | 2,750,584 | | | 4,032,083 | | 2,534,488 | | |
|
|
|
|
| Non-PEO NEO Average Total Compensation Amount |
2,897,416
|
$ 2,743,746
|
2,515,877
|
2,831,491
|
2,605,661
|
| Non-PEO NEO Average Compensation Actually Paid Amount |
3,616,594
|
$ 3,279,985
|
3,829,745
|
2,750,584
|
2,534,488
|
| Adjustment to Non-PEO NEO Compensation Footnote |
|
The "2025 Summary Compensation Table" totals reported for the PEO and the average of the Non-PEO NEOs for each year were subject to the following adjustments as set forth in the below table, per Item 402(v)(2)(iii) of Regulation S-K to calculate “compensation actually paid.” We did not make any assumptions in valuation that differs materially from those disclosed as of the grant date of such equity awards with respect to the amounts added relative to stock and option awards. | | | | | | | | | | | | | | | | | | | | | | | | | | | | | | | | | | | | | | | | | | | | | | | | | | | | | 2025 | | 2024 | | 2023 | | 2022 | | 2021 | | | | PEO
(Mr. Pollitzer)
($) | Average for Non-PEO NEOs
($) | | PEO
(Mr. Pollitzer)
($) | Average for Non-PEO NEOs
($) | | PEO
(Mr. Pollitzer)
($) | Average for Non-PEO NEOs
($) | | PEO
(Mr. Pollitzer)
($) | Average for Non-PEO NEOs
($) | | PEO
(Ms. Merkle)
($) | Average for Non-PEO NEOs
($) | | | | | | | | | | | | | | | | | | | | Summary Compensation Table Total | 10,209,615 | 2,897,416 | | 8,978,934 | 2,743,746 | | 7,931,487 | 2,515,877 | | 5,474,844 | 2,831,491 | | 4,970,949 | 2,605,661 | | | Adjustments | | | | | | | | | | | | | | | | | Deduction for Grant Date Fair Value of Awards Granted During Year | (6,337,450) | | (1,306,651) | | | (4,874,994) | | (1,376,427) | | | (4,274,972) | | (977,983) | | | (3,000,000) | | (1,540,534) | | | (2,315,962) | | (991,737) | | | | Adjustment for Fair Value of Equity Calculated Using SEC Methodology (a) | | | (i) Year-End Fair Value of Outstanding and Unvested Equity Awards Granted in the Applicable Year | 7,352,234 | | 1,515,879 | | | 5,975,485 | | 1,389,925 | | | 5,480,828 | 1,253,846 | | 2,427,410 | 1,246,502 | | | 1,100,082 | | 942,150 | | | | (ii) Year over Year Change in Fair Value of Outstanding and Unvested Equity Awards Granted in Prior Years | 2,173,266 | | 412,980 | | | 4,522,308 | | 572,680 | | | 2,582,252 | | 818,534 | | | 13,051 | | 72,727 | | | 258,291 | | 22,031 | | | | (iii) Year over Year Change in Fair Value of Equity Awards Granted in Prior Years that Vested in the Year | 783,603 | | 96,970 | | | 660,039 | | 130,682 | | | 518,841 | | 219,471 | | | 89,581 | | 140,398 | | | 18,723 | | (43,617) | | | | (iv) Any awards granted in any prior fiscal year that fail to meet the applicable vesting conditions during the covered fiscal year, the amount equal to the fair value at the end of the prior fiscal year | — | | — | | | — | | (180,621) | | | — | | — | | | — | | — | | | — | | — | | | | Compensation Actually Paid | 14,181,268 | | 3,616,594 | | | 15,261,772 | | 3,279,985 | | | 12,238,436 | | 3,829,745 | | | 5,004,886 | | 2,750,584 | | | 4,032,083 | | 2,534,488 | | |
|
|
|
|
| Compensation Actually Paid vs. Total Shareholder Return |
|
|
|
|
|
| Compensation Actually Paid vs. Net Income |
|
|
|
|
|
| Compensation Actually Paid vs. Company Selected Measure |
|
|
|
|
|
| Total Shareholder Return Vs Peer Group |
|
|
|
|
|
| Tabular List, Table |
|
| | | | 2025 Most Important Performance Metrics | BVPS | Return on Equity | Net Operating Income |
|
|
|
|
| Total Shareholder Return Amount |
180
|
$ 162
|
131
|
92
|
96
|
| Peer Group Total Shareholder Return Amount |
166
|
140
|
130
|
93
|
106
|
| Net Income (Loss) |
$ 388,900,000
|
$ 360,100,000
|
$ 322,100,000
|
$ 292,900,000
|
$ 231,100,000
|
| Company Selected Measure Amount |
34.58
|
29.80
|
25.54
|
21.76
|
18.23
|
| PEO Name |
Mr. Pollitzer
|
Mr. Pollitzer
|
Mr. Pollitzer
|
Mr. Pollitzer
|
Ms. Merkle
|
| Additional 402(v) Disclosure |
|
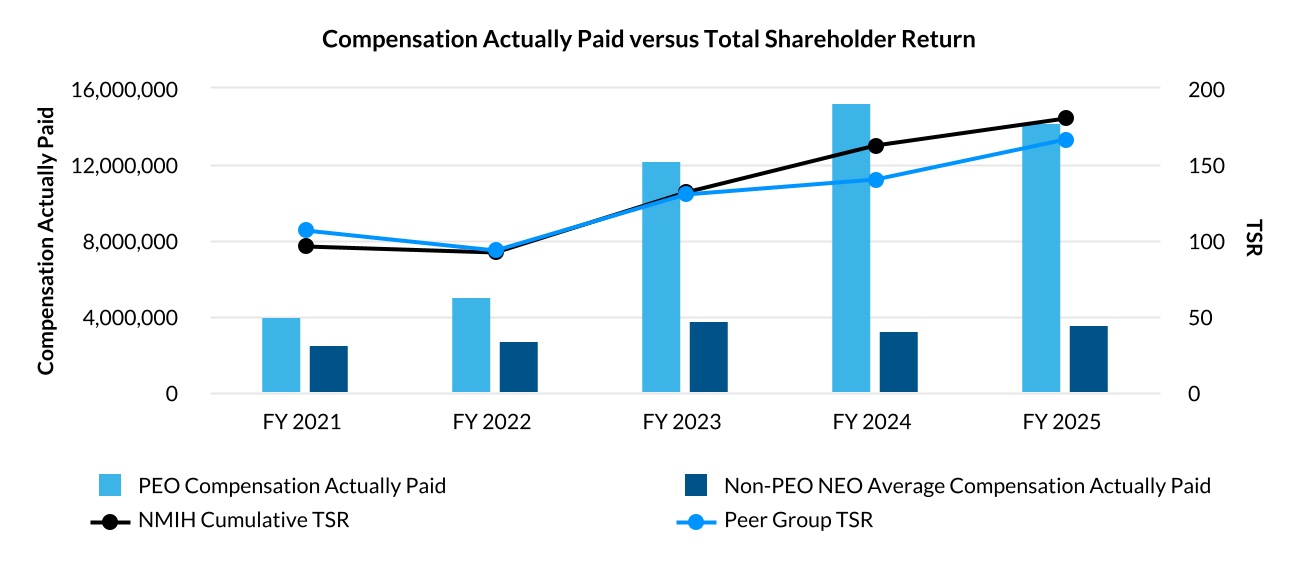
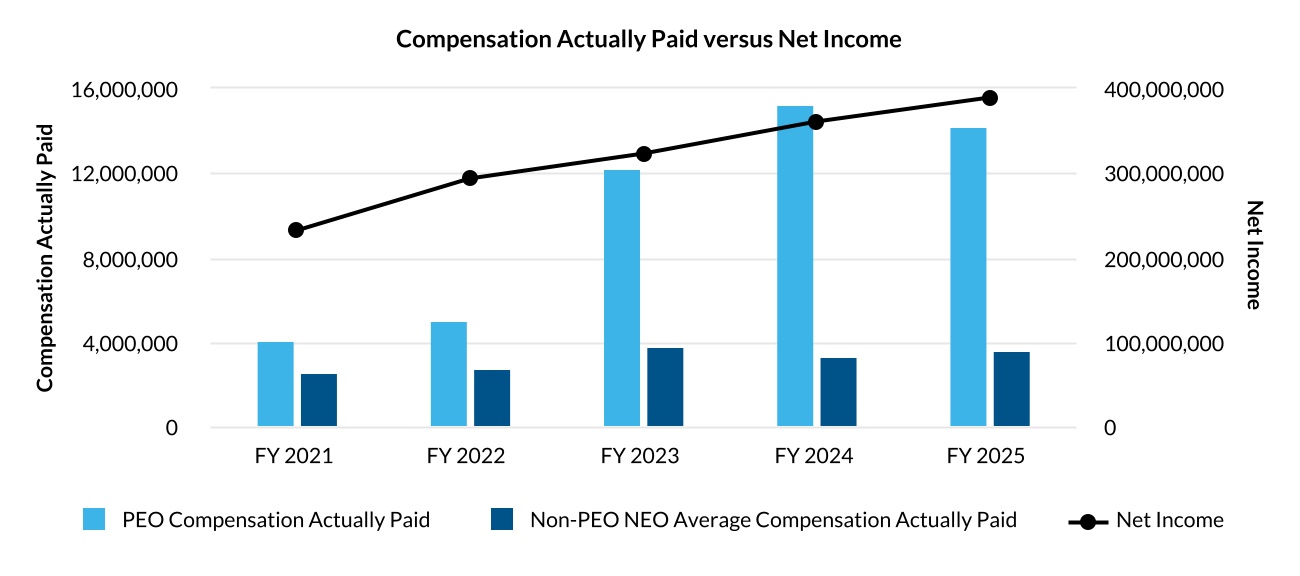
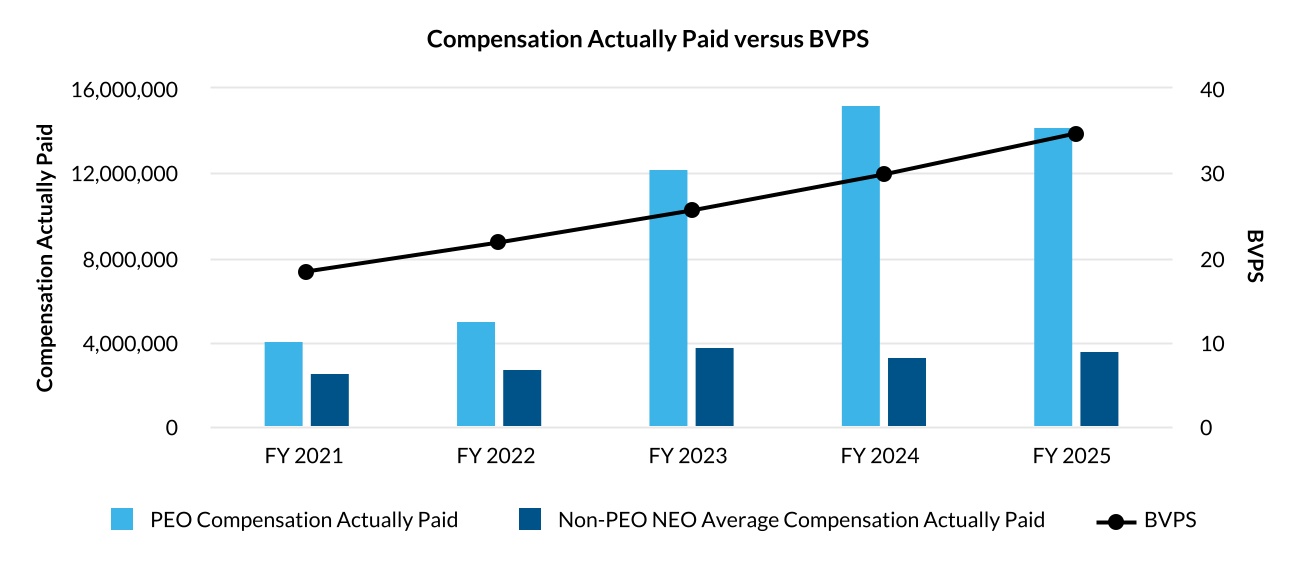
Relationship Between "Compensation Actually Paid" and Performance The following graphs show the relationship between compensation actually paid to our executives in each of the last five years as disclosed in the Pay vs. Performance table, and each of the following: the Company's cumulative TSR, the peer group cumulative TSR, the Company's net income, and the BVPS. Tabular List of Most Important Financial Performance Measures Below are the financial performance measures that we believe are the most important financial performance measures used to link NEO compensation to Company performance. For more information, please see “Compensation of Named Executive Officers – Compensation Discussion and Analysis” and Appendix A in this proxy statement for a reconciliation of the below financial measures to the most directly comparable GAAP measure.
|
|
|
|
| Measure:: 1 |
|
|
|
|
|
| Pay vs Performance Disclosure |
|
|
|
|
|
| Name |
|
BVPS
|
|
|
|
| Non-GAAP Measure Description |
|
BVPS (excluding net unrealized gains and losses) is a non-GAAP measure, and is defined as total shareholder's equity, excluding the after-tax effects of unrealized gains and losses on investments, divided by shares outstanding. For more detail, please see Appendix A.
|
|
|
|
| Measure:: 2 |
|
|
|
|
|
| Pay vs Performance Disclosure |
|
|
|
|
|
| Name |
|
Return on Equity
|
|
|
|
| Measure:: 3 |
|
|
|
|
|
| Pay vs Performance Disclosure |
|
|
|
|
|
| Name |
|
Net Operating Income
|
|
|
|
| PEO | Adjustment, Equity Awards Reported [Member] |
|
|
|
|
|
| Pay vs Performance Disclosure |
|
|
|
|
|
| Adjustment to Compensation, Amount |
|
$ (4,874,994)
|
$ (4,274,972)
|
$ (3,000,000)
|
$ (2,315,962)
|
| PEO | Adjustment, Year-End Fair Value of Outstanding and Unvested Equity Awards Granted in the Applicable Year [Member] |
|
|
|
|
|
| Pay vs Performance Disclosure |
|
|
|
|
|
| Adjustment to Compensation, Amount |
|
5,975,485
|
5,480,828
|
2,427,410
|
1,100,082
|
| PEO | Adjustment, Year over Year Change in Fair Value of Outstanding and Unvested Equity Awards Granted in Prior Years [Member] |
|
|
|
|
|
| Pay vs Performance Disclosure |
|
|
|
|
|
| Adjustment to Compensation, Amount |
|
4,522,308
|
2,582,252
|
13,051
|
258,291
|
| PEO | Adjustment, Year over Year Change in Fair Value of Equity Awards Granted in Prior Years that Vested in the Year [Member] |
|
|
|
|
|
| Pay vs Performance Disclosure |
|
|
|
|
|
| Adjustment to Compensation, Amount |
|
660,039
|
518,841
|
89,581
|
18,723
|
| Non-PEO NEO | Adjustment, Equity Awards Reported [Member] |
|
|
|
|
|
| Pay vs Performance Disclosure |
|
|
|
|
|
| Adjustment to Compensation, Amount |
|
(1,376,427)
|
(977,983)
|
(1,540,534)
|
(991,737)
|
| Non-PEO NEO | Adjustment, Year-End Fair Value of Outstanding and Unvested Equity Awards Granted in the Applicable Year [Member] |
|
|
|
|
|
| Pay vs Performance Disclosure |
|
|
|
|
|
| Adjustment to Compensation, Amount |
|
1,389,925
|
1,253,846
|
1,246,502
|
942,150
|
| Non-PEO NEO | Adjustment, Year over Year Change in Fair Value of Outstanding and Unvested Equity Awards Granted in Prior Years [Member] |
|
|
|
|
|
| Pay vs Performance Disclosure |
|
|
|
|
|
| Adjustment to Compensation, Amount |
|
572,680
|
818,534
|
72,727
|
22,031
|
| Non-PEO NEO | Adjustment, Year over Year Change in Fair Value of Equity Awards Granted in Prior Years that Vested in the Year [Member] |
|
|
|
|
|
| Pay vs Performance Disclosure |
|
|
|
|
|
| Adjustment to Compensation, Amount |
|
$ 130,682
|
$ 219,471
|
$ 140,398
|
$ (43,617)
|