Pay vs Performance Disclosure - USD ($)
Dec. 31, 2025
Dec. 31, 2024
Dec. 31, 2023
Dec. 31, 2022
Dec. 31, 2021
Dec. 31, 2025
May 31, 2021
Value of Initial Fixed $100 Investment Based On:4 | ||||||||||||||||||||||||||||||||
| Year | Summary Compensation Table Total for Glenn L. Kellow 1 ($) | Compensation Actually Paid to Glenn L. Kellow 1,2,3 ($) | Summary Compensation Table Total for James C. Grech 1 ($) | Compensation Actually Paid to James C. Grech 1,2,3 ($) | Average Summary Compensation Table Total for Non-PEO NEOs1 ($) | Average Compensation Actually Paid to Non-PEO NEOs1,2,3 ($) | TSR ($) | Peer Group TSR ($)4 | Net Income ($) | Adjusted EBITDA5 ($) | ||||||||||||||||||||||
| 2025 | — | — | 9,025,131 | 16,634,679 | 3,375,218 | 5,741,702 | 1,281.62 | 330.58 | (42,500,000) | 454,900,000 | ||||||||||||||||||||||
| 2024 | — | — | 6,972,467 | 7,275,899 | 2,510,874 | 2,590,603 | 888.41 | 179.48 | 403,500,000 | 871,700,000 | ||||||||||||||||||||||
| 2023 | — | — | 5,879,892 | 4,805,574 | 2,630,479 | 2,504,778 | 1,018.99 | 187.42 | 815,600,000 | 1,363,900,000 | ||||||||||||||||||||||
| 2022 | — | — | 3,811,296 | 8,016,084 | 2,172,769 | 4,353,640 | 1,096.27 | 153.72 | 1,319,100,000 | 1,844,700,000 | ||||||||||||||||||||||
| 2021 | 8,753,812 | 11,945,403 | 4,239,272 | 4,777,733 | 2,195,035 | 3,284,553 | 417.84 | 135.48 | 371,400,000 | 916,700,000 | ||||||||||||||||||||||
(1)Glenn L. Kellow was our PEO from May 2015 to June 2021. James C. Grech was our PEO from June 2021 to present. The individuals comprising the Non-PEO NEOs for each year presented are listed below.
| 2021 | 2022 | 2023 | 2024 | 2025 | ||||||||||
| Mark A. Spurbeck | Mark A. Spurbeck | Mark A. Spurbeck | Mark A. Spurbeck | Mark A. Spurbeck | ||||||||||
| Darren R. Yeates | Darren R. Yeates | Darren R. Yeates | Darren R. Yeates | Darren R. Yeates | ||||||||||
| Marc E. Hathhorn | Marc E. Hathhorn | Marc E. Hathhorn | Scott T. Jarboe | Scott T. Jarboe | ||||||||||
| Scott T. Jarboe | Scott T. Jarboe | Scott T. Jarboe | Patrick J. Forkin III | Patrick J. Forkin III | ||||||||||
| Kemal Williamson | Marc E. Hathhorn | |||||||||||||
| Year | Summary Compensation Table Total for James C. Grech ($) | Exclusion of Stock Awards for James C. Grech ($) | Inclusion of Equity Values for James C. Grech ($) | Compensation Actually Paid to James C. Grech ($) | ||||||||||
| 2025 | 9,025,131 | (5,080,125) | 12,689,673 | 16,634,679 | ||||||||||
| Year | Average Summary Compensation Table Total for Non-PEO NEOs ($) | Average Exclusion of Stock Awards for Non-PEO NEOs ($) | Average Inclusion of Equity Values for Non-PEO NEOs ($) | Average Compensation Actually Paid to Non-PEO NEOs ($) | ||||||||||
| 2025 | 3,375,218 | (1,639,209) | 4,005,693 | 5,741,702 | ||||||||||
The amounts in the Inclusion of Equity Values in the tables above are derived from the amounts set forth in the following tables:
| Year | Year-End Fair Value of Equity Awards Granted During Year That Remained Unvested as of Last Day of Year for James C. Grech ($) | Change in Fair Value from Last Day of Prior Year to Last Day of Year of Unvested Equity Awards for James C. Grech ($) | Vesting-Date Fair Value of Equity Awards Granted During Year that Vested During Year for James C. Grech ($) | Change in Fair Value from Last Day of Prior Year to Vesting Date of Unvested Equity Awards that Vested During Year for James C. Grech ($) | Fair Value at Last Day of Prior Year of Equity Awards Forfeited During Year for James C. Grech ($) | Total - Inclusion of Equity Values for James C. Grech ($) | ||||||||||||||
| 2025 | 9,808,200 | 2,893,252 | $ | — | (11,778) | $ | — | 12,689,673 | ||||||||||||
| Year | Average Year-End Fair Value of Equity Awards Granted During Year That Remained Unvested as of Last Day of Year for Non-PEO NEOs ($) | Average Change in Fair Value from Last Day of Prior Year to Last Day of Year of Unvested Equity Awards for Non-PEO NEOs ($) | Average Vesting-Date Fair Value of Equity Awards Granted During Year that Vested During Year for Non-PEO NEOs ($) | Average Change in Fair Value from Last Day of Prior Year to Vesting Date of Unvested Equity Awards that Vested During Year for Non-PEO NEOs ($) | Average Fair Value at Last Day of Prior Year of Equity Awards Forfeited During Year for Non-PEO NEOs ($) | Average Total - Inclusion of Equity Values for Non-PEO NEOs ($) | ||||||||||||||
| 2025 | 3,164,821 | 844,538 | $ | — | (3,667) | $ | — | 4,005,693 | ||||||||||||
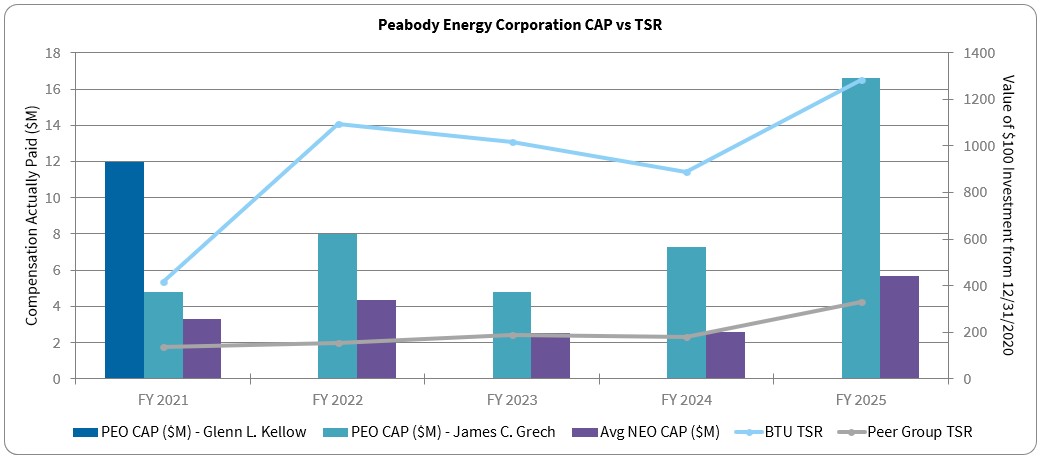
Description of Relationship Between PEO and Non-PEO NEO Compensation Actually Paid and Total Shareholder Return (“TSR”)
The following chart sets forth the relationship between Compensation Actually Paid to our PEO, the average of Compensation Actually Paid to our Non-PEO NEOs and the cumulative TSR over the five most recently completed fiscal years for the Company and the Peer Group TSR.
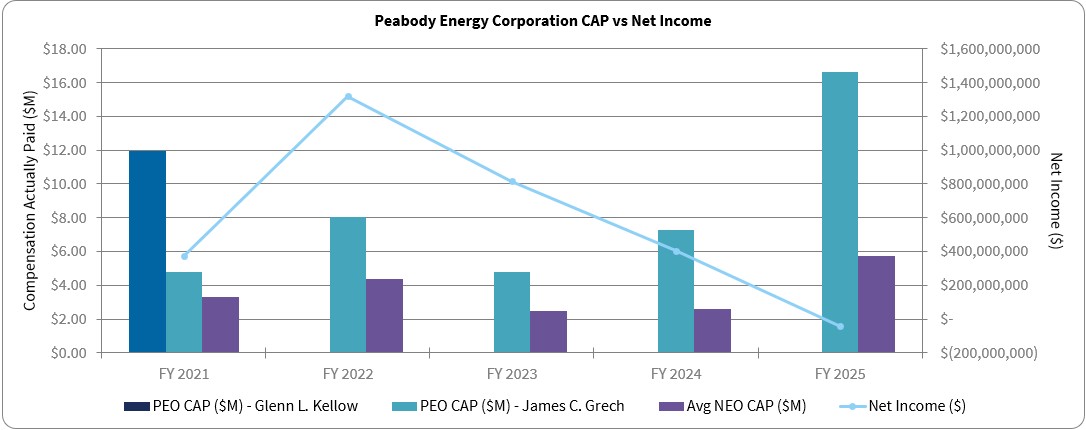
Description of Relationship Between PEO and Non-PEO NEO Compensation Actually Paid and Net Income
The following chart sets forth the relationship between Compensation Actually Paid to our PEOs, the average of Compensation Actually Paid to our Non-PEO NEOs and our net income during the five most recently completed fiscal years.
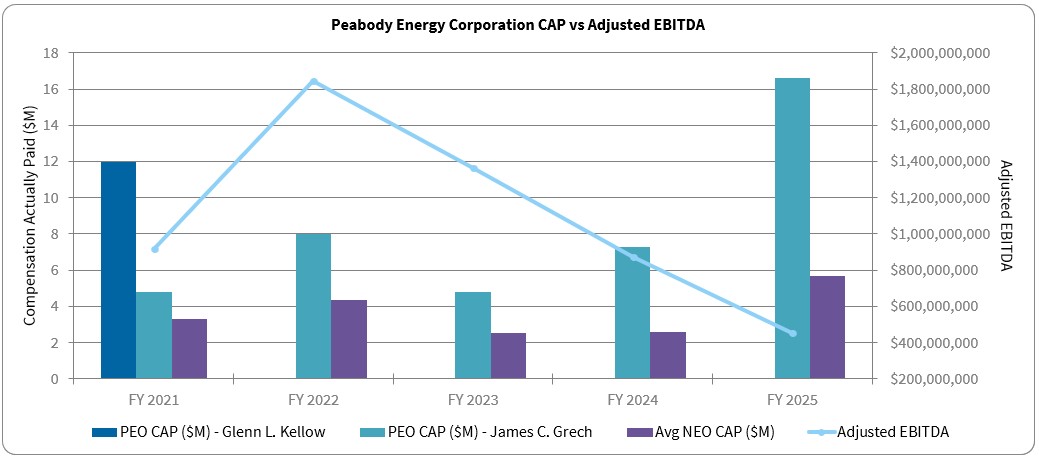
Description of Relationship Between PEO and Non-PEO NEO Compensation Actually Paid and Adjusted EBITDA
The following chart sets forth the relationship between Compensation Actually Paid to our PEOs, the average of Compensation Actually Paid to our Non-PEO NEOs and our Adjusted EBITDA during the five most recently completed fiscal years. This non-GAAP measure is defined and reconciled to the nearest GAAP measure in Appendix B.
Description of Relationship Between PEO and Non-PEO NEO Compensation Actually Paid and Total Shareholder Return (“TSR”)
The following chart sets forth the relationship between Compensation Actually Paid to our PEO, the average of Compensation Actually Paid to our Non-PEO NEOs and the cumulative TSR over the five most recently completed fiscal years for the Company and the Peer Group TSR.
| Free Cash Flow | ||
| Tons Produced | ||
| Environmental Reclamation | ||
| Adjusted EBITDA | ||
Clean Cash Cost Per Ton | ||
| TRIFR | ||
| Safety & Sustainability MS | ||
(2)The amounts shown for Compensation Actually Paid have been calculated in accordance with Item 402(v) of Regulation S-K and do not reflect compensation actually earned, realized, or received by the Company’s NEOs. These amounts reflect the Summary Compensation Table Total with certain adjustments as described in footnote 3 below.