Pay Versus Performance
As required by pay versus performance rules adopted by the SEC (“PVP Rules”), the below Pay Versus Performance table (“PVP Table”) provides information about compensation for this Proxy Statement’s NEOs, as well as NEOs from our 2024, 2023, 2022 and 2021 Proxy Statements (each of 2021, 2022, 2023, 2024 and 2025, a “Covered Year”). The PVP Table also provides information about the results for certain financial performance measures during those same Covered Years. In reviewing this information, there are a few important things to consider:
|
● |
The information in columns (b) and (d) comes directly from this and prior years’ Summary Compensation Tables, without adjustment; |
|
● |
as required by the PVP Rules, we describe the information in columns (c) and (e) as “compensation actually paid” (or “CAP”) to the applicable NEOs, but these CAP amounts do not entirely reflect compensation that our NEOs actually earned for their service in the Covered Years. Instead, CAP reflects a calculation involving a combination of realized pay (primarily for cash amounts) and realizable or accrued pay (primarily for pension benefits and equity awards); and |
|
● |
as required by the PVP Rules, we provide information about our total shareholder return (“TSR”) results, PVP Peer Group (as defined below) TSR results and U.S. GAAP net income results (the “External Measures”) during the Covered Years in the PVP Table, but we did not actually base any compensation decisions for the NEOs on, or link any NEO pay to, these particular External Measures because the External Measures were not metrics used in our incentive plans during the Covered Years. |
Due to the use of the Broadcast Cash Flow (Net of Completed Transactions and Political Revenue) performance measure in our annual incentive plan and our long-term incentive plan, the Company has determined that, pursuant to the PVP Rules, Broadcast Cash Flow (Net of Completed Transactions and Political Revenue) should be designated as the “Company-Selected Measure” because we believe it is the most important financial measure that we used to link 2025 NEO compensation actually paid to our performance.
|
PAY VERSUS PERFORMANCE(1) |
||||||||||||||||||||||||||||||||||||
|
Value of Initial Fixed $100 Investment Based On: |
||||||||||||||||||||||||||||||||||||
|
Year (a) |
Summary Compensation Table (“SCT”) Total for PEO (b)(1) ($) |
Compensation Actually Paid to PEO (c)(2) ($) |
Average Summary Compensation Table Total for Non-PEO NEOs (d)(1) ($) |
Average Compensation Actually Paid to Non-PEO NEOs (e)(2) ($) |
Total Share- holder Return (common stock)(f)(3) ($) |
Total Share- holder Return (Class A common stock) (f)(3) ($) |
Peer Group Total Share- holder Return (g)(3) ($) |
Net Income (Loss) (in millions) (h)(4) ($) |
Broadcast Cash Flow (in millions) (i)(5) ($) |
|||||||||||||||||||||||||||
|
2025 |
11,472,138 | 22,563,500 | 3,623,381 | 5,339,005 | 33.31 | 83.89 | 111.80 | (85 | ) | 725 | ||||||||||||||||||||||||||
|
2024 |
10,942,378 | 6,550,263 | 4,535,651 | 1,564,782 | 20.24 | 49.10 | 83.05 | 375 | 752 | |||||||||||||||||||||||||||
|
2023 |
10,630,526 | 8,114,402 | 4,023,424 | 3,051,022 | 53.84 | 55.16 | 74.95 | (76 | ) | 912 | ||||||||||||||||||||||||||
|
2022 |
7,922,375 | 3,220,846 | 3,916,637 | 1,760,666 | 64.72 | 67.61 | 83.03 | 455 | 1,440 | |||||||||||||||||||||||||||
|
2021 |
11,515,178 | 12,918,823 | 7,196,056 | 7,431,919 | 114.42 | 111.85 | 106.26 | 90 | 813 | |||||||||||||||||||||||||||
|
(1) |
Mr. Howell was our principal executive officer (“PEO”) for the full year for each of 2025, 2024, 2023, 2022 and 2021. For 2025, our non-PEO NEOs were Messrs. LaPlatney, Latek, and Gignac and Ms. Breland. For 2024, our non-PEO NEOs were Messrs. LaPlatney, James C. Ryan, Latek, Gignac and Ms. Breland. For 2023 our non-PEO NEOs were Messrs. LaPlatney, Ryan and Latek and Ms. Breland. For the full year for each of 2022 and 2021 our non-PEO NEOs were Messrs. LaPlatney, Ryan, Latek and Robert L. Smith. |
|
(2) |
In addition, for each of 2025, 2024, 2023, 2022 and 2021 (each, a “Covered Year”), in determining both the compensation “actually paid” to our PEO and the average compensation “actually paid” to our non-PEO NEOs for purposes of this PVP Table, we deducted from or added back to the total amounts of compensation reported in column (b) or column (d) (as applicable) for such Covered Year certain amounts as required by SEC rules, including the following amounts with respect to 2025: |
|
Item and Value Added (Deducted) |
2025 |
|||
|
For Mr. Howell: |
||||
|
- change in actuarial present value of pension benefits |
(30,142 | ) | ||
|
+ service cost of pension benefits |
— | |||
|
+ prior service cost of pension benefits |
— | |||
|
- SCT “Stock Awards” column value |
$ | (6,506,756 | ) | |
|
- SCT “Option Awards” column value |
— | |||
|
+ year-end fair value of outstanding equity awards granted in Covered Year that were outstanding as of Covered Year-end |
$ | 11,186,400 | ||
|
+/- change in fair value (from prior year-end to Covered Year-end) of outstanding equity awards granted in prior years that were outstanding as of Covered Year-end |
$ | 5,836,858 | ||
|
+ vesting date fair value of equity awards granted and vested in Covered Year |
— | |||
|
+/- change in fair value (from prior year-end to vesting date) of prior-year equity awards vested in Covered Year |
$ | (70,980 | ) | |
|
- prior year-end fair value of prior year equity awards forfeited in Covered Year |
— | |||
|
+ includable dividends/earnings on equity awards during Covered Year |
$ | 675,983 | ||
|
For Non-PEO NEOs (Average): |
||||
|
- change in actuarial present value of pension benefits |
(1,584 | ) | ||
|
+ service cost of pension benefits |
— | |||
|
+ prior service cost of pension benefits |
— | |||
|
- SCT “Stock Awards” column value |
$ | (1,098,002 | ) | |
|
- SCT “Option Awards” column value |
— | |||
|
+ year-end fair value of outstanding equity awards granted in Covered Year that were outstanding as of Covered Year-end |
$ | 1,296,177 | ||
|
+/- change in fair value (from prior year-end to Covered Year-end) of outstanding equity awards granted in prior years that were outstanding as of Covered Year-end |
$ | 640,340 | ||
|
+ vesting date fair value of equity awards granted and vested in Covered Year |
— | |||
|
+/- change in fair value (from prior year-end to vesting date) of prior-year equity awards vested in Covered Year |
$ | 673,384 | ||
|
- prior year-end fair value of prior year equity awards forfeited in Covered Year |
— | |||
|
+ includable dividends/earnings on equity awards during Covered Year |
$ | 205,309 | ||
|
(3) |
For each Covered Year, our TSR and the PVP Peer Group TSR was calculated based on the cumulative total shareholder return on the applicable stock, based on a deemed fixed investment of $100 at market close on December 31, 2020. For purposes of this pay versus performance disclosure, our PVP peer group is the New York Stock Exchange Television Broadcasting Stations Index (the “PVP Peer Group”). Because Covered Years are presented in the table in reverse chronological order (from top to bottom), the table should be read from bottom to top for purposes of understanding cumulative returns over time. |
|
(4) |
Net income (loss) is calculated in accordance with GAAP. |
|
(5) |
Broadcast cash flow (net of completed transactions and political revenue) is calculated as net income adjusted for loss on early extinguishment of debt, non-cash corporate and administrative expenses, non-cash stock-based compensation, depreciation and amortization (including amortization of intangible assets and program broadcast rights), any loss on disposal of assets, any miscellaneous expense, interest expense, any income tax expense and non-cash 401(k) expense, less any gain on disposal of assets, any miscellaneous income and payments for program broadcast rights. |
|
Item and Value Added (Deducted) |
2025 |
|||
|
For Mr. Howell: |
||||
|
- change in actuarial present value of pension benefits |
(30,142 | ) | ||
|
+ service cost of pension benefits |
— | |||
|
+ prior service cost of pension benefits |
— | |||
|
- SCT “Stock Awards” column value |
$ | (6,506,756 | ) | |
|
- SCT “Option Awards” column value |
— | |||
|
+ year-end fair value of outstanding equity awards granted in Covered Year that were outstanding as of Covered Year-end |
$ | 11,186,400 | ||
|
+/- change in fair value (from prior year-end to Covered Year-end) of outstanding equity awards granted in prior years that were outstanding as of Covered Year-end |
$ | 5,836,858 | ||
|
+ vesting date fair value of equity awards granted and vested in Covered Year |
— | |||
|
+/- change in fair value (from prior year-end to vesting date) of prior-year equity awards vested in Covered Year |
$ | (70,980 | ) | |
|
- prior year-end fair value of prior year equity awards forfeited in Covered Year |
— | |||
|
+ includable dividends/earnings on equity awards during Covered Year |
$ | 675,983 | ||
|
For Non-PEO NEOs (Average): |
||||
|
- change in actuarial present value of pension benefits |
(1,584 | ) | ||
|
+ service cost of pension benefits |
— | |||
|
+ prior service cost of pension benefits |
— | |||
|
- SCT “Stock Awards” column value |
$ | (1,098,002 | ) | |
|
- SCT “Option Awards” column value |
— | |||
|
+ year-end fair value of outstanding equity awards granted in Covered Year that were outstanding as of Covered Year-end |
$ | 1,296,177 | ||
|
+/- change in fair value (from prior year-end to Covered Year-end) of outstanding equity awards granted in prior years that were outstanding as of Covered Year-end |
$ | 640,340 | ||
|
+ vesting date fair value of equity awards granted and vested in Covered Year |
— | |||
|
+/- change in fair value (from prior year-end to vesting date) of prior-year equity awards vested in Covered Year |
$ | 673,384 | ||
|
- prior year-end fair value of prior year equity awards forfeited in Covered Year |
— | |||
|
+ includable dividends/earnings on equity awards during Covered Year |
$ | 205,309 | ||
|
(3) |
For each Covered Year, our TSR and the PVP Peer Group TSR was calculated based on the cumulative total shareholder return on the applicable stock, based on a deemed fixed investment of $100 at market close on December 31, 2020. For purposes of this pay versus performance disclosure, our PVP peer group is the New York Stock Exchange Television Broadcasting Stations Index (the “PVP Peer Group”). Because Covered Years are presented in the table in reverse chronological order (from top to bottom), the table should be read from bottom to top for purposes of understanding cumulative returns over time. |
|
(4) |
Net income (loss) is calculated in accordance with GAAP. |
|
(5) |
Broadcast cash flow (net of completed transactions and political revenue) is calculated as net income adjusted for loss on early extinguishment of debt, non-cash corporate and administrative expenses, non-cash stock-based compensation, depreciation and amortization (including amortization of intangible assets and program broadcast rights), any loss on disposal of assets, any miscellaneous expense, interest expense, any income tax expense and non-cash 401(k) expense, less any gain on disposal of assets, any miscellaneous income and payments for program broadcast rights. |
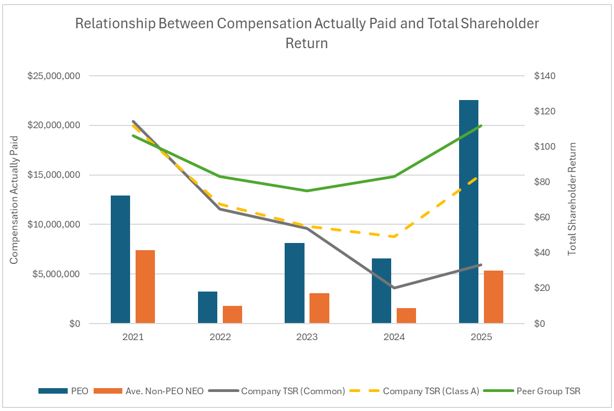
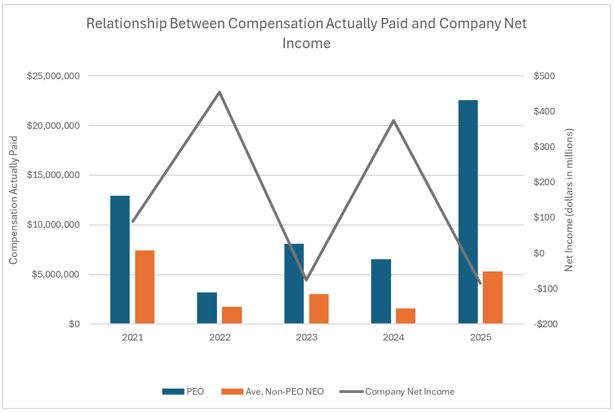
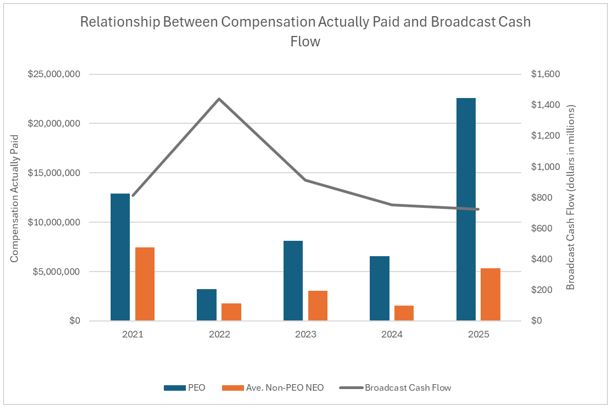
The following charts provide, across the Covered Years, (1) a comparison between our cumulative TSR and the cumulative TSR of the PVP Peer Group, and (2) illustrations of the relationships between (A) the CAP to the PEO and the average of the CAP to our non-PEO NEOs (in each case as set forth in the PVP Table above) and (B) each of the performance measures set forth in columns (f), (h) and (i) of the PVP Table above.
Tabular List
The following table lists the three financial performance measures that we believe represent the most important financial performance measures we used to link compensation actually paid to our NEOs for fiscal 2025 to our performance:
|
Broadcast Cash Flow (Net of Completed Transactions and Political Revenue) |
|
Revenues (Net of Political + Acquired Stations) |
|
Revenues (Political + Acquired Stations) |