Pay vs Performance Disclosure - USD ($)
Dec. 31, 2025
Dec. 31, 2024
Dec. 31, 2023
Dec. 31, 2022
Dec. 31, 2021
Pay Versus Performance
In accordance with rules adopted by the Securities and Exchange Commission pursuant to the Dodd-Frank Wall Street Reform and Consumer Protection Act of 2010, and Item 402(v) of Regulation philosophy and how the Company aligns executive compensation with the Company’s performance, refer to Executive Compensation – Compensation Discussion and Analysis. The Compensation and Talent Management Committee did not consider the pay versus performance disclosure below in making its pay decisions for any of the years shown. For a reconciliation of
S-K,
we provide the following disclosure regarding executive compensation and Company performance for the years listed below. For further information concerning the Company’s variable pay-for-performance
non-GAAP
financial measures to the comparable GAAP measures, see pages 27 to 30 of the Company’s Annual Report on Form 10-K
for the year ended December 31, 2025. Year |
Summary Compensation Table Total for PEO Blanco (1) |
Compensation Actually Paid to PEO Blanco (2)(3) |
Summary Compensation Table Total for PEO Vartanian (1) |
Compensation Actually Paid to PEO Vartanian (2)(3) |
Average Summary Compensation Table Total for Non-PEO NEOs (1) |
Average Compensation Actually Paid to Non-PEO NEOs (2)(3) |
Value of Initial Fixed $100 Investment Based on: (4) |
Net Income ($MM) |
Company Selected Measure - Sales Revenue ($MM) (5) |
|||||||||||||||||||||||||||||||||||
Total Shareholder Return |
Peer Group Total Shareholder Return |
|||||||||||||||||||||||||||||||||||||||||||
2025 |
$6,430,363 | $5,630,654 | |
|
|
|
|
|
$1,397,518 | $ 434,597 | |
|
|
$113.87 | $191.48 | $278.9 | $1,874.8 | |||||||||||||||||||||||||||
2024 |
$4,242,990 | $3,218,826 | $ 6,283,354 | $ 3,275,322 | $1,729,637 | $1,209,721 | |
|
|
$116.36 | $169.56 | $285.0 | $1,808.1 | |||||||||||||||||||||||||||||||
2023 |
|
|
|
|
|
|
$10,008,650 | $19,833,362 | $2,356,648 | $3,683,003 | |
|
|
$117.21 | $149.41 | $ 58.6 | $1,787.6 | |||||||||||||||||||||||||||
2022 |
|
|
|
|
|
|
$ 6,168,869 | $ 9,224,256 | $1,360,803 | $1,079,894 | |
|
|
$98.91 | $113.68 | $179.6 | $1,528.0 | |||||||||||||||||||||||||||
2021 |
|
|
|
|
|
|
$ 6,794,020 | $ 7,535,588 | $1,560,785 | $1,795,350 | |
|
|
$102.15 | $128.45 | $ 21.3 | $1,400.2 | |||||||||||||||||||||||||||
Equity values are calculated in accordance with FASB ASC Topic 718. The following types of equity award adjustments were not applicable to Company equity awards, as such events did not occur: (i) adjustments for awards that are granted and vest in the same covered year, and (ii) adjustments for the dollar value of any dividends or other earnings paid on stock awards in the covered year prior to the vesting date that are not otherwise included in the total compensation for the covered year. There were no adjustments required for prior pension service cost (which is calculated as the entire cost of benefits granted (or credit for benefits reduced) in a plan amendment (or initiation) during the covered year that are attributed by the benefit formula to services rendered in periods prior to the amendment).
| 1 | The amounts reflect the Summary Compensation Table total compensation figures for Steven C. Blanco, our principal executive officer (“PEO”), beginning on May 10, 2024 and for Nishan J. Vartanian, our PEO for each of the years listed until May 10, 2024. The Non-PEO NEOs for whom the Summary Compensation Table total average compensation is presented are: for 2025, Julie A. Beck, Stephanie L. Sciullo, David J. Howells, Richard W. Roda, Elyse L. Brody, and Lee B. McChesney; for 2024, Lee B. McChesney, Stephanie L. Sciullo, David J. Howells, Richard W. Roda, and Bob W. Leenen; for 2023, Lee B. McChesney, Steven C. Blanco, Bob W. Leenen and Stephanie L. Sciullo; for 2022, Lee B. McChesney, Jonathan D. Buck, Kenneth D. Krause, Steven C. Blanco, Bob W. Leenen and Stephanie L. Sciullo; and for 2021, Kenneth D. Krause, Steven C. Blanco, Bob W. Leenen and Stephanie L. Sciullo. |
| 2 | The amounts shown for Compensation Actually Paid to our PEO and Average Compensation Actually Paid to Non-PEO NEOs have been calculated in accordance with Item 402(v) of Regulation S-K and do not reflect compensation actually realized or received by such persons. These amounts reflect total compensation as set forth in the Summary Compensation Table above for each year, adjusted as described in footnote 3 below. |
| 3 | Compensation Actually Paid reflects the exclusions and inclusions from the Summary Compensation Table total for our PEO and Non-PEO NEOs as set forth below. Amounts excluded, which are set forth in the “Exclusion of Stock Awards, Forfeited Awards and Change in Pension Value” columns in each of the PEO Compensation Actually Paid and the Non-PEO NEOs Compensation Actually Paid tables below in this footnote (3), are the aggregate of the amounts shown in the “Stock Awards” and “Change in Pension Value” columns from the Summary Compensation Table. Amounts included, which are set forth in the “Inclusion of Equity Award Adjustments and Pension Service Cost” columns in each of such tables below in this footnote (3), are the aggregate of the following components: |
| i. | Add the fair value as of the end of the year of unvested equity awards granted in that year; |
| ii. | Add the change in fair value (if positive, or subtract if negative) as of the end of the year (from the end of the prior year) of equity awards granted in prior years that remained outstanding and unvested at the end of the year; |
| iii. | Add the change in fair value (if positive, or subtract if negative) as of the vesting date during the year (from the end of the prior year) of equity awards granted in prior years that vested during that year; |
| iv. | Subtract the fair value at the end of the prior year for awards granted in prior years that forfeited or failed to meet applicable vesting conditions during the covered year; and |
| v. | Add the pension service cost (which is calculated as the actuarial present value of each NEO’s benefit under all plans reported in the “Changes to Pension Value” in the Summary Compensation Table, attributable to services rendered during the covered year). |
PEO Compensation Actually Paid
Year |
Summary Compensation Table Total for PEO |
Exclusion of Stock Awards and Change in Pension Value |
Inclusion of Equity Award Adjustments and Pension Service Costs(a) |
Compensation Actually Paid to PEO |
||||||||||||
| |
|
|
|
Blanco |
|
|
|
|
|
| ||||||
2025 |
$ 6,430,363 | $4,611,362 | $ 3,811,653 | $ 5,630,654 | ||||||||||||
2024 |
$ 4,242,990 | $2,705,195 | $ 1,681,031 | $ 3,218,826 | ||||||||||||
| |
|
|
|
Vartanian |
|
|
|
|
|
| ||||||
2024 |
$ 6,283,354 | $3,349,724 | $ 341,692 | $ 3,275,322 | ||||||||||||
2023 |
$10,008,650 | $6,690,112 | $16,514,824 | $19,833,362 | ||||||||||||
2022 |
$ 6,168,869 | $3,919,131 | $ 6,974,518 | $ 9,224,256 | ||||||||||||
2021 |
$ 6,794,020 | $4,870,016 | $ 5,611,584 | $ 7,535,588 | ||||||||||||
| (a) | The components of the amounts shown in this column for our PEO are set forth in the table below: |
PEO Components of Compensation Actually Paid
| |
Year |
Fair Value of Awards Granted in Applicable Year, at Year End |
Change in Value* of Prior Years’ Awards Unvested in Applicable Year, at Year End |
Change in Value* of Prior Years’ Awards that Vested in Applicable Year, at Vesting Date |
Total Value as of the End of the Prior Year of Forfeited Awards in Applicable Year |
Total Equity Award Adjustments (total of prior four columns) |
Pension Service Costs |
Total Equity Award Adjustments and Pension Service Costs |
||||||||||||||||||||||||||||||||||||||||||||||||||||
RSUs |
PSUs |
RSUs |
PSUs |
RSUs |
PSUs |
RSUs |
PSUs |
|||||||||||||||||||||||||||||||||||||||||||||||||||||
| |
Blanco |
|||||||||||||||||||||||||||||||||||||||||||||||||||||||||||
| |
2025 |
|
$ | 822,319 | $ | 3,046,422 | |
|
|
$(31,151) | $ (106,898) | |
|
|
$ (8,612) | $ (75,755) | |
|
|
$— | $— | $ 3,646,324 | $165,329 | $ | 3,811,653 | |||||||||||||||||||||||||||||||||||
| |
2024 |
|
$ | 448,739 | $ | 2,435,765 | |
|
|
$(12,035) | $(1,409,073) | |
|
|
$ 13,467 | $ 93,759 | |
|
|
$— | $— | $ 1,570,623 | $110,408 | $ | 1,681,031 | |||||||||||||||||||||||||||||||||||
| |
Vartanian |
|||||||||||||||||||||||||||||||||||||||||||||||||||||||||||
| |
2024 |
|
$ | — | $ | — | |
|
|
$ — | $ (434,964) | |
|
|
$ — | $ 605,764 | |
|
|
$— | $— | $ 170,800 | $170,892 | $ | 341,692 | |||||||||||||||||||||||||||||||||||
| |
2023 |
|
$ | — | $ | 11,399,062 | |
|
|
$ — | $ 5,154,764 | |
|
|
$ — | $(164,194) | |
|
|
$— | $— | $16,389,632 | $125,192 | $ | 16,514,824 | |||||||||||||||||||||||||||||||||||
| |
2022 |
|
$ | — | $ | 6,224,623 | |
|
|
$ — | $ 1,023,544 | |
|
|
$(127,202) | $(326,530) | |
|
|
$— | $— | $ 6,794,435 | $180,083 | $ | 6,974,518 | |||||||||||||||||||||||||||||||||||
| |
2021 |
|
$ | — | $ | 4,224,222 | |
|
|
$ 8,947 | $ 991,025 | |
|
|
$ — | $ 176,781 | |
|
|
$— | $— | $ 5,400,976 | $210,608 | $ | 5,611,584 | |||||||||||||||||||||||||||||||||||
| * | The change in value for each award is measured from the value at the end of the prior year. |
Non-PEO
NEOs Compensation Actually Paid Year |
Average Summary Compensation Table Total for Non-PEO NEOs |
Exclusion of Stock Awards and Change in Pension Value |
Inclusion of Equity Award Adjustments and Pension Service Costs(a) |
Average Compensation Actually Paid to Non-PEO NEOs |
||||||||||||
2025 |
$1,397,518 | $743,972 | $ (218,949) | $ 434,597 | ||||||||||||
2024 |
$1,729,637 | $610,693 | $ 90,778 | $1,209,721 | ||||||||||||
2023 |
$2,356,648 | $955,099 | $2,281,454 | $3,683,003 | ||||||||||||
2022 |
$1,360,803 | $720,857 | $ 439,948 | $1,079,894 | ||||||||||||
2021 |
$1,560,785 | $723,667 | $ 958,232 | $1,795,350 | ||||||||||||
| (a) | The components of the amounts shown in this column for our Non-PEO NEOs are set forth in the table below: |
Average of
Non-PEO
NEOs Components of Compensation Actually Paid Year |
Fair Value of Awards Granted in Applicable Year, at Year End |
Change in Value* of Prior Years’ Awards Unvested in Applicable Year, at Year End |
Change in Value* of Prior Years’ Awards that Vested in Applicable Year, at Vesting Date |
Total Value as of the End of the Prior Year of Forfeited Awards in Applicable Year |
Total Equity Award Adjustments (total of prior four columns) |
Pension Service Costs |
Total Equity Award Adjustments and Pension Service Costs |
|||||||||||||||||||||||||||||||||||||||||||||||||||||||
| |
RSUs |
PSUs |
|
RSUs |
PSUs |
|
RSUs |
PSUs |
|
RSUs |
PSUs |
|||||||||||||||||||||||||||||||||||||||||||||||||||
| |
2025 | |
|
|
$ | 178,022 | $ | 229,100 | |
|
|
$ | (5,611 | ) | $ | (16,322 | ) | |
|
|
$ | 4,178 | $ | (10,238 | ) | |
|
|
$ | (124,328 | ) | $ | (485,264 | ) | $ (230,463 | ) | $ | 11,514 | $ | (218,949 | ) | |||||||||||||||||||||
| |
2024 |
|
|
|
$ | 152,475 | $ | 452,559 | |
|
|
$ | (9,815 | ) | $ | (180,709 | ) | |
|
|
$ | 7,783 | $ | 23,503 | |
|
|
$ | (66,992 | ) | $ | (320,213 | ) | $ 58,592 | $ | 32,186 | $ | 90,778 | ||||||||||||||||||||||||
| |
2023 |
|
|
|
$ | 333,524 | $ | 1,410,147 | |
|
|
$ | 85,476 | $ | 420,864 | |
|
|
$ | (4,384 | ) | $ | (11,282 | ) | |
|
|
$ | — | $ | — | $2,234,346 | $ | 47,108 | $ | 2,281,454 | ||||||||||||||||||||||||||
| |
2022 |
|
|
|
$ | 326,590 | $ | 358,040 | |
|
|
$ | (6,523 | ) | $ | 50,007 | |
|
|
$ | (14,545 | ) | $ | (30,849 | ) | |
|
|
$ | (61,567 | ) | $ | (246,302 | ) | $ 374,852 | $ | 65,096 | $ | 439,948 | |||||||||||||||||||||||
| |
2021 |
|
|
|
$ | 130,392 | $ | 556,774 | |
|
|
$ | 3,027 | $ | 110,715 | |
|
|
$ | 13,552 | $ | 48,418 | |
|
|
$ | — | $ | — | $ 862,876 | $ | 95,356 | $ | 958,232 | ||||||||||||||||||||||||||||
| * | The change in value for each award is measured from the value at the end of the prior year. |
| 4 | This column shows TSR and peer group TSR on a cumulative basis for each year of the five-year period from 2021 through 2025. For purposes of this disclosure, the peer group is the S&P Midcap 400 Industrials Market Index. Dollar values assume $100 was invested for the cumulative period from December 31, 2020 through December 31, 2025, in either the Company or the S&P Midcap 400 Industrials Market Index, and reinvestment of the pre-tax value of dividends paid. Historical stock performance is not necessarily indicative of future stock performance. |
| 5 | We determined sales revenue to be the “most important” financial performance measure used to link performance to Compensation Actually Paid to our PEO and Average Compensation Actually Paid to Non-PEO NEOs in 2025, in accordance with Item 402(v) of Regulation S-K. |
Non-PEO
NEOs for whom the Summary Compensation Table total average compensation is presented are: for 2025, Julie A. Beck, Stephanie L. Sciullo, David J. Howells, Richard W. Roda, Elyse L. Brody, and Lee B. McChesney; for 2024, Lee B. McChesney, Stephanie L. Sciullo, David J. Howells, Richard W. Roda, and Bob W. Leenen; for 2023, Lee B. McChesney, Steven C. Blanco, Bob W. Leenen and Stephanie L. Sciullo; for 2022, Lee B. McChesney, Jonathan D. Buck, Kenneth D. Krause, Steven C. Blanco, Bob W. Leenen and Stephanie L. Sciullo; and for 2021, Kenneth D. Krause, Steven C. Blanco, Bob W. Leenen and Stephanie L. Sciullo.
pre-tax
value of dividends paid. Historical stock performance is not necessarily indicative of future stock performance.
PEO Compensation Actually Paid
Year |
Summary Compensation Table Total for PEO |
Exclusion of Stock Awards and Change in Pension Value |
Inclusion of Equity Award Adjustments and Pension Service Costs(a) |
Compensation Actually Paid to PEO |
||||||||||||
| |
|
|
|
Blanco |
|
|
|
|
|
| ||||||
2025 |
$ 6,430,363 | $4,611,362 | $ 3,811,653 | $ 5,630,654 | ||||||||||||
2024 |
$ 4,242,990 | $2,705,195 | $ 1,681,031 | $ 3,218,826 | ||||||||||||
| |
|
|
|
Vartanian |
|
|
|
|
|
| ||||||
2024 |
$ 6,283,354 | $3,349,724 | $ 341,692 | $ 3,275,322 | ||||||||||||
2023 |
$10,008,650 | $6,690,112 | $16,514,824 | $19,833,362 | ||||||||||||
2022 |
$ 6,168,869 | $3,919,131 | $ 6,974,518 | $ 9,224,256 | ||||||||||||
2021 |
$ 6,794,020 | $4,870,016 | $ 5,611,584 | $ 7,535,588 | ||||||||||||
| (a) | The components of the amounts shown in this column for our PEO are set forth in the table below: |
PEO Components of Compensation Actually Paid
| |
Year |
Fair Value of Awards Granted in Applicable Year, at Year End |
Change in Value* of Prior Years’ Awards Unvested in Applicable Year, at Year End |
Change in Value* of Prior Years’ Awards that Vested in Applicable Year, at Vesting Date |
Total Value as of the End of the Prior Year of Forfeited Awards in Applicable Year |
Total Equity Award Adjustments (total of prior four columns) |
Pension Service Costs |
Total Equity Award Adjustments and Pension Service Costs |
||||||||||||||||||||||||||||||||||||||||||||||||||||
RSUs |
PSUs |
RSUs |
PSUs |
RSUs |
PSUs |
RSUs |
PSUs |
|||||||||||||||||||||||||||||||||||||||||||||||||||||
| |
Blanco |
|||||||||||||||||||||||||||||||||||||||||||||||||||||||||||
| |
2025 |
|
$ | 822,319 | $ | 3,046,422 | |
|
|
$(31,151) | $ (106,898) | |
|
|
$ (8,612) | $ (75,755) | |
|
|
$— | $— | $ 3,646,324 | $165,329 | $ | 3,811,653 | |||||||||||||||||||||||||||||||||||
| |
2024 |
|
$ | 448,739 | $ | 2,435,765 | |
|
|
$(12,035) | $(1,409,073) | |
|
|
$ 13,467 | $ 93,759 | |
|
|
$— | $— | $ 1,570,623 | $110,408 | $ | 1,681,031 | |||||||||||||||||||||||||||||||||||
| |
Vartanian |
|||||||||||||||||||||||||||||||||||||||||||||||||||||||||||
| |
2024 |
|
$ | — | $ | — | |
|
|
$ — | $ (434,964) | |
|
|
$ — | $ 605,764 | |
|
|
$— | $— | $ 170,800 | $170,892 | $ | 341,692 | |||||||||||||||||||||||||||||||||||
| |
2023 |
|
$ | — | $ | 11,399,062 | |
|
|
$ — | $ 5,154,764 | |
|
|
$ — | $(164,194) | |
|
|
$— | $— | $16,389,632 | $125,192 | $ | 16,514,824 | |||||||||||||||||||||||||||||||||||
| |
2022 |
|
$ | — | $ | 6,224,623 | |
|
|
$ — | $ 1,023,544 | |
|
|
$(127,202) | $(326,530) | |
|
|
$— | $— | $ 6,794,435 | $180,083 | $ | 6,974,518 | |||||||||||||||||||||||||||||||||||
| |
2021 |
|
$ | — | $ | 4,224,222 | |
|
|
$ 8,947 | $ 991,025 | |
|
|
$ — | $ 176,781 | |
|
|
$— | $— | $ 5,400,976 | $210,608 | $ | 5,611,584 | |||||||||||||||||||||||||||||||||||
| * | The change in value for each award is measured from the value at the end of the prior year. |
Non-PEO
NEOs Compensation Actually Paid Year |
Average Summary Compensation Table Total for Non-PEO NEOs |
Exclusion of Stock Awards and Change in Pension Value |
Inclusion of Equity Award Adjustments and Pension Service Costs(a) |
Average Compensation Actually Paid to Non-PEO NEOs |
||||||||||||
2025 |
$1,397,518 | $743,972 | $ (218,949) | $ 434,597 | ||||||||||||
2024 |
$1,729,637 | $610,693 | $ 90,778 | $1,209,721 | ||||||||||||
2023 |
$2,356,648 | $955,099 | $2,281,454 | $3,683,003 | ||||||||||||
2022 |
$1,360,803 | $720,857 | $ 439,948 | $1,079,894 | ||||||||||||
2021 |
$1,560,785 | $723,667 | $ 958,232 | $1,795,350 | ||||||||||||
| (a) | The components of the amounts shown in this column for our Non-PEO NEOs are set forth in the table below: |
Average of
Non-PEO
NEOs Components of Compensation Actually Paid Year |
Fair Value of Awards Granted in Applicable Year, at Year End |
Change in Value* of Prior Years’ Awards Unvested in Applicable Year, at Year End |
Change in Value* of Prior Years’ Awards that Vested in Applicable Year, at Vesting Date |
Total Value as of the End of the Prior Year of Forfeited Awards in Applicable Year |
Total Equity Award Adjustments (total of prior four columns) |
Pension Service Costs |
Total Equity Award Adjustments and Pension Service Costs |
|||||||||||||||||||||||||||||||||||||||||||||||||||||||
| |
RSUs |
PSUs |
|
RSUs |
PSUs |
|
RSUs |
PSUs |
|
RSUs |
PSUs |
|||||||||||||||||||||||||||||||||||||||||||||||||||
| |
2025 | |
|
|
$ | 178,022 | $ | 229,100 | |
|
|
$ | (5,611 | ) | $ | (16,322 | ) | |
|
|
$ | 4,178 | $ | (10,238 | ) | |
|
|
$ | (124,328 | ) | $ | (485,264 | ) | $ (230,463 | ) | $ | 11,514 | $ | (218,949 | ) | |||||||||||||||||||||
| |
2024 |
|
|
|
$ | 152,475 | $ | 452,559 | |
|
|
$ | (9,815 | ) | $ | (180,709 | ) | |
|
|
$ | 7,783 | $ | 23,503 | |
|
|
$ | (66,992 | ) | $ | (320,213 | ) | $ 58,592 | $ | 32,186 | $ | 90,778 | ||||||||||||||||||||||||
| |
2023 |
|
|
|
$ | 333,524 | $ | 1,410,147 | |
|
|
$ | 85,476 | $ | 420,864 | |
|
|
$ | (4,384 | ) | $ | (11,282 | ) | |
|
|
$ | — | $ | — | $2,234,346 | $ | 47,108 | $ | 2,281,454 | ||||||||||||||||||||||||||
| |
2022 |
|
|
|
$ | 326,590 | $ | 358,040 | |
|
|
$ | (6,523 | ) | $ | 50,007 | |
|
|
$ | (14,545 | ) | $ | (30,849 | ) | |
|
|
$ | (61,567 | ) | $ | (246,302 | ) | $ 374,852 | $ | 65,096 | $ | 439,948 | |||||||||||||||||||||||
| |
2021 |
|
|
|
$ | 130,392 | $ | 556,774 | |
|
|
$ | 3,027 | $ | 110,715 | |
|
|
$ | 13,552 | $ | 48,418 | |
|
|
$ | — | $ | — | $ 862,876 | $ | 95,356 | $ | 958,232 | ||||||||||||||||||||||||||||
| * | The change in value for each award is measured from the value at the end of the prior year. |
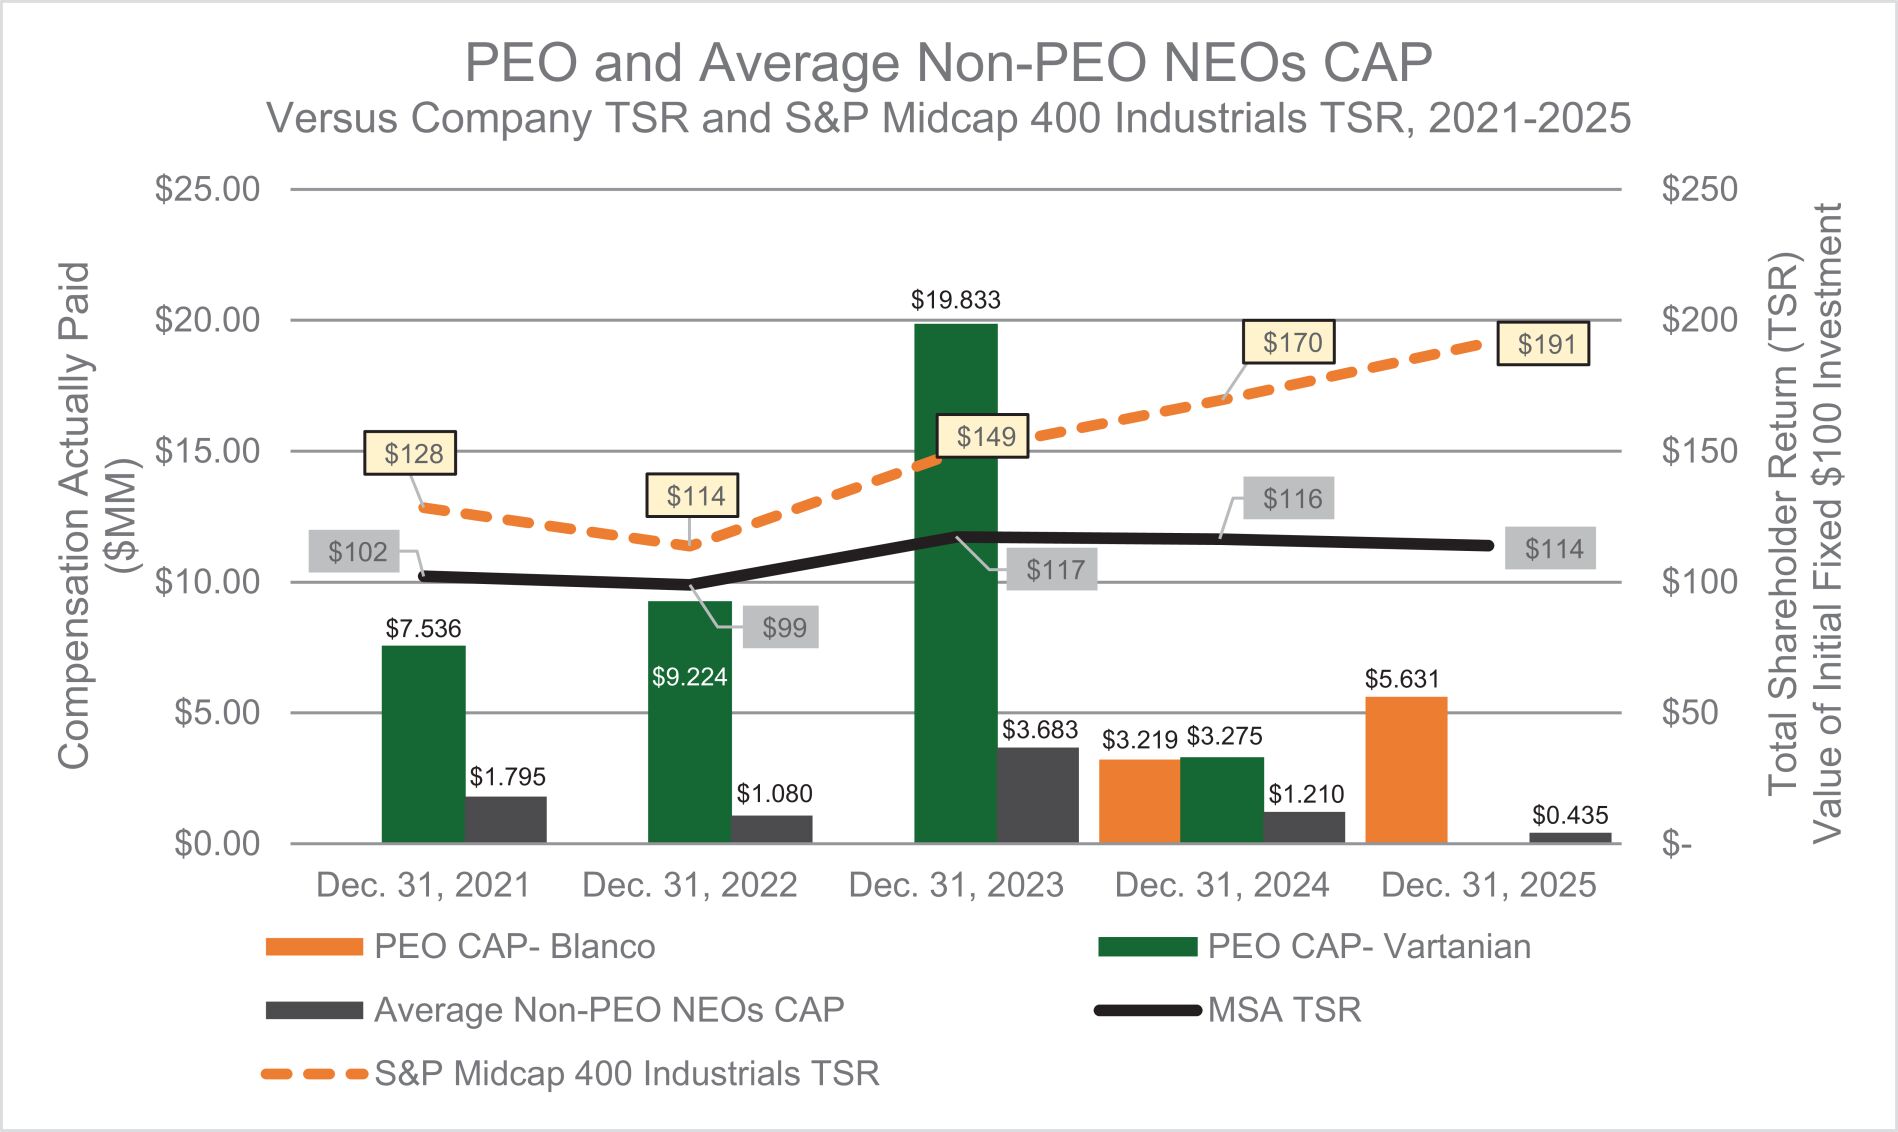
Relationship Among Compensation Actually Paid, Company Cumulative TSR, and Peer Group Cumulative TSR
The following chart sets forth the relationship among Compensation Actually Paid to our PEO, the average Compensation Actually Paid to Non-PEO NEOs, the Company’s cumulative TSR, and the TSR for the S&P Midcap 400 Industrials Market Index (the peer group for purposes of this disclosure) for each year of the five-year period from 2021 through 2025)
Note: In the next three charts, the term “CAP” means Compensation Actually Paid
Relationship Between Compensation Actually Paid and Net Income
The following chart sets forth the relationship between Compensation Actually Paid to our PEO, the average of Compensation Actually Paid to
Non-PEO
NEOs and our net income for each year of the five-year period from 2021 through 2025. 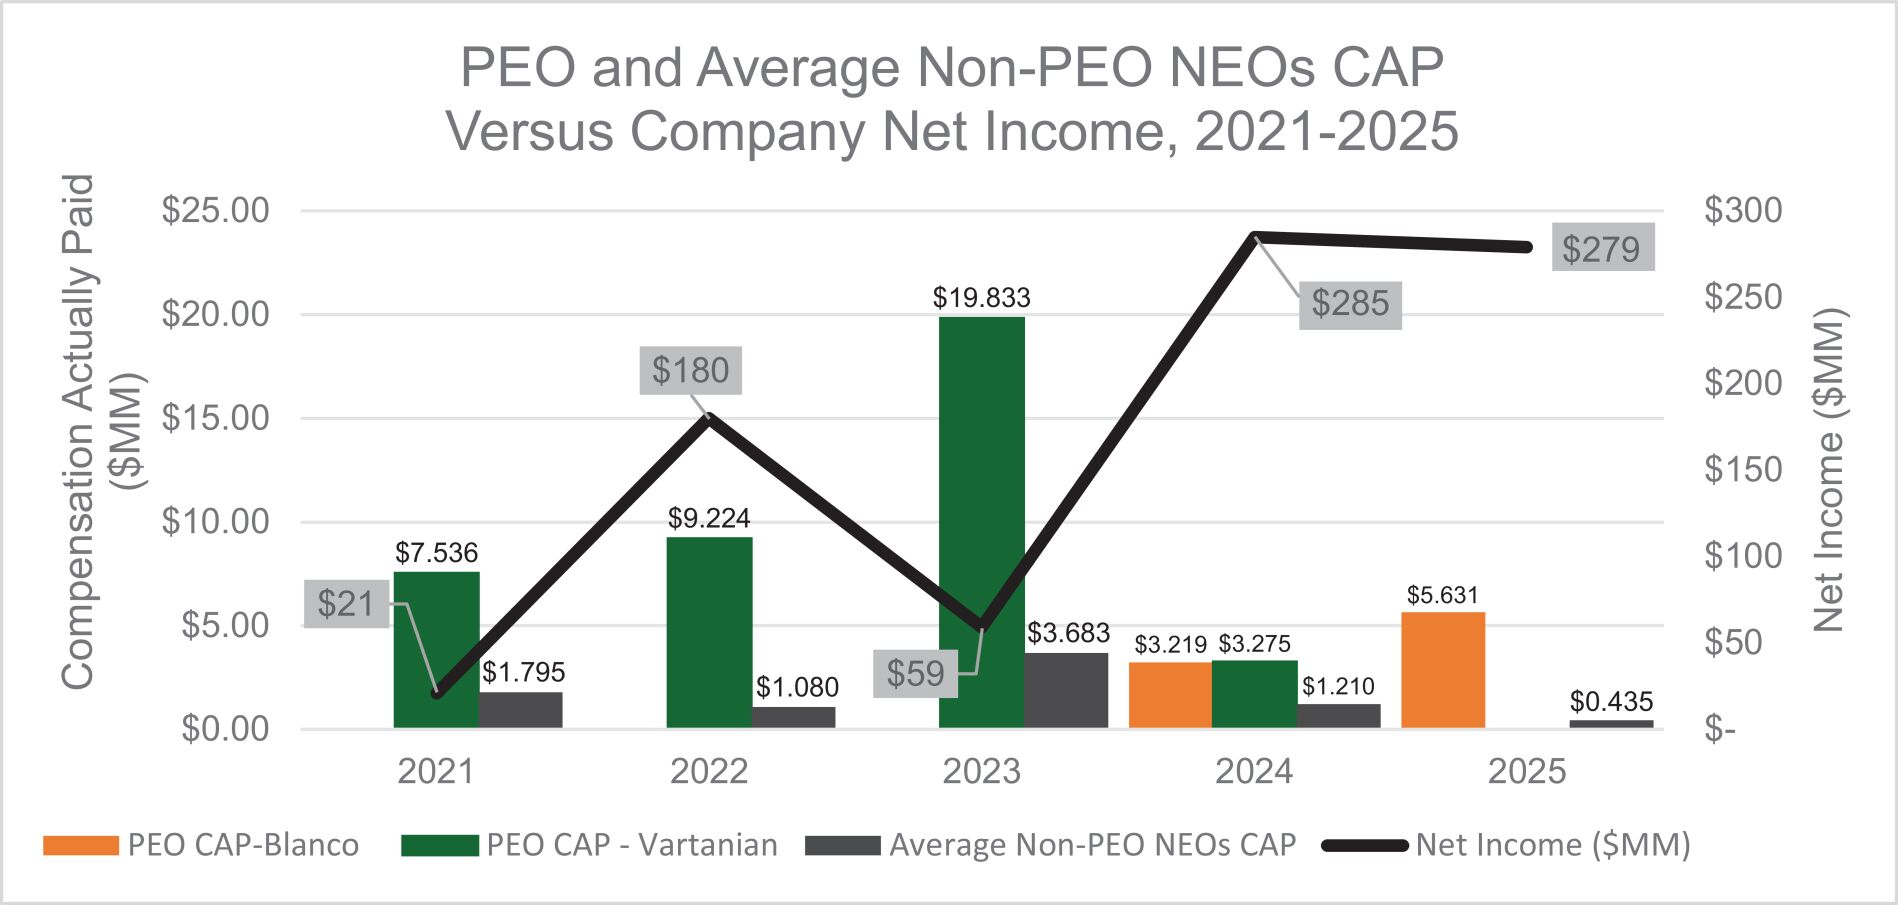
Relationship Between Compensation Actually Paid and Sales Revenue
The following chart sets forth the relationship between Compensation Actually Paid to our PEO, the average of Compensation Actually Paid to
Non-PEO
NEOs and our sales revenue for each year of the five-year period from 2021 through 2025. 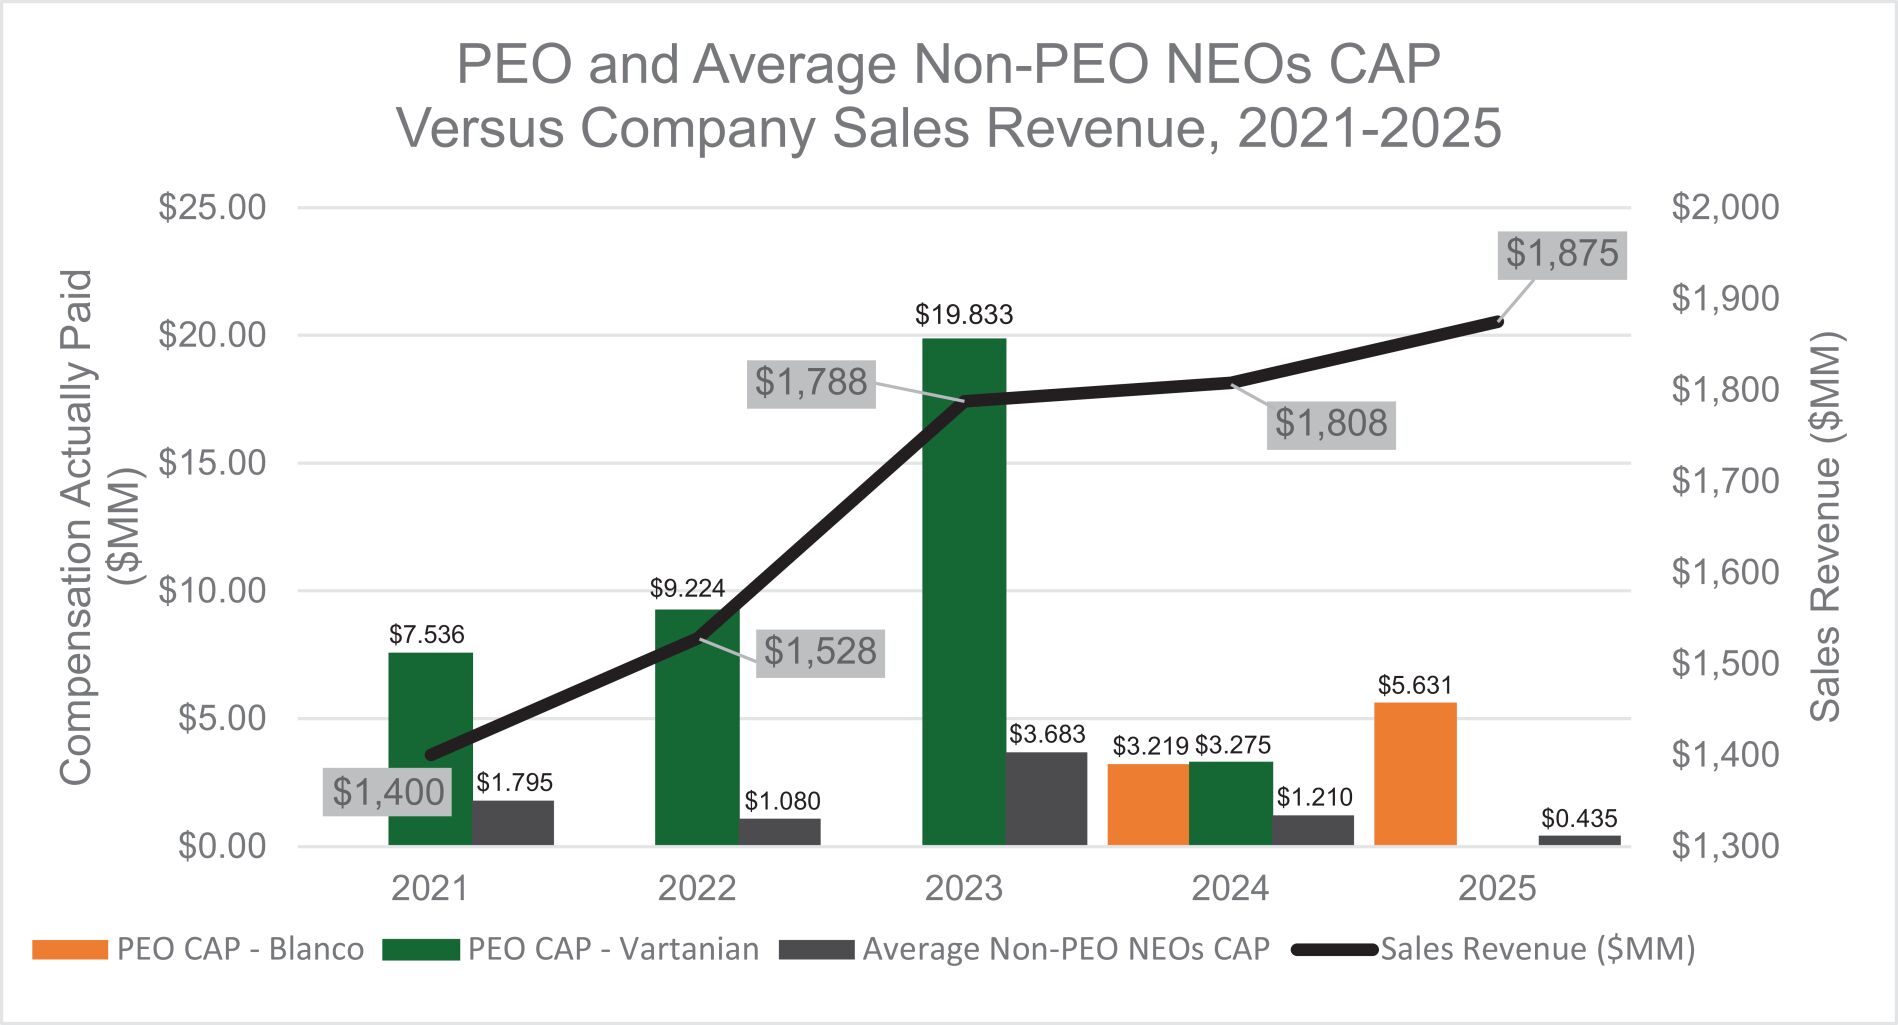
Relationship Among Compensation Actually Paid, Company Cumulative TSR, and Peer Group Cumulative TSR
The following chart sets forth the relationship among Compensation Actually Paid to our PEO, the average Compensation Actually Paid to Non-PEO NEOs, the Company’s cumulative TSR, and the TSR for the S&P Midcap 400 Industrials Market Index (the peer group for purposes of this disclosure) for each year of the five-year period from 2021 through 2025)
Note: In the next three charts, the term “CAP” means Compensation Actually Paid
2025 Tabular List of Most Important Financial Performance Measures
The following table presents the financial performance measures that the Company considers to have been the most important in linking Compensation Actually Paid to our PEO and
Non-PEO
NEOs in 2025 to Company performance. The measures in this table are not ranked. Sales Revenue |
Revenue Growth (3-Year Revenue Compound Annual Growth Rate (CAGR)) |
Adjusted EBITDA Margin |
Working Capital as a Percentage of Sales |
Total Shareholder Return against Proxy Peer Group (as disclosed in the Compensation Discussion and Analysis) |