v3.26.1
Pay vs Performance Disclosure - USD ($)
12 Months Ended
Dec. 31, 2025
Dec. 31, 2024
Dec. 31, 2023
Dec. 31, 2022
Dec. 31, 2021
Pay vs Performance Disclosure          
Pay vs Performance Disclosure, Table

Pay Versus Performance

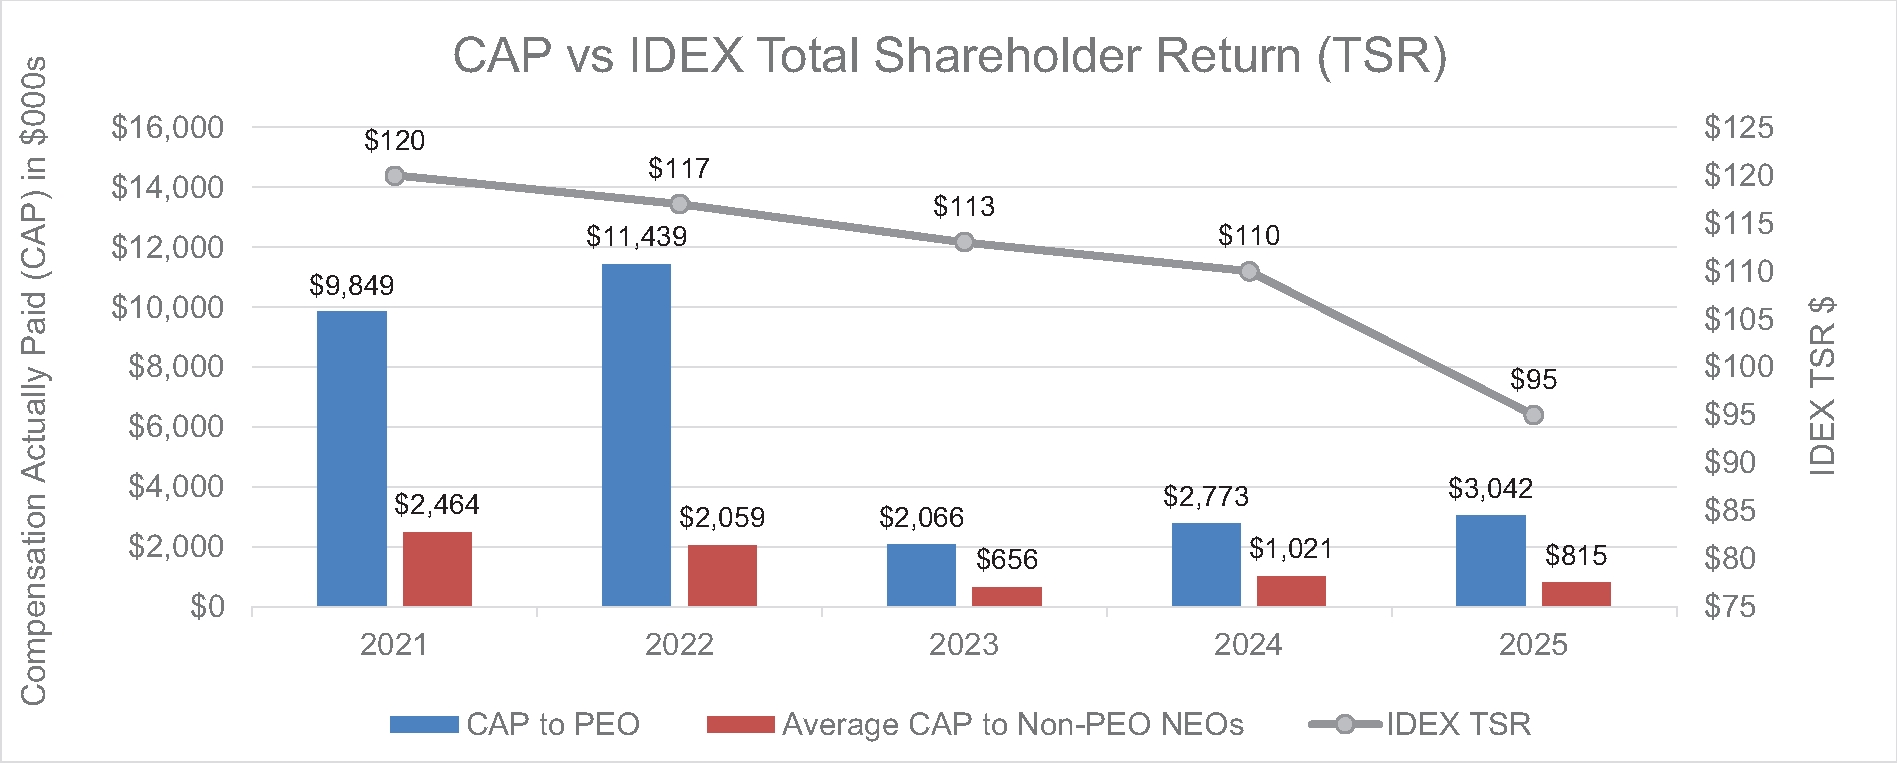
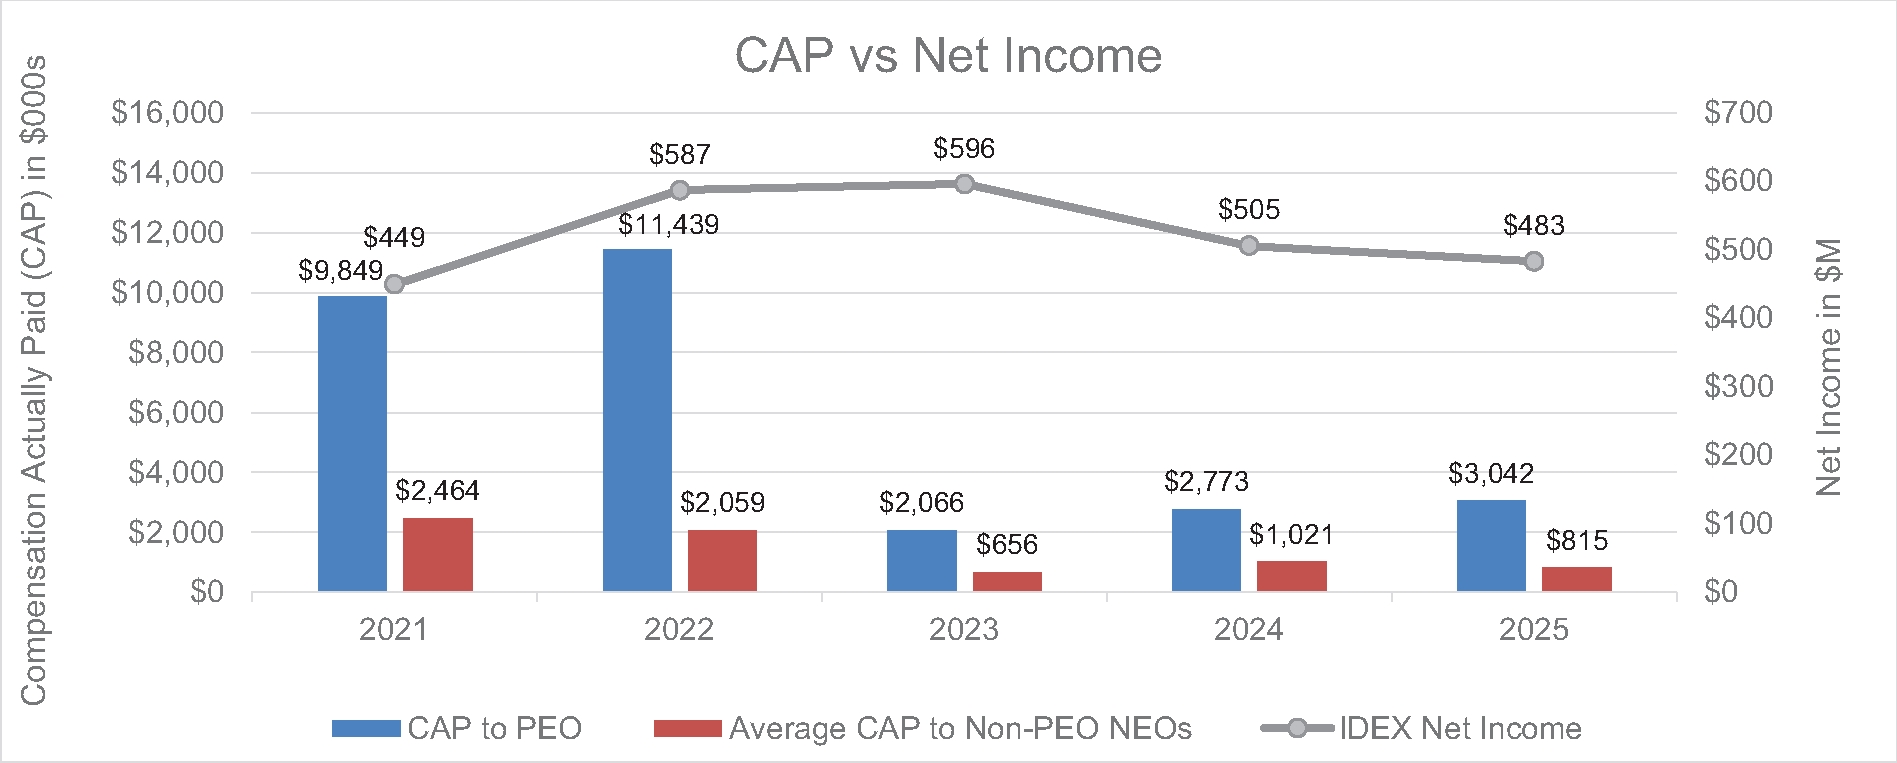
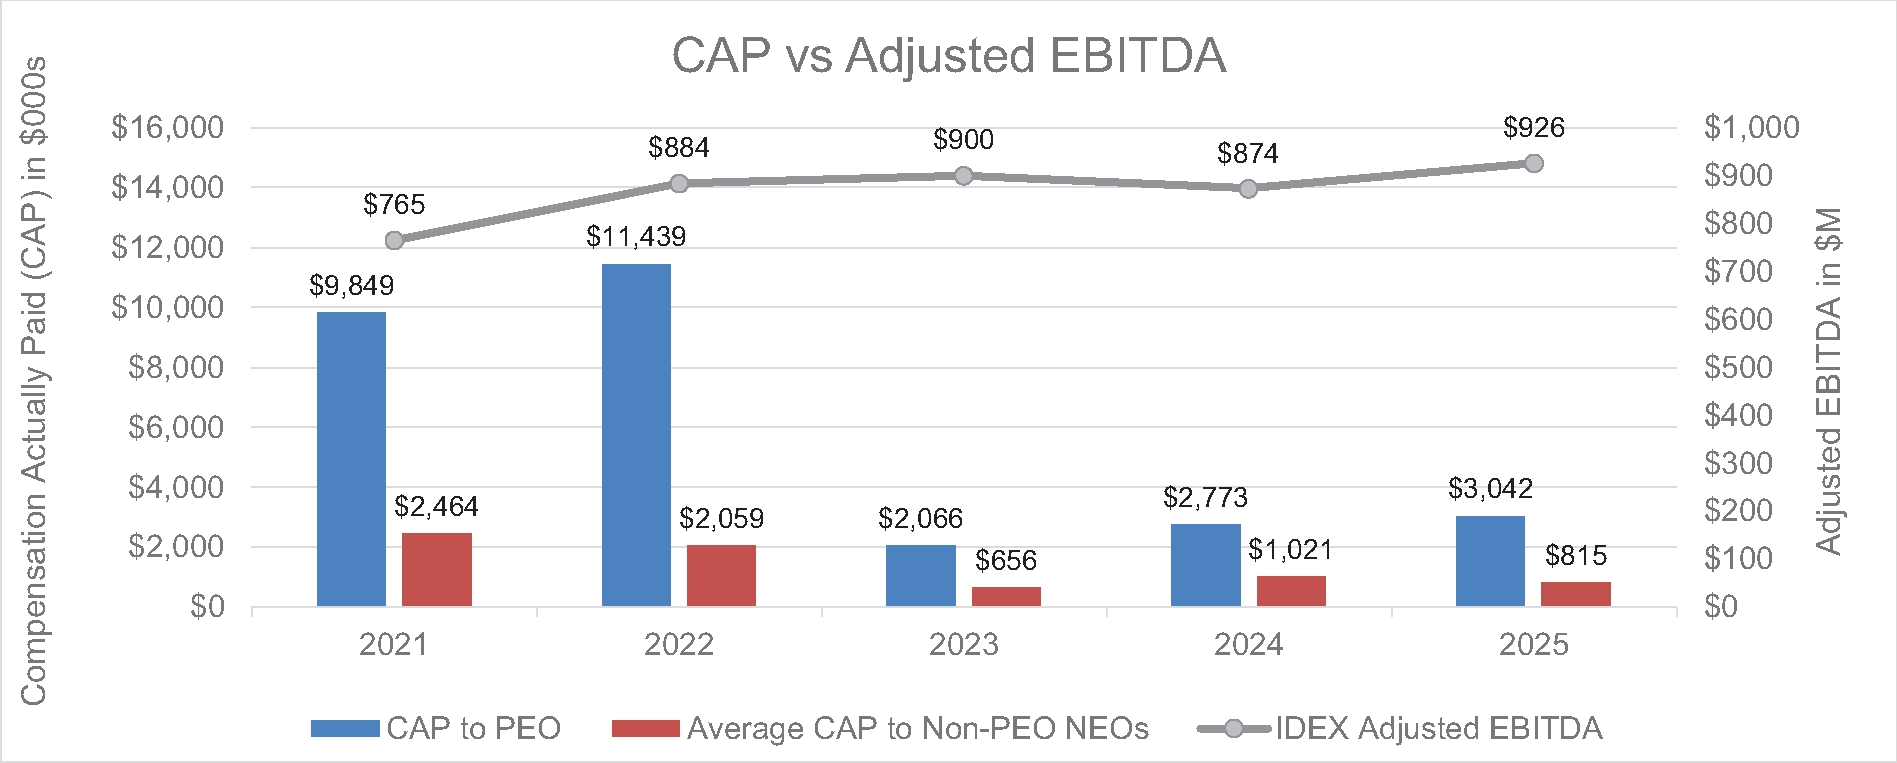
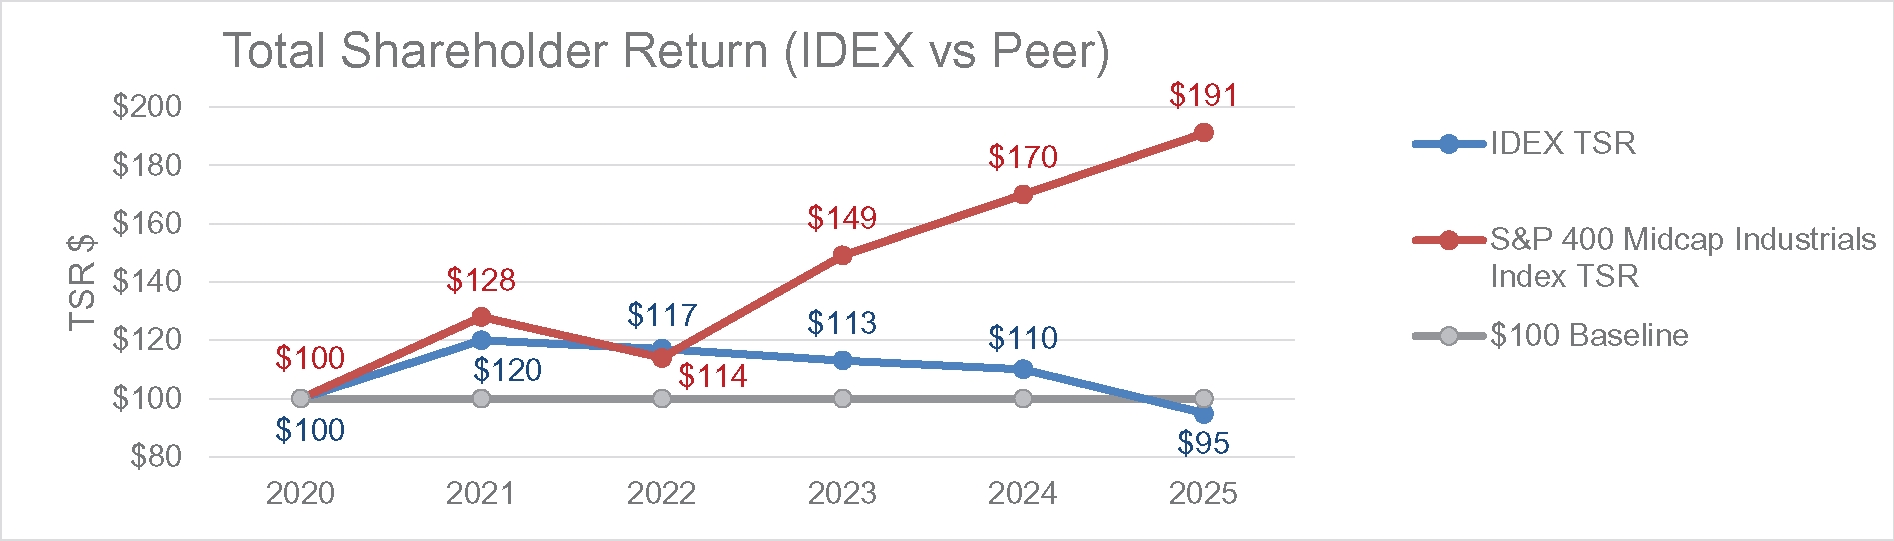
The following table sets forth information regarding the Company’s performance and the “compensation actually paid” to our NEOs, as calculated in accordance with SEC disclosure rules:


Summary
Compensation
Table Total


Compensation
Actually Paid


Average
Summary
Compensation


Average
Compensation


Value of
Initial Fixed
$100
Investment
Based On: (4)


Year
(1)


for Eric D.
Ashleman
(PEO)
($) (2)


to Eric D.
Ashleman
(PEO)
($) (3)


Table Total
for Non-PEO
NEOs
($) (2)


Actually Paid
to Non-PEO
NEOs
($) (3)


TSR
($)


Peer
Group
TSR
($) (5)


Net
Income
($000,000)


Adjusted
EBITDA
($000,000)
(6)


2025


9,112,893


3,042,222


1,561,338


815,480


95


191


483.2


925.9


2024


9,371,468


2,773,408


1,737,650


1,021,356


110


170


505.0


874.3


2023


7,758,876


2,066,071


1,848,761


655,908


113


149


596.1


899.6


2022


7,495,227


11,439,171


2,396,496


2,058,991


117


114


586.9


884.2


2021


6,719,772


9,849,418


1,743,998


2,463,917


120


128


449.4


765.4


(1)
The Principal Executive Officer (PEO) and NEOs for the applicable years were as follows:
2025: Mr Ashleman served as the PEO for the entirety of 2025. The Company's other NEOs for 2025 were: Lisa M. Anderson; Roopa Unnikrishnan; Akhil Mahendra; Abhishek Khandelwal; and Melissa S. Flores.
2024: Mr. Ashleman served as the PEO for the entirety of 2024. The Company’s other NEOs for 2024 were: Abhishek Khandelwal; Lisa M. Anderson; Roopa Unnikrishnan; and Melissa S. Flores.
2023: Mr. Ashleman served as the PEO for the entirety of 2023. The Company’s other NEOs for 2023 were: Abhishek Khandelwal; Lisa M. Anderson; Roopa Unnikrishnan; Melissa S. Flores; Allison S. Lausas; William K. Grogan; and Marc Uleman.
2022: Mr. Ashleman served as the PEO for the entirety of 2022. The Company’s other NEOs for 2022 were: William K. Grogan; Melissa Aquino; Marc Uleman; and Lisa M. Anderson.
2021: Mr. Ashleman served as the PEO for the entirety of 2021. The Company’s other NEOs for 2021 were: William K. Grogan; Denise R. Cade; Melissa S. Flores; Daniel J. Salliotte; and Michael J. Yates.
(2)
Amounts reported in this column represent (i) the total compensation reported in the Summary Compensation Table for the applicable year in which the NEO served as PEO in the case of Mr. Ashleman and (ii) the average of the total compensation reported in the Summary Compensation Table for the applicable year for the Company’s other NEOs reported for the applicable year.
(3)
To calculate the compensation actually paid (“CAP”), adjustments were made to the amounts reported in the Summary Compensation Table for the applicable year. A reconciliation of the adjustments for Mr. Ashleman and for the average of the other NEOs is set forth following the footnotes to this table.
(4)
Pursuant to rules of the SEC, the comparison assumes $100 was invested on December 31, 2020. Historic stock price performance is not necessarily indicative of future stock price performance.
(5)
The TSR Peer Group consists of the S&P 400 Midcap Industrials Sector Index, an independently prepared index (and which is used for the Company’s stock performance chart in the Annual Report on Form 10-K for the year ended December 31, 2025).
(6)
As noted in “Compensation Discussion and Analysis,” the Compensation Committee selected Adjusted EBITDA as a key metric for evaluating and rewarding management’s performance in the 2025 incentive program design. This measure is used to determine the payout of 40% of the 2025 MICP awards. Adjusted EBITDA is a non-GAAP financial measure and is calculated based on the Company’s earnings before interest, taxes, depreciation and amortization, adjusted to exclude the impact of acquisitions and divestitures and actual capital expenditures. A reconciliation from GAAP to non-GAAP financial measures and other related information is included in Item 7 of the Company’s Annual Report on Form 10-K for the year ended December 31, 2025.
       
Company Selected Measure Name Adjusted EBITDA        
Named Executive Officers, Footnote
(1)
The Principal Executive Officer (PEO) and NEOs for the applicable years were as follows:
2025: Mr Ashleman served as the PEO for the entirety of 2025. The Company's other NEOs for 2025 were: Lisa M. Anderson; Roopa Unnikrishnan; Akhil Mahendra; Abhishek Khandelwal; and Melissa S. Flores.
2024: Mr. Ashleman served as the PEO for the entirety of 2024. The Company’s other NEOs for 2024 were: Abhishek Khandelwal; Lisa M. Anderson; Roopa Unnikrishnan; and Melissa S. Flores.
2023: Mr. Ashleman served as the PEO for the entirety of 2023. The Company’s other NEOs for 2023 were: Abhishek Khandelwal; Lisa M. Anderson; Roopa Unnikrishnan; Melissa S. Flores; Allison S. Lausas; William K. Grogan; and Marc Uleman.
2022: Mr. Ashleman served as the PEO for the entirety of 2022. The Company’s other NEOs for 2022 were: William K. Grogan; Melissa Aquino; Marc Uleman; and Lisa M. Anderson.
2021: Mr. Ashleman served as the PEO for the entirety of 2021. The Company’s other NEOs for 2021 were: William K. Grogan; Denise R. Cade; Melissa S. Flores; Daniel J. Salliotte; and Michael J. Yates.
       
Peer Group Issuers, Footnote The TSR Peer Group consists of the S&P 400 Midcap Industrials Sector Index, an independently prepared index (and which is used for the Company’s stock performance chart in the Annual Report on Form 10-K for the year ended December 31, 2025).        
Adjustment To PEO Compensation, Footnote

The following tables sets forth the detailed calculation from SCT Total to Compensation Actually Paid for the PEOs and NEOs:


Eric D. Ashleman

Prior FYE Current FYE


12/31/2020
12/31/2021


12/31/2021
12/31/2022


12/31/2022
12/31/2023


12/31/2023
12/31/2024


12/31/2024
12/31/2025


Fiscal Year


2021


2022


2023


2024


2025


SCT Total


$6,719,772


$7,495,227


$7,758,876


$9,371,468


$9,112,893


-

Grant Date Fair Value of Option Awards and Stock Awards Granted in Fiscal Year


$(4,174,035)


$(4,598,330)


$(5,618,356)


$(7,311,810)


$(6,455,118)


+

Fair Value at Fiscal Year-End of Outstanding and Unvested Option Awards and Stock Awards Granted in Fiscal Year


$6,194,944


$8,424,336


$4,453,992


$4,611,397


$4,811,325


+

Change in Fair Value of Outstanding and Unvested Option Awards and Stock Awards Granted in Prior Fiscal Years


$1,050,803


$865,977


$(4,529,994)


$(4,070,069)


$(4,125,493)


+

Fair Value at Vesting of Option Awards and Stock Awards Granted in Fiscal Year That Vested During Fiscal Year


$0


$0


$0


$0


$0


+

Change in Fair Value as of Vesting Date of Option Awards and Stock Awards Granted in Prior Fiscal Years For Which Applicable Vesting Conditions Were Satisfied During Fiscal Year


$21,243


$(916,830)


$(93,950)


$120,488


$(324,509)


-

Fair Value as of Prior Fiscal Year-End of Option Awards and Stock Awards Granted in Prior Fiscal Years That Failed to Meet Applicable Vesting Conditions During Fiscal Year


$0


$0


$0


$0


$0


+

Value of Dividends Earned on Stock Awards in the Covered Fiscal Year, Prior to Vesting


$36,691


$168,791


$95,503


$51,934


$23,124


Compensation Actually Paid


$9,849,418


$11,439,171


$2,066,071


$2,773,408


$3,042,222


Non-PEO NEOs

Prior FYE


12/31/2020


12/31/2021


12/31/2022


12/31/2023


12/31/2024


Current FYE


12/31/2021


12/31/2022


12/31/2023


12/31/2024


12/31/2025


Fiscal Year


2021


2022


2023


2024


2025


SCT Total


$1,743,998


$2,396,496


$1,848,761


$1,737,650


$1,561,338


-

Grant Date Fair Value of Option Awards and Stock Awards Granted in Fiscal Year


$(727,995)


$(1,537,000)


$(1,045,073)


$(972,368)


$(902,405)


+

Fair Value at Fiscal Year-End of Outstanding and Unvested Option Awards and Stock Awards Granted in Fiscal Year


$1,080,430


$1,212,682


$763,785


$613,175


$696,470


+

Change in Fair Value of Outstanding and Unvested Option Awards and Stock Awards Granted in Prior Fiscal Years


$359,737


$166,194


$(242,297)


$(366,958)


$(483,062)


+

Fair Value at Vesting of Option Awards and Stock Awards Granted in Fiscal Year That Vested During Fiscal Year


$0


$0


$0


$0


$0


+

Change in Fair Value as of Vesting Date of Option Awards and Stock Awards Granted in Prior Fiscal Years For Which Applicable Vesting Conditions Were Satisfied During Fiscal Year


$(2,016)


$(209,489)


$(10,109)


$2,171


$(67,865)


-

Fair Value as of Prior Fiscal Year-End of Option Awards and Stock Awards Granted in Prior Fiscal Years That Failed to Meet Applicable Vesting Conditions During Fiscal Year


$0


$0


$(665,779)


$0


$0


+

Value of Dividends Earned on Stock Awards in the Covered Fiscal Year, Prior to Vesting


$9,763


$30,108


$6,620


$7,686


$11,004


Compensation Actually Paid


$2,463,917


$2,058,991


$655,908


$1,021,356


$815,480


Non-PEO NEO Average Total Compensation Amount $ 1,561,338 $ 1,737,650 $ 1,848,761 $ 2,396,496 $ 1,743,998
Non-PEO NEO Average Compensation Actually Paid Amount $ 815,480 1,021,356 655,908 2,058,991 2,463,917
Adjustment to Non-PEO NEO Compensation Footnote


Non-PEO NEOs

Prior FYE


12/31/2020


12/31/2021


12/31/2022


12/31/2023


12/31/2024


Current FYE


12/31/2021


12/31/2022


12/31/2023


12/31/2024


12/31/2025


Fiscal Year


2021


2022


2023


2024


2025


SCT Total


$1,743,998


$2,396,496


$1,848,761


$1,737,650


$1,561,338


-

Grant Date Fair Value of Option Awards and Stock Awards Granted in Fiscal Year


$(727,995)


$(1,537,000)


$(1,045,073)


$(972,368)


$(902,405)


+

Fair Value at Fiscal Year-End of Outstanding and Unvested Option Awards and Stock Awards Granted in Fiscal Year


$1,080,430


$1,212,682


$763,785


$613,175


$696,470


+

Change in Fair Value of Outstanding and Unvested Option Awards and Stock Awards Granted in Prior Fiscal Years


$359,737


$166,194


$(242,297)


$(366,958)


$(483,062)


+

Fair Value at Vesting of Option Awards and Stock Awards Granted in Fiscal Year That Vested During Fiscal Year


$0


$0


$0


$0


$0


+

Change in Fair Value as of Vesting Date of Option Awards and Stock Awards Granted in Prior Fiscal Years For Which Applicable Vesting Conditions Were Satisfied During Fiscal Year


$(2,016)


$(209,489)


$(10,109)


$2,171


$(67,865)


-

Fair Value as of Prior Fiscal Year-End of Option Awards and Stock Awards Granted in Prior Fiscal Years That Failed to Meet Applicable Vesting Conditions During Fiscal Year


$0


$0


$(665,779)


$0


$0


+

Value of Dividends Earned on Stock Awards in the Covered Fiscal Year, Prior to Vesting


$9,763


$30,108


$6,620


$7,686


$11,004


Compensation Actually Paid


$2,463,917


$2,058,991


$655,908


$1,021,356


$815,480


Compensation Actually Paid vs. Total Shareholder Return

img170445004_17.jpg

       
Compensation Actually Paid vs. Net Income

img170445004_18.jpg

       
Compensation Actually Paid vs. Company Selected Measure

img170445004_19.jpg

       
Total Shareholder Return Vs Peer Group

img170445004_20.jpg

       
Tabular List, Table Tabular List of Financial Performance Measures

The following is a list of financial performance measures, which in our assessment represent the most important financial performance measures used by the Company to link compensation actually paid to the NEOs for 2025. Please see the “Compensation Discussion and Analysis” for a further description of the metrics used in the Company’s executive compensation program.

1.
Total Shareholder Return
2.
Relative TSR percentile ranking as compared to companies in the S&P 500 Index
3.
Adjusted EBITDA
       
Total Shareholder Return Amount $ 95 110 113 117 120
Peer Group Total Shareholder Return Amount 191 170 149 114 128
Net Income (Loss) $ 483,200,000 $ 505,000,000 $ 596,100,000 $ 586,900,000 $ 449,400,000
Company Selected Measure Amount 925,900,000 874,300,000 899,600,000 884,200,000 765,400,000
Measure:: 1          
Pay vs Performance Disclosure          
Name Total Shareholder Return        
Measure:: 2          
Pay vs Performance Disclosure          
Name Relative TSR percentile ranking as compared to companies in the S&P 500 Index        
Measure:: 3          
Pay vs Performance Disclosure          
Name Adjusted EBITDA        
Non-GAAP Measure Description Adjusted EBITDA is a non-GAAP financial measure and is calculated based on the Company’s earnings before interest, taxes, depreciation and amortization, adjusted to exclude the impact of acquisitions and divestitures and actual capital expenditures. A reconciliation from GAAP to non-GAAP financial measures and other related information is included in Item 7 of the Company’s Annual Report on Form 10-K for the year ended December 31, 2025.        
Mr. Ashleman [Member]          
Pay vs Performance Disclosure          
PEO Total Compensation Amount $ 9,112,893 $ 9,371,468 $ 7,758,876 $ 7,495,227 $ 6,719,772
PEO Actually Paid Compensation Amount $ 3,042,222 $ 2,773,408 $ 2,066,071 $ 11,439,171 $ 9,849,418
PEO Name Mr Ashleman Mr. Ashleman Mr. Ashleman Mr. Ashleman Mr. Ashleman
PEO | Mr. Ashleman [Member] | Aggregate Grant Date Fair Value of Equity Award Amounts Reported in Summary Compensation Table          
Pay vs Performance Disclosure          
Adjustment to Compensation, Amount $ (6,455,118) $ (7,311,810) $ (5,618,356) $ (4,598,330) $ (4,174,035)
PEO | Mr. Ashleman [Member] | Year-end Fair Value of Equity Awards Granted in Covered Year that are Outstanding and Unvested          
Pay vs Performance Disclosure          
Adjustment to Compensation, Amount 4,811,325 4,611,397 4,453,992 8,424,336 6,194,944
PEO | Mr. Ashleman [Member] | Year-over-Year Change in Fair Value of Equity Awards Granted in Prior Years That are Outstanding and Unvested          
Pay vs Performance Disclosure          
Adjustment to Compensation, Amount (4,125,493) (4,070,069) (4,529,994) 865,977 1,050,803
PEO | Mr. Ashleman [Member] | Vesting Date Fair Value of Equity Awards Granted and Vested in Covered Year          
Pay vs Performance Disclosure          
Adjustment to Compensation, Amount 0 0 0 0 0
PEO | Mr. Ashleman [Member] | Change in Fair Value as of Vesting Date of Prior Year Equity Awards Vested in Covered Year          
Pay vs Performance Disclosure          
Adjustment to Compensation, Amount (324,509) 120,488 (93,950) (916,830) 21,243
PEO | Mr. Ashleman [Member] | Prior Year End Fair Value of Equity Awards Granted in Any Prior Year that Fail to Meet Applicable Vesting Conditions During Covered Year          
Pay vs Performance Disclosure          
Adjustment to Compensation, Amount 0 0 0 0 0
PEO | Mr. Ashleman [Member] | Dividends or Other Earnings Paid on Equity Awards not Otherwise Reflected in Total Compensation for Covered Year          
Pay vs Performance Disclosure          
Adjustment to Compensation, Amount 23,124 51,934 95,503 168,791 36,691
Non-PEO NEO | Aggregate Grant Date Fair Value of Equity Award Amounts Reported in Summary Compensation Table          
Pay vs Performance Disclosure          
Adjustment to Compensation, Amount (902,405) (972,368) (1,045,073) (1,537,000) (727,995)
Non-PEO NEO | Year-end Fair Value of Equity Awards Granted in Covered Year that are Outstanding and Unvested          
Pay vs Performance Disclosure          
Adjustment to Compensation, Amount 696,470 613,175 763,785 1,212,682 1,080,430
Non-PEO NEO | Year-over-Year Change in Fair Value of Equity Awards Granted in Prior Years That are Outstanding and Unvested          
Pay vs Performance Disclosure          
Adjustment to Compensation, Amount (483,062) (366,958) (242,297) 166,194 359,737
Non-PEO NEO | Vesting Date Fair Value of Equity Awards Granted and Vested in Covered Year          
Pay vs Performance Disclosure          
Adjustment to Compensation, Amount 0 0 0 0 0
Non-PEO NEO | Change in Fair Value as of Vesting Date of Prior Year Equity Awards Vested in Covered Year          
Pay vs Performance Disclosure          
Adjustment to Compensation, Amount (67,865) 2,171 (10,109) (209,489) (2,016)
Non-PEO NEO | Prior Year End Fair Value of Equity Awards Granted in Any Prior Year that Fail to Meet Applicable Vesting Conditions During Covered Year          
Pay vs Performance Disclosure          
Adjustment to Compensation, Amount 0 0 (665,779) 0 0
Non-PEO NEO | Dividends or Other Earnings Paid on Equity Awards not Otherwise Reflected in Total Compensation for Covered Year          
Pay vs Performance Disclosure          
Adjustment to Compensation, Amount $ 11,004 $ 7,686 $ 6,620 $ 30,108 $ 9,763