Pay vs Performance Disclosure - USD ($)
Dec. 31, 2025
Dec. 31, 2024
Dec. 31, 2023
Dec. 31, 2022
Dec. 31, 2021
Pay Versus Performance
As required by Section 953(a) of the Dodd-Frank Act and Item 402(v) of Regulation
S-K
under the Exchange Act, we provide the following disclosure regarding executive “compensation actually paid” (“CAP”), calculated in accordance with the requirements of Item 402(v), and certain Company performance measures for the fiscal years listed below. The Company’s selected performance measure included in the table below is AFFO (as defined in “Executive Compensation—Compensation Discussion and Analysis” above). This disclosure was prepared in accordance with the requirements of Item 402(v) and does not necessarily reflect the value actually realized by our NEOs, how our NEOs’ compensation relates to Company performance, or how the Compensation and Management Development Committee evaluates compensation decisions in light of Company or individual performance. Please refer to “Executive Compensation—Compensation Discussion and Analysis” above for a complete description of how our executive compensation relates to Company performance and how the Committee makes its compensation decisions. The information provided under this Pay Versus Performance section will not be deemed to be incorporated by reference into any filing made by the Company under the Securities Act of 1933, or the Exchange Act, except to the extent the Company specifically incorporates it by reference.
VALUE OF INITIAL FIXED $100 INVESTMENT BASED ON: |
||||||||||||||||||||||||||||||||
Year |
Summary Compensation Table Total ($) (1) |
Compensation Actually Paid to CEO ($) (2) |
Average Summary Compensation Table Total for Non-CEO NEOs (3) |
Average Compensation Actually Paid to Non-CEO NEOs (3)(4) |
Total Shareholder Return (5) |
Peer Group Total Shareholder Return (6) |
Net Income ($ in thousands) (7) |
Adjusted Funds from Operations ($ in thousands) (8) |
||||||||||||||||||||||||
2025 |
$ | 14,096,335 | $ | (577,707 | ) | $ | 4,393,480 | $ | 589,933 | $ | 109.12 | $ | 137.53 | $ | 589,909 | $ | 1,003,372 | |||||||||||||||
2024 |
$ | 10,965,261 | $ | 4,930,209 | $ | 3,393,856 | $ | 2,324,790 | $ | 120.81 | $ | 133.59 | $ | 455,365 | $ | 986,237 | ||||||||||||||||
2023 |
$ | 10,393,322 | $ | 18,548,465 | $ | 2,621,459 | $ | 3,632,265 | $ | 124.71 | $ | 122.84 | $ | 521,028 | $ | 923,365 | ||||||||||||||||
2022 |
$ | 14,166,554 | $ | (3,988,645 | ) | $ | 4,760,868 | $ | (1,648,807 | ) | $ | 104.17 | $ | 108.00 | $ | 384,799 | $ | 865,897 | ||||||||||||||
2021 |
$ | 9,710,445 | $ | 31,935,295 | $ | 3,267,111 | $ | 12,172,142 | $ | 155.58 | $ | 143.06 | $ | 262,776 | $ | 745,561 | ||||||||||||||||
| (1) | Reflects compensation amounts reported in the “Total” column of the Summary Compensation Table for our CEO, Dallas B. Tanner, in each of 2025, 2024, 2023, 2022, and 2021. |
| (2) | CAP to our CEO in each of 2025, 2024, 2023, 2022, and 2021 reflects the respective amounts reported in the “Total” column of the Summary Compensation Table, adjusted as set forth in the table below, as determined in accordance with Item 402(v) of Regulation S-K. The amounts do not reflect the actual amount of compensation earned by or paid to Mr. Tanner during the applicable year.(A) |
2021 |
2022 |
2023 |
2024 |
2025 | |||||||||||||||||||||
CEO |
Dallas B. Tanner |
Dallas B. Tanner |
Dallas B. Tanner |
Dallas B. Tanner |
Dallas B. Tanner |
||||||||||||||||||||
Summary Compensation Table Total Compensation |
$ | 9,710,445 | $ | 14,166,554 | $ | 10,393,322 | $ | 10,965,261 | $ | 14,096,335 | |||||||||||||||
Less: Stock and Option Award Values Reported in Summary Compensation Table for the Covered Year ($) |
(6,500,037 | ) | (12,023,478 | ) | (7,500,031 | ) | (8,025,030 | ) | (10,965,046 | ) | |||||||||||||||
Plus: Fair Value of Stock and Option Awards Granted in the Covered Year that Remain Unvested as of Covered Year End ($) |
14,797,038 | 6,849,983 | 9,108,057 | 5,750,923 | 6,706,917 | ||||||||||||||||||||
Change in Fair Value of Outstanding Unvested Stock and Option Awards Granted in a Prior Year ($) |
13,927,849 | (12,981,704 | ) | 6,547,117 | (3,760,945 | ) | (10,415,913 | ) | |||||||||||||||||
Less: Fair Value of Stock and Option Awards Forfeited During the Covered Year |
— | — | — | — | — | ||||||||||||||||||||
Compensation Actually Paid ($) |
$ |
31,935,295 |
$ |
(3,988,645 |
) |
$ |
18,548,465 |
$ |
4,930,209 |
$ |
(577,707 |
) | |||||||||||||
| (A) | The fair values of unvested and outstanding equity awards to our NEOs were remeasured as of the end of each fiscal year and as of each vesting date during the 2025, 2024, 2023, 2022, and 2021 fiscal years, respectively. Fair values as of each fiscal year end measurement date were determined using valuation assumptions and methodologies (including volatility and risk-free interest rates) that are generally consistent with those used to estimate fair value at grant date in accordance with FASB ASC Topic 718. For awards with a market vesting condition (including the impact of the TSR Modifier), fair values incorporate the results of a Monte Carlo simulation model, using assumptions and methodologies that are consistent with those used at grant date. The fair values of performance-based awards reflect the probable outcome of the performance vesting conditions as of each measurement date. |
In 2025, unvested 2022 OP Units have a total value of $0 because no book up event has occurred. |
| (3) | Represents the average of the amounts reported for the Company’s non-CEO NEOs as a group in the “Total” column of the Summary Compensation Table in each applicable year. The following NEOS are included in the average calculation for 2025: Messrs. Olsen; Lobner; Eisen; Solls; and Young. The following NEOs are included in the average calculation for 2024: Messrs. Olsen; Young; Eisen; and Solls. The following NEOs are included in the average calculation for 2023: Messrs. Olsen; Freedman; Young; Eisen; and Solls. The following NEOs are included in the average calculation for each of 2022 and 2021: Messrs. Freedman; Young; and Solls. |
| (4) | Average CAP to our non-CEO NEOs, as a group, in each of 2025, 2024, 2023, 2022, and 2021, reflects the respective amounts reported in the “Total” column of the Summary Compensation Table, adjusted as set forth in the table below, as determined in accordance with Item 402(v) of Regulation S-K. The amounts do not reflect the actual average amount of compensation earned by or paid to the non-CEO NEOs as a group during the applicable year.(A) |
In 2025, the
non-CEO
NEO group changed as follows: | (a) | Mr. Lobner’s salary and annual incentive award amounts reflect his promotion to Executive Vice President, Chief Operating Officer effective March 1, 2025 |
| (b) | Mr. Young’s salary was calculated based on days of service in 2025, inclusive of payout of unused vacation, and he did not receive an annual incentive award due to his resignation from the Company on September 1, 2025. The forfeited awards presented in the table below represent a full forfeiture of Mr. Young’s outstanding stock awards upon his resignation. |
In 2023, the
non-CEO
NEO group changed to exclude Mr. Freedman after his departure from the Company in 2023. In 2023 the non-CEO
NEOs changed as follows: | (a) | Mr. Olsen’s salary and annual incentive award amounts reflect his promotion to our Executive Vice President, Chief Financial Officer and Treasurer effective June 1, 2023. |
| (b) | Mr. Freedman’s salary and annual incentive award amounts were calculated based on days of service in 2023, and he did not receive a 2023 LTIP award. The forfeited awards presented in the table below represent Mr. Freedman’s 2022 Outperformance Program award. |
| (c) | Mr. Eisen’s salary was based on days of service in 2023. |
2021 |
2022 |
2023 |
2024 |
2025 | |||||||||||||||||||||
Non-CEO NEOs |
|||||||||||||||||||||||||
Summary Compensation Table Total Compensation |
$ | 3,267,111 | $ | 4,760,868 | $ | 2,621,459 | $ | 3,393,856 | $ | 4,393,480 | |||||||||||||||
Less: Stock and Option Award Values Reported in Summary Compensation Table for the Covered Year ($) |
(1,475,033 | ) | (3,570,411 | ) | (1,441,958 | ) | (1,925,050 | ) | (3,131,726 | ) | |||||||||||||||
Plus: Fair Value of Stock and Option Awards Granted in the Covered Year that Remain Unvested as of Covered Year End ($) |
3,357,853 | 2,084,989 | 1,576,007 | 1,379,533 | 1,496,327 | ||||||||||||||||||||
Change in Fair Value of Outstanding Unvested Stock and Option Awards Granted in a Prior Year ($) |
7,022,211 | (4,924,253 | ) | 1,160,149 | (523,549 | ) | (1,141,403 | ) | |||||||||||||||||
Less: Fair Value of Stock and Option Awards Granted in a Prior Year that Were Forfeited During the Covered Year |
— | — | (283,392 | ) | — | (1,026,745 | ) | ||||||||||||||||||
Compensation Actually Paid ($) |
$ |
12,172,142 |
$ |
(1,648,807 |
) |
$ |
3,632,265 |
$ |
2,324,790 |
$ |
589,933 |
||||||||||||||
| (5) | For the applicable fiscal year, represents the cumulative TSR of the Company for the measurement periods beginning on December 31, 2020, and ending on December 31, 2025, December 31, 2024, December 29, 2023, December 30, 2022, or December 31, 2021, as appropriate. |
| (6) | For the applicable fiscal year, represents the cumulative TSR of the MSCI US REIT Index for the measurement periods beginning on December 31, 2020 and ending on December 31, 2025, December 31, 2024, December 29, 2023, December 30, 2022, or December 31, 2021, as appropriate. |
| (7) | Reflects GAAP net income. |
| (8) | Company-selected measure is AFFO which is defined in “Executive Compensation—Compensation Discussion and Analysis” above. See Part II. Item 7. “Management’s Discussion and Analysis of Financial Condition and Results of Operations—Non-GAAP Measures” in our 2025 Form 10-K for the reconciliation of AFFO to net income (loss) (as determined in accordance with GAAP), the most directly comparable GAAP measure. Although AFFO is an important financial performance measure, among others, that the Compensation and Management Development Committee considers when making compensation decisions with the intent of aligning compensation with Company performance, the Committee has not historically and does not currently evaluate CAP as calculated pursuant to Item 402(v) as part of its executive compensation determinations. |
| (6) | For the applicable fiscal year, represents the cumulative TSR of the MSCI US REIT Index for the measurement periods beginning on December 31, 2020 and ending on December 31, 2025, December 31, 2024, December 29, 2023, December 30, 2022, or December 31, 2021, as appropriate. |
| (2) | CAP to our CEO in each of 2025, 2024, 2023, 2022, and 2021 reflects the respective amounts reported in the “Total” column of the Summary Compensation Table, adjusted as set forth in the table below, as determined in accordance with Item 402(v) of Regulation S-K. The amounts do not reflect the actual amount of compensation earned by or paid to Mr. Tanner during the applicable year.(A) |
2021 |
2022 |
2023 |
2024 |
2025 | |||||||||||||||||||||
CEO |
Dallas B. Tanner |
Dallas B. Tanner |
Dallas B. Tanner |
Dallas B. Tanner |
Dallas B. Tanner |
||||||||||||||||||||
Summary Compensation Table Total Compensation |
$ | 9,710,445 | $ | 14,166,554 | $ | 10,393,322 | $ | 10,965,261 | $ | 14,096,335 | |||||||||||||||
Less: Stock and Option Award Values Reported in Summary Compensation Table for the Covered Year ($) |
(6,500,037 | ) | (12,023,478 | ) | (7,500,031 | ) | (8,025,030 | ) | (10,965,046 | ) | |||||||||||||||
Plus: Fair Value of Stock and Option Awards Granted in the Covered Year that Remain Unvested as of Covered Year End ($) |
14,797,038 | 6,849,983 | 9,108,057 | 5,750,923 | 6,706,917 | ||||||||||||||||||||
Change in Fair Value of Outstanding Unvested Stock and Option Awards Granted in a Prior Year ($) |
13,927,849 | (12,981,704 | ) | 6,547,117 | (3,760,945 | ) | (10,415,913 | ) | |||||||||||||||||
Less: Fair Value of Stock and Option Awards Forfeited During the Covered Year |
— | — | — | — | — | ||||||||||||||||||||
Compensation Actually Paid ($) |
$ |
31,935,295 |
$ |
(3,988,645 |
) |
$ |
18,548,465 |
$ |
4,930,209 |
$ |
(577,707 |
) | |||||||||||||
| (A) | The fair values of unvested and outstanding equity awards to our NEOs were remeasured as of the end of each fiscal year and as of each vesting date during the 2025, 2024, 2023, 2022, and 2021 fiscal years, respectively. Fair values as of each fiscal year end measurement date were determined using valuation assumptions and methodologies (including volatility and risk-free interest rates) that are generally consistent with those used to estimate fair value at grant date in accordance with FASB ASC Topic 718. For awards with a market vesting condition (including the impact of the TSR Modifier), fair values incorporate the results of a Monte Carlo simulation model, using assumptions and methodologies that are consistent with those used at grant date. The fair values of performance-based awards reflect the probable outcome of the performance vesting conditions as of each measurement date. |
In 2025, unvested 2022 OP Units have a total value of $0 because no book up event has occurred. |
| (4) | Average CAP to our non-CEO NEOs, as a group, in each of 2025, 2024, 2023, 2022, and 2021, reflects the respective amounts reported in the “Total” column of the Summary Compensation Table, adjusted as set forth in the table below, as determined in accordance with Item 402(v) of Regulation S-K. The amounts do not reflect the actual average amount of compensation earned by or paid to the non-CEO NEOs as a group during the applicable year.(A) |
In 2025, the
non-CEO
NEO group changed as follows: | (a) | Mr. Lobner’s salary and annual incentive award amounts reflect his promotion to Executive Vice President, Chief Operating Officer effective March 1, 2025 |
| (b) | Mr. Young’s salary was calculated based on days of service in 2025, inclusive of payout of unused vacation, and he did not receive an annual incentive award due to his resignation from the Company on September 1, 2025. The forfeited awards presented in the table below represent a full forfeiture of Mr. Young’s outstanding stock awards upon his resignation. |
In 2023, the
non-CEO
NEO group changed to exclude Mr. Freedman after his departure from the Company in 2023. In 2023 the non-CEO
NEOs changed as follows: | (a) | Mr. Olsen’s salary and annual incentive award amounts reflect his promotion to our Executive Vice President, Chief Financial Officer and Treasurer effective June 1, 2023. |
| (b) | Mr. Freedman’s salary and annual incentive award amounts were calculated based on days of service in 2023, and he did not receive a 2023 LTIP award. The forfeited awards presented in the table below represent Mr. Freedman’s 2022 Outperformance Program award. |
| (c) | Mr. Eisen’s salary was based on days of service in 2023. |
2021 |
2022 |
2023 |
2024 |
2025 | |||||||||||||||||||||
Non-CEO NEOs |
|||||||||||||||||||||||||
Summary Compensation Table Total Compensation |
$ | 3,267,111 | $ | 4,760,868 | $ | 2,621,459 | $ | 3,393,856 | $ | 4,393,480 | |||||||||||||||
Less: Stock and Option Award Values Reported in Summary Compensation Table for the Covered Year ($) |
(1,475,033 | ) | (3,570,411 | ) | (1,441,958 | ) | (1,925,050 | ) | (3,131,726 | ) | |||||||||||||||
Plus: Fair Value of Stock and Option Awards Granted in the Covered Year that Remain Unvested as of Covered Year End ($) |
3,357,853 | 2,084,989 | 1,576,007 | 1,379,533 | 1,496,327 | ||||||||||||||||||||
Change in Fair Value of Outstanding Unvested Stock and Option Awards Granted in a Prior Year ($) |
7,022,211 | (4,924,253 | ) | 1,160,149 | (523,549 | ) | (1,141,403 | ) | |||||||||||||||||
Less: Fair Value of Stock and Option Awards Granted in a Prior Year that Were Forfeited During the Covered Year |
— | — | (283,392 | ) | — | (1,026,745 | ) | ||||||||||||||||||
Compensation Actually Paid ($) |
$ |
12,172,142 |
$ |
(1,648,807 |
) |
$ |
3,632,265 |
$ |
2,324,790 |
$ |
589,933 |
||||||||||||||
Relationship Between Compensation Actually Paid and Performance Measures
CAP, as calculated under Item 402(v) of Regulation
S-K,
reflects adjusted values to unvested and vested equity awards during the years shown in the Pay Versus Performance table based on year-end
stock prices, various accounting valuation assumptions, and projected performance modifiers but does not reflect actual amounts paid out for those awards. CAP generally fluctuates due to stock price achievement and varying levels of projected and actual achievement of performance goals. Compensation Actually Paid versus Cumulative TSR
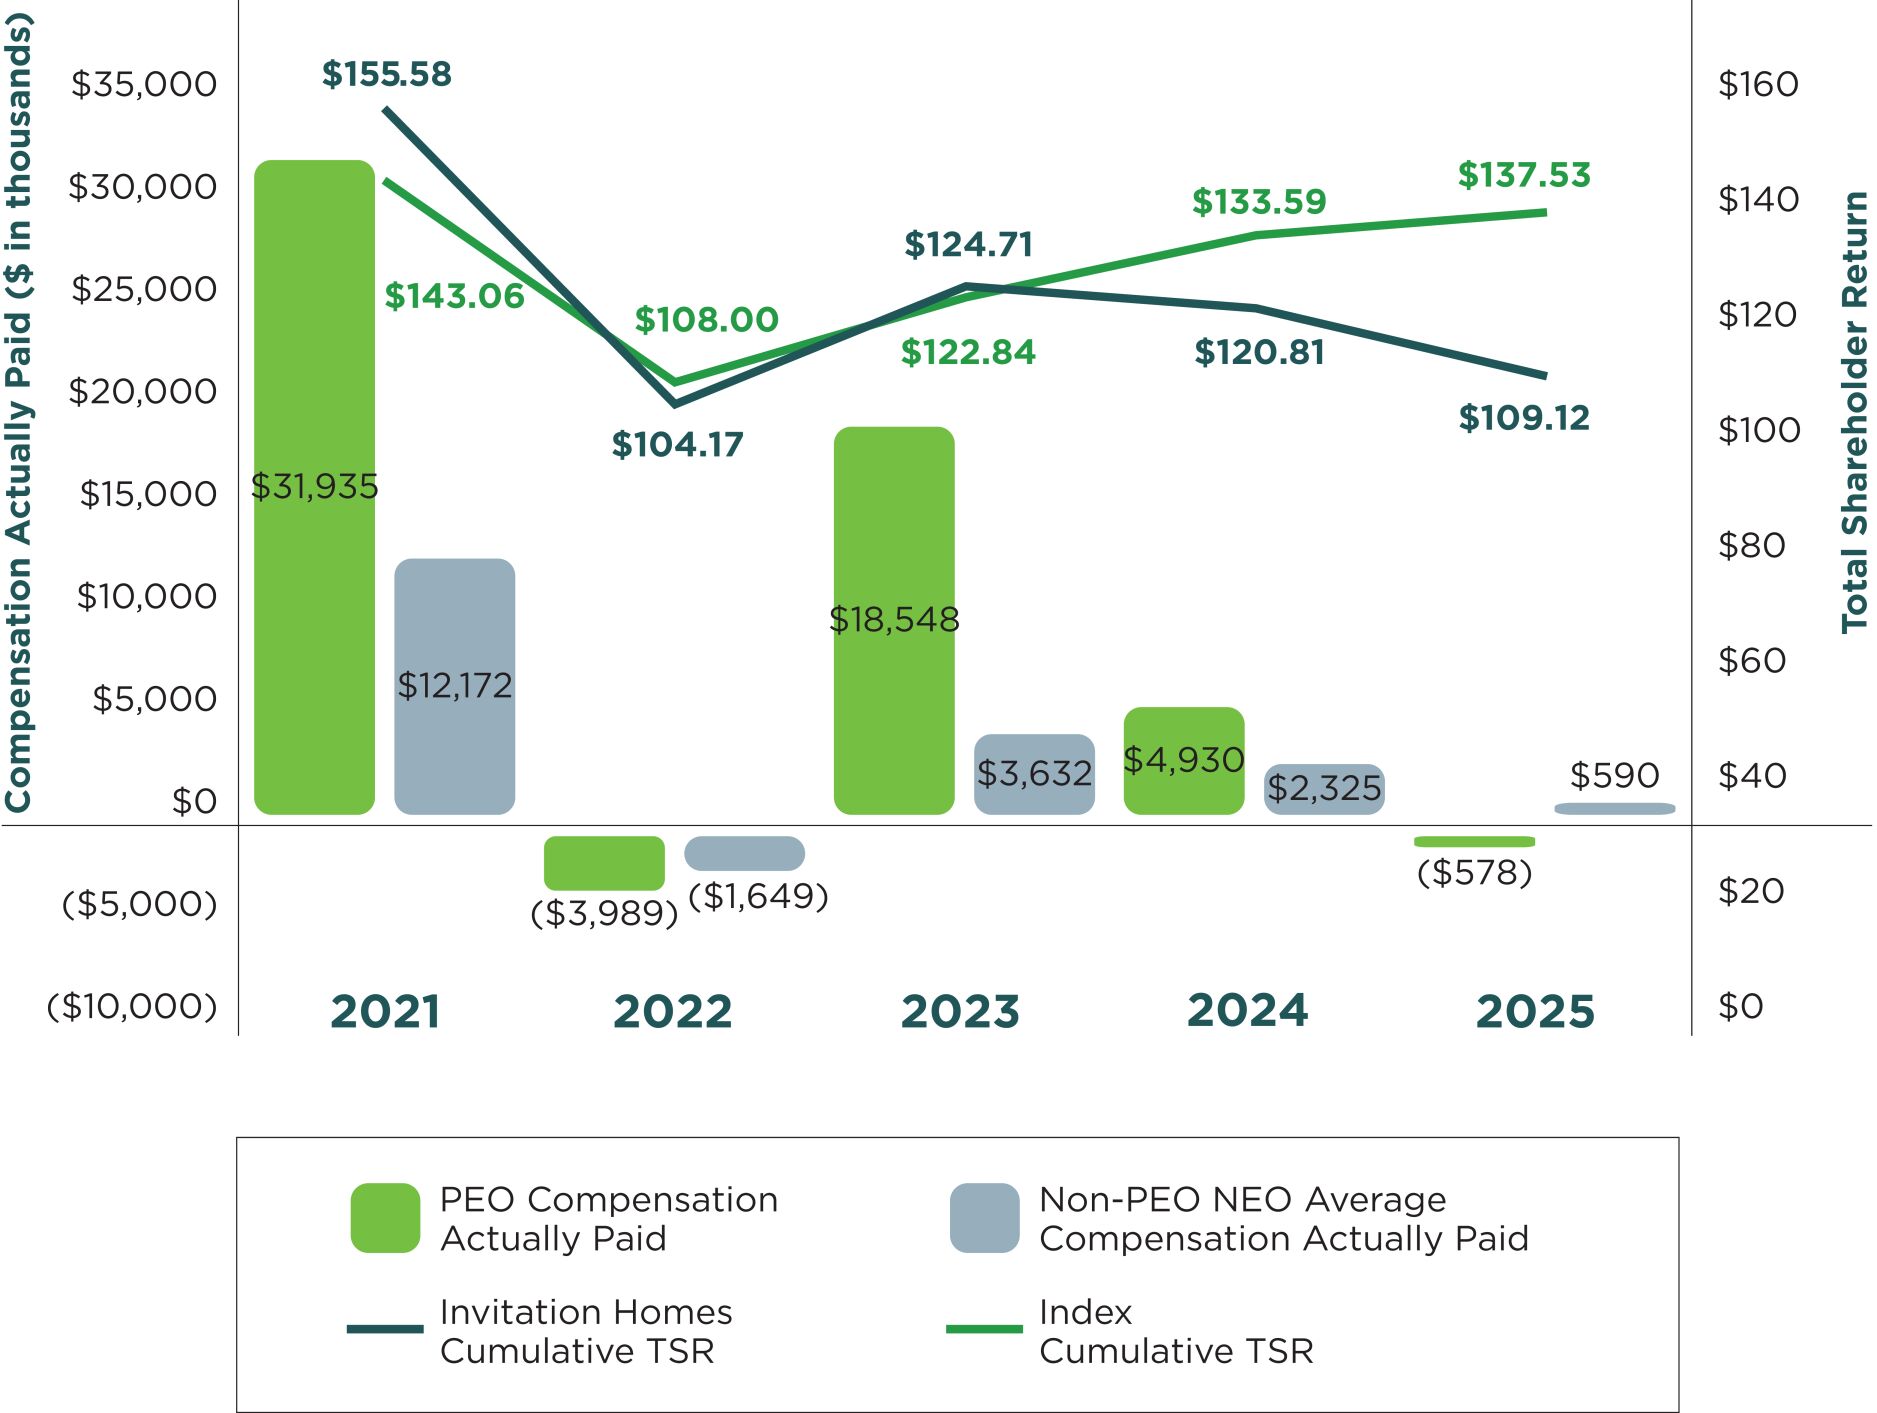
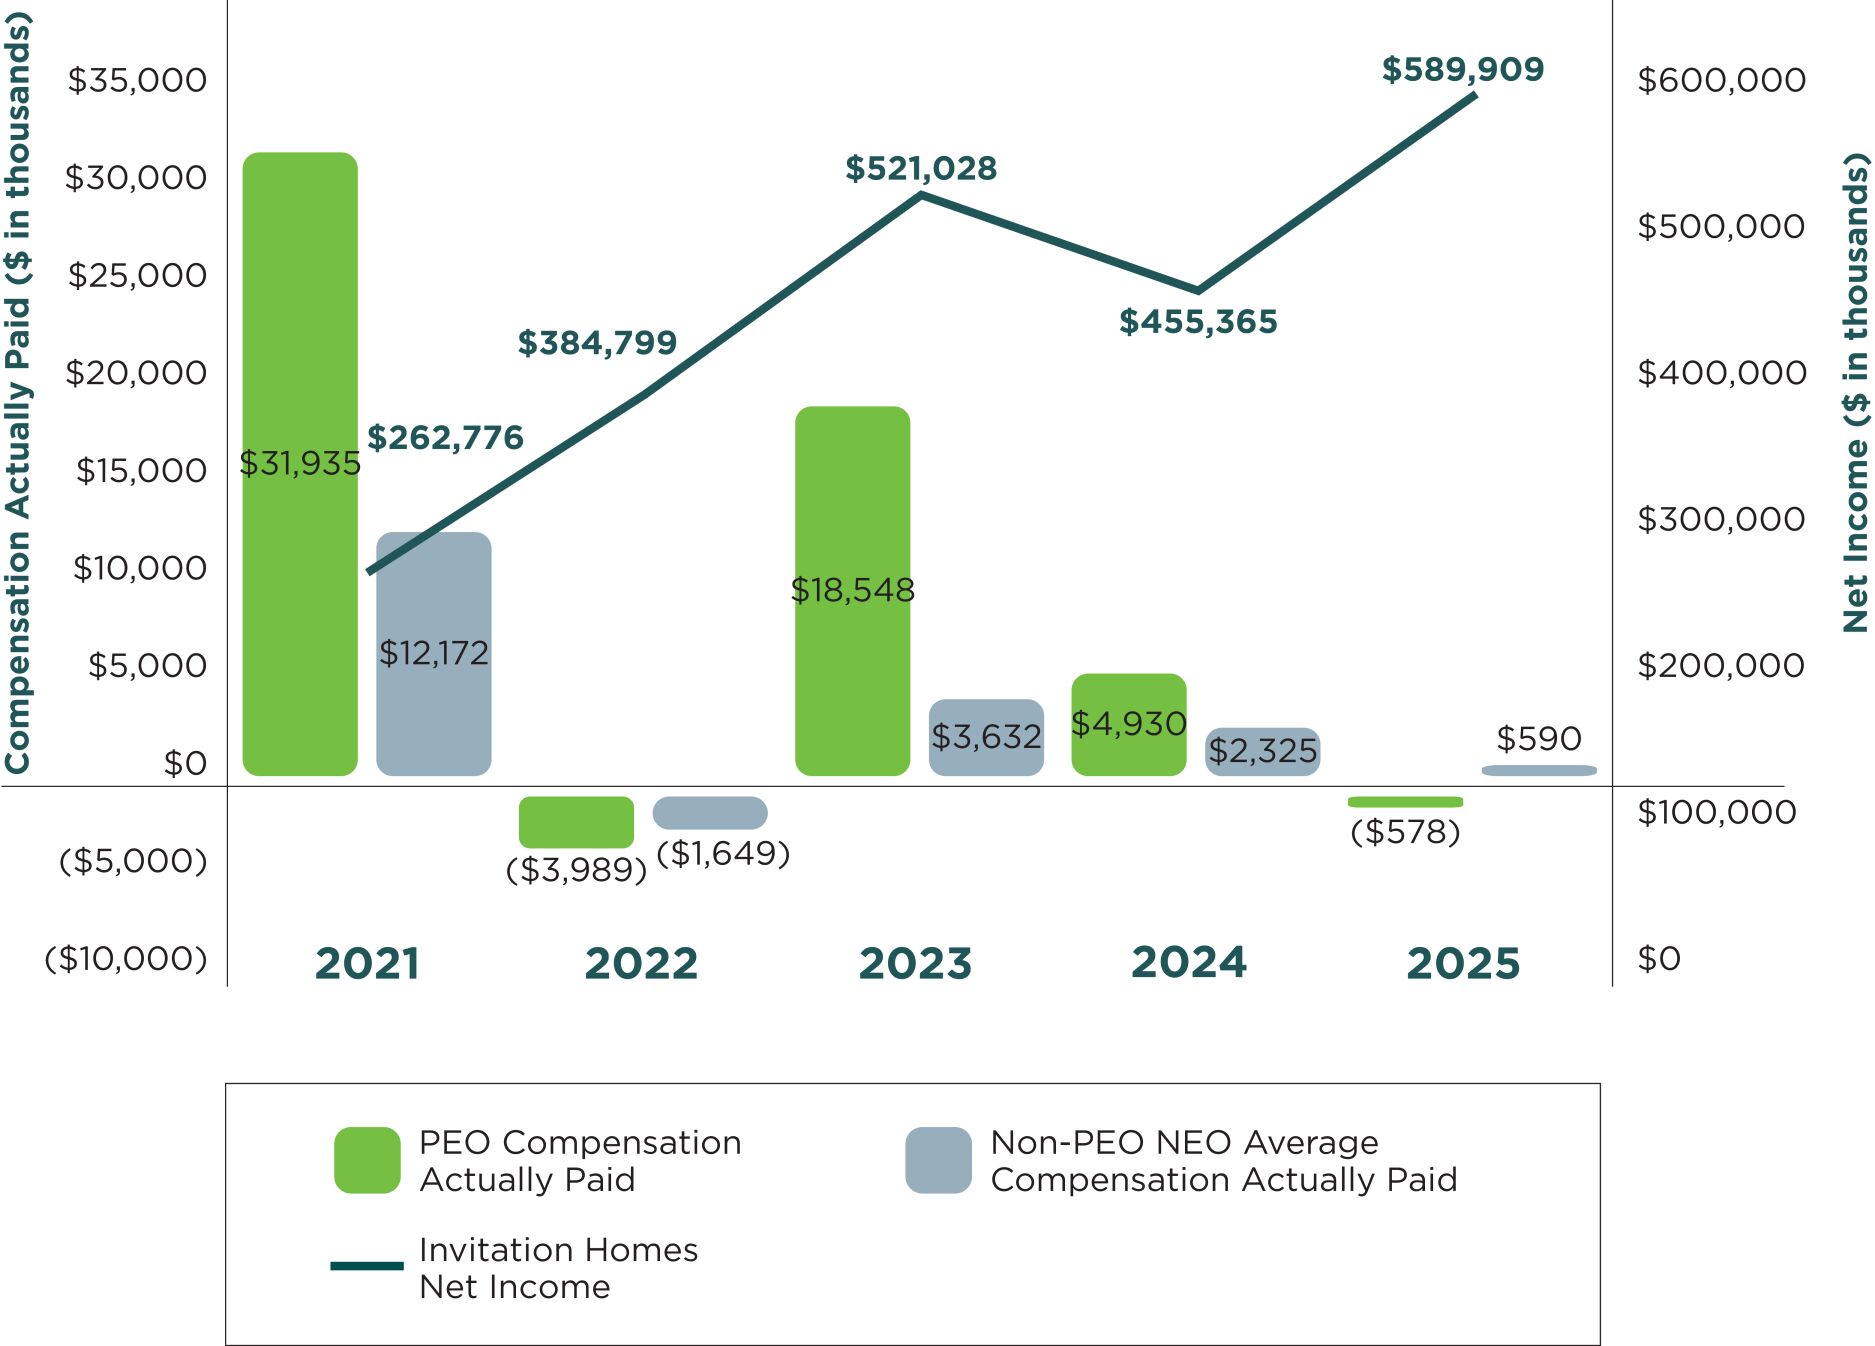
Compensation Actually Paid versus Net Income
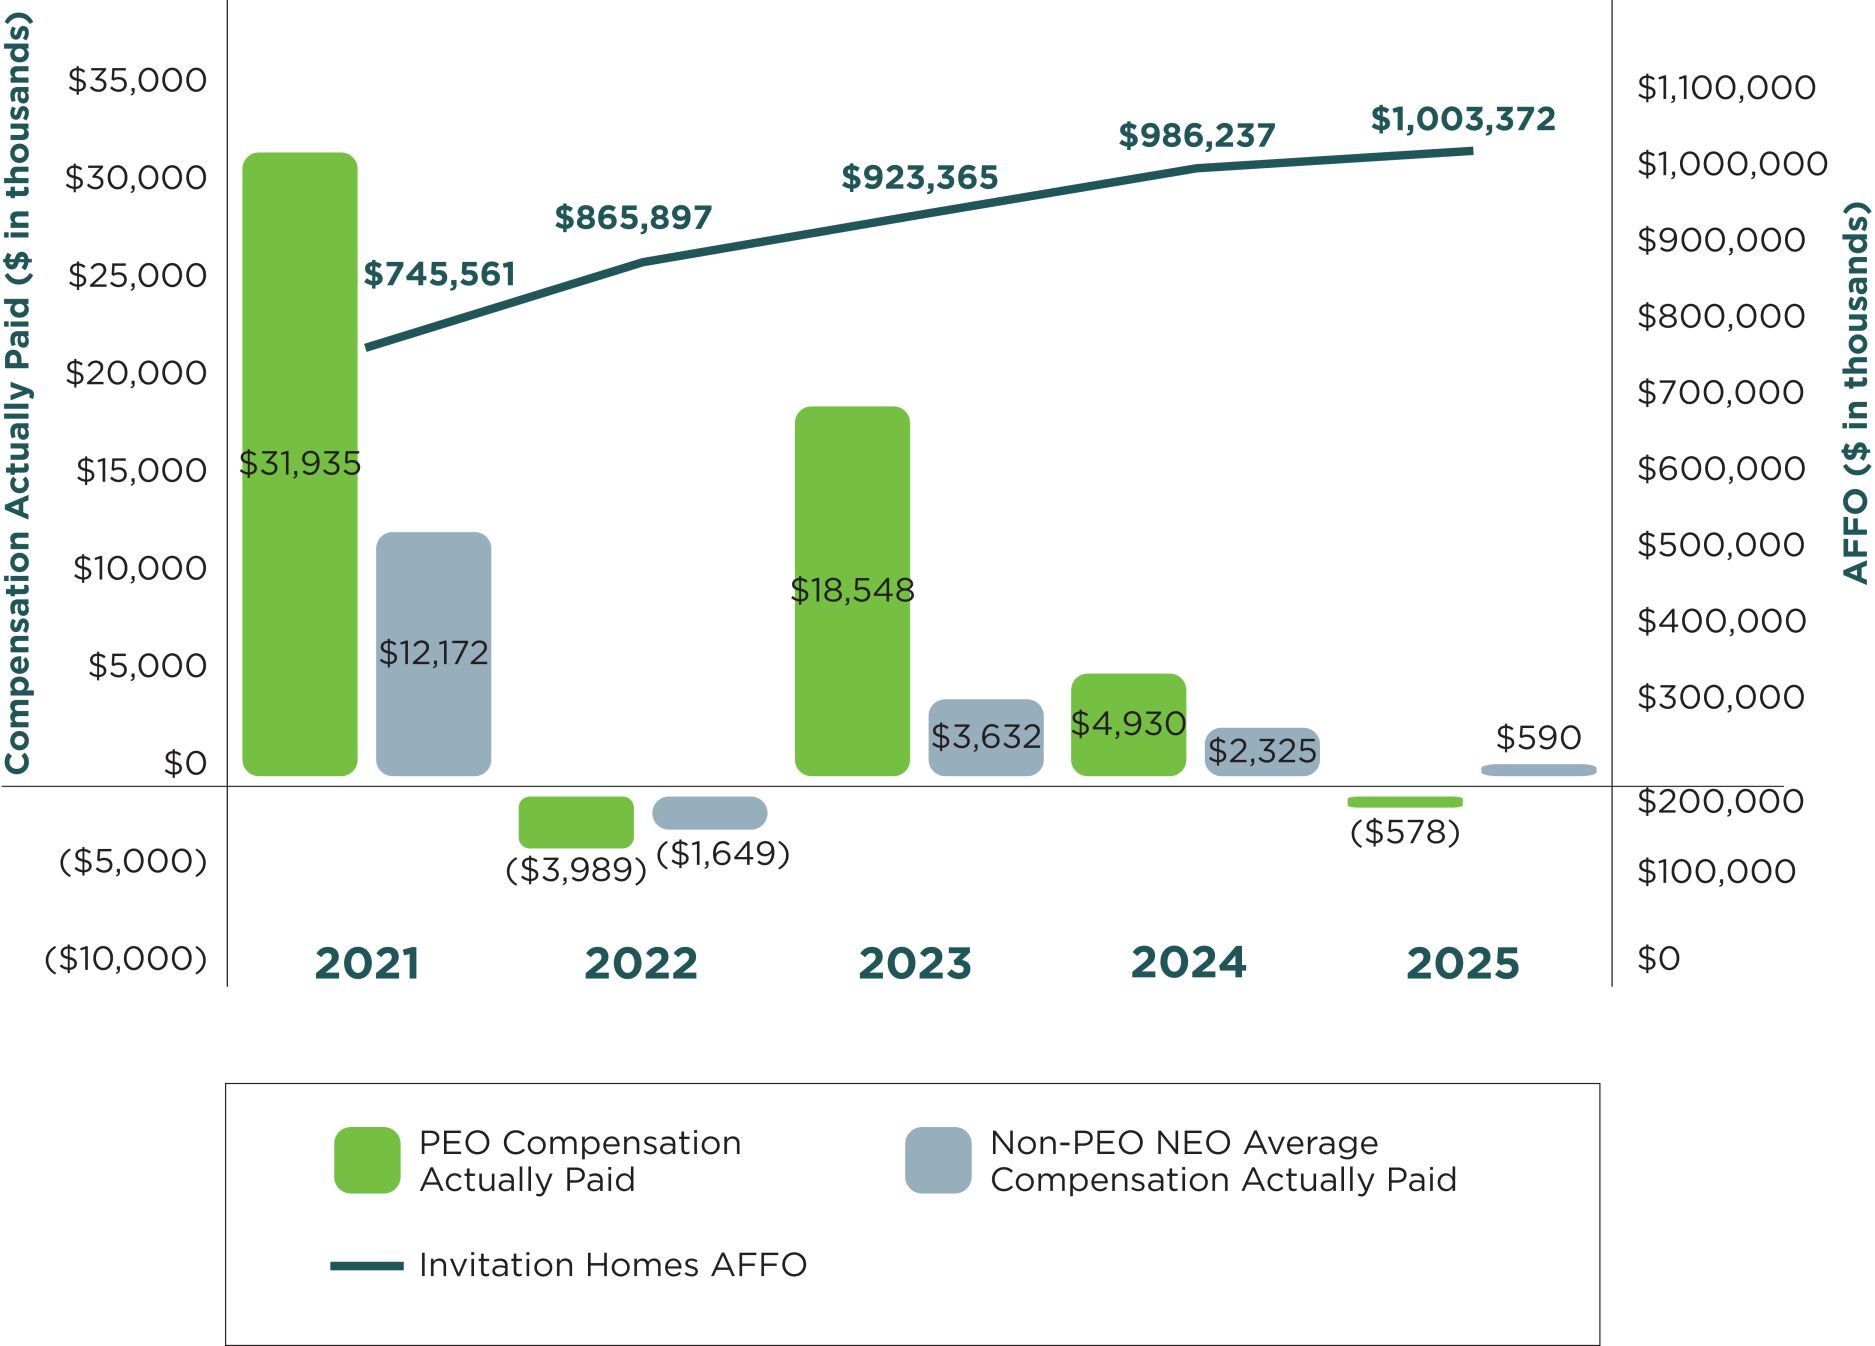
Compensation Actually Paid versus
Adjusted Funds from Operations (AFFO)
Relationship Between Compensation Actually Paid and Performance Measures
CAP, as calculated under Item 402(v) of Regulation
S-K,
reflects adjusted values to unvested and vested equity awards during the years shown in the Pay Versus Performance table based on year-end
stock prices, various accounting valuation assumptions, and projected performance modifiers but does not reflect actual amounts paid out for those awards. CAP generally fluctuates due to stock price achievement and varying levels of projected and actual achievement of performance goals. Compensation Actually Paid versus Cumulative TSR
As discussed in the in “Executive Compensation—Compensation Discussion and Analysis,” our compensation program is heavily weighted towards performance-based compensation, reflecting our philosophy of increasing the long-term value of the Company and supporting strategic and operational objectives. The metrics used within our annual cash incentive plan and our long-term incentive award plans are selected to support these objectives. In our assessment, the most important financial performance measures used to link CAP (as calculated in accordance with Item 402(v) of Regulation
S-K)
to our NEOs in 2025 to our performance were: • |
AFFO; |
• |
Net income; and |
• |
Three-year TSR. |
Operations—Non-GAAP
Measures” in our 2025 Form 10-K
for the reconciliation of AFFO to net income (loss) (as determined in accordance with GAAP), the most directly comparable GAAP measure. Although AFFO is an important financial performance measure, among others, that the Compensation and Management Development Committee considers when making compensation decisions with the intent of aligning compensation with Company performance, the Committee has not historically and does not currently evaluate CAP as calculated pursuant to Item 402(v) as part of its executive compensation determinations.