Pay vs Performance Disclosure - USD ($)
May 16, 2023
Dec. 31, 2025
Dec. 31, 2024
Dec. 31, 2023
Dec. 31, 2022
Dec. 31, 2021
Dec. 31, 2025
PAY VERSUS PERFORMANCE TABLE
Year (a) |
Summary Compensation Table (“SCT”) Total for PEO 1 (Peterson) (b-1)($) |
SCT Total for PEO 2 (Saligram) (b-2)($) |
Compensation Actually Paid (“CAP”) to PEO 1 (Peterson) (c-1)($)(1)(2) |
CAP to PEO 2 (Saligram) (c-2)($)(1)(2) |
Average SCT Total for Non- PEO NEOs (d)($) |
Average CAP to Non-PEO NEOs (e)($)(1)(2) |
Value of Initial Fixed $100 Investment Based on: ($) |
Net Income (h)($M)(4) |
Company Selected Measure - Adjusted Operating Cash Flow (i)($M)(5) |
|||||||||||||||||||||||||||||||
Total Shareholder Return (f)(3) |
Peer Group Total Shareholder Return (g)(3) |
|||||||||||||||||||||||||||||||||||||||
2025 |
12,497,912 |
- |
(21,842,563) |
- |
3,803,766 |
(3,280,193) |
22 |
130 |
(285) |
476 |
||||||||||||||||||||||||||||||
2024 |
12,392,060 |
- |
38,232,502 |
- |
4,217,588 |
8,487,955 |
55 |
123 |
(216) |
526 |
||||||||||||||||||||||||||||||
2023 |
25,536,707 |
4,514,209 |
23,276,353 |
2,060,879 |
7,954,497 |
7,409,536 |
46 |
106 |
(388) |
979 |
||||||||||||||||||||||||||||||
2022 |
- |
10,296,665 |
- |
(7,272,680) |
3,046,371 |
(1,339,606) |
67 |
93 |
197 |
(203) |
||||||||||||||||||||||||||||||
2021 |
- |
11,438,798 |
- |
16,404,598 |
3,798,238 |
4,456,426 |
107 |
122 |
622 |
884 |
||||||||||||||||||||||||||||||
| (1) | Mr. Peterson (“ PEO 1 ”) has served as our principal executive officer (“PEO ”) commencing May 16, 2023. Mr. Saligram (“PEO 2 ”) served as our PEO from January 1, 2023 until May 16, 2023 and for the full year for each of 2022 and 2021. For 2024 and 2025, our non-PEO NEOs included Messrs. Erceg and Turner and Mses. Platt and Malkoski. For 2023, our non-PEO NEOs included Messrs. Erceg and Turner, Michael McDermott and Ms. Malkoski. For 2022, our non-PEO NEOs included Messrs. Peterson, Turner and McDermott and Ms. Malkoski. For 2021, our non-PEO NEOs included Messrs. Peterson and Turner, Michal Geller and Laurel Hurd. |
| (2) | The amounts presented in these columns are inclusive of PRSUs, which reflect management’s estimate of performance against their respective targets at each applicable year-end. The fair value of TRSUs was calculated based on a 100% payout assumption. |
The fair value of stock options reported for Compensation Actually Paid purposes was estimated using a Black-Scholes option pricing model and used both historical data and current market data to estimate the fair value of options and required several assumptions. The assumptions used in estimating fair value for awards granted during 2022-2025 for purposes of determining 2025 Compensation Actually Paid were as follows:
Grant Year |
2025 |
2024 |
2023 |
2022 |
||||||||||||
Volatility |
N/A |
N/A |
55.4% |
48.3 - 50.3% |
||||||||||||
Expected life (in years) |
N/A |
N/A |
4.2 years |
4.2 years |
||||||||||||
Expected dividend yield |
N/A |
N/A |
4.3% |
4.2% |
||||||||||||
Risk-free rate |
N/A |
N/A |
3.6% |
3.8 - 4.3% |
||||||||||||
For 2025, the values included in this column for the compensation actually paid to PEO 1 and the average compensation actually paid to our Non-PEO NEOs reflect the following adjustments to the values included in column (b-1), column (b-2) and column (d), respectively: |
PEO 1 ($) |
Non-PEO NEOs (Average) ($) |
|||||||||
Summary Compensation Table Total |
12,497,912 |
3,803,766 |
||||||||
- aggregate change in actuarial present value of accumulated pension benefits under all defined benefit and pension plans reported in the SCT |
- |
- |
||||||||
+ service cost of pension benefits |
- |
- |
||||||||
+ prior service cost of pension benefits |
- |
- |
||||||||
- SCT Stock Awards column value |
(8,999,993) |
(2,276,804) |
||||||||
- SCT Option Awards column value |
- |
- |
||||||||
+ fair value as of year-end of all equity awards granted in the covered fiscal year that are outstanding and unvested as of the end of the covered fiscal year |
5,102,760 |
1,290,888 |
||||||||
+/- amount equal to the change as of the end of the covered fiscal year (from the end of the prior fiscal year) in fair value of equity awards granted in any prior fiscal year that are outstanding and unvested as of the end of the covered fiscal year |
(29,418,069) |
(5,367,124) |
||||||||
+ for awards granted and vesting in the same fiscal year, vesting date fair value |
- |
- |
||||||||
+/- amount equal to the change as of the vesting date (from the end of the prior fiscal year) in fair value of any awards granted in prior fiscal years for which all applicable vesting conditions were met at the end of the covered fiscal year |
(1,025,173) |
(730,919) |
||||||||
- for any awards granted in any prior fiscal year that fail to meet the applicable vesting conditions during the covered fiscal year, amount equal to the fair value at the end of prior fiscal year |
- |
- |
||||||||
+ dollar value of dividends or other earnings paid on equity awards in the covered fiscal year prior to the vesting date not otherwise included in total compensation for the covered fiscal year |
- |
- |
||||||||
+ excess fair value for option/SAR award modifications |
- |
- |
||||||||
Compensation Actually Paid |
(21,842,563) |
(3,280,193) |
||||||||
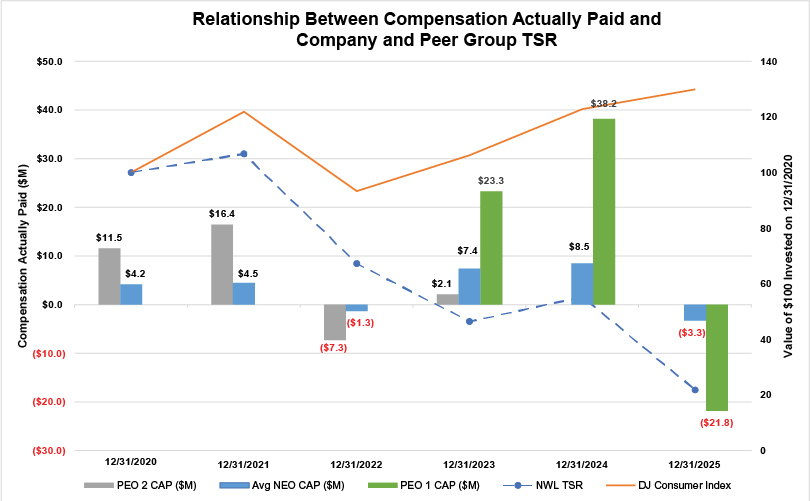
| (3) | For each of 2025, 2024, 2023, 2022 and 2021, total shareholder return for the Company and the peer group was calculated as the yearly percentage change in cumulative total shareholder return based on a deemed fixed investment of $100 at market close on December 31, 2020. The yearly percentage change in cumulative total shareholder return was measured as the quotient of (a) the sum of (i) the cumulative amount of dividends per share for the period from December 31, 2020 through and including the last day of the covered fiscal year (the “ Measurement Period ”), assuming dividend reinvestment, plus (ii) the difference between stock price per share at the end and the beginning of the Measurement Period, divided by (b) stock price per share at the beginning of the Measurement Period. For purposes of this pay versus performance disclosure, our peer group is the Dow Jones Consumer Goods Index (the “Peer Group ”). Because fiscal years are presented in the table in reverse chronological order (from top to bottom), the table should be read from bottom to top for purposes of understanding cumulative returns over time. |
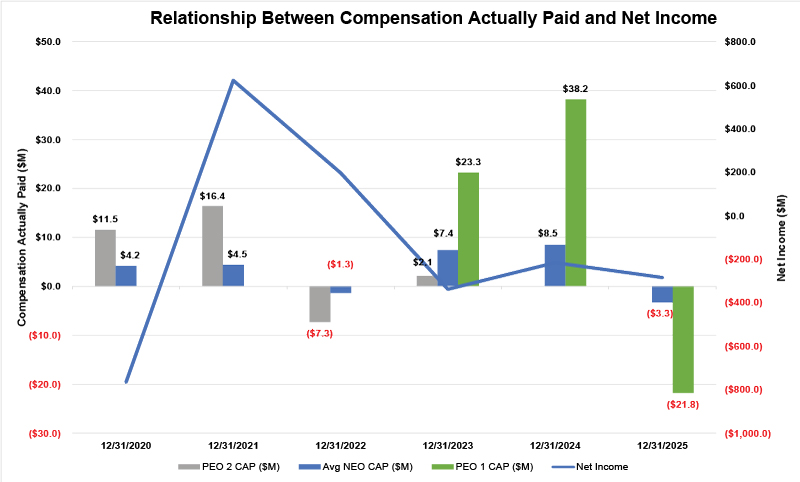
| (4) | Net Income. |
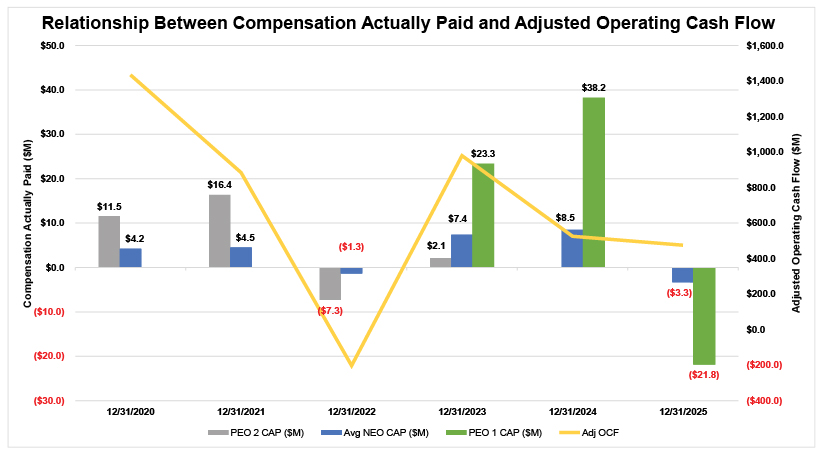
| (5) | Adjusted Operating Cash Flow. non-budgeted cash expenditures as determined by the Committee which for 2025 included recall costs for certain French Door Countertop Ovens and expenses related to a legal proceeding in U.S. Tax Court. Adjusted operating cash flow also |
excludes transactional and financing costs and incremental interest payments resulting from refinancing a significant portion of the Company’s long-term debt prior to maturity in 2024 and 2025, includes disposal proceeds for ordinary course and restructuring related asset sales and, in 2025, excludes the unbudgeted net impact of tariff changes. |
non-PEO
NEOs included Messrs. Erceg and Turner and Mses. Platt and Malkoski. For 2023, our non-PEO
NEOs included Messrs. Erceg and Turner, Michael McDermott and Ms. Malkoski. For 2022, our non-PEO
NEOs included Messrs. Peterson, Turner and McDermott and Ms. Malkoski. For 2021, our non-PEO
NEOs included Messrs. Peterson and Turner, Michal Geller and Laurel Hurd.
| (3) | For each of 2025, 2024, 2023, 2022 and 2021, total shareholder return for the Company and the peer group was calculated as the yearly percentage change in cumulative total shareholder return based on a deemed fixed investment of $100 at market close on December 31, 2020. The yearly percentage change in cumulative total shareholder return was measured as the quotient of (a) the sum of (i) the cumulative amount of dividends per share for the period from December 31, 2020 through and including the last day of the covered fiscal year (the “ Measurement Period ”), assuming dividend reinvestment, plus (ii) the difference between stock price per share at the end and the beginning of the Measurement Period, divided by (b) stock price per share at the beginning of the Measurement Period. For purposes of this pay versus performance disclosure, our peer group is the Dow Jones Consumer Goods Index (the “Peer Group ”). Because fiscal years are presented in the table in reverse chronological order (from top to bottom), the table should be read from bottom to top for purposes of understanding cumulative returns over time. |
| (2) | The amounts presented in these columns are inclusive of PRSUs, which reflect management’s estimate of performance against their respective targets at each applicable year-end. The fair value of TRSUs was calculated based on a 100% payout assumption. |
The fair value of stock options reported for Compensation Actually Paid purposes was estimated using a Black-Scholes option pricing model and used both historical data and current market data to estimate the fair value of options and required several assumptions. The assumptions used in estimating fair value for awards granted during 2022-2025 for purposes of determining 2025 Compensation Actually Paid were as follows:
Grant Year |
2025 |
2024 |
2023 |
2022 |
||||||||||||
Volatility |
N/A |
N/A |
55.4% |
48.3 - 50.3% |
||||||||||||
Expected life (in years) |
N/A |
N/A |
4.2 years |
4.2 years |
||||||||||||
Expected dividend yield |
N/A |
N/A |
4.3% |
4.2% |
||||||||||||
Risk-free rate |
N/A |
N/A |
3.6% |
3.8 - 4.3% |
||||||||||||
For 2025, the values included in this column for the compensation actually paid to PEO 1 and the average compensation actually paid to our Non-PEO NEOs reflect the following adjustments to the values included in column (b-1), column (b-2) and column (d), respectively: |
PEO 1 ($) |
Non-PEO NEOs (Average) ($) |
|||||||||
Summary Compensation Table Total |
12,497,912 |
3,803,766 |
||||||||
- aggregate change in actuarial present value of accumulated pension benefits under all defined benefit and pension plans reported in the SCT |
- |
- |
||||||||
+ service cost of pension benefits |
- |
- |
||||||||
+ prior service cost of pension benefits |
- |
- |
||||||||
- SCT Stock Awards column value |
(8,999,993) |
(2,276,804) |
||||||||
- SCT Option Awards column value |
- |
- |
||||||||
+ fair value as of year-end of all equity awards granted in the covered fiscal year that are outstanding and unvested as of the end of the covered fiscal year |
5,102,760 |
1,290,888 |
||||||||
+/- amount equal to the change as of the end of the covered fiscal year (from the end of the prior fiscal year) in fair value of equity awards granted in any prior fiscal year that are outstanding and unvested as of the end of the covered fiscal year |
(29,418,069) |
(5,367,124) |
||||||||
+ for awards granted and vesting in the same fiscal year, vesting date fair value |
- |
- |
||||||||
+/- amount equal to the change as of the vesting date (from the end of the prior fiscal year) in fair value of any awards granted in prior fiscal years for which all applicable vesting conditions were met at the end of the covered fiscal year |
(1,025,173) |
(730,919) |
||||||||
- for any awards granted in any prior fiscal year that fail to meet the applicable vesting conditions during the covered fiscal year, amount equal to the fair value at the end of prior fiscal year |
- |
- |
||||||||
+ dollar value of dividends or other earnings paid on equity awards in the covered fiscal year prior to the vesting date not otherwise included in total compensation for the covered fiscal year |
- |
- |
||||||||
+ excess fair value for option/SAR award modifications |
- |
- |
||||||||
Compensation Actually Paid |
(21,842,563) |
(3,280,193) |
||||||||
Tabular List
The following table lists the five financial performance measures that we believe represent the most important financial performance measures we use to link compensation actually paid to our NEOs for fiscal 2025 to our performance:
Tabular List of Financial Performance Measures |
Ø |
Ø |
Ø |
Ø |
Ø |
| (1) | Adjusted EPS . Adjusted EPS is the Company’s reported EPS, excluding the impact of Normalized Adjustments. Adjusted EPS also excludes transactional and financing costs and incremental interest payments resulting from refinancing a significant portion of the Company’s long-term debt prior to maturity in 2024 and 2025 and, in 2025, the unbudgeted net impact of tariff changes. |
| (2) | Adjusted Gross Margin . Adjusted gross margin is the Company’s reported gross margin percentage, excluding the impact of Normalized Adjustments. |
| (3) | Core Sales . Core sales is the Company’s publicly reported core sales. Core sales excludes the impact of acquisitions and divestitures, discontinued operations, retail store openings and closures, certain market/category exits, changes in foreign currency and other items excluded from publicly reported core sales. Core sales for the total Company are translated at the preceding year’s average foreign exchange rates for the applicable month and for segments based on budgeted foreign exchange rates. |
| (4) | Free Cash Flow Productivity . “Free cash flow productivity” is defined as free cash flow divided by adjusted net income for the relevant period, expressed as a percentage. “Free cash flow” is the Company’s reported operating cash flow as determined in accordance with GAAP, less capital expenditures, and “adjusted net income” is the Company’s reported net income as determined in accordance with GAAP, in each case excluding the impact of impairment charges; gains, losses and tax payments associated with the divestiture of a business unit or line of business; and non-cash discrete tax charges and benefits. Free cash flow and adjusted net income also exclude the impact of other items significantly affecting the calculation of free cash flow productivity that are not indicative of the Company’s core operating results for the relevant period and affect the comparability of underlying results from period to period, as determined by the Committee. |