Pay vs Performance Disclosure - USD ($)
Jan. 03, 2026
Dec. 28, 2024
Dec. 30, 2023
Dec. 31, 2022
Jan. 01, 2022
PAY VERSUS PERFORMANCE
Under rules adopted pursuant to the Dodd-Frank Act, we are required to disclose certain information about the relationship between the compensation actually paid to our named executive officers and certain measures of company performance. The material that follows is provided in compliance with these rules; however, additional information regarding our compensation philosophy, the structure of our performance-based compensation programs, and compensation decisions made this year is described above in our “Compensation Discussion and Analysis”.
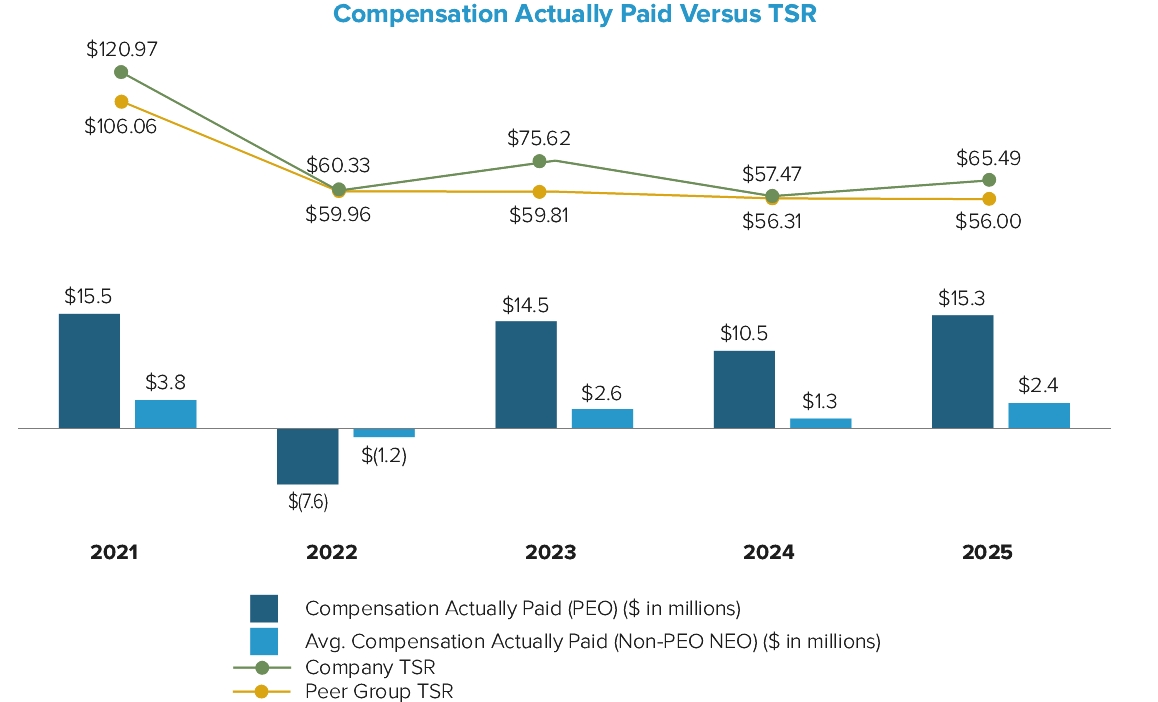
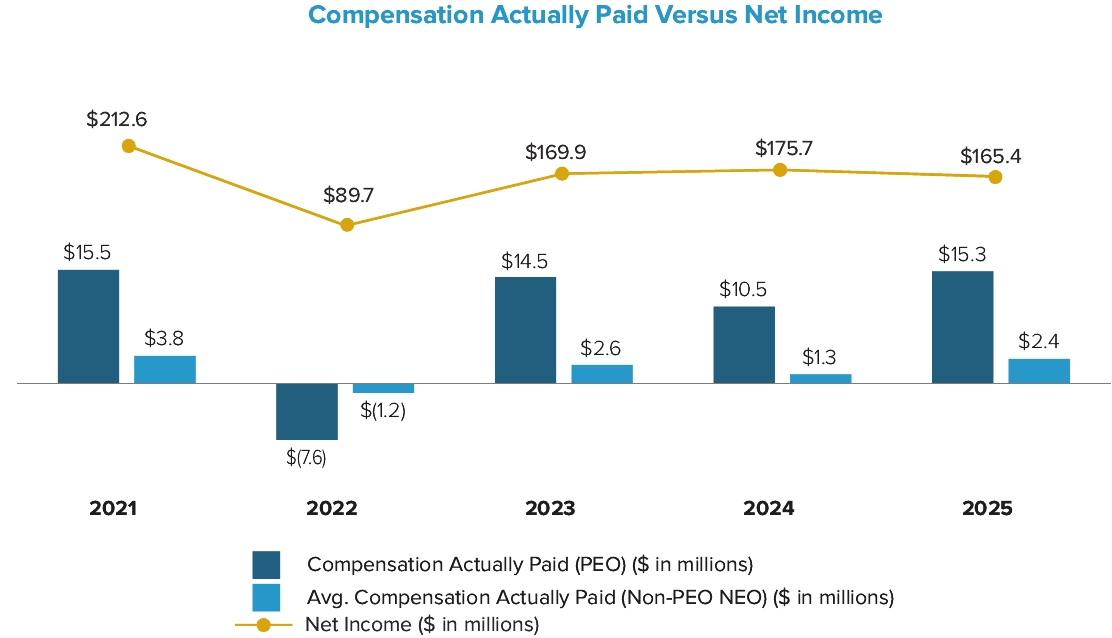
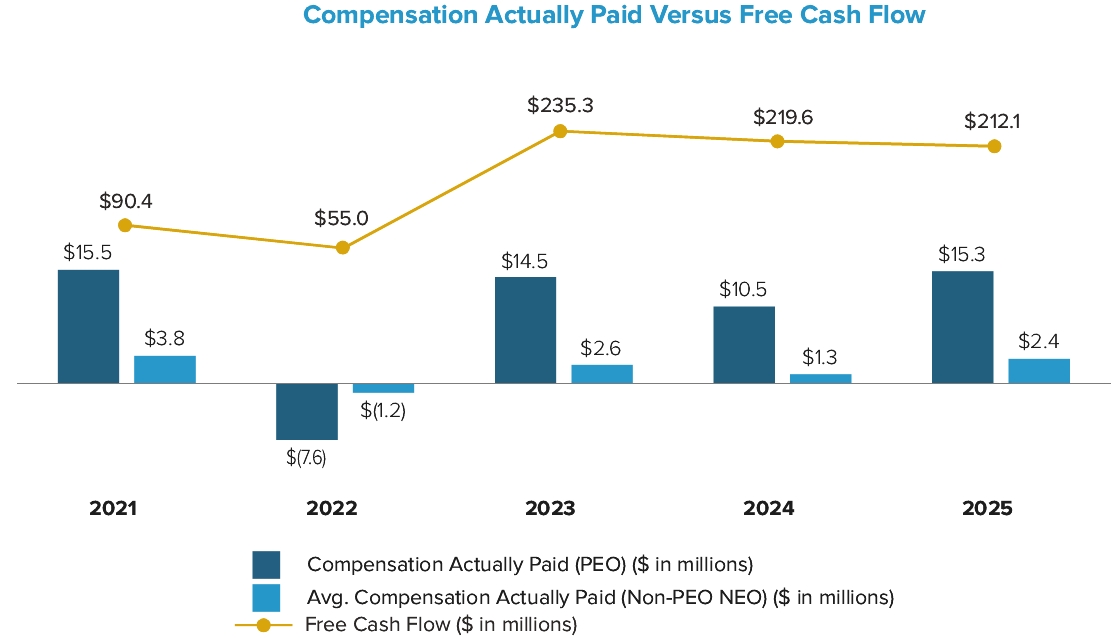
The following table provides information regarding compensation actually paid to our principal executive officer, or PEO, and other NEOs for each year from 2021 to 2025, compared to our total shareholder return (TSR) from December 31, 2020 through the end of each such year, and our Net Income and Free Cash Flow for each such year.
Year (a) | Summary Compensation Table Total for PEO (b)(1)(2) | Compensation Actually Paid to PEO (c)(1)(3) | Average Summary Compensation Table Total for Non-PEO Named Executive Officers (d)(4) | Average Compensation Actually Paid to Non-PEO Named Executive Officers (e)(5) | Value of Initial Fixed $100 Investment Based On: | Net Income (in thousands) (h)(8) | Free Cash Flow (in thousands) (i)(9) | |||||||||||||||||||
Total Shareholder Return (f)(6) | Peer Group Total Shareholder Return (g)(7) | |||||||||||||||||||||||||
2025 | $7,697,528 | $15,251,046 | $1,558,205 | $2,354,894 | $65 | $56 | $165,388 | $212,070 | ||||||||||||||||||
2024 | $7,822,644 | $10,484,095 | $1,361,715 | $1,290,268 | $57 | $56 | $175,689 | $219,554 | ||||||||||||||||||
2023 | $10,076,903 | $14,478,831 | $1,949,000 | $2,625,281 | $76 | $60 | $169,885 | $235,270 | ||||||||||||||||||
2022 | $5,339,054 | ($7,609,029) | $1,587,779 | ($1,234,645) | $60 | $60 | $89,693 | $54,965 | ||||||||||||||||||
2021 | $7,678,474 | $15,467,715 | $2,110,998 | $3,839,208 | $121 | $106 | $212,602 | $90,399 | ||||||||||||||||||
(1) | Our PEO was Matthew J. Reintjes. |
(2) | Represents the total compensation paid to our PEO in each listed year, as shown in our Summary Compensation Table for such listed year. |
(3) | Compensation actually paid does not mean that our PEO was actually paid those amounts in the listed year, but this is a dollar amount derived from the starting point of summary compensation table total compensation under the methodology prescribed under the relevant rules as shown in the adjustment table below. |
2025 ($) | |||||
Summary Compensation Table Total(a) | 7,697,528 | ||||
Subtract Grant Date Fair Value of Option Awards and Stock Awards Granted in Fiscal Year(b) | (5,500,187) | ||||
Add Fair Value at Fiscal Year-End of Outstanding and Unvested Option Awards and Stock Awards Granted in Fiscal Year(c) | 6,533,798 | ||||
Adjust for Change in Fair Value of Outstanding and Unvested Option Awards and Stock Awards Granted in Prior Fiscal Years(c) | 5,639,393 | ||||
Adjust for Fair Value at Vesting of Option Awards and Stock Awards Granted in Fiscal Year That Vested During Fiscal Year(c) | — | ||||
Adjust for Change in Fair Value as of Vesting Date of Option Awards and Stock Awards Granted in Prior Fiscal Years For Which Applicable Vesting Conditions Were Satisfied During Fiscal Year(c) | 880,515 | ||||
Subtract Fair Value as of Prior Fiscal Year-End of Option Awards and Stock Awards Granted in Prior Fiscal Years That Failed to Meet Applicable Vesting Conditions During Fiscal Year(c) | — | ||||
Add Value of Dividends or other Earnings Paid on Stock or Option Awards not Otherwise Reflected in Fair Value or Total Compensation | — | ||||
Compensation Actually Paid | 15,251,046 | ||||
a. | We have not reported any amounts in our Summary Compensation Table with respect to “Change in Pension and Nonqualified Deferred Compensation” and, accordingly, the adjustments with respect to such items prescribed by the pay-versus-performance rules are not relevant to our analysis and no adjustments have been made. |
b. | The amounts reflect the aggregate grant-date fair value reported in the “Stock Awards” and “Option Awards” columns in the Summary Compensation Table for the applicable year. |
c. | In accordance with Item 402(v) requirements, the fair values of unvested and outstanding equity awards to our PEO were remeasured as of the end of each fiscal year, and as of each vesting date, during the years displayed in the table above. We approached the determination of fair value in the same way as we historically have determined fair value and fair values as of each measurement date were determined using valuation assumptions and methodologies (including expected term, volatility, dividend yield, and risk-free interest rates) that are generally consistent with those used to estimate fair value at grant under US GAAP. See “Stock-Based Compensation” in the Notes to Consolidated Financial Statements contained in our Annual Report on Form 10-K for additional details. |
(4) | This figure is the average of the total compensation paid to our NEOs other than our PEO in each listed year, as shown in our Summary Compensation Table for such listed year. The names of the non-PEO NEOs in each year are listed in the table below. |
2021 | 2022 | 2023 | 2024 | 2025 | ||||||||||
Paul C. Carbone | Paul C. Carbone | Michael J. McMullen | Michael J. McMullen | Michael J. McMullen | ||||||||||
Bryan C. Barksdale | Michael J. McMullen | Bryan C. Barksdale | Martin H. Duff IV | Martin H. Duff IV | ||||||||||
Kirk A. Zambetti | Bryan C. Barksdale | S. Faiz Ahmad | Bryan C. Barksdale | Bryan C. Barksdale | ||||||||||
Hollie S. Castro | Kirk A. Zambetti | Martin H. Duff IV | S. Faiz Ahmad | |||||||||||
Hollie S. Castro | ||||||||||||||
S. Faiz Ahmad | ||||||||||||||
(5) | This figure is the average of compensation actually paid for our NEOs other than our PEO in each listed year. Compensation actually paid does not mean that these NEOs were actually paid those amounts in the listed year, but this is a dollar amount derived from the starting point of Summary Compensation Table total compensation under the methodology prescribed under the SEC’s rules as shown in the table below, with the indicated figures showing an average of such figure for all NEOs other than our PEO in each listed year. |
2025 ($) | |||||
Summary Compensation Table Total(a) | 1,558,205 | ||||
Subtract Grant Date Fair Value of Option Awards and Stock Awards Granted in Fiscal Year(b) | (842,590) | ||||
Add Fair Value at Fiscal Year-End of Outstanding and Unvested Option Awards and Stock Awards Granted in Fiscal Year(c) | 998,632 | ||||
Adjust for Change in Fair Value of Outstanding and Unvested Option Awards and Stock Awards Granted in Prior Fiscal Years(c) | 497,171 | ||||
Adjust for Fair Value at Vesting of Option Awards and Stock Awards Granted in Fiscal Year That Vested During Fiscal Year(c) | — | ||||
Adjust for Change in Fair Value as of Vesting Date of Option Awards and Stock Awards Granted in Prior Fiscal Years For Which Applicable Vesting Conditions Were Satisfied During Fiscal Year(c) | 143,476 | ||||
Subtract Fair Value as of Prior Fiscal Year-End of Option Awards and Stock Awards Granted in Prior Fiscal Years That Failed to Meet Applicable Vesting Conditions During Fiscal Year(c) | — | ||||
Add Value of Dividends or other Earnings Paid on Stock or Option Awards not Otherwise Reflected in Fair Value or Total Compensation | — | ||||
Compensation Actually Paid | 2,354,894 | ||||
(a) | We have not reported any amounts in our Summary Compensation Table with respect to “Change in Pension and Nonqualified Deferred Compensation” and, accordingly, the adjustments with respect to such items prescribed by the pay-versus-performance rules are not relevant to our analysis and no adjustments have been made. |
(b) | The amounts reflect the aggregate grant-date fair value reported in the “Stock Awards” and “Option Awards” columns in the Summary Compensation Table for the applicable year. |
(c) | In accordance with Item 402(v) requirements, the fair values of unvested and outstanding equity awards to our NEOs were remeasured as of the end of each fiscal year, and as of each vesting date, during the years displayed in the table above. We approached the determination of fair value in the same way as we historically have determined fair value and fair values as of each measurement date were determined using valuation assumptions and methodologies (including expected term, volatility, dividend yield, and risk-free interest rates) that are generally consistent with those used to estimate fair value at grant under US GAAP. See “Stock-Based Compensation” in the Notes to Consolidated Financial Statements contained in our Annual Report on Form 10-K for additional details. |
(6) | Total shareholder return is calculated by assuming that a $100 investment was made on the day prior to the first fiscal year reported below and that all dividends are reinvested until the last day of each reported fiscal year. |
(7) | The peer group used is the S&P 500 Apparel, Accessories & Luxury Goods Index, as used in YETI’s Stock Performance Graph in our annual report. Total shareholder return is calculated by assuming that a $100 investment was made on the day prior to the first fiscal year reported below and that all dividends are reinvested until the last day of each reported fiscal year. |
(8) | The dollar amounts reported are YETI’s net income reflected in YETI’s audited financial statements for the applicable year. |
(9) | In YETI’s assessment, Free Cash Flow is the financial performance measure that is the most important financial performance measure used by YETI in 2025 to link compensation actually paid to performance. Please see the Compensation Discussion and Analysis section above for a further discussion of Free Cash Flow and how it is utilized in our executive compensation program. |
(1) | Our PEO was Matthew J. Reintjes. |
(4) | This figure is the average of the total compensation paid to our NEOs other than our PEO in each listed year, as shown in our Summary Compensation Table for such listed year. The names of the non-PEO NEOs in each year are listed in the table below. |
2021 | 2022 | 2023 | 2024 | 2025 | ||||||||||
Paul C. Carbone | Paul C. Carbone | Michael J. McMullen | Michael J. McMullen | Michael J. McMullen | ||||||||||
Bryan C. Barksdale | Michael J. McMullen | Bryan C. Barksdale | Martin H. Duff IV | Martin H. Duff IV | ||||||||||
Kirk A. Zambetti | Bryan C. Barksdale | S. Faiz Ahmad | Bryan C. Barksdale | Bryan C. Barksdale | ||||||||||
Hollie S. Castro | Kirk A. Zambetti | Martin H. Duff IV | S. Faiz Ahmad | |||||||||||
Hollie S. Castro | ||||||||||||||
S. Faiz Ahmad | ||||||||||||||
(7) | The peer group used is the S&P 500 Apparel, Accessories & Luxury Goods Index, as used in YETI’s Stock Performance Graph in our annual report. Total shareholder return is calculated by assuming that a $100 investment was made on the day prior to the first fiscal year reported below and that all dividends are reinvested until the last day of each reported fiscal year. |
(3) | Compensation actually paid does not mean that our PEO was actually paid those amounts in the listed year, but this is a dollar amount derived from the starting point of summary compensation table total compensation under the methodology prescribed under the relevant rules as shown in the adjustment table below. |
2025 ($) | |||||
Summary Compensation Table Total(a) | 7,697,528 | ||||
Subtract Grant Date Fair Value of Option Awards and Stock Awards Granted in Fiscal Year(b) | (5,500,187) | ||||
Add Fair Value at Fiscal Year-End of Outstanding and Unvested Option Awards and Stock Awards Granted in Fiscal Year(c) | 6,533,798 | ||||
Adjust for Change in Fair Value of Outstanding and Unvested Option Awards and Stock Awards Granted in Prior Fiscal Years(c) | 5,639,393 | ||||
Adjust for Fair Value at Vesting of Option Awards and Stock Awards Granted in Fiscal Year That Vested During Fiscal Year(c) | — | ||||
Adjust for Change in Fair Value as of Vesting Date of Option Awards and Stock Awards Granted in Prior Fiscal Years For Which Applicable Vesting Conditions Were Satisfied During Fiscal Year(c) | 880,515 | ||||
Subtract Fair Value as of Prior Fiscal Year-End of Option Awards and Stock Awards Granted in Prior Fiscal Years That Failed to Meet Applicable Vesting Conditions During Fiscal Year(c) | — | ||||
Add Value of Dividends or other Earnings Paid on Stock or Option Awards not Otherwise Reflected in Fair Value or Total Compensation | — | ||||
Compensation Actually Paid | 15,251,046 | ||||
a. | We have not reported any amounts in our Summary Compensation Table with respect to “Change in Pension and Nonqualified Deferred Compensation” and, accordingly, the adjustments with respect to such items prescribed by the pay-versus-performance rules are not relevant to our analysis and no adjustments have been made. |
b. | The amounts reflect the aggregate grant-date fair value reported in the “Stock Awards” and “Option Awards” columns in the Summary Compensation Table for the applicable year. |
c. | In accordance with Item 402(v) requirements, the fair values of unvested and outstanding equity awards to our PEO were remeasured as of the end of each fiscal year, and as of each vesting date, during the years displayed in the table above. We approached the determination of fair value in the same way as we historically have determined fair value and fair values as of each measurement date were determined using valuation assumptions and methodologies (including expected term, volatility, dividend yield, and risk-free interest rates) that are generally consistent with those used to estimate fair value at grant under US GAAP. See “Stock-Based Compensation” in the Notes to Consolidated Financial Statements contained in our Annual Report on Form 10-K for additional details. |
(5) | This figure is the average of compensation actually paid for our NEOs other than our PEO in each listed year. Compensation actually paid does not mean that these NEOs were actually paid those amounts in the listed year, but this is a dollar amount derived from the starting point of Summary Compensation Table total compensation under the methodology prescribed under the SEC’s rules as shown in the table below, with the indicated figures showing an average of such figure for all NEOs other than our PEO in each listed year. |
2025 ($) | |||||
Summary Compensation Table Total(a) | 1,558,205 | ||||
Subtract Grant Date Fair Value of Option Awards and Stock Awards Granted in Fiscal Year(b) | (842,590) | ||||
Add Fair Value at Fiscal Year-End of Outstanding and Unvested Option Awards and Stock Awards Granted in Fiscal Year(c) | 998,632 | ||||
Adjust for Change in Fair Value of Outstanding and Unvested Option Awards and Stock Awards Granted in Prior Fiscal Years(c) | 497,171 | ||||
Adjust for Fair Value at Vesting of Option Awards and Stock Awards Granted in Fiscal Year That Vested During Fiscal Year(c) | — | ||||
Adjust for Change in Fair Value as of Vesting Date of Option Awards and Stock Awards Granted in Prior Fiscal Years For Which Applicable Vesting Conditions Were Satisfied During Fiscal Year(c) | 143,476 | ||||
Subtract Fair Value as of Prior Fiscal Year-End of Option Awards and Stock Awards Granted in Prior Fiscal Years That Failed to Meet Applicable Vesting Conditions During Fiscal Year(c) | — | ||||
Add Value of Dividends or other Earnings Paid on Stock or Option Awards not Otherwise Reflected in Fair Value or Total Compensation | — | ||||
Compensation Actually Paid | 2,354,894 | ||||
(a) | We have not reported any amounts in our Summary Compensation Table with respect to “Change in Pension and Nonqualified Deferred Compensation” and, accordingly, the adjustments with respect to such items prescribed by the pay-versus-performance rules are not relevant to our analysis and no adjustments have been made. |
(b) | The amounts reflect the aggregate grant-date fair value reported in the “Stock Awards” and “Option Awards” columns in the Summary Compensation Table for the applicable year. |
(c) | In accordance with Item 402(v) requirements, the fair values of unvested and outstanding equity awards to our NEOs were remeasured as of the end of each fiscal year, and as of each vesting date, during the years displayed in the table above. We approached the determination of fair value in the same way as we historically have determined fair value and fair values as of each measurement date were determined using valuation assumptions and methodologies (including expected term, volatility, dividend yield, and risk-free interest rates) that are generally consistent with those used to estimate fair value at grant under US GAAP. See “Stock-Based Compensation” in the Notes to Consolidated Financial Statements contained in our Annual Report on Form 10-K for additional details. |
Brief Disclosure of Valuation Assumptions
The assumptions used in calculating the fair value of the equity awards did not differ in any material respect from the assumptions used to calculate the grant date fair value of the awards as reported in the Summary Compensation Table, except that the fiscal 2023 PBRSUs and fiscal 2024 PBRSUs assumed a payout above target, while the grant date fair value calculations assumed a payout at target.
Tabular List of Performance Measures
The list below includes the four financial performance measures that in our assessment represent the most important financial performance measures used to link compensation actually paid to our NEOs, for 2025, to company performance.
Tabular List
• | Free Cash Flow |
• | Relative Total Shareholder Return (TSR) |
• | Adjusted Net Sales |
• | Adjusted Operating Income |