Pay vs Performance Disclosure - USD ($)
Dec. 31, 2025
Dec. 31, 2024
Dec. 31, 2023
Dec. 31, 2022
Dec. 31, 2021
Pay Versus Performance
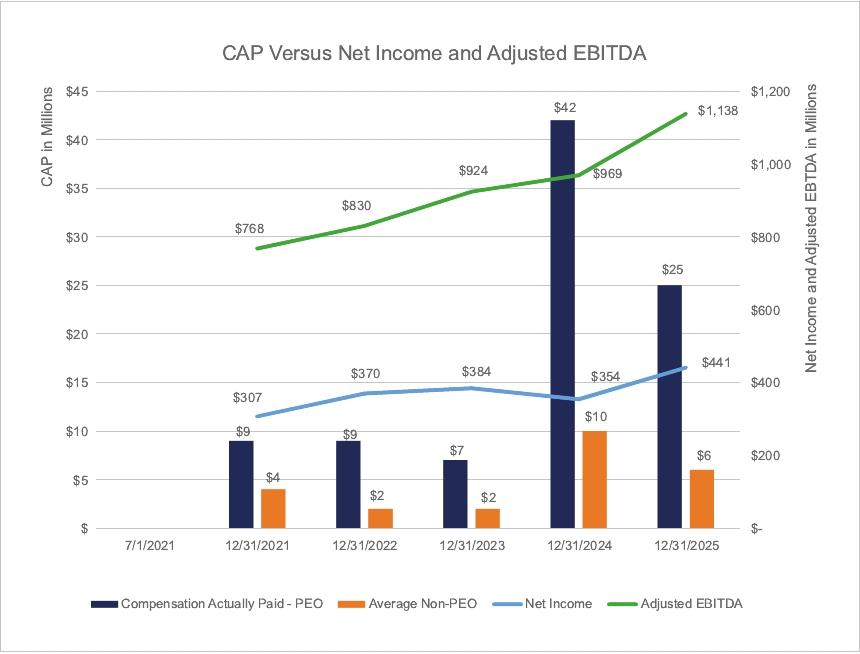
Below is information about the relationship between executive compensation actually paid (“CAP”) to our Named Executive Officers and our financial performance, as prepared in accordance with SEC rules. CAP is an amount calculated using methodology prescribed by SEC rules and differs from the compensation actually received by our Named Executive Officers and the compensation decisions described in the CD&A section above. For purposes of the Peer Group Total Stockholder Return column of the Pay Versus Performance Table, we have used the Standard & Poor’s 500 Index and Alerian Midstream Energy Index, which we also use for purposes of the Stock Performance Graph in our annual report on Form 10K.
Value of Initial Fixed $100 Investment Based On: | ||||||||||||||||||||||||||
Year | Summary Compensation Table Total for PEO | Compensation Actually Paid to PEO(1) | Average Summary Compensation Table Total for Non-PEO NEOs(2) | Average Compensation Actually Paid to Non-PEO NEOs*(2)(3) | Total Stockholder Return | Peer Group Total Stockholder Return(4) | Net Income (in millions) | Adjusted EBITDA (in millions)(5) | ||||||||||||||||||
2025 | $9,328,071 | $25,155,353 | $2,568,187 | $6,097,854 | 347.74 | 169.17 206.34 | $441 | $1,138 | ||||||||||||||||||
2024 | $9,045,802 | $41,721,736 | $2,877,021 | $10,101,501 | 280.16 | 143.52 196.66 | $354 | $969 | ||||||||||||||||||
2023 | $7,971,250 | $6,638,368 | $2,168,051 | $1,838,105 | 148.29 | 114.82 136.19 | $384 | $924 | ||||||||||||||||||
2022 | $6,824,382 | $8,597,154 | $1,797,738 | $2,215,617 | 141.56 | 90.94 118.56 | $370 | $830 | ||||||||||||||||||
2021 | $6,493,954 | $8,553,120 | $3,073,059 | $3,842,225 | 117.18 | 111.07 97.63 | $307 | $768 | ||||||||||||||||||
* | Net of forfeitures |
(1) | The following table sets forth the adjustments (i.e., amounts deducted and added) made to the PEO’s Summary Compensation Table Total to determine the CAP to the Principal Executive Officer (“PEO”) for 2025. The valuation methodology (including assumptions) used to determine the fair value of restricted stock unit awards for purposes of determining the CAP to the PEO is the same as set forth in footnote 2 to the Summary Compensation Table. For performance share awards, the grant date fair value of awards used for Summary Compensation Table calculations assumes target performance. To determine the year-end fair values used in the CAP calculations, we have updated the performance expectations to reflect the latest performance estimates for unvested and outstanding awards at each fiscal year end date. We have also recalculated the fair value of the Total Stockholder Return component of the performance share awards at each fiscal year end date. |
Summary Compensation Table (SCT) Total for PEO | Less Reported SCT Stock Award Value | Plus 12/31/25 Fair Value (FV) of Awards Granted in Fiscal Year | Plus Change in FV of Awards Granted Prior to 2025, Unvested as of 12/31/25 | Plus Change in FV of Awards Granted Prior to 2025 that Vested in Fiscal Year | Compensation Actually Paid to PEO | ||||||||||||
$9,328,071 | ($6,282,371) | $10,606,611 | $11,313,546 | $189,497 | $25,155,353 | ||||||||||||
(2) | For each year indicated, our non-PEO NEOs were: |
2025 | Christopher Zona Jeffrey Jewell Wendy Ellis Melissa Cox | ||||
2024 | Jeffrey Jewell Christopher Zona Wendy Ellis Melissa Cox | ||||
2023 | Jeffrey Jewell Christopher Zona Wendy Ellis Melissa Cox | ||||
2022 | Jeffrey Jewell Christopher Zona Wendy Ellis Melissa Cox Richard Redmond, Jr. | ||||
2021 | Jeffrey Jewell Christopher Zona Richard Redmond, Jr. Wendy Ellis | ||||
(3) | The following table sets forth the calculation of the average CAP to non-PEO Named Executive Officers and the adjustments (i.e., amounts deducted and added) made to the Summary Compensation Table Total of the relevant NEOs to determine the average CAP to the relevant Named Executive Officers for 2025. The valuation methodology (including assumptions) used to determine the fair value of equity awards for purposes of determining the average CAP to the Named Executive Officers is the same as set forth in footnote 2 to the Summary Compensation Table. For performance share awards, the grant date fair value of awards used for Summary Compensation Table calculations assumes target performance. To determine the year-end fair values used in the CAP calculations, we have updated the performance expectations to reflect the latest performance estimates for unvested and outstanding awards at each fiscal year end date. We have also recalculated the fair value of the Total Stockholder Return component of the performance share awards at each fiscal year end date. |
Summary Compensation Table (SCT) Total for Non- PEO NEOs | Less Reported SCT Stock Award Value | Plus 12/31/25 Fair Value (FV) of Awards Granted in Fiscal Year | Plus Change in FV of Awards Granted Prior to 2025, Unvested as of 12/31/25 | Plus Change in FV of Awards Granted Prior to 2025 that Vested in Fiscal Year* | Compensation Actually Paid to Non-PEO NEOs | ||||||||||||
$2,568,187 | ($1,235,803) | $2,156,214 | $2,515,467 | $93,790 | $6,097,854 | ||||||||||||
(4) | For purposes of our Peer Group Total Stockholder Return column of the Pay Versus Performance Table, we have used the Standard & Poor’s 500 Index (first number) and Alerian Midstream Energy Index (“AMNA Index”) (second number), which we also use for purposes of the Stock Performance Graph in our annual report on Form 10-K. We believe the AMNA Index is meaningful because it is an independent, objective view of the performance of similarly sized midstream energy companies. |
(5) | For 2025, 2024 and 2023, adjusted EBITDA reflected Company operating earnings before expenses for interest, taxes, depreciation and amortization, gains or losses from financing activities and includes the proportional share of net income (excluding interest, taxes, depreciation and amortization) from our equity method investees and excludes the proportional share of depreciation and amortization attributable to minority interests in our consolidated subsidiaries. |
For 2022, adjusted EBITDA reflected Company operating earnings before expenses for interest, taxes, depreciation and amortization, gains or losses from financing activities and includes the proportional share of net income (excluding taxes, depreciation and amortization from our equity method investees) and excludes the proportional share of depreciation and amortization attributable to minority interests in our consolidated subsidiaries. If adjusted EBITDA for 2022 was calculated in the same manner as 2025, 2024, and 2023, the result would have been $841 million.
(2) | For each year indicated, our non-PEO NEOs were: |
2025 | Christopher Zona Jeffrey Jewell Wendy Ellis Melissa Cox | ||||
2024 | Jeffrey Jewell Christopher Zona Wendy Ellis Melissa Cox | ||||
2023 | Jeffrey Jewell Christopher Zona Wendy Ellis Melissa Cox | ||||
2022 | Jeffrey Jewell Christopher Zona Wendy Ellis Melissa Cox Richard Redmond, Jr. | ||||
2021 | Jeffrey Jewell Christopher Zona Richard Redmond, Jr. Wendy Ellis | ||||
(4) | For purposes of our Peer Group Total Stockholder Return column of the Pay Versus Performance Table, we have used the Standard & Poor’s 500 Index (first number) and Alerian Midstream Energy Index (“AMNA Index”) (second number), which we also use for purposes of the Stock Performance Graph in our annual report on Form 10-K. We believe the AMNA Index is meaningful because it is an independent, objective view of the performance of similarly sized midstream energy companies. |
(1) | The following table sets forth the adjustments (i.e., amounts deducted and added) made to the PEO’s Summary Compensation Table Total to determine the CAP to the Principal Executive Officer (“PEO”) for 2025. The valuation methodology (including assumptions) used to determine the fair value of restricted stock unit awards for purposes of determining the CAP to the PEO is the same as set forth in footnote 2 to the Summary Compensation Table. For performance share awards, the grant date fair value of awards used for Summary Compensation Table calculations assumes target performance. To determine the year-end fair values used in the CAP calculations, we have updated the performance expectations to reflect the latest performance estimates for unvested and outstanding awards at each fiscal year end date. We have also recalculated the fair value of the Total Stockholder Return component of the performance share awards at each fiscal year end date. |
Summary Compensation Table (SCT) Total for PEO | Less Reported SCT Stock Award Value | Plus 12/31/25 Fair Value (FV) of Awards Granted in Fiscal Year | Plus Change in FV of Awards Granted Prior to 2025, Unvested as of 12/31/25 | Plus Change in FV of Awards Granted Prior to 2025 that Vested in Fiscal Year | Compensation Actually Paid to PEO | ||||||||||||
$9,328,071 | ($6,282,371) | $10,606,611 | $11,313,546 | $189,497 | $25,155,353 | ||||||||||||
(3) | The following table sets forth the calculation of the average CAP to non-PEO Named Executive Officers and the adjustments (i.e., amounts deducted and added) made to the Summary Compensation Table Total of the relevant NEOs to determine the average CAP to the relevant Named Executive Officers for 2025. The valuation methodology (including assumptions) used to determine the fair value of equity awards for purposes of determining the average CAP to the Named Executive Officers is the same as set forth in footnote 2 to the Summary Compensation Table. For performance share awards, the grant date fair value of awards used for Summary Compensation Table calculations assumes target performance. To determine the year-end fair values used in the CAP calculations, we have updated the performance expectations to reflect the latest performance estimates for unvested and outstanding awards at each fiscal year end date. We have also recalculated the fair value of the Total Stockholder Return component of the performance share awards at each fiscal year end date. |
Summary Compensation Table (SCT) Total for Non- PEO NEOs | Less Reported SCT Stock Award Value | Plus 12/31/25 Fair Value (FV) of Awards Granted in Fiscal Year | Plus Change in FV of Awards Granted Prior to 2025, Unvested as of 12/31/25 | Plus Change in FV of Awards Granted Prior to 2025 that Vested in Fiscal Year* | Compensation Actually Paid to Non-PEO NEOs | ||||||||||||
$2,568,187 | ($1,235,803) | $2,156,214 | $2,515,467 | $93,790 | $6,097,854 | ||||||||||||
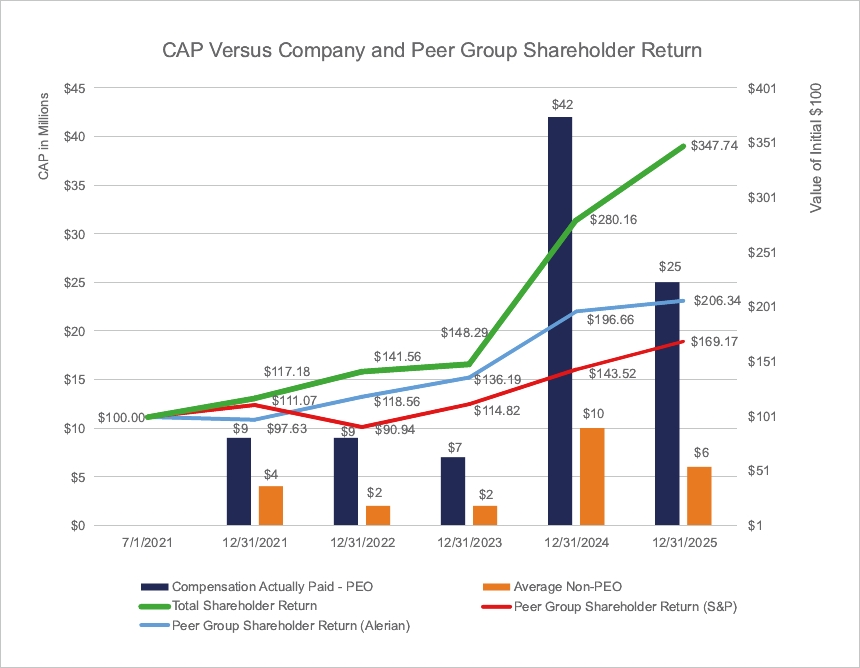
For purposes of our Peer Group Total Stockholder Return, we have used both the Standard & Poor’s 500 Index and AMNA Index. We use both indices for purposes of the Stock Performance Graph in our annual report on Form 10-K. We believe the AMNA Index is meaningful because it is an independent, objective view of the performance of similarly sized midstream energy companies. The Total Stockholder Return values are measured from July 1, 2021, the date that DT Midstream became an independent, publicly traded company.
For purposes of our Peer Group Total Stockholder Return, we have used both the Standard & Poor’s 500 Index and AMNA Index. We use both indices for purposes of the Stock Performance Graph in our annual report on Form 10-K. We believe the AMNA Index is meaningful because it is an independent, objective view of the performance of similarly sized midstream energy companies. The Total Stockholder Return values are measured from July 1, 2021, the date that DT Midstream became an independent, publicly traded company.
Tabular List
The following tabular list sets forth those measures, which, in our assessment, represent the three financial performance measures and the three non-financial performance measures that we use to link the compensation paid to our Named Executive Officers for fiscal year 2025 to Company performance.
Financial Performance Measures | ||
Adjusted EBITDA | ||
Leverage Ratio | ||
Relative TSR | ||
Non-Financial Performance Measures | ||
Business Development | ||
Operating Performance | ||
OSHA Recordable Incident Rate | ||