Pay vs Performance Disclosure - USD ($)
Dec. 31, 2025
Dec. 31, 2024
Dec. 31, 2023
Dec. 31, 2022
Dec. 31, 2021
Dec. 31, 2020
PAY VERSUS PERFORMANCE
The following table reflects, for the last three fiscal years, the total compensation paid to our named executive officers as reflected in our Summary Compensation Table (the “SCT”), “compensation actually paid” to our named executed officers (as determined in accordance with applicable rules), our total shareholder return (“TSR”), our peer group and our net income.
The information provided under the heading “Pay versus Performance” shall not be considered “filed” for purposes of Section 18 of the Securities Exchange Act of 1934, as amended, or incorporated by reference in any filing under the Securities Act of 1933, as amended, or the Securities Exchange Act of 1934, as amended, except to the extent that we specifically incorporate it by reference into a filing.
Year(1) | Summary Compensation Table Total for Principal Executive Officer ($)(2) | Compensation Actually Paid to Principal Executive Officer ($)(3) | Average Summary Compensation Table Total for Non-Principal Executive Officer - NEOs ($)(4) | Average Compensation Actually Paid to Non-Principal Executive Officer - NEOs ($)(5) | Value of Initial Fixed $100 Investment Based On: | Net Income (in thousands) ($)(8) | Adjusted EBITDA (in thousands) ($)(9) | |||||||||||||||||||
Total Shareholder Return ($)(6) | Peer Group Total Shareholder Return ($) (7) | |||||||||||||||||||||||||
2025 | 3,999,717 | 6,386,112 | 1,364,117 | 1,958,606 | 372 | 216 | 19,998 | 67,134 | ||||||||||||||||||
2024 | 2,557,645 | 4,365,629 | 1,206,672 | 1,904,289 | 243 | 208 | 9,891 | 42,312 | ||||||||||||||||||
2023 | 2,458,683 | 4,021,370 | 1,074,279 | 1,687,803 | 154 | 140 | 25,997 | 26,500 | ||||||||||||||||||
2022 | 1,740,984 | 842,209 | 824,827 | 386,446 | 89 | 115 | 12,634 | 28,167 | ||||||||||||||||||
2021 | 1,693,608 | 1,996,032 | 883,425 | 1,064,992 | 115 | 112 | 34,718 | 38,065 | ||||||||||||||||||
(1) | Due to the Company’s prior status as a smaller reporting company, for years 2021-2024, the table reflects Principal Executive Officer Mr. Shaw, and two Non-Principal Executive Officer NEOs: Messrs. Meyers and Mr. Nyce. For 2025, the table reflects Principal Executive Officer Mr. Shaw, Principal Financial Officer Mr. Meyers, and three Non-Principal Executive Officer NEOs: Messrs. Meyers, Nyce, Ace and Ms. Luster. |
(2) | The dollar amounts reported are the amounts of total compensation reported for Scott M. Shaw, our President and Chief Executive Officer, recognized as our Principal Executive Officer for these purposes for each corresponding year in the “Total” column of the Summary Compensation Table. |
(3) | The dollar amounts reported represent the amount of “compensation actually paid” to Mr. Shaw, as computed in accordance with Item 402(v) of Regulation S-K, which reflects adjustments made to Mr. Shaw’s total compensation for each year to determine the “compensation actually paid”. Mr. Shaw holds no stock options, no awards were modified during the year, and no dividends or other earnings were paid during the year prior to the vesting date of an award. |
(4) | The dollar amounts reported represent the average of the amounts reported for our named executive officers (NEOs), excluding Mr. Shaw, in the “Total” column of the Summary Compensation Table for each corresponding year. |
(5) | The dollar amounts reported represent the average of the amounts of “compensation actually paid” to our NEOs, excluding Mr. Shaw, as computed in accordance with Item 402(v) of Regulation S-K, which reflects adjustments made to our NEOs’ total compensation, excluding Mr. Shaw, for each year, to determine the “compensation actually paid”. The NEOs do not hold any options, no awards were modified during the year, and no dividends or other earnings were paid during the year prior to the vesting date of an award. |
(6) | The dollar amounts reported represent the value of an initial fixed investment of $100 and are calculated by dividing the sum of (i) the cumulative amount of dividends for the measurement period, assuming dividend reinvestment, and (ii) the difference between the closing stock price of the Company’s Common Stock at the end and at the beginning of the measurement period, by the closing stock price of our Common Stock at the beginning of the measurement period. The closing stock price of the Company’s Common Stock on the last trading day in December in each of 2025-2020 was $24.15, $15.82, $10.04, $5.79, $7.47 and $6.50 respectively. There were no dividends in any of such years. |
(7) | For purposes of the Pay Versus Performance disclosure, the Company utilized the same peer group used by the Compensation Committee in evaluating executive compensation decisions, subject to the exclusion of two companies that were not publicly traded as of December 31, 2020, the measurement date required for purposes of calculating cumulative total shareholder return. The peer group consists of American Public Education, Inc.; Franklin Convery Co.; Grand Canyon Education, Inc.; Perdoceo Education Corporation; Strategic Education, Inc.; and Universal Technical Institute, Inc. |
(8) | The amounts reported represent net income as reflected in the Company’s Consolidated Audited Financial Statements for each applicable year. |
(9) | The amounts reported represent adjusted EBITDA for each applicable year, which was used in determining the level of achievement for cash and equity incentive awards. |
The following table reconciles total compensation per the SCT compared with “compensation actually paid” to the Principal Executive Officer:
Adjustments to Determine “Compensation Actually Paid” to the Principal Executive Officer | |||||||||||||||||||||||
Year | Total Compensation Per SCT ($) | Deduct Amounts Reported as Stock Awards in SCT ($) | Add Year-end Value of Unvested Equity Awards Granted in Year ($) | Change in Value of Unvested Equity Awards Granted in Prior Years ($) | Change in Value of Equity Awards Granted in Prior Years Which Vested in Year ($) | Deduct Prior Year-end Fair Value of Awards Granted in Prior Years That Failed to Meet the Vesting Conditions in Year ($) | Total Compensation Actually Paid ($) | ||||||||||||||||
2025 | 3,999,717 | (2,200,000) | 2,954,946 | 1,234,473 | 396,977 | — | 6,386,112 | ||||||||||||||||
2024 | 2,557,645 | (1,200,000) | 1,973,387 | 1,042,504 | (7,907) | — | 4,365,629 | ||||||||||||||||
2023 | 2,458,683 | (1,200,000) | 1,959,025 | 777,380 | 26,282 | — | 4,021,370 | ||||||||||||||||
2022 | 1,740,984 | (1,100,000) | 873,665 | (264,053) | (6,979) | (401,408) | 842,209 | ||||||||||||||||
2021 | 1,693,608 | (500,000) | 640,652 | 180,699 | (18,927) | — | 1,996,032 | ||||||||||||||||
The following table reconciles total compensation per the SCT compared with “compensation actually paid” to the Non-Principal Executive Officer NEOs:
Adjustments to Determine Average “Compensation Actually Paid” to the Non-Principal Executive Officer NEOs | |||||||||||||||||||||||
Year | Average Compensation Per SCT ($) | Deduct Amounts Reported as Stock Awards in SCT ($) | Add Year-end Value of Unvested Equity Awards Granted in Year ($) | Change in Value of Unvested Equity Awards Granted in Prior Years ($) | Change in Value of Equity Awards Granted in Prior Years Which Vested in Year ($) | Deduct Prior Year-end Fair Value of Awards Granted in Prior Years That Failed to Meet the Vesting Conditions in Year ($) | Average Compensation Actually Paid ($) | ||||||||||||||||
2025 | 1,364,117 | (562,500) | 755,521 | 304,553 | 96,915 | — | 1,958,606 | ||||||||||||||||
2024 | 1,206,672 | (500,000) | 822,260 | 378,587 | (3,231) | — | 1,904,289 | ||||||||||||||||
2023 | 1,074,279 | (425,000) | 693,814 | 327,968 | 16,742 | — | 1,687,803 | ||||||||||||||||
2022 | 824,827 | (425,000) | 337,552 | (165,627) | (5,948) | (179,358) | 386,446 | ||||||||||||||||
2021 | 883,425 | (250,000) | 320,326 | 118,731 | (7,490) | — | 1,064,992 | ||||||||||||||||
(1) | Due to the Company’s prior status as a smaller reporting company, for years 2021-2024, the table reflects Principal Executive Officer Mr. Shaw, and two Non-Principal Executive Officer NEOs: Messrs. Meyers and Mr. Nyce. For 2025, the table reflects Principal Executive Officer Mr. Shaw, Principal Financial Officer Mr. Meyers, and three Non-Principal Executive Officer NEOs: Messrs. Meyers, Nyce, Ace and Ms. Luster. |
(7) | For purposes of the Pay Versus Performance disclosure, the Company utilized the same peer group used by the Compensation Committee in evaluating executive compensation decisions, subject to the exclusion of two companies that were not publicly traded as of December 31, 2020, the measurement date required for purposes of calculating cumulative total shareholder return. The peer group consists of American Public Education, Inc.; Franklin Convery Co.; Grand Canyon Education, Inc.; Perdoceo Education Corporation; Strategic Education, Inc.; and Universal Technical Institute, Inc. |
The following table reconciles total compensation per the SCT compared with “compensation actually paid” to the Principal Executive Officer:
Adjustments to Determine “Compensation Actually Paid” to the Principal Executive Officer | |||||||||||||||||||||||
Year | Total Compensation Per SCT ($) | Deduct Amounts Reported as Stock Awards in SCT ($) | Add Year-end Value of Unvested Equity Awards Granted in Year ($) | Change in Value of Unvested Equity Awards Granted in Prior Years ($) | Change in Value of Equity Awards Granted in Prior Years Which Vested in Year ($) | Deduct Prior Year-end Fair Value of Awards Granted in Prior Years That Failed to Meet the Vesting Conditions in Year ($) | Total Compensation Actually Paid ($) | ||||||||||||||||
2025 | 3,999,717 | (2,200,000) | 2,954,946 | 1,234,473 | 396,977 | — | 6,386,112 | ||||||||||||||||
2024 | 2,557,645 | (1,200,000) | 1,973,387 | 1,042,504 | (7,907) | — | 4,365,629 | ||||||||||||||||
2023 | 2,458,683 | (1,200,000) | 1,959,025 | 777,380 | 26,282 | — | 4,021,370 | ||||||||||||||||
2022 | 1,740,984 | (1,100,000) | 873,665 | (264,053) | (6,979) | (401,408) | 842,209 | ||||||||||||||||
2021 | 1,693,608 | (500,000) | 640,652 | 180,699 | (18,927) | — | 1,996,032 | ||||||||||||||||
The following table reconciles total compensation per the SCT compared with “compensation actually paid” to the Non-Principal Executive Officer NEOs:
Adjustments to Determine Average “Compensation Actually Paid” to the Non-Principal Executive Officer NEOs | |||||||||||||||||||||||
Year | Average Compensation Per SCT ($) | Deduct Amounts Reported as Stock Awards in SCT ($) | Add Year-end Value of Unvested Equity Awards Granted in Year ($) | Change in Value of Unvested Equity Awards Granted in Prior Years ($) | Change in Value of Equity Awards Granted in Prior Years Which Vested in Year ($) | Deduct Prior Year-end Fair Value of Awards Granted in Prior Years That Failed to Meet the Vesting Conditions in Year ($) | Average Compensation Actually Paid ($) | ||||||||||||||||
2025 | 1,364,117 | (562,500) | 755,521 | 304,553 | 96,915 | — | 1,958,606 | ||||||||||||||||
2024 | 1,206,672 | (500,000) | 822,260 | 378,587 | (3,231) | — | 1,904,289 | ||||||||||||||||
2023 | 1,074,279 | (425,000) | 693,814 | 327,968 | 16,742 | — | 1,687,803 | ||||||||||||||||
2022 | 824,827 | (425,000) | 337,552 | (165,627) | (5,948) | (179,358) | 386,446 | ||||||||||||||||
2021 | 883,425 | (250,000) | 320,326 | 118,731 | (7,490) | — | 1,064,992 | ||||||||||||||||
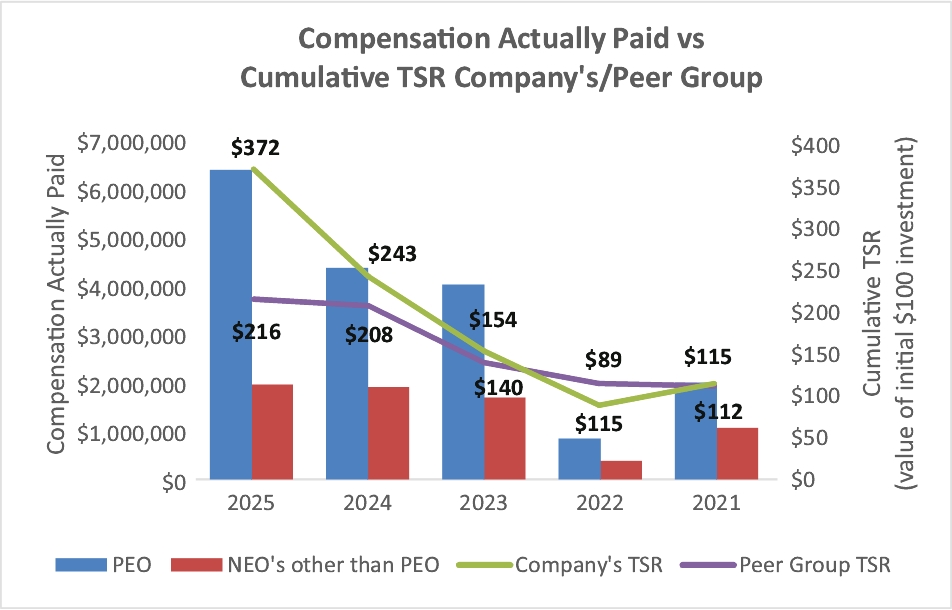
Compensation Actually Paid and Cumulative Total Shareholder Return
The following graph provides a description of the relationship between the amount of “compensation actually paid” to Mr. Shaw and the average amount of “compensation actually paid” to the Company’s NEOs as a group (excluding Mr. Shaw) to the Company’s Cumulative Total Shareholder Return (“TSR”) and the Peer Group cumulative TSR over the five years presented in the Pay Versus Performance table:
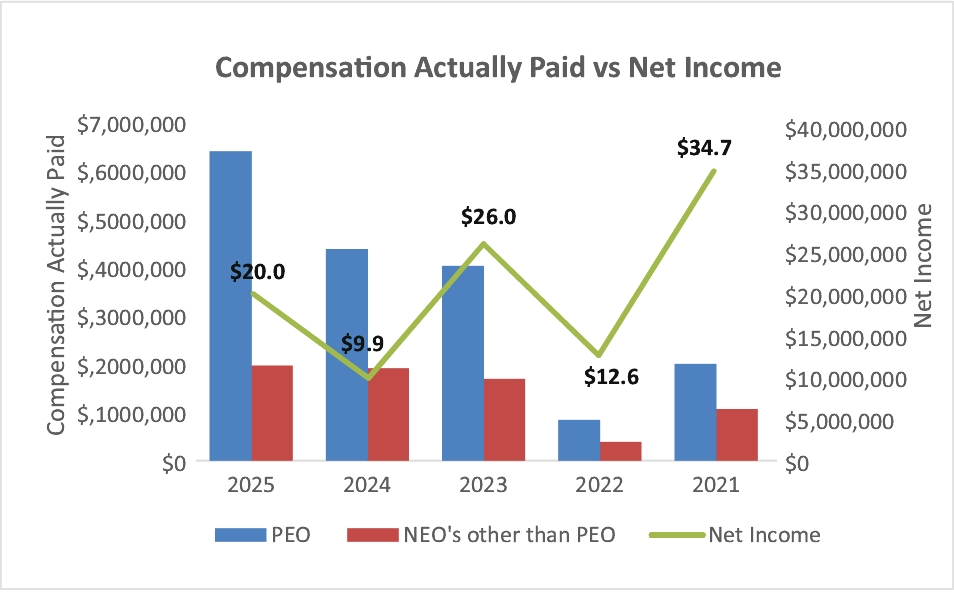
Compensation Actually Paid and Net Income
The following graph provides a description of the relationship between the amount of “compensation actually paid” to Mr. Shaw and the average amount of “compensation actually paid” to the Company’s NEOs as a group (excluding Mr. Shaw) to the Company’s net income over the five years presented in the Pay Versus Performance table:
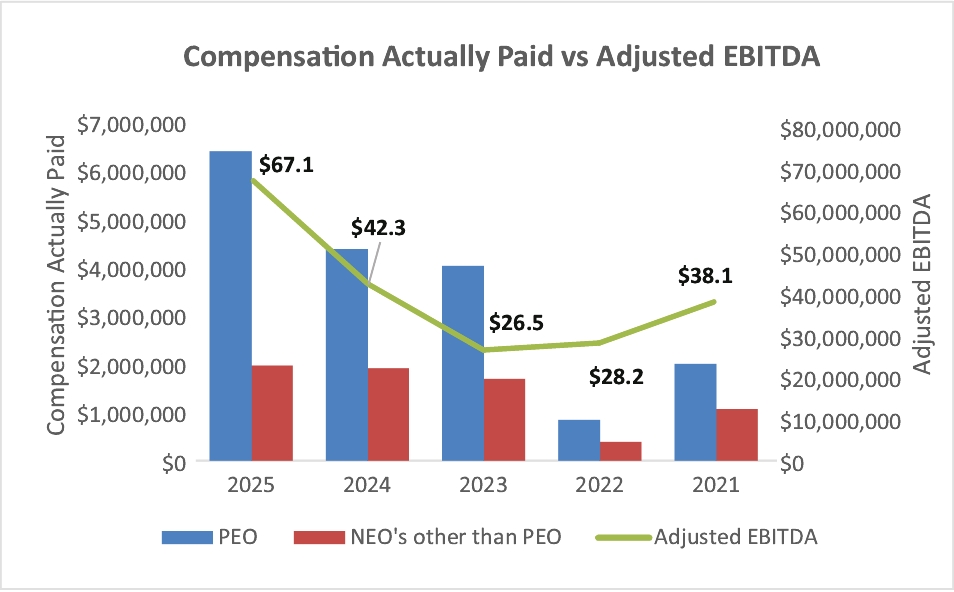
Compensation Actually Paid and Adjusted EBITDA
The following graph provides a description of the relationship between the amount of “compensation actually paid” to Mr. Shaw and the average amount of “compensation actually paid” to the Company’s NEOs as a group (excluding Mr. Shaw) to the Company’s net income over the five years presented in the Pay Versus Performance table:
Compensation Actually Paid and Cumulative Total Shareholder Return
The following graph provides a description of the relationship between the amount of “compensation actually paid” to Mr. Shaw and the average amount of “compensation actually paid” to the Company’s NEOs as a group (excluding Mr. Shaw) to the Company’s Cumulative Total Shareholder Return (“TSR”) and the Peer Group cumulative TSR over the five years presented in the Pay Versus Performance table:
Tabular List of Financial Performance Measures
In our assessment, the two financial performance measures used to link compensation actually paid (“CAP”), as calculated in accordance with SEC rules, to our named executive officers (“NEOs”) for fiscal year 2025 performance were:
• | Revenue |
• | Adjusted EBITDA |
These represent the two financial performance measures that we determined were most important in assessing Company performance for purposes of executive compensation for fiscal year 2025.
In addition to the financial performance measures identified above, the Company also used an operational measure — student placement — in determining compensation outcomes for our NEOs.
Analysis of the Information Presented in the Pay Versus Performance Tables
Relationship Between CAP and Selected Financial Performance Measures
The Company’s key financial performance measures for executive compensation purposes are revenue and adjusted EBITDA, which are directly linked to annual cash and long-term equity incentive awards. Over the period presented, revenue and adjusted EBITDA experienced moderate volatility in 2021 and 2022, followed by stronger growth from 2023 through 2025.
CAP generally aligned with these trends:
• | In 2021 and 2022, when revenue and adjusted EBITDA growth was mixed, CAP outcomes were moderated, reflecting incentive results tied to financial performance. |
• | In 2023–2025, as revenue and adjusted EBITDA improved substantially, CAP increased, consistent with achievement of performance-based targets. |
Because CAP also includes multi-year performance-based equity awards influenced by stock price, alignment with financial performance is most apparent over multiple years. Overall, the Company believes that CAP demonstrates a clear relationship with both key financial objectives and long-term shareholder value creation.
Relationship between Compensation Actually Paid and Company’s TSR/Peer Group TSR
As described in more detail in the section “Compensation Discussion and Analysis,” the Company’s executive compensation program is comprised of a variety of components including a performance-based approach. While the Company utilizes several performance metrics to align executive compensation with Company performance, not all of these are covered by the Pay Versus Performance table. Further, while the Company seeks to incentivize long-term performance, this is not necessarily aligned with “compensation actually paid” (as computed in accordance with Item 402(v) of Regulation S-K) for a particular year. In accordance with Item 402(v) of Regulation S-K, the Company describes below the relationship between Compensation Actually Paid (“CAP”) to our Principal Executive Officer and other NEOs and (i) the Company’s cumulative Total Shareholder Return (“TSR”) and (ii) the cumulative TSR of our peer group.
Over the five-year period presented, the Company’s cumulative TSR increased significantly, with a $100 investment on December 31, 2020 growing to approximately $371.75 by December 31, 2025. This compares to cumulative peer group TSR over the same period, which increased a $100 investment to approximately $216.23. The Company’s TSR reflects volatility in 2021 and 2022, followed by substantial stock price appreciation from 2023 through 2025.
CAP to our Principal Executive Officer and the average CAP to our other NEOs generally tracked these performance trends. In periods of stock price decline, CAP was lower due to reduced equity award valuations and incentive outcomes. Conversely, as the Company’s stock price appreciated significantly from 2023 through 2025, CAP increased, reflecting higher valuations of outstanding equity awards and performance-based compensation results.
The Company’s cumulative TSR outperformed the cumulative TSR of the peer group over the measurement period. CAP outcomes during the later years of the period reflect this relative outperformance, consistent with the design of our compensation program, which emphasizes long-term shareholder value creation and includes a significant proportion of performance-based and equity-based compensation.
Accordingly, the Company believes that CAP, as calculated under SEC rules, demonstrates alignment between executive compensation and both absolute and relative TSR performance over the periods presented.