Pay vs Performance Disclosure - USD ($)
|
12 Months Ended |
Dec. 27, 2025 |
Dec. 28, 2024 |
Dec. 30, 2023 |
Dec. 31, 2022 |
Dec. 25, 2021 |
| Pay vs Performance Disclosure [Table] |
|
|
|
|
|
| Pay vs Performance Disclosure, Table |
—
PAY VERSUS PERFORMANCE TABLE
| | |
| |
| |
| |
| |
Value of Initial Fixed $100
Investment Based on: | |
| |
|
| Year (a) | |
Summary
Compensation
Table Total for
PEO ($)
(b) | |
Compensation
Actually
Paid to
PEO ($)
(c) | |
Average
Summary
Compensation
Total for
Non-PEO
NEOs ($)
(d) | |
Average
Compensation
Actually Paid
to Non-PEO
NEOs ($)
(e) | |
Total
Shareholder
Return ($)
(f) | |
Dow Jones
US Building
Materials
& Fixtures
Index
($)
(g) | |
Net
Income
($ 000’s)
(h) | |
Operating
Income
($000’s)
(i) |
| 2025 | |
27,562,773 | |
74,143,373 | |
3,605,088 | |
8,254,338 | |
146 | |
105 | |
765,191 | |
958,542 |
| 2024 | |
22,786,901 | |
71,942,284 | |
4,331,256 | |
11,277,634 | |
172 | |
119 | |
604,879 | |
770,389 |
| 2023 | |
19,464,383 | |
51,277,489 | |
3,793,208 | |
8,362,951 | |
161 | |
137 | |
602,897 | |
756,053 |
| 2022 | |
34,994,079 | |
39,921,017 | |
4,286,027 | |
5,542,672 | |
104 | |
74 | |
658,316 | |
877,149 |
| 2021 | |
10,841,767 | |
21,073,541 | |
2,482,800 | |
4,483,255 | |
170 | |
144 | |
468,520 | |
655,845 |
|
|
|
|
|
| Company Selected Measure Name |
operating income
|
|
|
|
|
| Named Executive Officers, Footnote |
Column (b). Reflects compensation
amounts reported in the “Summary Compensation Table” for our CEO, Mr. Christopher, for the respective years shown.
|
|
|
|
|
| Peer Group Issuers, Footnote |
Column (g). For the relevant fiscal
year, represents the TSR of the Dow Jones U.S. Building Materials & Fixtures index ending on each of December 27, 2025,
December 28, 2024, December 30, 2023, December 31, 2022 and December 25, 2021.
|
|
|
|
|
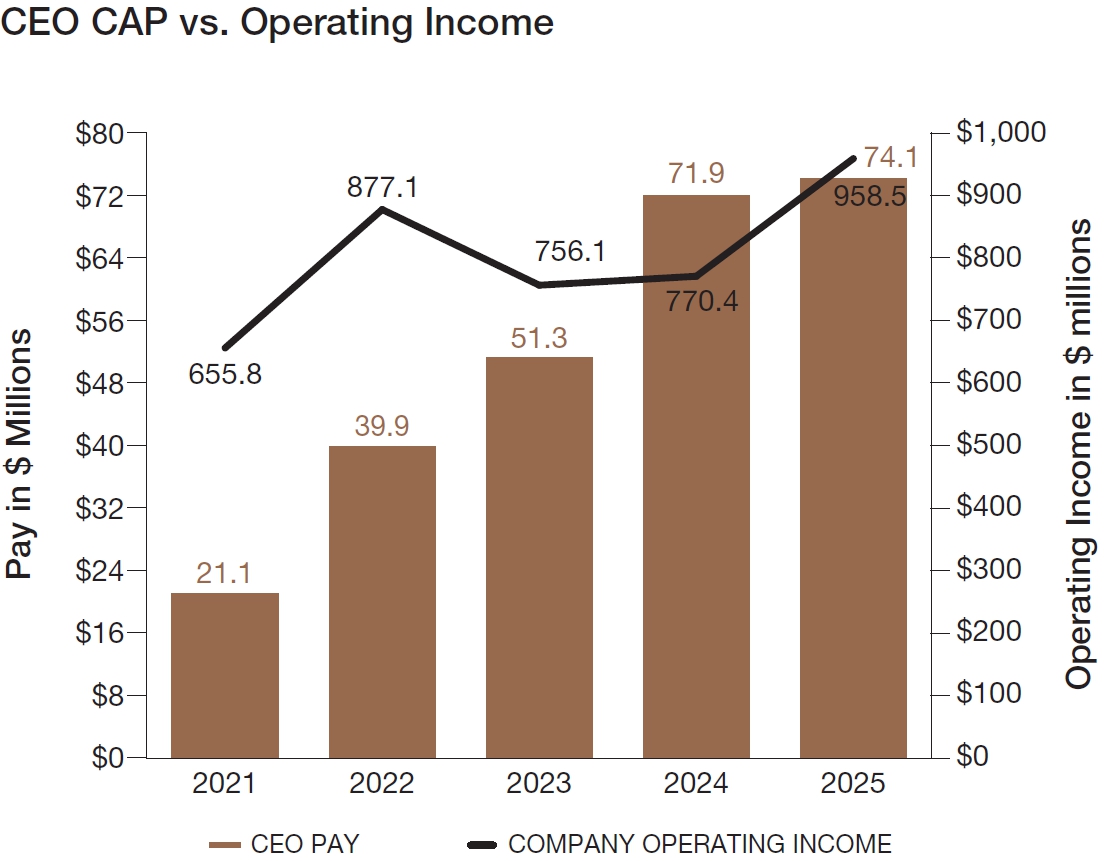
| PEO Total Compensation Amount |
$ 27,562,773
|
$ 22,786,901
|
$ 19,464,383
|
$ 34,994,079
|
$ 10,841,767
|
| PEO Actually Paid Compensation Amount |
$ 74,143,373
|
71,942,284
|
51,277,489
|
39,921,017
|
21,073,541
|
| Adjustment To PEO Compensation, Footnote |
Column (c). “Compensation actually
paid” to our CEO in each year from 2021-2025 reflects the respective amounts set forth in column (b) of the table above,
adjusted as set forth in the table below, as determined in accordance with SEC rules. For awards with dividend rights, these amounts
are paid in cash once the underlying award vests, and are incorporated as applicable in the table below. The dollar amounts reflected
in column (b) of the above do not reflect the actual amount of compensation earned by or paid to our CEO during the applicable
year. For information regarding the decisions made by our Compensation and Personnel Development Committee with respect to the
CEO’s compensation for each fiscal year, please see the Compensation Discussion and Analysis sections of the proxy statements
reporting pay for the fiscal years covered in the table above.
| |
Year | |
2021 | |
2022 | |
2023 | |
2024 | |
2025 |
|
| |
CEO | |
Mr. Christopher | |
Mr. Christopher | |
Mr. Christopher | |
Mr. Christopher | |
Mr. Christopher |
|
| |
SCT Total Compensation ($) | |
10,841,767 | |
34,994,079 | |
19,464,383 | |
22,786,901 | |
27,562,773 |
|
| |
Less: Stock and Option Award Values Reported in SCT for the Covered Year ($) | |
(3,259,125 | ) |
(25,825,500 | ) |
(10,161,450 | ) |
(12,903,000 | ) |
(15,227,100 |
) |
| |
Plus: Fair Value for Stock and Option Awards Granted in the Covered Year ($) | |
4,425,375 | |
23,595,500 | |
12,866,850 | |
16,079,000 | |
21,311,100 |
|
| |
Change in Fair Value of Outstanding Unvested Stock and Option Awards from Prior Years ($) | |
8,483,199 | |
6,564,886 | |
25,375,159 | |
36,818,739 | |
37,733,000 |
|
| |
Change in Fair Value of Stock and Option Awards from Prior Years that Vested in the Covered Year ($) | |
582,325 | |
592,052 | |
3,732,547 | |
9,160,644 | |
2,763,600 |
|
| |
Less: Fair Value of Stock and Option Awards Forfeited during the Covered Year ($) | |
— | |
— | |
— | |
— | |
— |
|
| |
Less: Aggregate Change in Actuarial Present Value of Accumulated Benefit Under Pension Plans ($) | |
— | |
— | |
— | |
— | |
— |
|
| |
Plus: Aggregate Service Cost and Prior Service Cost for Pension Plans ($) | |
— | |
— | |
— | |
— | |
— |
|
| |
Compensation Actually Paid ($) | |
21,073,541 | |
39,921,017 | |
51,277,489 | |
71,942,284 | |
74,143,373 |
|
|
|
|
|
|
| Non-PEO NEO Average Total Compensation Amount |
$ 3,605,088
|
4,331,256
|
3,793,208
|
4,286,027
|
2,482,800
|
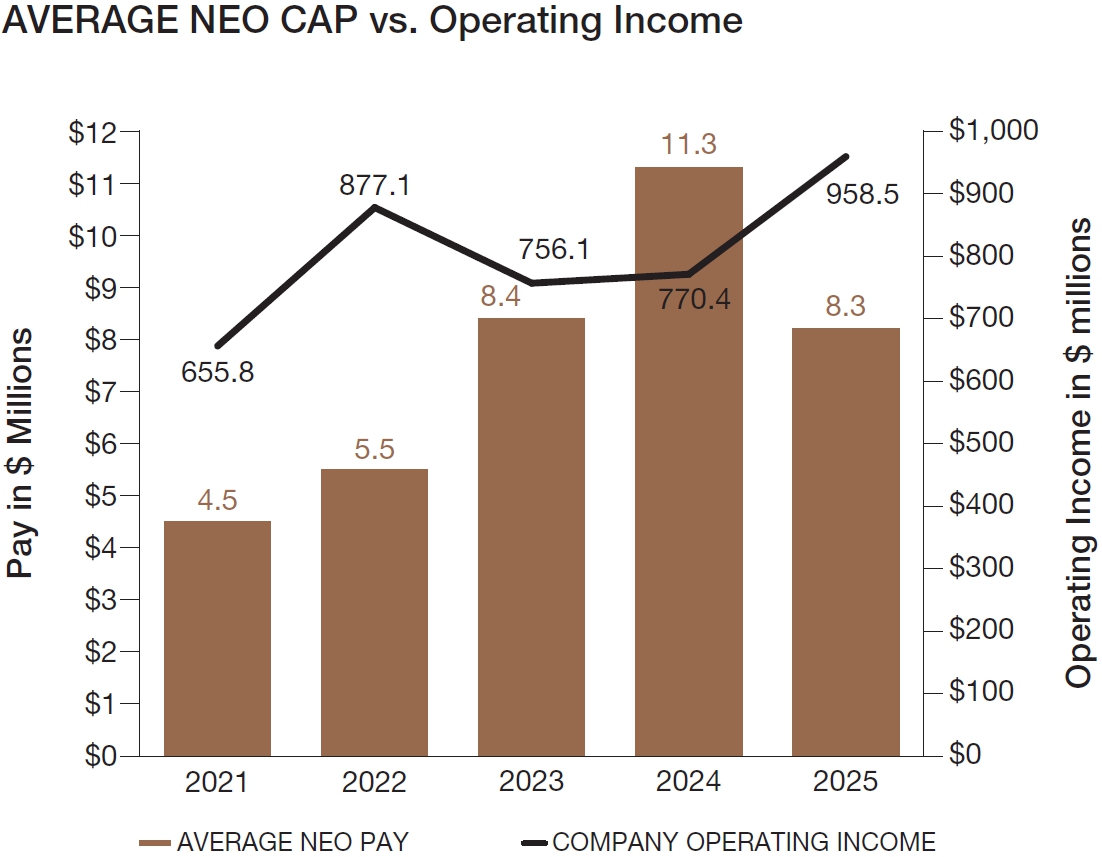
| Non-PEO NEO Average Compensation Actually Paid Amount |
$ 8,254,338
|
11,277,634
|
8,362,951
|
5,542,672
|
4,483,255
|
| Adjustment to Non-PEO NEO Compensation Footnote |
Column (e). Average “compensation
actually paid” for our non-CEO NEOs in each year from 2021-2025 reflects the respective amounts set forth in column (d) of
the table above, adjusted as set forth in the table below, as determined in accordance with SEC rules. For awards with dividend
rights, these amounts are paid in cash once the underlying award vests, and are incorporated as applicable in the table below.
The dollar amounts reflected in column (d) of the above do not reflect the actual amount of compensation earned by or paid to our
non-CEO NEOs during the applicable year. For information regarding the decisions made by our Compensation and Personnel Development
Committee with respect to our non-CEO NEOs’ compensation for each fiscal year, please see the Compensation Discussion and
Analysis sections of the proxy statements reporting pay for the fiscal years covered in the table above.
| |
Year | |
2021 Average | |
2022 Average | |
2023 Average | |
2024 Average | |
2025 Average |
|
| |
Non-CEO NEOs | |
See column (d)
note | |
See column (d)
note | |
See column (d)
note | |
See column (d)
note | |
See column (d)
note |
|
| |
SCT Total Compensation ($) | |
2,482,800 | |
4,286,027 | |
3,793,208 | |
4,331,256 | |
3,605,088 |
|
| |
Less: Stock and Option Award Values Reported in SCT for the Covered Year $) | |
(753,220 | ) |
(2,410,888 | ) |
(1,906,840 | ) |
(2,128,995 | ) |
(1,720,098 |
) |
| |
Plus: Fair Value for Stock and Option Awards Granted in the Covered Year ($) | |
1,022,753 | |
2,109,505 | |
2,414,520 | |
2,653,035 | |
2,407,365 |
|
| |
Change in Fair Value of Outstanding Unvested Stock and Option Awards from Prior Years ($) | |
1,511,873 | |
1,481,643 | |
3,362,068 | |
4,549,633 | |
3,254,633 |
|
| |
Change in Fair Value of Stock and Option Awards from Prior Years that Vested in the Covered Year ($) | |
219,049 | |
76,385 | |
699,995 | |
1,872,705 | |
707,350 |
|
| |
Less: Fair Value of Stock and Option Awards Forfeited during the Covered Year ($) | |
— | |
— | |
— | |
— | |
— |
|
| |
Less: Aggregate Change in Actuarial Present Value of Accumulated Benefit Under Pension Plans ($) | |
— | |
— | |
— | |
— | |
— |
|
| |
Plus: Aggregate Service Cost and Prior Service Cost for Pension Plans ($) | |
— | |
— | |
— | |
— | |
— |
|
| |
Compensation Actually Paid ($) | |
4,483,255 | |
5,542,672 | |
8,362,951 | |
11,277,634 | |
8,254,338 |
|
|
|
|
|
|
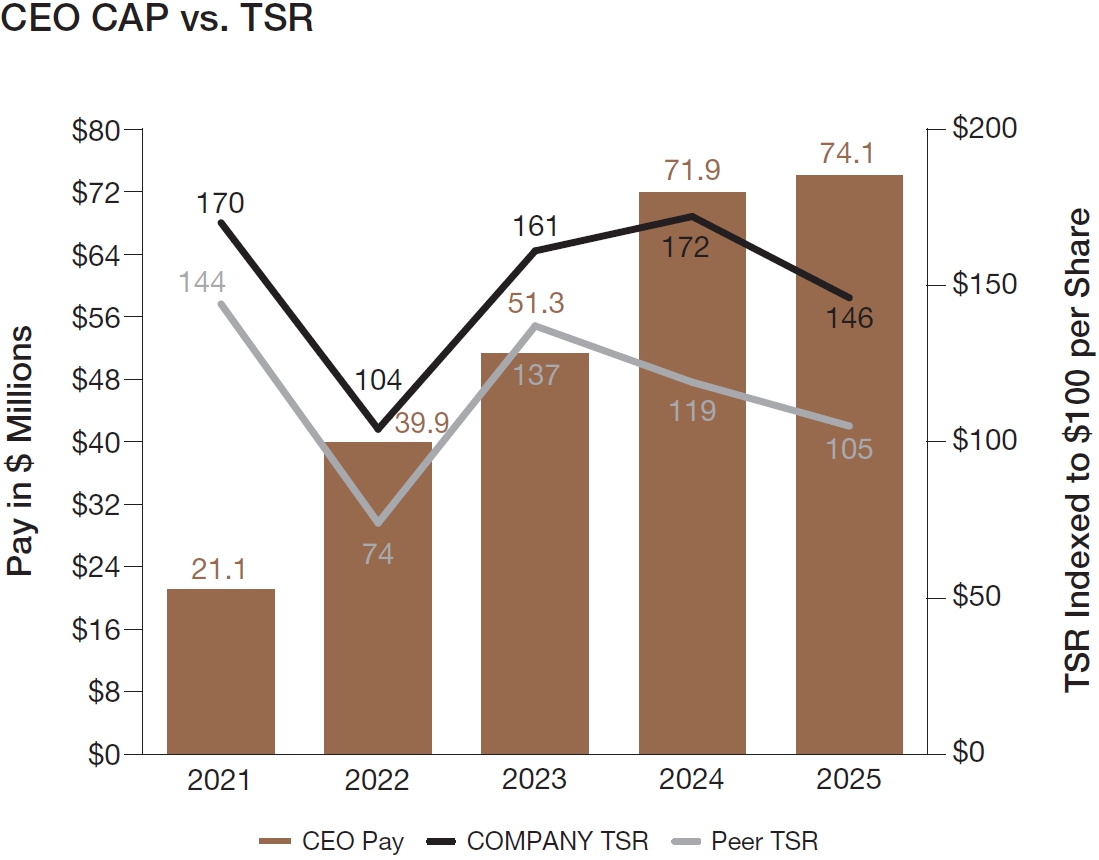
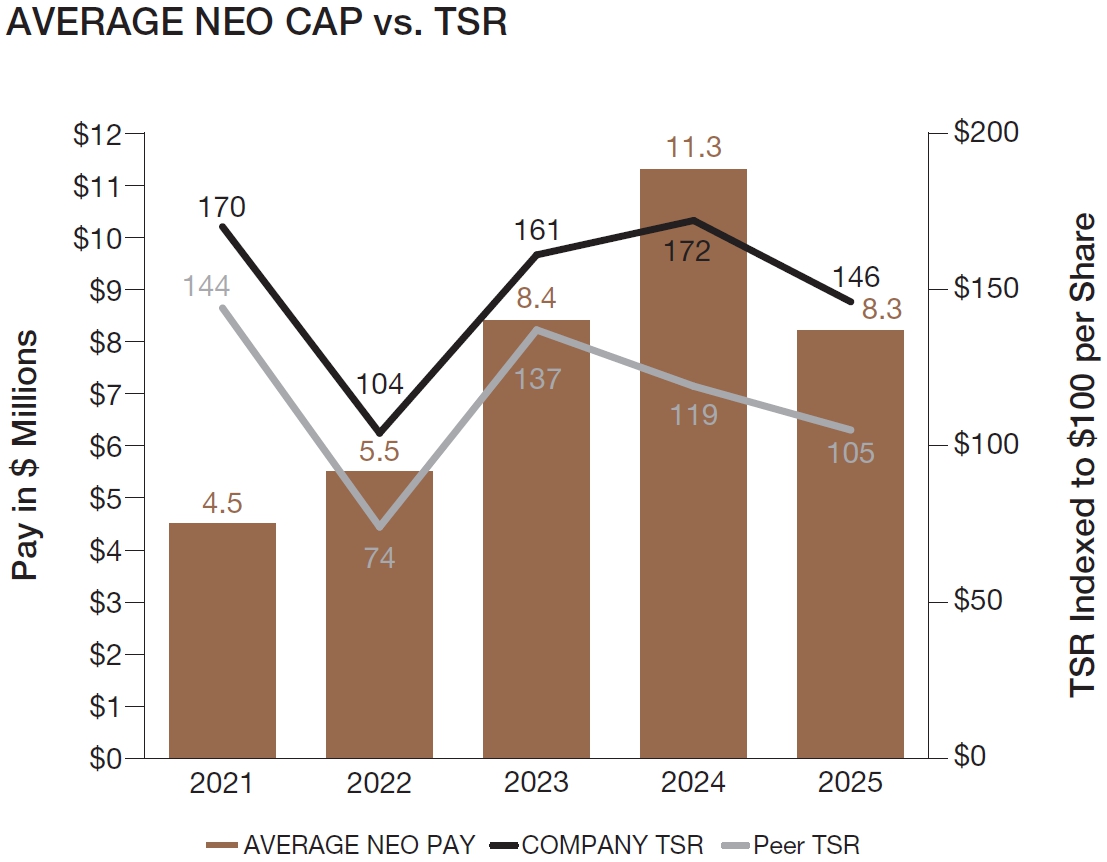
| Compensation Actually Paid vs. Total Shareholder Return |
|
|
|
|
|
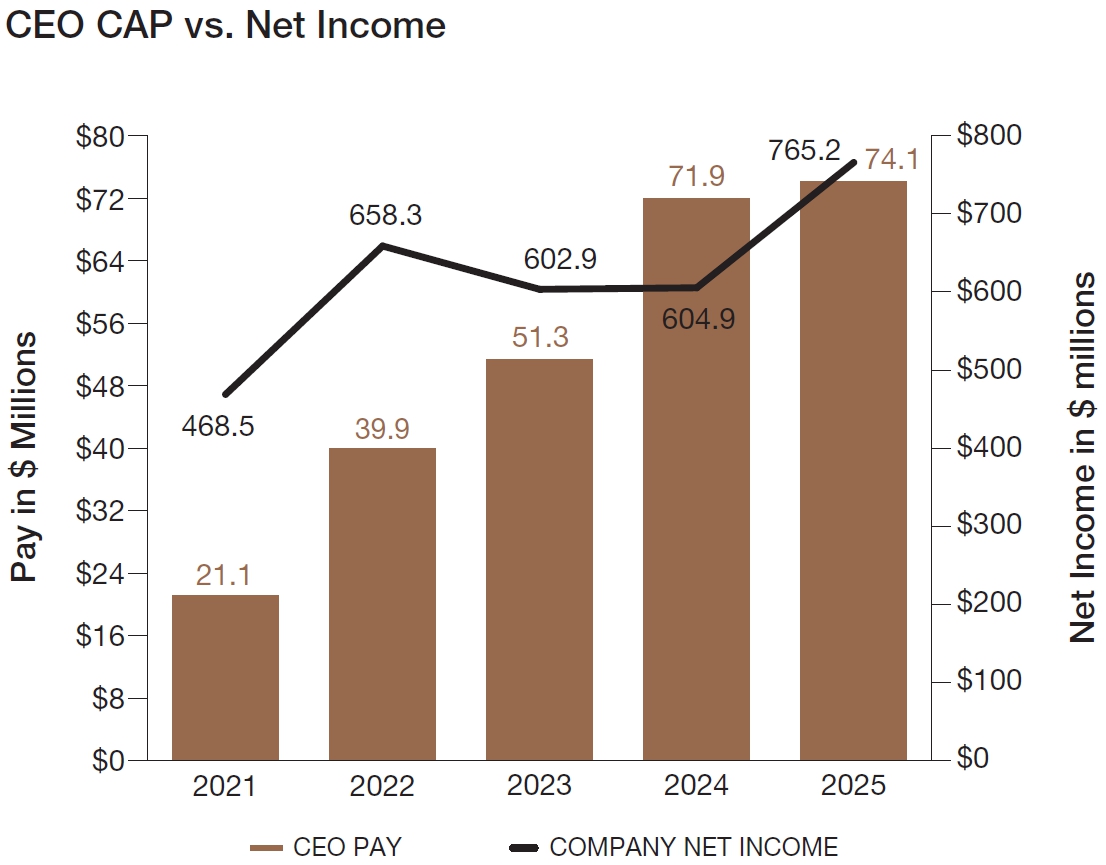
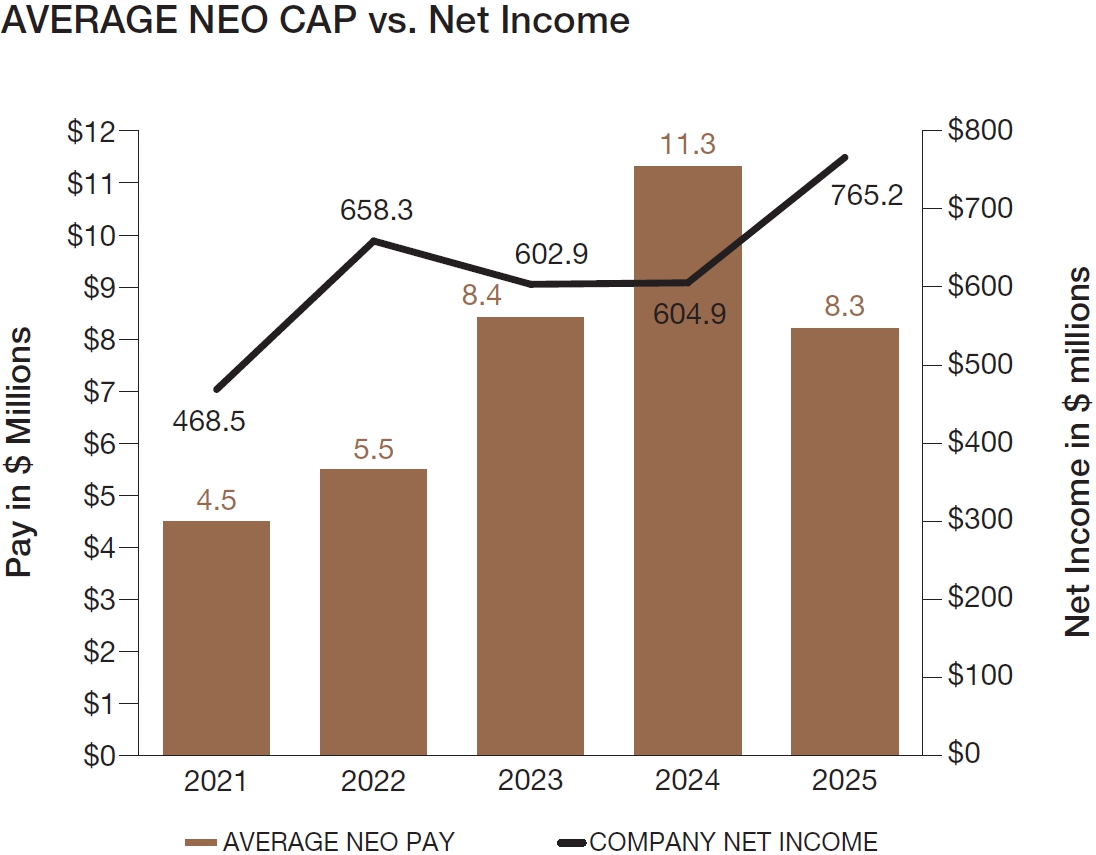
| Compensation Actually Paid vs. Net Income |
|
|
|
|
|
| Compensation Actually Paid vs. Company Selected Measure |
|
|
|
|
|
| Total Shareholder Return Amount |
$ 146
|
172
|
161
|
104
|
170
|
| Peer Group Total Shareholder Return Amount |
105
|
119
|
137
|
74
|
144
|
| Net Income (Loss) Attributable to Parent |
$ 765,191,000
|
$ 604,879,000
|
$ 602,897,000
|
$ 658,316,000
|
$ 468,520,000
|
| Company Selected Measure Amount |
958,542,000
|
770,389,000
|
756,053,000
|
877,149,000
|
655,845,000
|
| PEO Name |
Mr. Christopher
|
Mr. Christopher
|
Mr. Christopher
|
Mr. Christopher
|
Mr. Christopher
|
| Measure [Axis]: 1 |
|
|
|
|
|
| Pay vs Performance Disclosure [Table] |
|
|
|
|
|
| Non-GAAP Measure Description [Text Block] |
Column (i). The Company-selected measure
is operating income.
|
|
|
|
|
| PEO [Member] | Aggregate Grant Date Fair Value of Equity Award Amounts Reported in Summary Compensation Table [Member] |
|
|
|
|
|
| Pay vs Performance Disclosure [Table] |
|
|
|
|
|
| Adjustment to Compensation Amount |
$ (15,227,100)
|
$ (12,903,000)
|
$ (10,161,450)
|
$ (25,825,500)
|
$ (3,259,125)
|
| PEO [Member] | Year-end Fair Value of Equity Awards Granted in Covered Year that are Outstanding and Unvested [Member] |
|
|
|
|
|
| Pay vs Performance Disclosure [Table] |
|
|
|
|
|
| Adjustment to Compensation Amount |
21,311,100
|
16,079,000
|
12,866,850
|
23,595,500
|
4,425,375
|
| PEO [Member] | Year-over-Year Change in Fair Value of Equity Awards Granted in Prior Years That are Outstanding and Unvested [Member] |
|
|
|
|
|
| Pay vs Performance Disclosure [Table] |
|
|
|
|
|
| Adjustment to Compensation Amount |
37,733,000
|
36,818,739
|
25,375,159
|
6,564,886
|
8,483,199
|
| PEO [Member] | Change in Fair Value as of Vesting Date of Prior Year Equity Awards Vested in Covered Year [Member] |
|
|
|
|
|
| Pay vs Performance Disclosure [Table] |
|
|
|
|
|
| Adjustment to Compensation Amount |
2,763,600
|
9,160,644
|
3,732,547
|
592,052
|
582,325
|
| PEO [Member] | Prior Year End Fair Value of Equity Awards Granted in Any Prior Year that Fail to Meet Applicable Vesting Conditions During Covered Year [Member] |
|
|
|
|
|
| Pay vs Performance Disclosure [Table] |
|
|
|
|
|
| Adjustment to Compensation Amount |
0
|
0
|
0
|
0
|
0
|
| PEO [Member] | Aggregate Change in Present Value of Accumulated Benefit for All Pension Plans Reported in Summary Compensation Table [Member] |
|
|
|
|
|
| Pay vs Performance Disclosure [Table] |
|
|
|
|
|
| Adjustment to Compensation Amount |
0
|
0
|
0
|
0
|
0
|
| PEO [Member] | Aggregate Pension Adjustments Service Cost [Member] |
|
|
|
|
|
| Pay vs Performance Disclosure [Table] |
|
|
|
|
|
| Adjustment to Compensation Amount |
0
|
0
|
0
|
0
|
0
|
| Non-PEO NEO [Member] | Aggregate Grant Date Fair Value of Equity Award Amounts Reported in Summary Compensation Table [Member] |
|
|
|
|
|
| Pay vs Performance Disclosure [Table] |
|
|
|
|
|
| Adjustment to Compensation Amount |
(1,720,098)
|
(2,128,995)
|
(1,906,840)
|
(2,410,888)
|
(753,220)
|
| Non-PEO NEO [Member] | Year-end Fair Value of Equity Awards Granted in Covered Year that are Outstanding and Unvested [Member] |
|
|
|
|
|
| Pay vs Performance Disclosure [Table] |
|
|
|
|
|
| Adjustment to Compensation Amount |
2,407,365
|
2,653,035
|
2,414,520
|
2,109,505
|
1,022,753
|
| Non-PEO NEO [Member] | Year-over-Year Change in Fair Value of Equity Awards Granted in Prior Years That are Outstanding and Unvested [Member] |
|
|
|
|
|
| Pay vs Performance Disclosure [Table] |
|
|
|
|
|
| Adjustment to Compensation Amount |
3,254,633
|
4,549,633
|
3,362,068
|
1,481,643
|
1,511,873
|
| Non-PEO NEO [Member] | Change in Fair Value as of Vesting Date of Prior Year Equity Awards Vested in Covered Year [Member] |
|
|
|
|
|
| Pay vs Performance Disclosure [Table] |
|
|
|
|
|
| Adjustment to Compensation Amount |
707,350
|
1,872,705
|
699,995
|
76,385
|
219,049
|
| Non-PEO NEO [Member] | Prior Year End Fair Value of Equity Awards Granted in Any Prior Year that Fail to Meet Applicable Vesting Conditions During Covered Year [Member] |
|
|
|
|
|
| Pay vs Performance Disclosure [Table] |
|
|
|
|
|
| Adjustment to Compensation Amount |
0
|
0
|
0
|
0
|
0
|
| Non-PEO NEO [Member] | Aggregate Change in Present Value of Accumulated Benefit for All Pension Plans Reported in Summary Compensation Table [Member] |
|
|
|
|
|
| Pay vs Performance Disclosure [Table] |
|
|
|
|
|
| Adjustment to Compensation Amount |
0
|
0
|
0
|
0
|
0
|
| Non-PEO NEO [Member] | Aggregate Pension Adjustments Service Cost [Member] |
|
|
|
|
|
| Pay vs Performance Disclosure [Table] |
|
|
|
|
|
| Adjustment to Compensation Amount |
$ 0
|
$ 0
|
$ 0
|
$ 0
|
$ 0
|