Pay vs Performance Disclosure - USD ($)
|
12 Months Ended |
Dec. 31, 2025 |
Dec. 31, 2024 |
Dec. 31, 2023 |
Dec. 31, 2022 |
Dec. 31, 2021 |
| Pay vs Performance Disclosure |
|
|
|
|
|
| Pay vs Performance Disclosure, Table |
| | | | | | | | | | | | | | | | | | | | | | | | | | | | Year | Summary Compensation Table Total for CEO(1) | Compensation Actually Paid to CEO(2,3) | Average Summary Compensation Table Total for Non-CEO NEOs(4) | Average Compensation Actually Paid to Non-CEO NEOs(2,4,5) | Value of Initial Fixed $100 Investment Based On: | Net Income (Loss)
(in 000s) | Same-Property Hotel EBITDA per Key (in 000s)(8) | TSR(6) | Peer Group TSR(7) | | 2025 | $ | 6,589,254 | | $ | 4,766,701 | | $ | 3,038,141 | | $ | 2,211,025 | | $ | 61.03 | | $ | 126.82 | | $ | (62,230) | | $ | 31.7 | | | 2024 | $ | 7,377,014 | | $ | 4,825,691 | | $ | 3,364,217 | | $ | 2,189,874 | | $ | 72.78 | | $ | 124.03 | | $ | 16 | | $ | 31.1 | | 2023 | $ | 6,989,824 | | $ | 7,356,097 | | $ | 3,186,354 | | $ | 3,540,561 | | $ | 85.59 | | $ | 118.22 | | $ | (74,276) | | $ | 29.2 | | | 2022 | $ | 5,724,130 | | $ | (1,271,585) | | $ | 2,639,892 | | $ | (1,188,791) | | $ | 71.52 | | $ | 106.18 | | $ | (84,981) | | $ | 30.9 | | | 2021 | $ | 11,273,094 | | $ | 11,209,540 | | $ | 7,201,511 | | $ | 7,146,486 | | $ | 119.19 | | $ | 141.31 | | $ | (186,372) | | $ | 12.0 | |
|
|
|
|
|
| Company Selected Measure Name |
Same-Property Hotel EBITDA per Key
|
|
|
|
|
| Named Executive Officers, Footnote |
Amounts shown are the amounts of total compensation reported for our Chief Executive Officer, Mr. Bortz, who is our principal executive officer.Amounts shown are the averages of the amounts of total compensation reported for our Co-Presidents, Messrs. Martz and Fisher, who are our two non-CEO NEOs.
|
|
|
|
|
| Peer Group Issuers, Footnote |
In accordance with SEC rules, amounts in this column represent, as of December 31 of each year presented, the cumulative value of a $100 investment made on January 1, 2021 in the common equity of the FTSE Nareit All Equity REITs Index.
|
|
|
|
|
| PEO Total Compensation Amount |
$ 6,589,254
|
$ 7,377,014
|
$ 6,989,824
|
$ 5,724,130
|
$ 11,273,094
|
| PEO Actually Paid Compensation Amount |
$ 4,766,701
|
4,825,691
|
7,356,097
|
(1,271,585)
|
11,209,540
|
| Adjustment To PEO Compensation, Footnote |
The following table provides a reconciliation from Summary Compensation Table Total for CEO to Compensation Actually Paid to CEO, in which “Fair Value” means fair value calculated in accordance with FASB ASC 718, “SCT” means the Summary Compensation Table in this Proxy Statement, “FY” means “fiscal year,” and “FYE” means “fiscal year end.” | | | | | | | | | | | | | | | | | | | 2021 | 2022 | 2023 | 2024 | 2025 | | SCT Total for CEO | $ | 11,273,094 | | $ | 5,724,130 | | $ | 6,989,824 | | $ | 7,377,014 | | $ | 6,589,254 | | | Subtract amount reported under the “Share Awards” Column in the SCT | (8,672,101) | | (3,359,507) | | (4,016,336) | | (4,464,194) | | (3,592,193) | | | Subtract Fair Value (as of vesting date) of awards granted during FY that vested during such FY | — | | — | | — | | — | | — | | | Add Fair Value (as of FYE) of awards granted during FY that remained unvested as of FYE | 8,549,469 | | 1,569,650 | | 3,943,973 | | 2,898,735 | | 2,901,796 | | | Add (subtract) change in Fair Value from prior FYE to FYE for awards granted during prior FY that were outstanding and unvested as of FYE | 46,791 | | (5,218,488) | | 420,859 | | (1,003,823) | | (1,145,628) | | | Add (subtract) change in Fair Value from prior FYE to vesting date for awards granted during prior FY that vested during FY | — | | — | | — | | — | | — | | | Subtract Fair Value as of prior FYE of awards granted during prior FY that were forfeited during FY | — | | — | | — | | — | | — | | | Add dividends or other earnings paid on awards during FY prior to vesting date | 12,287 | | 12,630 | | 17,777 | | 17,959 | | 13,472 | | | Compensation Actually Paid to CEO | $ | 11,209,540 | | $ | (1,271,585) | | $ | 7,356,097 | | $ | 4,825,691 | | $ | 4,766,701 | |
|
|
|
|
|
| Non-PEO NEO Average Total Compensation Amount |
$ 3,038,141
|
3,364,217
|
3,186,354
|
2,639,892
|
7,201,511
|
| Non-PEO NEO Average Compensation Actually Paid Amount |
$ 2,211,025
|
2,189,874
|
3,540,561
|
(1,188,791)
|
7,146,486
|
| Adjustment to Non-PEO NEO Compensation Footnote |
The following table provides a reconciliation from Summary Compensation Table Total for Non-CEO NEOs to Compensation Actually Paid to Non-CEO NEOs, in which “Fair Value” means fair value calculated in accordance with FASB ASC 718, “SCT” means the Summary Compensation Table in this Proxy Statement, “FY” means “fiscal year,” and “FYE” means “fiscal year end.” | | | | | | | | | | | | | | | | | | | 2021 | 2022 | 2023 | 2024 | 2025 | | Average SCT Total for Non-CEO NEOs | $ | 7,201,511 | | $ | 2,639,892 | | $ | 3,186,354 | | $ | 3,364,217 | | $ | 3,038,141 | | | Subtract amount reported under the “Share Awards” Column in the SCT | (5,905,682) | | (1,439,792) | | (1,703,360) | | (1,893,234) | | (1,518,818) | | | Subtract Fair Value (as of vesting date) of awards granted during FY that vested during such FY | — | | — | | — | | — | | — | | | Add Fair Value (as of FYE) of awards granted during FY that remained unvested as of FYE | 5,822,259 | | 672,709 | | 1,672,671 | | 1,229,335 | | 1,226,910 | | | Add (subtract) change in Fair Value from prior FYE to FYE for awards granted during prior FY that were outstanding and unvested as of FYE | 19,217 | | (3,070,946) | | 374,615 | | (519,847) | | (541,829) | | | Add (subtract) change in Fair Value from prior FYE to vesting date for awards granted during prior FY that vested during FY | — | | — | | — | | — | | — | | | Subtract Fair Value as of prior FYE of awards granted during prior FY that were forfeited during FY | — | | — | | — | | — | | — | | | Add dividends or other earnings paid on awards during FY prior to vesting date | 9,181 | | 9,346 | | 10,281 | | 9,403 | | 6,621 | | | Average Compensation Actually Paid to Non-CEO NEOs | $ | 7,146,486 | | $ | (1,188,791) | | $ | 3,540,561 | | $ | 2,189,874 | | $ | 2,211,025 | |
|
|
|
|
|
| Compensation Actually Paid vs. Total Shareholder Return |
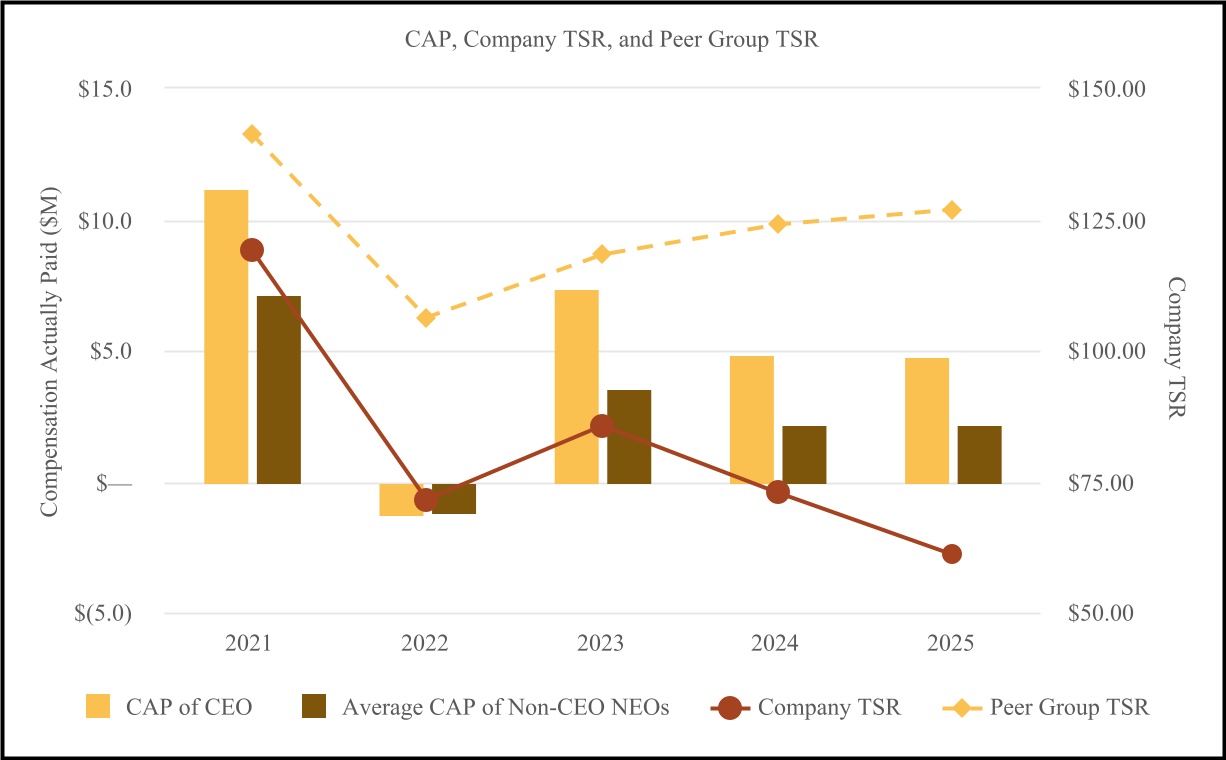
The following chart illustrates the compensation actually paid (as computed in accordance with SEC rules, the “CAP”) of our CEO, the average CAP of the two other NEOs, and the values of $100 investments made in Common Shares and the Nareit Equity REITs Index on January 1, 2021 as of December 31, 2021, 2022, 2023, 2024, and 2025 (as computed in accordance with SEC rules, “Company TSR,” and “Peer Group TSR,” respectively).
|
|
|
|
|
| Compensation Actually Paid vs. Net Income |
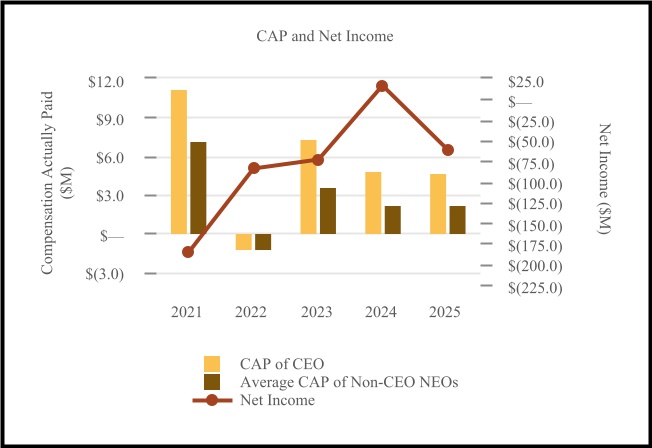
In contrast, as the following two charts show, there has been almost no correlation between our NEOs’ CAPs and either Net Income or Same-Property Hotel EBITDA per Key. In our compensation program for each of the years presented, we did not use Net Income to determine any portion of our NEOs’ compensation, and we used Same-Property Hotel EBITDA per Key only for the cash incentive bonus, to which it contributed a weighted-average 1.7% of our NEOs’ target total compensation for 2021, 2022, 2023, 2024, and 2025.
|
|
|
|
|
| Compensation Actually Paid vs. Company Selected Measure |
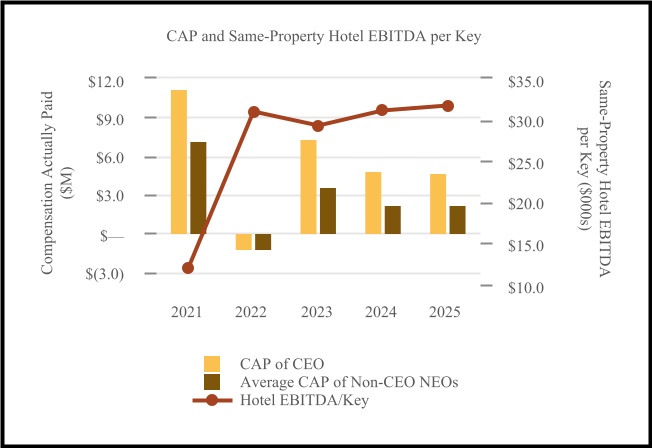
In contrast, as the following two charts show, there has been almost no correlation between our NEOs’ CAPs and either Net Income or Same-Property Hotel EBITDA per Key. In our compensation program for each of the years presented, we did not use Net Income to determine any portion of our NEOs’ compensation, and we used Same-Property Hotel EBITDA per Key only for the cash incentive bonus, to which it contributed a weighted-average 1.7% of our NEOs’ target total compensation for 2021, 2022, 2023, 2024, and 2025.
|
|
|
|
|
| Total Shareholder Return Vs Peer Group |
The following chart illustrates the compensation actually paid (as computed in accordance with SEC rules, the “CAP”) of our CEO, the average CAP of the two other NEOs, and the values of $100 investments made in Common Shares and the Nareit Equity REITs Index on January 1, 2021 as of December 31, 2021, 2022, 2023, 2024, and 2025 (as computed in accordance with SEC rules, “Company TSR,” and “Peer Group TSR,” respectively).
|
|
|
|
|
| Tabular List, Table |
The following table sets forth the most important financial measures used to link executive compensation and company performance for our executive compensation program for 2025, which is our most recently completed fiscal year. | | | | | | | Most Important Financial Performance Measures | | Company TSR | | Company TSR relative to TSRs of the TSR Peer Group | | Same-Property Hotel EBITDA per Key Growth vs. Peers’ | | Gross Proceeds from Dispositions | | Portfolio RevPAR Penetration Index Improvement | | Adjusted FFO per Share |
|
|
|
|
|
| Total Shareholder Return Amount |
$ 61.03
|
72.78
|
85.59
|
71.52
|
119.19
|
| Peer Group Total Shareholder Return Amount |
126.82
|
124.03
|
118.22
|
106.18
|
141.31
|
| Net Income (Loss), Including Portion Attributable to Noncontrolling Interest |
$ (62,230,000)
|
$ 16,000
|
$ (74,276,000)
|
$ (84,981,000)
|
$ (186,372,000)
|
| Company Selected Measure Amount |
31,700
|
31,100
|
29,200
|
30,900
|
12,000.0
|
| PEO Name |
Mr. Bortz
|
|
|
|
|
| Additional 402(v) Disclosure |
The amounts shown represent the amount of “compensation actually paid,” as computed in accordance with SEC rules. Negative amounts in this column do not represent money that our executive officers paid back to the Company.In accordance with SEC rules, amounts in this column represent, as of December 31 of each year presented, the cumulative value of a $100 investment made on January 1, 2021 in Common Shares.
|
|
|
|
|
| Measure:: 1 |
|
|
|
|
|
| Pay vs Performance Disclosure |
|
|
|
|
|
| Name |
Same-Property Hotel EBITDA per Key Growth vs. Peers’
|
|
|
|
|
| Non-GAAP Measure Description |
We have presented Same-Property Hotel EBITDA per Key because it is the only financial measure among the performance metrics used for determining compensation actually paid to our NEOs for 2021, 2022, 2023, 2024, and 2025. Same-Property Hotel EBITDA per Key, which is a non-GAAP financial measure, is calculated by dividing (a) the total net income generated by our hotel properties for the period excluding interest expense, income taxes, depreciation, amortization, corporate-level costs and expenses, and other non-recurring expenses of those hotel properties for the period by (b) the total number of guest rooms of those hotel properties for the period. We believe that Same-Property Hotel EBITDA per Key is a useful financial measure for evaluating the core operating performance of our hotels and resorts.
|
|
|
|
|
| Measure:: 2 |
|
|
|
|
|
| Pay vs Performance Disclosure |
|
|
|
|
|
| Name |
Company TSR
|
|
|
|
|
| Measure:: 3 |
|
|
|
|
|
| Pay vs Performance Disclosure |
|
|
|
|
|
| Name |
Company TSR relative to TSRs of the TSR Peer Group
|
|
|
|
|
| Measure:: 4 |
|
|
|
|
|
| Pay vs Performance Disclosure |
|
|
|
|
|
| Name |
Gross Proceeds from Dispositions
|
|
|
|
|
| Measure:: 5 |
|
|
|
|
|
| Pay vs Performance Disclosure |
|
|
|
|
|
| Name |
Portfolio RevPAR Penetration Index Improvement
|
|
|
|
|
| Measure:: 6 |
|
|
|
|
|
| Pay vs Performance Disclosure |
|
|
|
|
|
| Name |
Adjusted FFO per Share
|
|
|
|
|
| PEO | Aggregate Grant Date Fair Value of Equity Award Amounts Reported in Summary Compensation Table |
|
|
|
|
|
| Pay vs Performance Disclosure |
|
|
|
|
|
| Adjustment to Compensation, Amount |
$ (3,592,193)
|
$ (4,464,194)
|
$ (4,016,336)
|
$ (3,359,507)
|
$ (8,672,101)
|
| PEO | Year-end Fair Value of Equity Awards Granted in Covered Year that are Outstanding and Unvested |
|
|
|
|
|
| Pay vs Performance Disclosure |
|
|
|
|
|
| Adjustment to Compensation, Amount |
2,901,796
|
2,898,735
|
3,943,973
|
1,569,650
|
8,549,469
|
| PEO | Year-over-Year Change in Fair Value of Equity Awards Granted in Prior Years That are Outstanding and Unvested |
|
|
|
|
|
| Pay vs Performance Disclosure |
|
|
|
|
|
| Adjustment to Compensation, Amount |
(1,145,628)
|
(1,003,823)
|
420,859
|
(5,218,488)
|
46,791
|
| PEO | Vesting Date Fair Value of Equity Awards Granted and Vested in Covered Year |
|
|
|
|
|
| Pay vs Performance Disclosure |
|
|
|
|
|
| Adjustment to Compensation, Amount |
0
|
0
|
0
|
0
|
0
|
| PEO | Change in Fair Value as of Vesting Date of Prior Year Equity Awards Vested in Covered Year |
|
|
|
|
|
| Pay vs Performance Disclosure |
|
|
|
|
|
| Adjustment to Compensation, Amount |
0
|
0
|
0
|
0
|
0
|
| PEO | Prior Year End Fair Value of Equity Awards Granted in Any Prior Year that Fail to Meet Applicable Vesting Conditions During Covered Year |
|
|
|
|
|
| Pay vs Performance Disclosure |
|
|
|
|
|
| Adjustment to Compensation, Amount |
0
|
0
|
0
|
0
|
0
|
| PEO | Dividends or Other Earnings Paid on Equity Awards not Otherwise Reflected in Total Compensation for Covered Year |
|
|
|
|
|
| Pay vs Performance Disclosure |
|
|
|
|
|
| Adjustment to Compensation, Amount |
13,472
|
17,959
|
17,777
|
12,630
|
12,287
|
| Non-PEO NEO | Aggregate Grant Date Fair Value of Equity Award Amounts Reported in Summary Compensation Table |
|
|
|
|
|
| Pay vs Performance Disclosure |
|
|
|
|
|
| Adjustment to Compensation, Amount |
(1,518,818)
|
(1,893,234)
|
(1,703,360)
|
(1,439,792)
|
(5,905,682)
|
| Non-PEO NEO | Year-end Fair Value of Equity Awards Granted in Covered Year that are Outstanding and Unvested |
|
|
|
|
|
| Pay vs Performance Disclosure |
|
|
|
|
|
| Adjustment to Compensation, Amount |
1,226,910
|
1,229,335
|
1,672,671
|
672,709
|
5,822,259
|
| Non-PEO NEO | Year-over-Year Change in Fair Value of Equity Awards Granted in Prior Years That are Outstanding and Unvested |
|
|
|
|
|
| Pay vs Performance Disclosure |
|
|
|
|
|
| Adjustment to Compensation, Amount |
(541,829)
|
(519,847)
|
374,615
|
(3,070,946)
|
19,217
|
| Non-PEO NEO | Vesting Date Fair Value of Equity Awards Granted and Vested in Covered Year |
|
|
|
|
|
| Pay vs Performance Disclosure |
|
|
|
|
|
| Adjustment to Compensation, Amount |
0
|
0
|
0
|
0
|
0
|
| Non-PEO NEO | Change in Fair Value as of Vesting Date of Prior Year Equity Awards Vested in Covered Year |
|
|
|
|
|
| Pay vs Performance Disclosure |
|
|
|
|
|
| Adjustment to Compensation, Amount |
0
|
0
|
0
|
0
|
0
|
| Non-PEO NEO | Prior Year End Fair Value of Equity Awards Granted in Any Prior Year that Fail to Meet Applicable Vesting Conditions During Covered Year |
|
|
|
|
|
| Pay vs Performance Disclosure |
|
|
|
|
|
| Adjustment to Compensation, Amount |
0
|
0
|
0
|
0
|
0
|
| Non-PEO NEO | Dividends or Other Earnings Paid on Equity Awards not Otherwise Reflected in Total Compensation for Covered Year |
|
|
|
|
|
| Pay vs Performance Disclosure |
|
|
|
|
|
| Adjustment to Compensation, Amount |
$ 6,621
|
$ 9,403
|
$ 10,281
|
$ 9,346
|
$ 9,181
|